 Open Access Article
Forced topochemistry of a solid-state Diels–Alder reaction by encapsulation in epoxy glue†
T. A.
Lau
 ,
S.
Khorasani
 and
M. A.
Fernandes
 *
*
Molecular Sciences Institute, School of Chemistry, University of the Witwatersrand, PO Wits 2050, Johannesburg, South Africa. E-mail: Manuel.Fernandes@wits.ac.za; Fax: +27 11 7176749; Tel: +27 11 7176723
First published on 24th May 2023
Abstract
We report on the solid-state Diels–Alder thermal reaction in a 1![[thin space (1/6-em)]](https://www.rsc.org/images/entities/char_2009.gif) :
:![[thin space (1/6-em)]](https://www.rsc.org/images/entities/char_2009.gif) 1 charge-transfer (CT) crystal composed of bis(N-cyclobutylimino)-1,4-dithiin (the electron acceptor) and 9-bromoanthracene (the electron donor) which crystallized in the triclinic space group, P
1 charge-transfer (CT) crystal composed of bis(N-cyclobutylimino)-1,4-dithiin (the electron acceptor) and 9-bromoanthracene (the electron donor) which crystallized in the triclinic space group, P![[1 with combining macron]](https://www.rsc.org/images/entities/char_0031_0304.gif) . The donor (D) and acceptor (A) molecules arrange in stacks where these molecules alternate, where a full 9-bromoanthracene donor molecule is surrounded by a symmetrically different acceptor molecule on the two molecular faces. The distance between the reacting atoms on the donor and the two acceptor molecules are slightly different but still within Schmidt's criteria, resulting in two reaction sites with different reaction environments, assigned as regions P and Q. Molecules in region P are more favourably aligned with the distances between reacting atoms being 3.51 Å and almost parallel as the molecules overlap each other. In region Q, the distances are 3.56 and 3.86 Å because the molecular overlap is more skewed, and the reacting atoms are rotated −15° from each other. Initially, the reaction occurs only in region P until ∼20% conversion is reached. Afterward, product Q is concurrently formed but at a slower rate. After ∼75% reaction, the crystal transforms from triclinic P
. The donor (D) and acceptor (A) molecules arrange in stacks where these molecules alternate, where a full 9-bromoanthracene donor molecule is surrounded by a symmetrically different acceptor molecule on the two molecular faces. The distance between the reacting atoms on the donor and the two acceptor molecules are slightly different but still within Schmidt's criteria, resulting in two reaction sites with different reaction environments, assigned as regions P and Q. Molecules in region P are more favourably aligned with the distances between reacting atoms being 3.51 Å and almost parallel as the molecules overlap each other. In region Q, the distances are 3.56 and 3.86 Å because the molecular overlap is more skewed, and the reacting atoms are rotated −15° from each other. Initially, the reaction occurs only in region P until ∼20% conversion is reached. Afterward, product Q is concurrently formed but at a slower rate. After ∼75% reaction, the crystal transforms from triclinic P![[1 with combining macron]](https://www.rsc.org/images/entities/char_0031_0304.gif) into monoclinic C2/c, and conversion of ∼89% was found before the single crystal decomposes to become a powder. Reactions in free (unencapsulated) crystals above 10 °C were found to break apart during the initial reaction at around ∼20% when molecules in region P were reacting. Encapsulation of unreacted crystals with epoxy glue led to more reaction details being exposed and forced the reaction to occur topochemically until ∼89% conversion.
into monoclinic C2/c, and conversion of ∼89% was found before the single crystal decomposes to become a powder. Reactions in free (unencapsulated) crystals above 10 °C were found to break apart during the initial reaction at around ∼20% when molecules in region P were reacting. Encapsulation of unreacted crystals with epoxy glue led to more reaction details being exposed and forced the reaction to occur topochemically until ∼89% conversion.
Introduction
Solid-state chemistry encompasses a vast array of reactions consisting of inorganic and organic materials.1–6 Several studies suggest that solid-state reactions have been known to give higher yields of regio- and stereo-selective products than traditional solvent-based reactions, as well as using less solvents to make greener reactions.7–12 Organic solid-state reactions can occur within single crystals and these can have many applications and consequences in various industries, such as in pharmaceuticals,13–15 electronics,16–18 and optics.19–21 Single crystals that have undergone reactions in the solid state have been shown to occur under different conditions such as light,7,22 heat23–25 or pressure,26–30 giving way to a variety of reactions with crystal products showing physical properties ranging from the formation of porous molecules31–33 to mechanical effects.34–36 These reactions fall in the domain of supramolecular chemistry, as intermolecular bonds between discrete molecules can lead to favourable conditions under which reactions can occur.2 Topochemistry was first described by Kohlschütter as reactions that can occur in the solid state where the 3D nature of the crystal influences the structures and supramolecular arrangement of molecules in a crystal system, affecting the mechanism of the reaction.7,9 To determine whether a topochemical reaction can occur in a crystal, Schmidt and coworkers' extensive work on [2 + 2] photodimerizations led to a topochemical criterion for solid-state reactions, where the reacting atoms need to be parallel to each other and within the distance of 3.5–4.2 Å.37,38 Additionally, topochemical reactions occur best under minimal atomic movement, where the crystal integrity can be maintained. This is especially important when considering the reaction cavity of the reacting molecules, as the environment for which a reaction can occur in the solid-state is constrained by neighbouring molecules, influencing the product that can be formed.39 The viability of a solid-state reaction in a crystal can be affected by adjacent molecules as they may hinder possible chemical products forming, even if Schmidt's criterion is met. An example of this is seen in work done by Botes et al., where the cycloadduct product from the solid-state reaction of bis(N-benzylimino)-1,4-dithiin and various anthracene molecules could not be formed due to the reaction cavity not being flexible enough to allow for the movement of the reacting molecules, even while they meet Schmidt's criterion.40 Reactions that proceed in a SCSC fashion occurs when the reactant crystal starts as a single crystal and ends with the product remaining as a single crystal whilst maintaining its shape and transparency.41 This type of reaction is said to occur under topochemical control, where an SCSC reaction will start and continue in an SCSC manner until it is complete. However, if the final product crystal loses integrity during the reaction, it is said to be topotactic. In this case, the final product does not form a single crystal but shows an orientational relationship to the starting crystal.42,43 Additionally, a SCSC product can form without sharing any crystallographic axes with the reactant crystal.44In a previous paper,23 we published the solid-state reaction of the charge transfer (CT) crystal of bis(N-cyclobutylimino)-1,4-dithiin (A, the charge acceptor molecule) and 9-bromoanthracene (D, the charge donor molecule) which formed dark red plate-like crystals in the space group P![[1 with combining macron]](https://www.rsc.org/images/entities/char_0031_0304.gif) (Scheme 1). The molecules arrange as stacks in a 2
(Scheme 1). The molecules arrange as stacks in a 2![[thin space (1/6-em)]](https://www.rsc.org/images/entities/char_2009.gif) :
:![[thin space (1/6-em)]](https://www.rsc.org/images/entities/char_2009.gif) 1 D to A ratio for a ⋯{D⋯A⋯D}⋯{D⋯A⋯D}⋯{D⋯A⋯D}⋯ arrangement (Fig. 1). In terms of a thermal Diels–Alder reaction, a D molecule can only react with an A molecule to form a cycloadduct product (P). As such, the 2
1 D to A ratio for a ⋯{D⋯A⋯D}⋯{D⋯A⋯D}⋯{D⋯A⋯D}⋯ arrangement (Fig. 1). In terms of a thermal Diels–Alder reaction, a D molecule can only react with an A molecule to form a cycloadduct product (P). As such, the 2![[thin space (1/6-em)]](https://www.rsc.org/images/entities/char_2009.gif) :
:![[thin space (1/6-em)]](https://www.rsc.org/images/entities/char_2009.gif) 1 D to A packing arrangement affects the solid-state reaction because an A molecule can react with the D molecule to the left or the right of it (or above and below it in Fig. 1) forming a cycloadduct product (P). A D molecule can only react with one A molecule because the neighbouring molecule in the stack is another D molecule which means that the molecules are constrained to a reaction site which we defined as a ⋯{D⋯A⋯D}⋯ unit. The A molecule can react with the D molecule to the left forming a product leading to this arrangement ⋯{P⋯D}⋯, or to the right of it leading to this arrangement ⋯{D⋯P}⋯. If cooperativity plays a role in the reaction, we can either have a sequence of products and unreacted D of ⋯{D⋯P}⋯{D⋯P}⋯{D⋯P}⋯ or ⋯D}⋯{D⋯P}⋯{P⋯D}⋯{D⋯ where the brackets represent the boundary of the DAD unit in the unreacted crystal (Fig. 1). If the reaction was random, we would not be able to find a sequence. However, our results indicated that the reaction was cooperative and led to a ⋯D}⋯{D⋯P}⋯{P⋯D}⋯{D⋯ arrangement. The reaction of the 2
1 D to A packing arrangement affects the solid-state reaction because an A molecule can react with the D molecule to the left or the right of it (or above and below it in Fig. 1) forming a cycloadduct product (P). A D molecule can only react with one A molecule because the neighbouring molecule in the stack is another D molecule which means that the molecules are constrained to a reaction site which we defined as a ⋯{D⋯A⋯D}⋯ unit. The A molecule can react with the D molecule to the left forming a product leading to this arrangement ⋯{P⋯D}⋯, or to the right of it leading to this arrangement ⋯{D⋯P}⋯. If cooperativity plays a role in the reaction, we can either have a sequence of products and unreacted D of ⋯{D⋯P}⋯{D⋯P}⋯{D⋯P}⋯ or ⋯D}⋯{D⋯P}⋯{P⋯D}⋯{D⋯ where the brackets represent the boundary of the DAD unit in the unreacted crystal (Fig. 1). If the reaction was random, we would not be able to find a sequence. However, our results indicated that the reaction was cooperative and led to a ⋯D}⋯{D⋯P}⋯{P⋯D}⋯{D⋯ arrangement. The reaction of the 2![[thin space (1/6-em)]](https://www.rsc.org/images/entities/char_2009.gif) :
:![[thin space (1/6-em)]](https://www.rsc.org/images/entities/char_2009.gif) 1 CT underwent the solid-state Diels–Alder reaction through a topochemical SCSC mechanism, where the reaction cavity stayed relatively constant throughout the reaction and reached a 100% conversion with minimal crystal degradation.
1 CT underwent the solid-state Diels–Alder reaction through a topochemical SCSC mechanism, where the reaction cavity stayed relatively constant throughout the reaction and reached a 100% conversion with minimal crystal degradation.
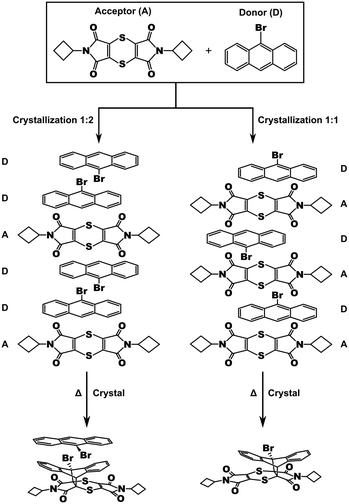 | ||
Scheme 1 Crystallization of bis(N-cyclobutylimino)-1,4-dithiin (A) and 9-bromoanthracene (D) leads to 1![[thin space (1/6-em)]](https://www.rsc.org/images/entities/char_2009.gif) : :![[thin space (1/6-em)]](https://www.rsc.org/images/entities/char_2009.gif) 2 A to D crystals (left),23 and 1 2 A to D crystals (left),23 and 1![[thin space (1/6-em)]](https://www.rsc.org/images/entities/char_2009.gif) : :![[thin space (1/6-em)]](https://www.rsc.org/images/entities/char_2009.gif) 1 A to D crystals (right, this work). 1 A to D crystals (right, this work). | ||
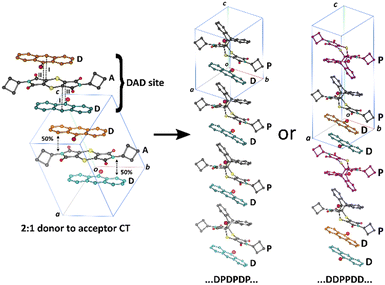 | ||
Fig. 1 Solid-state reaction in a 2![[thin space (1/6-em)]](https://www.rsc.org/images/entities/char_2009.gif) : :![[thin space (1/6-em)]](https://www.rsc.org/images/entities/char_2009.gif) 1 D to A CT co-crystal leading to two possible arrangements of product to donor arrangements if the reaction is cooperative. We found that SCSC reaction leads to the ⋯D⋯D⋯P⋯P⋯ arrangement shown on the right.23 1 D to A CT co-crystal leading to two possible arrangements of product to donor arrangements if the reaction is cooperative. We found that SCSC reaction leads to the ⋯D⋯D⋯P⋯P⋯ arrangement shown on the right.23 | ||
During the previous study, we also found another CT co-crystal that crystallized in a 1![[thin space (1/6-em)]](https://www.rsc.org/images/entities/char_2009.gif) :
:![[thin space (1/6-em)]](https://www.rsc.org/images/entities/char_2009.gif) 1 D to A forming a ⋯D⋯A⋯D⋯A⋯D⋯ arrangement within a brown needle-like crystal habit. Unlike the 2
1 D to A forming a ⋯D⋯A⋯D⋯A⋯D⋯ arrangement within a brown needle-like crystal habit. Unlike the 2![[thin space (1/6-em)]](https://www.rsc.org/images/entities/char_2009.gif) :
:![[thin space (1/6-em)]](https://www.rsc.org/images/entities/char_2009.gif) 1 CT, the solid-state reaction in the 1
1 CT, the solid-state reaction in the 1![[thin space (1/6-em)]](https://www.rsc.org/images/entities/char_2009.gif) :
:![[thin space (1/6-em)]](https://www.rsc.org/images/entities/char_2009.gif) 1 CT leads to crystal fragmentation which happens around 20% conversion and therefore doesn't occur as an SCSC reaction without intervention. In this paper, we report on the solid-state reaction of this crystal.
1 CT leads to crystal fragmentation which happens around 20% conversion and therefore doesn't occur as an SCSC reaction without intervention. In this paper, we report on the solid-state reaction of this crystal.
Materials and methods
Materials
Pure reagents were purchased from Sigma Aldrich and used as received. Solvents used in syntheses and recrystallization were purchased from Merck SA.Synthesis
Bis(N-cyclobutylimino)-1,4-dithiin was synthesized similarly to a previously reported procedure.23Crystallization and solid-state reaction
CT co-crystals were formed via vapour diffusion by dissolving a 1![[thin space (1/6-em)]](https://www.rsc.org/images/entities/char_2009.gif) :
:![[thin space (1/6-em)]](https://www.rsc.org/images/entities/char_2009.gif) 1 ratio of bis(N-cyclobutylimino)-1,4-dithiin (10 mg, 28 μmol) and 9-bromoanthracene (7 mg, 28 μmol) separately in 1 mL dichloromethane. Upon addition of 9-bromoanthracene (D) into the bis(N-cyclobutylimino)-1,4-dithiin (A) vial, a change in colour occurred indicating CT formation. Vapour diffusion into hexane at 10 °C led the formation of brown needle shaped 1
1 ratio of bis(N-cyclobutylimino)-1,4-dithiin (10 mg, 28 μmol) and 9-bromoanthracene (7 mg, 28 μmol) separately in 1 mL dichloromethane. Upon addition of 9-bromoanthracene (D) into the bis(N-cyclobutylimino)-1,4-dithiin (A) vial, a change in colour occurred indicating CT formation. Vapour diffusion into hexane at 10 °C led the formation of brown needle shaped 1![[thin space (1/6-em)]](https://www.rsc.org/images/entities/char_2009.gif) :
:![[thin space (1/6-em)]](https://www.rsc.org/images/entities/char_2009.gif) 1 D to A co-crystals. The co-crystals were reacted in a large capped test tube at either 20 °C (room temperature), or 40 °C using a water bath over various times and subsequently analyzed with SCXRD. Sunlight was avoided by locating the bath in a dark room. Initially, crystals were reacted unconstrained. These only remained intact until ∼20% conversion. Later crystals were encapsulated with epoxy glue and were stable until ∼89% conversion. When not reacted or measured by SCXRD, the crystals were stored in a freezer at −20 °C to inhibit the reaction.
1 D to A co-crystals. The co-crystals were reacted in a large capped test tube at either 20 °C (room temperature), or 40 °C using a water bath over various times and subsequently analyzed with SCXRD. Sunlight was avoided by locating the bath in a dark room. Initially, crystals were reacted unconstrained. These only remained intact until ∼20% conversion. Later crystals were encapsulated with epoxy glue and were stable until ∼89% conversion. When not reacted or measured by SCXRD, the crystals were stored in a freezer at −20 °C to inhibit the reaction.
Crystal structure solution and refinement
Intensity data were collected at −100.2 °C on either a Bruker Apex II CCD with graphite monochromated Mo Kα radiation (50 kV, 30 mA), or a Bruker D8 Venture Bio PHOTON III diffractometer with a Mo Kα IμS DIAMOND source (50 kV, 1.4 mA) or Cu Kα IμS DIAMOND source (50 kV, 1.2 mA). The collection methods involved ω and ϕ scans of width 0.5–1.5° with 1024 × 1024 (CCD) or 1536 × 1025 (PHOTON III) bit data frames. Crystal structures were solved by intrinsic phasing using SHELXT. Non-hydrogen atoms were first refined isotropically followed by anisotropic refinement by full-matrix least square calculations based on F2. SHELXL-2018 restraints such as SIMU, RIGU, SADI, and SAME were used during the refinements as required. Software used to obtain the structures were as follows: data collection: APEX245 and APEX4;45 cell refinement and data reduction: SAINT;46 empirical absorption corrections and scaling of data: SADABS;45 space group determinations: XPREP;45 programs used to solve and refine structures: SHELXT47 and SHELXL-2018;48 molecular graphics: OLEX2,49SCHAKAL-99,50 and CrystalExplorer-21.5;51,52 software used to prepare material for publication: OLEX2 and PLATON.53Crystallographic information for all structures can be found in Tables S1 and S2 in the ESI.† Crystallographic information for the CT crystals before, and at various stages of conversion, and for the recrystallized product can be found in Table 1. ORTEP diagrams for the CT asymmetric unit before reaction, after 60% conversion in triclinic, and after a phase change to the monoclinic form are shown in Fig. 3. The 9-bromoanthracene molecule is disordered with the major orientation having ∼97% bromine occupancy and ∼3% in 180° rotation minor orientation (not shown in Fig. 3). The reaction of minor conformation is undetectable, and probably only occurs when the crystal transforms from triclinic to monoclinic as mentioned later.
| Crystal | Free CT crystal | Glue encapsulated CT crystals | Glue encapsulated 12d 9 h reacted at 20 °C | Glue encapsulated 103d 4 h reacted at 20 °C | Glue encapsulated 133d 5 h reacted at 20 °C | Recrystallized product |
|---|---|---|---|---|---|---|
| Reaction time/days | 0 | 0 | 12 | 103 | 133 | — |
| Conversion/% | 0 | 0 | 20 | 64 | 79 | — |
| Formula weight | C30H23BrN2O4S2 | C30H23BrN2O4S2 | C30H23BrN2O4S2 | C30H23BrN2O4S2 | C30H23BrN2O4S2 | C30H23BrN2O4S2 |
| Crystal system | Triclinic | Triclinic | Triclinic | Triclinic | Monoclinic | Monoclinic |
| a/Å | 11.5055(3) | 11.5018(5) | 11.4616(6) | 11.5260(10) | 20.1661(11) | 9.6809(3) |
| b/Å | 11.9465(3) | 11.9360(5) | 11.9174(6) | 11.8060(11) | 11.7540(11) | 8.4899(3) |
| c/Å | 11.9621(3) | 11.9547(5) | 11.9565(6) | 12.2903(11) | 14.9001(12) | 31.9397(10) |
| α/° | 63.4540(10) | 63.4820(10) | 64.094(2) | 63.453(4) | — | — |
| β/° | 78.3230(10) | 78.390(2) | 78.975(2) | 78.220(4) | 131.943(5) | 96.4800(10) |
| γ/° | 62.1540(10) | 62.1500(10) | 62.088(2) | 61.190(3) | — | — |
| Unit cell volume/Å3 | 1300.50(6) | 1298.39(10) | 1297.97(12) | 1310.8(2) | 2627.0(4) | 2608.35(15) |
| Temperature/K | 173(2) | 173(2) | 173(2) | 173(2) | 173(2) | 173(2) |
| Space group |
P![[1 with combining macron]](https://www.rsc.org/images/entities/char_0031_0304.gif) |
P![[1 with combining macron]](https://www.rsc.org/images/entities/char_0031_0304.gif) |
P![[1 with combining macron]](https://www.rsc.org/images/entities/char_0031_0304.gif) |
P![[1 with combining macron]](https://www.rsc.org/images/entities/char_0031_0304.gif) |
C2/c | P21/n |
| Density (Calc.)/g cm−3 | 1.582 | 1.585 | 1.585 | 1.570 | 1.566 | 1.578 |
| Z | 2 | 2 | 2 | 2 | 4 | 4 |
| Radiation type | MoKα | MoKα | MoKα | MoKα | MoKα | MoKα |
| Absorption coefficient, μ/mm−1 | 1.783 | 1.786 | 1.786 | 1.769 | 1.765 | 1.778 |
| Absorption correction | Multi-scan | Multi-scan | Multi-scan | Multi-scan | Multi-scan | Multi-scan |
| 2θ range for data collection/° | 3.806 to 56.734 | 5.502 to 56.928 | 3.788 to 56.64 | 3.704 to 49.998 | 4.402 to 49.986 | 4.966 to 56.594 |
| No. of reflections measured | 36![[thin space (1/6-em)]](https://www.rsc.org/images/entities/char_2009.gif) 453 453 |
79![[thin space (1/6-em)]](https://www.rsc.org/images/entities/char_2009.gif) 342 342 |
49![[thin space (1/6-em)]](https://www.rsc.org/images/entities/char_2009.gif) 988 988 |
40![[thin space (1/6-em)]](https://www.rsc.org/images/entities/char_2009.gif) 827 827 |
52![[thin space (1/6-em)]](https://www.rsc.org/images/entities/char_2009.gif) 117 117 |
129![[thin space (1/6-em)]](https://www.rsc.org/images/entities/char_2009.gif) 158 158 |
| No. of independent reflections | 6498 | 6432 | 6432 | 4609 | 2305 | 6469 |
| R int | 0.0687 | 0.0325 | 0.0600 | 0.0681 | 0.1477 | 0.0575 |
| Final R1 (I > 2σ(I)) | 0.0422 | 0.0387 | 0.0693 | 0.1331 | 0.1082 | 0.0305 |
| Final wR(F2) (I > 2σ(I)) | 0.1081 | 0.1104 | 0.1928 | 0.4123 | 0.2874 | 0.0754 |
| Final R1 (all data) | 0.0687 | 0.0446 | 0.0816 | 0.1635 | 0.1315 | 0.0325 |
| Final wR(F2) (all data) | 0.1143 | 0.1143 | 0.2008 | 0.4426 | 0.3122 | 0.0766 |
| Goodness of fit on F2 | 0.963 | 1.114 | 1.115 | 1.913 | 1.122 | 1.053 |
| CCDC number | 2257541 | 2257542 | 2257543 | 2257544 | 2257545 | 2257546 |
Calculations
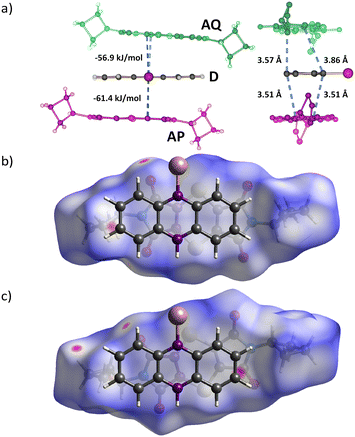
Hirshfeld surfaces and molecule⋯molecule interaction energies (Fig. 4) between the donor (D) and two unique acceptor molecules (AP and AQ) were calculated using Gaussian-0954 and CrystalExplorer-21.552 with B3LYP/6-31G(d,p).Results and discussion
Crystallization of bis(N-cyclobutylimino)-1,4-dithiin (A) and 9-bromoanthracene (D) leads to a 1![[thin space (1/6-em)]](https://www.rsc.org/images/entities/char_2009.gif) :
:![[thin space (1/6-em)]](https://www.rsc.org/images/entities/char_2009.gif) 1 CT complex in the P
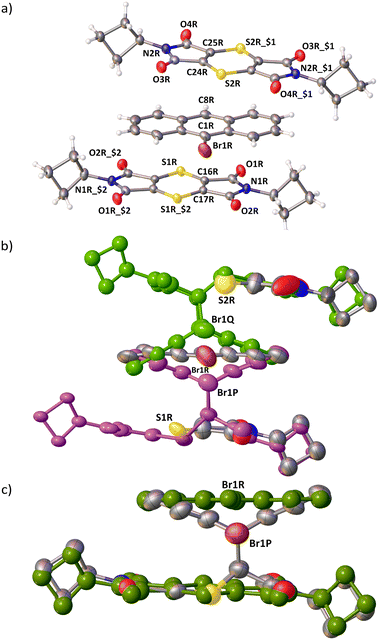
1 CT complex in the P![[1 with combining macron]](https://www.rsc.org/images/entities/char_0031_0304.gif) space group as dark red/brown needles. The asymmetric unit consists of a full D molecule and two half A molecules located on different inversion centres (Fig. 3a and 4a). The molecules overlap to form stacks in a ⋯D⋯A⋯D⋯A⋯ arrangement (Fig. 3 and 4a). Every D and A molecule can react with a molecule below or above it, forming a cycloadduct. The reaction can therefore be truly random because there is not a defined reaction site as in the 2
space group as dark red/brown needles. The asymmetric unit consists of a full D molecule and two half A molecules located on different inversion centres (Fig. 3a and 4a). The molecules overlap to form stacks in a ⋯D⋯A⋯D⋯A⋯ arrangement (Fig. 3 and 4a). Every D and A molecule can react with a molecule below or above it, forming a cycloadduct. The reaction can therefore be truly random because there is not a defined reaction site as in the 2![[thin space (1/6-em)]](https://www.rsc.org/images/entities/char_2009.gif) :
:![[thin space (1/6-em)]](https://www.rsc.org/images/entities/char_2009.gif) 1 crystal which has the DAD unit. However, a random reaction assumes that the packing doesn't influence the reaction.
1 crystal which has the DAD unit. However, a random reaction assumes that the packing doesn't influence the reaction.
The two A molecules around the D molecule are within Schmidt's criterion (Fig. 5). The distances of the reacting atoms from the AP acceptor to the D are 3.505 (C1R⋯C17R) and 3.508 Å (C8R⋯C16R), while the AQ acceptor distances to the D are 3.570 (C1R⋯C24R) and 3.859 Å (C8R⋯C25R). This creates a region where the reaction easily leads to the P product, and a region where the reaction is more hindered because of slight misalignment of the reacting atoms as well as close contacts to neighbouring stacks, hindering movement to form the Q product (Fig. 4 and 5).
Generally, the reaction proceeds in the following steps (Fig. 4):
1. When the crystals are initially reacted, products are formed in the P product region until ∼20% conversion is reached (Fig. 4b).
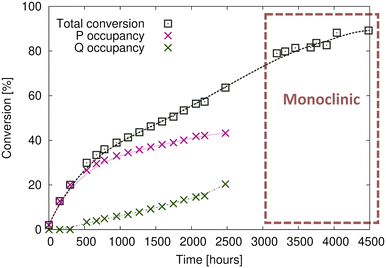
2. Upon further reaction, products are formed in the Q product region concurrently with the P product formation (Fig. 4c). Q product formation lags behind P product formation (Fig. 6).
3. Upon reaction past 65%, the crystal changes phase, transforming from the space group P![[1 with combining macron]](https://www.rsc.org/images/entities/char_0031_0304.gif) to the space group C2/c (Fig. 4d).
to the space group C2/c (Fig. 4d).
Initially, we did the solid-state reactions with free (unencapsulated) crystals exposed to air at room temperature (20 °C). Under these conditions, we were only able to react the crystals up to ∼20% because the crystals degrade very quickly starting from the surface and going into the bulk, giving poor diffraction patterns showing powder rings. Using this approach, we could only study the initial stages of the reaction and only confirm that the P product was forming. Subsequently, we encapsulated the unreacted crystals in epoxy glue and did the solid-state reactions using these epoxy-coated crystals at either room temperature or 40 °C.
Comparing the unit cell of the free crystals and the epoxy-coated crystals the unit cell parameters are consistent and not affected by the glue (Table 1). Reaction after 20% conversion was only possible with the crystals protected by glue, and the highest conversion we obtained was around ∼89% (Fig. 6). The lack of data between 2500–3100 hours (around 25 days) in Fig. 6 was caused by unsteady electricity supply and electricity generator problems causing us to shut down the X-ray instruments for around three weeks. Reaction at 20 °C took about 200 days and gave us better data, but we also carried out the reaction at 40 °C which took 12 days and yielded similar results. The plots of lattice parameters vs. conversion for crystals reacted at both temperatures are overlapped on plots in Fig. S2 in the ESI.†
Initially, product Q formation is inhibited by the reacting atoms in the AQ and D molecules being twisted out of alignment, and close interactions from molecules in neighbouring stacks forcing the molecule to align in an unfavourable orientation. Drawing the Hirshfeld surface around the AQ acceptor that leads to product Q shows regions of close contact around the periphery of the molecule (Fig. 5). The Hirshfeld surface around the AP acceptor that leads to product P shows fewer regions with close contacts. Additionally, the AP acceptor atoms involved in the Diels–Alder reaction are aligned to react with the donor reacting atoms showing a torsion angle of 2.55°, while the AQ acceptor reacting atoms are not aligned as shown by the torsion angle of −15.33 °. The AQ acceptor would need to move into the optimal position for the Diels–Alder reaction to occur. Product Q formation is inhibited when conversion is lower than ∼20% as the geometry is not ideal and lacks space for the AQ molecule to adjust to a favourable geometry. The space is created once product P has formed to a certain point, allowing for concurrent formation of product P and Q.
Around 75% conversion, the crystal undergoes a phase change from triclinic P![[1 with combining macron]](https://www.rsc.org/images/entities/char_0031_0304.gif) to monoclinic C2/c with the unit cell doubling in volume (Table 1). The transformation matrix from the original triclinic to a monoclinic cell is (2−1 0)/(0−1 0)/(−1 1−1). This is not unprecedented because we have found, during a previous solid-state reaction study, that the crystal can lose symmetry and regain it again.55 The unreacted CT crystallized in the space group P21/n, and during the initial reaction the crystal refined in P21/n with R-factor (R1) below 10% when the conversion was below 28%, but rapidly shot up to ∼19% when the conversion was between 28–80%. Refining the crystal when the conversion was between 28–80% in P21 resulted in the R1 value being lower than the P21/n values by 5%. After 80% conversion the refinements in P21 and P21/n resulted in similar R1 values of around 9%. During conversion between 28–80%, n-glide symmetry in the crystal was lost which was why refining the crystal in P21/n led to high R1 values, but it was later regained after 80% while the crystal was adjusting to the solid-state product.
to monoclinic C2/c with the unit cell doubling in volume (Table 1). The transformation matrix from the original triclinic to a monoclinic cell is (2−1 0)/(0−1 0)/(−1 1−1). This is not unprecedented because we have found, during a previous solid-state reaction study, that the crystal can lose symmetry and regain it again.55 The unreacted CT crystallized in the space group P21/n, and during the initial reaction the crystal refined in P21/n with R-factor (R1) below 10% when the conversion was below 28%, but rapidly shot up to ∼19% when the conversion was between 28–80%. Refining the crystal when the conversion was between 28–80% in P21 resulted in the R1 value being lower than the P21/n values by 5%. After 80% conversion the refinements in P21 and P21/n resulted in similar R1 values of around 9%. During conversion between 28–80%, n-glide symmetry in the crystal was lost which was why refining the crystal in P21/n led to high R1 values, but it was later regained after 80% while the crystal was adjusting to the solid-state product.
Initially, the solid-state reaction depends on the alignment of the reactants and the packing of the CT structure which will influence the site and direction of the product formation. However, once the product dominates the crystal, it influences the crystal structure of the final reacted crystal. In the previous studies, the crystal started in the space group P21/n and remained in this space group at the end. In this work, the reacting crystal transformed from a lower symmetry space group (P![[1 with combining macron]](https://www.rsc.org/images/entities/char_0031_0304.gif) ) to a higher symmetry space group (C2/c), acquiring a c-glide plane and a 2-fold axis, and retaining the inversion centres (Fig. 7). The transformation from P
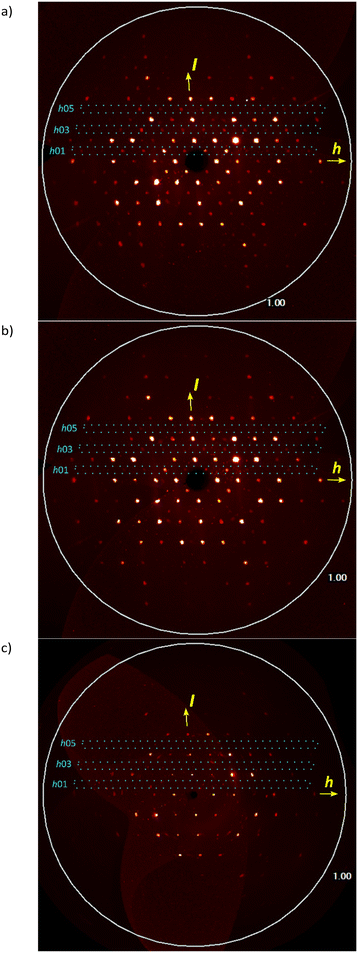
) to a higher symmetry space group (C2/c), acquiring a c-glide plane and a 2-fold axis, and retaining the inversion centres (Fig. 7). The transformation from P![[1 with combining macron]](https://www.rsc.org/images/entities/char_0031_0304.gif) to C2/c is not perfect and the reacting crystal probably goes through intermediate space groups on the way. For the space group C2/c, the c-glide perpendicular to the b-axis will lead to the systematic absence of the (h0l) family of reflections which will be absent when l ≠ 2n. When solving the structure of the reacted crystals after the transition from triclinic to monoclinic, there are many c-glide systematic absence violations, but the structures refine acceptably. However, with increasing percent conversion, the c-glide systematic absence violations decrease.
to C2/c is not perfect and the reacting crystal probably goes through intermediate space groups on the way. For the space group C2/c, the c-glide perpendicular to the b-axis will lead to the systematic absence of the (h0l) family of reflections which will be absent when l ≠ 2n. When solving the structure of the reacted crystals after the transition from triclinic to monoclinic, there are many c-glide systematic absence violations, but the structures refine acceptably. However, with increasing percent conversion, the c-glide systematic absence violations decrease.
Pseudo (h0l) precession images calculated from single-crystal X-ray diffraction data for the triclinic structure reacted crystal at 64% conversion (Table 1) just before transformation, after P![[1 with combining macron]](https://www.rsc.org/images/entities/char_0031_0304.gif) to C2/c transformation at 79% (Table 1) and 89% (Table S1 in the ESI†) are shown in Fig. 8. The triclinic structure was transformed to monoclinic using the (2−1 0)/(0−1 0)/(−1 1−1) transformation matrix from the triclinic cell. The transformation of a 64% reacted crystal generates a cell (a = 20.217 Å, b = 11.806 Å, c = 14.857, α = 92.93°, β = 132.15°, γ = 88.03°) which is very close to the monoclinic cell of the 79% reacted crystal (a = 20.166 Å, b = 11.754 Å, c = 14.900, α = 90°, β = 131.94°, γ = 90°). In the (h0l) precession images, the triclinic cell shows the expected h0l: l ≠ 2n violations, but these become less after transformation to monoclinic at ∼79% conversion and are absent at ∼89% conversion (Fig. 8 and S1 in the ESI†). With more conversion the reacted crystal conforms more closely to C2/c as the crystal adapts to the product.
to C2/c transformation at 79% (Table 1) and 89% (Table S1 in the ESI†) are shown in Fig. 8. The triclinic structure was transformed to monoclinic using the (2−1 0)/(0−1 0)/(−1 1−1) transformation matrix from the triclinic cell. The transformation of a 64% reacted crystal generates a cell (a = 20.217 Å, b = 11.806 Å, c = 14.857, α = 92.93°, β = 132.15°, γ = 88.03°) which is very close to the monoclinic cell of the 79% reacted crystal (a = 20.166 Å, b = 11.754 Å, c = 14.900, α = 90°, β = 131.94°, γ = 90°). In the (h0l) precession images, the triclinic cell shows the expected h0l: l ≠ 2n violations, but these become less after transformation to monoclinic at ∼79% conversion and are absent at ∼89% conversion (Fig. 8 and S1 in the ESI†). With more conversion the reacted crystal conforms more closely to C2/c as the crystal adapts to the product.
To compare the unit cell changes occurring due to the solid-state reaction on the same graphs, the monoclinic unit cells were transformed to the triclinic unit cell of the CT using (½−½ 0)/(0−1 0)/(−½−½ −1). These points are highlighted in Fig. 9 and the crystallographic information can be found in Tables 1 and S2 in the ESI.†
During the reaction, the a- and c-axes expand by around 6% and 2% respectively, while the b-axis contracts by around 1% (Fig. 9a). It is interesting that the trend line for the reacting crystal follows a smooth path that coincides with the converted monoclinic points for all axes, implying that the crystal does not suddenly transform into the monoclinic form after a certain amount of reaction has occurred, but gradually transforms with conversion to the monoclinic form. Smooth trend lines can also be seen when looking at the cell angles for the reacting crystal (Fig. 9b). In this case, the α- and β-angles decrease by around 2%, while the γ-angle decreases by around 4%. The cell volume increases by 3.5% which is consistent with the increasing disorder of the reacting crystal.
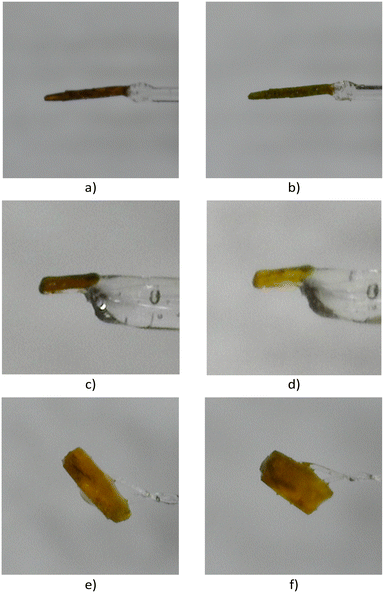
A reviewer pointed out that the SCXRD data was collected at −100 °C and there was a possibility that P![[1 with combining macron]](https://www.rsc.org/images/entities/char_0031_0304.gif) to C2/c transformation could occur upon cooling the crystals to this temperature. This is unlikely because changes in unit cell parameters with conversion shown in Fig. 9 are very gradual and linked to percent conversion. However, to make sure a crystal (Fig. 2) stored in a fridge set at 10 °C from the start of the project (2 years and 77 days ago from the date recorded on the vial) was selected and room temperature SCXRD data set was collected before measuring a data set at −100 °C. Both crystal structures solved in the space group C2/c (Table S3 in the ESI†) indicating that no temperature-dependent phase change occurs. The unit cell parameter at −100 °C for this structure is plotted with the RT and 40 °C data in Fig. S2 in the ESI† and coincides with these data.
to C2/c transformation could occur upon cooling the crystals to this temperature. This is unlikely because changes in unit cell parameters with conversion shown in Fig. 9 are very gradual and linked to percent conversion. However, to make sure a crystal (Fig. 2) stored in a fridge set at 10 °C from the start of the project (2 years and 77 days ago from the date recorded on the vial) was selected and room temperature SCXRD data set was collected before measuring a data set at −100 °C. Both crystal structures solved in the space group C2/c (Table S3 in the ESI†) indicating that no temperature-dependent phase change occurs. The unit cell parameter at −100 °C for this structure is plotted with the RT and 40 °C data in Fig. S2 in the ESI† and coincides with these data.
 | ||
Fig. 4 Changes in unit cell contents because of the enforced SCSC Diels–Alder reaction. a) The initial CT crystal with a unique donor (D) and the acceptor in two different environments (AP and AQ; also see Fig. 5). Both acceptors are on a centre of inversion and reaction can occur with the donor above or below and appears to be disordered (product on both sides of the inversion). b) AP reacts to form product P and is the only product until ∼20% conversion. c) Around 20% conversion, product Q is also formed alongside product P. d) When the crystal has reacted to more than 75%, a phase transformation from the initial triclinic space group P![[1 with combining macron]](https://www.rsc.org/images/entities/char_0031_0304.gif) to the monoclinic space group C2/c occurs, in which the morphology of the stacks remains the same, but alignments between them have slightly changed. to the monoclinic space group C2/c occurs, in which the morphology of the stacks remains the same, but alignments between them have slightly changed. | ||
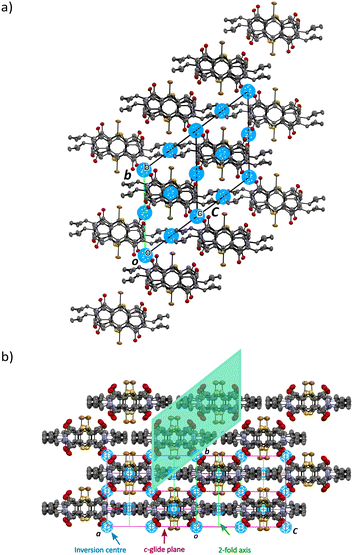 | ||
Fig. 7 Unit cell and symmetry changes on transforming from the space group P![[1 with combining macron]](https://www.rsc.org/images/entities/char_0031_0304.gif) triclinic CT before reaction (a), to the final solid-state reacted crystal in the space group C2/c monoclinic form (b). In the monoclinic form, the P and Q products are in equal amounts because they are related by a centre of inversion in C2/c. In the triclinic form (a), occupancy of the products just before the transformation is around 40% for P and 20% for Q (Fig. 6). triclinic CT before reaction (a), to the final solid-state reacted crystal in the space group C2/c monoclinic form (b). In the monoclinic form, the P and Q products are in equal amounts because they are related by a centre of inversion in C2/c. In the triclinic form (a), occupancy of the products just before the transformation is around 40% for P and 20% for Q (Fig. 6). | ||
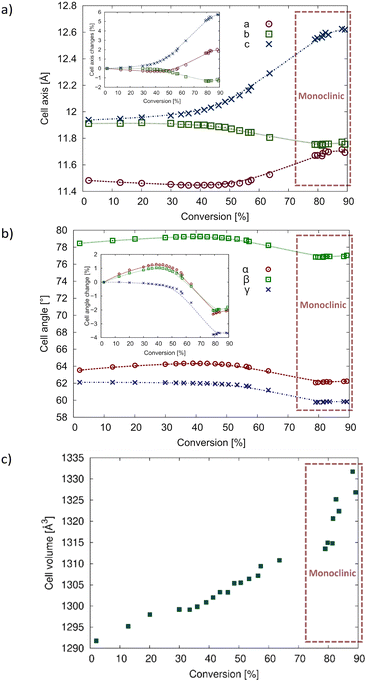 | ||
| Fig. 9 Changes in unit cell parameters with degree of conversion for the crystal reacted at 20 °C. The points that are enclosed with a red rectangle were transformed from the monoclinic unit cell back to the triclinic cell of the CT (see text for details). (a) Changes in a–c with the inset graph showing the percent change; (b) change in cell angles with the inset graph showing the percent change; (c) change in cell volume. Plots of the 40 °C data are superimposed on this data in Fig. S2 in the ESI.† | ||
Finally, the product was recrystallized to compare the unit cell, space group, and crystal packing with the solid-state reaction monoclinic form. It crystallizes in the monoclinic space group P21/n in a different unit cell (Table 1 and Fig. 10). The crystal packing is also different. While the solid-state reaction product molecules are arranged as stacks due to the templating effect of the starting CT coordinates (Fig. 4d), the molecules in the recrystallized structure are packed to optimize hydrogen bonding and other interactions, with the molecules arranged side-to-side favouring H-bonding, head-to-head favouring π⋯π interactions, or forming T-shaped arrangements favouring C![[double bond, length as m-dash]](https://www.rsc.org/images/entities/char_e001.gif) O⋯π interactions (Fig. 10). Due to the optimized hydrogen bonding and other interactions, the recrystallized structure will be more stable than the metastable solid-state reaction derivative which is why it undergoes a phase transformation during the later stages of reaction.
O⋯π interactions (Fig. 10). Due to the optimized hydrogen bonding and other interactions, the recrystallized structure will be more stable than the metastable solid-state reaction derivative which is why it undergoes a phase transformation during the later stages of reaction.
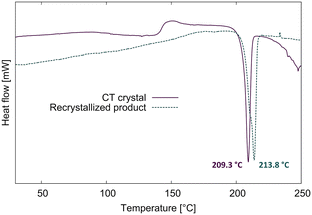
The DSCs of the CT and the recrystallized product are shown in Fig. 11. When a fresh CT crystal is heated in the DSC at 10° min−1 under nitrogen, it reacts between 100–150 °C (possibly with a recrystallization phase at ∼150 °C) then melts at 209.3 °C. The recrystallized product melts at 213.8 °C which is 4.5 °C higher than the solid-state reacted CT crystal. We also did a DSC of a CT crystal in which the crystal was heated until 180 °C to avoid melting. When we opened the aluminium pan afterward, we found a yellow single crystal which the SCXRD analysis revealed was the same crystal structure as the recrystallized product. The lower melting point of the DSC reacted CT is probably because the solid-state reaction doesn't lead to a pure product, and not because it is a new polymorph. We also found that the final crystal structure for one experiment was that of the recrystallized structure which self-assembled and annealed as a single crystal in the epoxy glue towards the end of the reaction process. Therefore, the space group for the reacted crystal transitions from P![[1 with combining macron]](https://www.rsc.org/images/entities/char_0031_0304.gif) to the metastable form C2/c, which then recrystallizes in the solid state to the thermodynamically stable P21/n.
to the metastable form C2/c, which then recrystallizes in the solid state to the thermodynamically stable P21/n.
Conclusions
Crystallizing 9Br and DiC4 as a 1![[thin space (1/6-em)]](https://www.rsc.org/images/entities/char_2009.gif) :
:![[thin space (1/6-em)]](https://www.rsc.org/images/entities/char_2009.gif) 1 CT leads to a triclinic P
1 CT leads to a triclinic P![[1 with combining macron]](https://www.rsc.org/images/entities/char_0031_0304.gif) crystal in which the D and A molecules form stacks in a ⋯D⋯A⋯D⋯A⋯ arrangement. Two half acceptor molecules sit on different inversion centres, together with a full donor molecule. The environments of these two acceptors guide the behaviours in the reaction. The more favourable aligned acceptor leads to the initial formation of product P exclusively until ∼20% conversion, then the second acceptor also reacts to form product Q. The reacting crystal remains in triclinic space group P
crystal in which the D and A molecules form stacks in a ⋯D⋯A⋯D⋯A⋯ arrangement. Two half acceptor molecules sit on different inversion centres, together with a full donor molecule. The environments of these two acceptors guide the behaviours in the reaction. The more favourable aligned acceptor leads to the initial formation of product P exclusively until ∼20% conversion, then the second acceptor also reacts to form product Q. The reacting crystal remains in triclinic space group P![[1 with combining macron]](https://www.rsc.org/images/entities/char_0031_0304.gif) until ∼65% conversion has occurred, then transforms to monoclinic space group C2/c, which is probably a type II phase transformation that occurs during the reaction. Transforming the monoclinic structures into the triclinic phase using the transformation matrix (½−½ 0)/(0−1 0)/(−½−½ −1) to plot all the cell parameters on the same graph with percent conversion, it is evident that phase transformation doesn't occur instantly, but as a gradual process. The product crystal in space group C2/c is accessible by doing the solid-state reaction using a crystal encapsulated in epoxy glue. It is also possible to study the reaction without epoxy encapsulation at 10 °C or lower, but in such conditions, the reaction would take an extended period of time, possibly years. As an alternative experimental method, moderate to high pressures using a diamond anvil cell can also force this reaction to occur topochemically and with alternative reaction paths and greater yield depending on the pressure used.26–30
until ∼65% conversion has occurred, then transforms to monoclinic space group C2/c, which is probably a type II phase transformation that occurs during the reaction. Transforming the monoclinic structures into the triclinic phase using the transformation matrix (½−½ 0)/(0−1 0)/(−½−½ −1) to plot all the cell parameters on the same graph with percent conversion, it is evident that phase transformation doesn't occur instantly, but as a gradual process. The product crystal in space group C2/c is accessible by doing the solid-state reaction using a crystal encapsulated in epoxy glue. It is also possible to study the reaction without epoxy encapsulation at 10 °C or lower, but in such conditions, the reaction would take an extended period of time, possibly years. As an alternative experimental method, moderate to high pressures using a diamond anvil cell can also force this reaction to occur topochemically and with alternative reaction paths and greater yield depending on the pressure used.26–30
Conflicts of interest
There are no conflicts to declare.Acknowledgements
The authors wish to thank the University of the Witwatersrand as well as the South African National Research Foundation (CPRR 111705; GUN 77122 and 110539) for financial support.References
- A. R. West, Solid State Chemistry and its Applications, John Wiley & Sons, Ltd, Kilbride, 1992 Search PubMed.
- L. R. Macgillivray, G. S. Papaefstathiou, T. Friščić, T. D. Hamilton, D. K. Bučar, Q. Chu, D. B. Varshney and I. G. Georgiev, Acc. Chem. Res., 2008, 41, 280–291 CrossRef CAS PubMed.
- E. A. Moore and L. E. Smart, Solid State Chemistry: An Introduction, CRC Press, Oxfordshire, 5th edn, 2021 Search PubMed.
- R. E. Schaak and T. E. Mallouk, Chem. Mater., 2002, 14, 1455–1471 CrossRef CAS.
- H. Schmalzried and M. Backhaus-Ricoult, Prog. Solid State Chem., 1993, 22, 1–57 CrossRef.
- Z. 'A. Mohiju, M. Mujaini and N. A. Hamid, IOP Conf. Ser.: Mater. Sci. Eng., 2022, 1231, 012009 Search PubMed.
- V. Ramamurthy and K. Venkatesan, Chem. Rev., 1987, 87, 433–481 CrossRef CAS.
- K. Biradha and R. Santra, Chem. Soc. Rev., 2013, 42, 950–967 RSC.
- K. Hema, A. Ravi, C. Raju, J. R. Pathan, R. Rai and K. M. Sureshan, Chem. Soc. Rev., 2021, 50, 4062–4099 RSC.
- F. Toda, Acc. Chem. Res., 1995, 28, 480–486 CrossRef CAS.
- G. Kaupp, Top. Curr. Chem., 2005, 254, 95–183 CrossRef CAS.
- D. Braga, D. D'Addario, S. L. Giaffreda, L. Maini, M. Polito and F. Grepioni, Top. Curr. Chem., 2005, 254, 71–94 CrossRef CAS.
- R. Breinbauer, I. R. Vetter and H. Waldmann, Angew. Chem., Int. Ed., 2002, 41, 2878–2890 CrossRef CAS.
- S. R. Byrn, R. R. Pfeiffer, G. Stephenson, D. J. W. Grant and W. B. Gleason, Chem. Mater., 1994, 6, 1148–1158 CrossRef CAS.
- Polymorphism in the Pharmaceutical Industry: Solid Form and Drug Development, ed. R. Hilfiker and M. von Raumer, Wiley-VCH Verlag GmbH, Weinheim, 2nd edn, 2019 Search PubMed.
- K. P. Goetz, D. Vermeulen, M. E. Payne, C. Kloc, L. E. McNeil and O. D. Jurchescu, J. Mater. Chem. C, 2014, 2, 3065–3076 RSC.
- T. Wang, X. Su, X. Zhang, X. Nie, L. Huang, X. Zhang, X. Sun, Y. Luo, G. Zhang, T. Wang, X. Zhang, X. Nie, L. Huang, Y. Luo, G. Zhang, X. Su and X. Sun, Adv. Mater., 2019, 31, 1904273 CrossRef CAS PubMed.
- Y. Jiang, Y.-Y. Liu, X. Liu, H. Lin, K. Gao, W.-Y. Lai and W. Huang, Chem. Soc. Rev., 2020, 49, 5885–5944 RSC.
- M. Irie, S. Kobatake and M. Horichi, Science, 2001, 291, 1769–1772 CrossRef CAS PubMed.
- H.-H. Fang, J. Yang, J. Feng, T. Yamao, S. Hotta and H.-B. Sun, Laser Photonics Rev., 2014, 8, 687–715 CrossRef.
- A. Nitti and D. Pasini, Adv. Mater., 2020, 32, 1908021 CrossRef CAS PubMed.
- E. Heller and G. M. J. Schmidt, Isr. J. Chem., 1971, 9, 449–462 CrossRef CAS.
- S. Khorasani and M. A. Fernandes, Chem. Commun., 2017, 53, 4969–4972 RSC.
- A. Pathigoolla and K. M. Sureshan, Angew. Chem., 2013, 125, 8833–8837 CrossRef.
- D. S. Botes, S. Khorasani, D. C. Levendis and M. A. Fernandes, CrystEngComm, 2022, 24, 7563–7569 RSC.
- H. Jin, A. M. Plonka, J. B. Parise and N. S. Goroff, CrystEngComm, 2013, 15, 3106–3110 RSC.
- A. Friedrich, I. E. Collings, K. F. Dziubek, S. Fanetti, K. Radacki, J. Ruiz-Fuertes, J. Pellicer-Porres, M. Hanfland, D. Sieh, R. Bini, S. J. Clark and T. B. Marder, J. Am. Chem. Soc., 2020, 142, 18907–18923 CrossRef CAS PubMed.
- H. Chen, B.-B. Ni, F. Gao and Y. Ma, Green Chem., 2012, 14, 2703–2705 RSC.
- J. Bąkowicz and I. Turowska-Tyrk, CrystEngComm, 2014, 16, 6039–6048 RSC.
- A. Delori, I. B. Hutchison, C. L. Bull, N. P. Funnell, A. J. Urquhart and I. D. H. Oswald, Cryst. Growth Des., 2018, 18, 1425–1431 CrossRef CAS.
- V. Guillerm, D. Kim, J. F. Eubank, R. Luebke, X. Liu, K. Adil, M. S. Lah and M. Eddaoudi, Chem. Soc. Rev., 2014, 43, 6141–6172 RSC.
- I. E. Claassens, L. J. Barbour and D. A. Haynes, J. Am. Chem. Soc., 2019, 141, 11425–11429 CrossRef CAS PubMed.
- S. Horike, S. Shimomura and S. Kitagawa, Nat. Chem., 2009, 1, 695–704 CrossRef CAS PubMed.
- D. Hean, L. G. Alde and M. O. Wolf, J. Mater. Chem. C, 2021, 9, 6789–6795 RSC.
- P. Naumov, S. Chizhik, M. K. Panda, N. K. Nath and E. Boldyreva, Chem. Rev., 2015, 115, 12440–12490 CrossRef CAS PubMed.
- X. Ding, E. Zahid, D. K. Unruh and K. M. Hutchins, IUCrJ, 2022, 9, 31–42 CrossRef CAS PubMed.
- G. M. J. Schmidt, Pure Appl. Chem., 1971, 27, 647–678 CrossRef CAS.
- M. D. Cohen and G. M. J. Schmidt, J. Chem. Soc., 1964, 1996–2000 RSC.
- E. V. Boldyreva, Solid State Ionics, 1997, 101–103, 843–849 CrossRef CAS.
- D. S. Botes, S. Khorasani, W. Duminy, D. C. Levendis and M. A. Fernandes, Cryst. Growth Des., 2020, 20, 291–299 CrossRef CAS.
- T. Friščić and L. R. MacGillivray, Z. Kristallogr. - Cryst. Mater., 2005, 220, 351–363 CrossRef.
- H. Morawetz, S. Z. Jakabhazy, J. B. Lando and J. Shafer, Proc. Natl. Acad. Sci. U. S. A., 1963, 49, 789–793 CrossRef CAS PubMed.
- G. Wegner, Pure Appl. Chem., 1977, 49, 443–454 CrossRef CAS.
- I. Halasz, Cryst. Growth Des., 2010, 10, 2817–2823 CrossRef CAS.
- APEX2, Version 2.01 or APEX4, Version 2.01 (includes XPREP version 2014/2 and SADABS version 2016/2), Bruker AXS Inc., Madison, Wisconsin, USA, 2012 Search PubMed.
- SAINT V8.34A or V8.40B, Bruker AXS Inc., Madison, Wisconsin, USA, 2012 Search PubMed.
- G. M. Sheldrick, Acta Crystallogr., Sect. A: Found. Adv., 2015, 71, 3–8 CrossRef PubMed.
- G. M. Sheldrick, Acta Crystallogr., Sect. C: Struct. Chem., 2015, 71, 3–8 Search PubMed.
- O. V. Dolomanov, L. J. Bourhis, R. J. Gildea, J. A. K. Howard and H. Puschmann, J. Appl. Crystallogr., 2009, 42, 339–341 CrossRef CAS.
- E. Keller, SCHAKAL-99, University of Freiberg, Germany, 1999 Search PubMed.
- M. A. Spackman and D. Jayatilaka, CrystEngComm, 2009, 11, 19–32 RSC.
- P. R. Spackman, M. J. Turner, J. J. McKinnon, S. K. Wolff, D. J. Grimwood, D. Jayatilaka and M. A. Spackman, J. Appl. Crystallogr., 2021, 54, 1006–1011 CrossRef CAS PubMed.
- A. L. Spek, Acta Crystallogr., Sect. D: Biol. Crystallogr., 2009, 65, 148–155 CrossRef CAS PubMed.
- M. J. Frisch, G. W. Trucks, H. B. Schlegel, G. E. Scuseria, M. A. Robb, J. R. Cheeseman, G. Scalmani, V. Barone, B. Mennucci, G. A. Petersson, H. Nakatsuji, M. Caricato, X. Li, H. P. Hratchian, A. F. Izmaylov, J. Bloino, G. Zheng, J. L. Sonnenberg, M. Hada, M. Ehara, K. Toyota, R. Fukuda, J. Hasegawa, M. Ishida, T. Nakajima, Y. Honda, O. Kitao, H. Nakai, T. Vreven, J. J. A. Montgomery, J. E. Peralta, F. Ogliaro, M. Bearpark, J. J. Heyd, E. Brothers, K. N. Kudin, V. N. Staroverov, R. Kobayashi, J. Normand, K. Raghavachari, A. Rendell, J. C. Burant, S. S. Iyengar, J. Tomasi, M. Cossi, N. Rega, N. J. Millam, M. Klene, J. E. Knox, J. B. Cross, V. Bakken, C. Adamo, J. Jaramillo, R. Gomperts, R. E. Stratmann, O. Yazyev, A. J. Austin, R. Cammi, C. Pomelli, J. W. Ochterski, R. L. Martin, K. Morokuma, V. G. Zakrzewski, G. A. Voth, P. Salvador, J. J. Dannenberg, S. Dapprich, A. D. Daniels, Ö. Farkas, J. B. Foresman, J. V. Ortiz, J. Cioslowski and D. J. Fox, Gaussian-09, Revision E.01, Gaussian Inc., Wallingford, CT, 2009 Search PubMed.
- S. Khorasani, D. S. Botes, M. A. Fernandes and D. C. Levendis, CrystEngComm, 2015, 17, 8933–8945 RSC.
Footnote |
| † Electronic supplementary information (ESI) available: Crystal coordinates as CIF files for all the structures reported in Table 1 have been deposited (Deposition Numbers 2257541–2257546) as a compressed file, as well as a PDF file containing supplementary information discussed in the text. For ESI and crystallographic data in CIF or other electronic format see DOI: https://doi.org/10.1039/d3ce00388d |
| This journal is © The Royal Society of Chemistry 2023 |

