
 Open Access Article
 This Open Access Article is licensed under a Creative Commons Attribution-Non Commercial 3.0 Unported Licence
Evaluation of synthon influence on ethenzamide–polyphenol pharmaceutical cocrystals†
Francisco Javier
Acebedo-Martínez
 a,
Alicia
Domínguez-Martín
b,
Carolina
Alarcón-Payer
c,
Antonio
Frontera
d,
Ángel
Ibáñez
b and
Duane
Choquesillo-Lazarte
*a
a,
Alicia
Domínguez-Martín
b,
Carolina
Alarcón-Payer
c,
Antonio
Frontera
d,
Ángel
Ibáñez
b and
Duane
Choquesillo-Lazarte
*a
aLaboratorio de Estudios Cristalográficos, IACT, CSIC-Universidad de Granada, Avda. de las Palmeras 4, 18100 Armilla, Spain. E-mail: duane.choquesillo@csic.es
bDepartment of Inorganic Chemistry, Faculty of Pharmacy, University of Granada, 18071 Granada, Spain
cServicio de Farmacia, Hospital Universitario Virgen de las Nieves, 18014 Granada, Spain
dDepartment of Chemistry, Universitat de les Illes Balears, Crta de Valldemossa km 7.5, 07122 Palma de Mallorca, Baleares, Spain
First published on 3rd May 2023
Abstract
The pharmaceutical cocrystal landscape of ethenzamide has been addressed during the past years with the aim of improving its physicochemical properties, mainly solubility and dissolution rate. Herein four novel ethenzamide cocrystals have been isolated by mechanochemical synthesis and thoroughly characterized by powder and single-crystal X-ray diffraction. Polyphenols have been selected as coformers based on ethenzamide synthon preference as well as their safety profile and antioxidant character. Besides crystallographic analysis, theoretical calculations have been made to evaluate the strength of intermolecular interactions and their role in crystal packing. The results evidence differences in the supramolecular architecture depending on the different polyphenolic isomers used as coformers. Finally, the physicochemical properties of the novel compounds were assessed and compared to those of ethenzamide alone. Although the solubility profile is significantly enhanced, the thermodynamic stability of the novel cocrystals in aqueous medium is restricted to 24 hours. These findings have been correlated with the crystal structure.
Introduction
Ethenzamide (ETZ, Scheme 1) is defined as a non-steroidal anti-inflammatory drug (NSAID), which has been proved to have analgesic, antipyretic, anti-inflammatory, and antirheumatic properties. Its detailed mechanism of action still remains uncertain, yet ETZ is widely used in clinics, sometimes in combination with other NSAIDs.1–3 ETZ belongs to class II drugs in the Biopharmaceutical Classification System (BSC), i.e., it shows a rather poor solubility in water (0.034 mg mL−1) as well as poor permeation through biological membranes,4 thus compromising its oral bioavailability. Consequently, a wide number of references can be found regarding strategies either to enhance its solubility or to improve its dissolution rate. Prior studies sought carriers for this purpose;5–7 however, more recent studies focus their attention on crystal engineering strategies such as the design of multicomponent pharmaceutical solids.8,9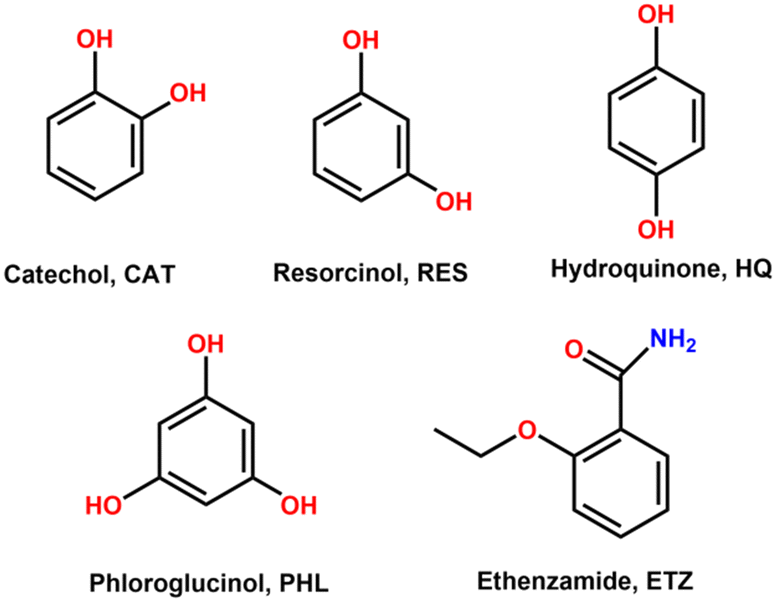 | ||
| Scheme 1 Chemical formula of catechol (CAT), resorcinol (RES), hydroquinone (HQ), phloroglucinol (PHL), and ethenzamide (ETZ). | ||
Multicomponent pharmaceutical solids such as pharmaceutical cocrystals require at least one active pharmaceutical ingredient (API) and a coformer. Coformers can be another API, as observed in fixed-dose combinations, or other molecules regarded as safe, usually considered among those included in the U.S. Food and Drug Administration (FDA) lists ‘Substances Added to Food’ and/or ‘Generally Recognized As Safe’ (GRAS).10,11 To date, several ETZ cocrystal can be found in the literature,12–15 including the characterization of cocrystal polymorphs.4,16–18
It is claimed that NSAIDs, such as ETZ, can exert antioxidant properties, working as free radical scavengers.19 However, in such cases, the anti-inflammatory effect of NSAIDs might be reduced. Therefore, some authors have explored the possibility of formulating ETZ with antioxidant molecules to improve its efficacy.20 In this context, polyphenols can be considered as good candidate coformers, since they are known for their strong antioxidant power and their safety profile. Indeed, polyphenols have been widely used by the pharmaceutical and nutraceutical industries21–23 and have recently been used in multicomponent solid formulations.24–27
The aim of this work is to synthesize and characterize novel ETZ–polyphenol cocrystals. Herein, polyphenol isomers (catechol, resorcinol, hydroquinone, Scheme 1) and phloroglucinol (Scheme 1) have been used as coformers, taking advantage of the versatile role that the hydroxyl groups present in polyphenols play in the construction of supramolecular networks. It should be noted that the polyphenol hydroquinone is authorized only for topical use and at very low doses due to the reported concerns about possible carcinogenicity and a link to ochronosis; thereby it is currently not included in the ‘Generally Recognized as Safe and Effective’ (GRASE) list from the U.S. FDA. Nonetheless, the goal of this study is not only to propose suitable industrial candidates but also to evaluate how the relative position of the –OH groups in the polyphenol coformers affects the crystal architecture and rationalize such results in terms of structure–property relationships. To achieve this purpose, a thorough crystallographic and theoretical study has been carried out, including an energetic analysis of the present intermolecular interactions, mainly H-bonding and π–π stacking. Moreover, the physicochemical properties of the novel cocrystals have also been studied, including their thermal and thermodynamic stability in aqueous medium and solubility. Finally, a rational structure–property analysis of the novel multicomponent solids has been performed.
Results and discussion
Coformer selection
To improve the success rate of the experiments, we conducted a virtual cocrystal screening prior to the execution of the trials. A survey of the Cambridge Structural Database28 (CSD version 5.43, update 4 from Nov 2022) using ETZ as the target molecule resulted in 52 hits. After excluding hits with only ETZ molecules, we were left with 49 hits, which corresponded to multicomponent crystals, including cocrystals4,12,14–16,18,29–37 and solvates.17,38–41 A robust R22(8) amide–amide homosynthon was observed in the crystal structure of ETZ.32,42 The ETZ amide group plays a critical role in the interaction with the coformer. Hence, the abundance of heterosynthons observed in the survey followed the order amide–carboxylic (51%) > amide–amide (20%) > amide–hydroxyl (phenol) (10%) > amide–carbonyl (6%). These results also show that in some multicomponent crystalline phases, ETZ preserves its dimeric structure12,35,36,41 or forms infinite C11(4) ETZ chains12,33,39 (Scheme 2).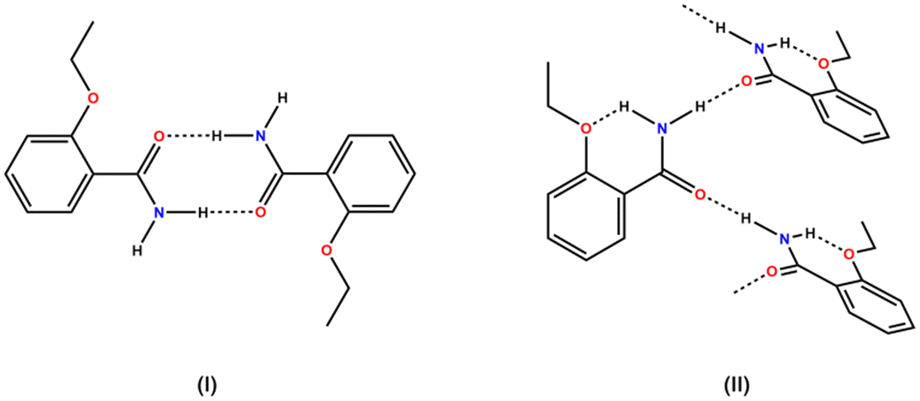 | ||
| Scheme 2 Supramolecular ETZ association in reported ETZ cocrystals: (I) ETZ dimer and (II) ETZ infinite chain. | ||
Based on these results, the use of polyphenolic molecules as coformers in this study is in good agreement with the observed synthon preference in reported structures containing ETZ. To validate our selection, we used the COSMOQuick43 software to predict the tendency of cocrystal formation based on thermodynamic calculations. This tool calculates the excess enthalpy of formation (Hex) between ETZ and the corresponding coformer relative to the pure components in the supercooled liquid phase.44 The list of candidates for the formation of multicomponent crystals with ETZ, including our polyphenolic molecules and other coformer molecules involved in the formation of cocrystals reported in the survey, was analyzed. Compounds with negative Hex values have an increased probability of forming cocrystals because Hex is a rough approximation of the free energy of cocrystal formation, ΔGcocrystal. Fig. 1 presents the results obtained from the systems examined in this study, which can serve as a qualitative indicator for the likelihood of cocrystal formation and confirm the preference of ETZ for forming cocrystals with coformers that exhibit the functional groups observed in the CSD survey, including our coformer candidates.
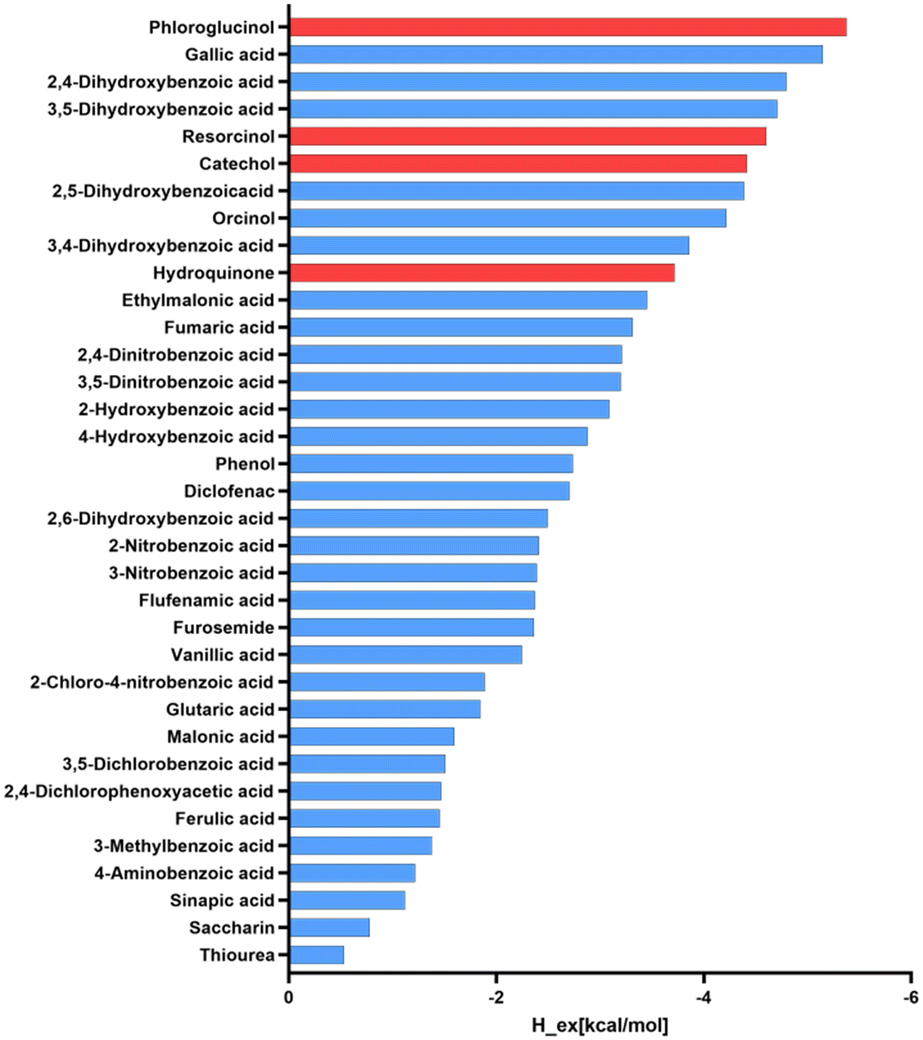 | ||
| Fig. 1 Ranking positions for ETZ coformers reported in the CSD (blue) including the polyphenolic molecules used in this study (red) based on COSMOQuick calculations. | ||
Mechanochemical synthesis
Liquid-assisted grinding (LAG) is a mechanochemical synthesis technique that is widely used for the screening and synthesis of new multicomponent materials because of its low time and resource consumption.45 In this work, four new cocrystals of ETZ were obtained by LAG, where a 2![[thin space (1/6-em)]](https://www.rsc.org/images/entities/char_2009.gif) :1 stoichiometric mixture of ETZ and the respective coformer was placed in a stainless-steel jar with two stainless-steel balls and 100 μL of liquid additive. A comparison of the PXRD patterns of the reaction products with those of the parent components indicated the formation of new cocrystals (Fig. S1†).
:1 stoichiometric mixture of ETZ and the respective coformer was placed in a stainless-steel jar with two stainless-steel balls and 100 μL of liquid additive. A comparison of the PXRD patterns of the reaction products with those of the parent components indicated the formation of new cocrystals (Fig. S1†).
Prior to the obtention of the cocrystals and during the screening process, neat grinding of mixtures of ETZ with the respective coformers in 1:1, 1:2, and 2:1 stoichiometries was performed, leading to the formation of physical mixtures. Only a 2:1 stoichiometric ratio resulted in the formation of new materials, but with a very low performance ratio. Fig. S2† shows the PXRD patterns of the new grindings with different stoichiometries for all the ETZ–coformer combinations. Liquid additives were used to induce the formation of the aforementioned new phases. LAG reactions with ethanol led to the formation of ETZ–RES and ETZ–HQ phases, whereas acetonitrile and hexane led to the formation of ETZ–PHL and ETZ–CAT (Fig. S3†).
To determine the crystalline structure of the new phases, single crystals of the materials were obtained by slow solvent evaporation of saturated solutions of the LAG product in several organic solvents such as ethanol and acetonitrile. After two days of evaporation at room temperature, crystals suitable for single-crystal X-ray diffraction (SCXRD) were obtained and carefully separated. Crystal structure determination also proved the purity of the bulk product obtained by LAG owing to the good agreement between the PXRD pattern of the product of the LAG and the PXRD pattern calculated from the crystalline structure, as shown in Fig. 2.
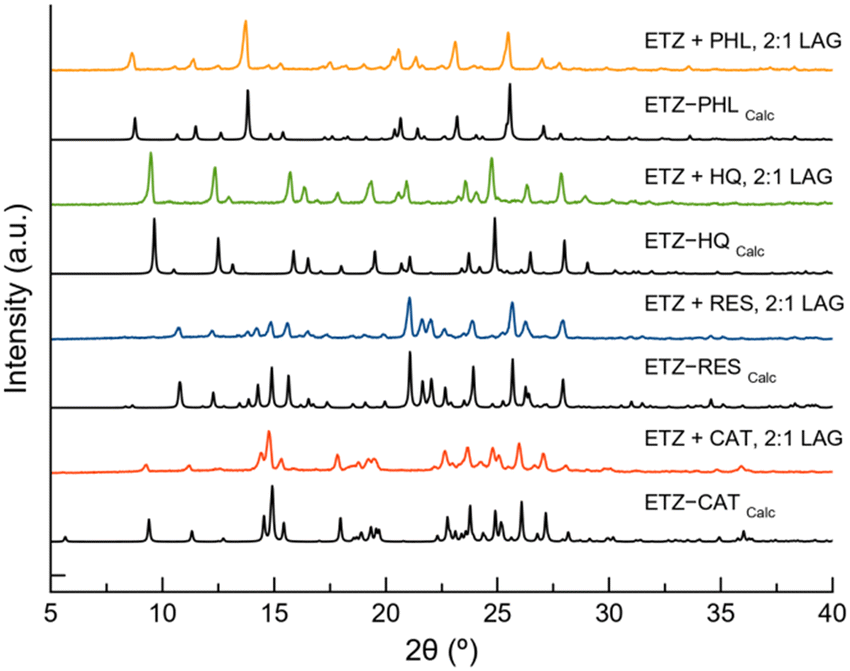 | ||
| Fig. 2 Powder X-ray diffraction (PXRD) patterns of ETZ and the pure cocrystals obtained by liquid-assisted grinding (LAG). | ||
Structural analysis of ETZ cocrystals
![[1 with combining macron]](https://www.rsc.org/images/entities/char_0031_0304.gif) with two ETZ molecules (ETZ1 and ETZ2) and one CAT molecule in the asymmetric unit, resulting in a cocrystal with a 2:1 stoichiometric ratio (Fig. 3a), where CAT bridges two ETZ molecules through the phenol–amide heterosynthon. In the crystal, a centrosymmetric R22(8) amide:amide homosynthon is observed, similar to the reported ethenzamide parent structure. CAT adopts an anti–anti conformation and associates with ETZ–ETZ dimers by H-bonding interactions, generating a ribbon-like structure reinforced by C–H⋯π interactions between the terminal methyl group of ETZ2 and the aromatic ring of CAT (Fig. 3b). The supramolecular structure of the crystal results from the additional participation of noncovalent interactions involving the ETZ1 and ETZ2 molecules, which associate with each other (Fig. 3c and d). On the one hand, pairs of ETZ1 molecules form a centrosymmetric dimer by π–π stacking interactions, which are further connected by C
with two ETZ molecules (ETZ1 and ETZ2) and one CAT molecule in the asymmetric unit, resulting in a cocrystal with a 2:1 stoichiometric ratio (Fig. 3a), where CAT bridges two ETZ molecules through the phenol–amide heterosynthon. In the crystal, a centrosymmetric R22(8) amide:amide homosynthon is observed, similar to the reported ethenzamide parent structure. CAT adopts an anti–anti conformation and associates with ETZ–ETZ dimers by H-bonding interactions, generating a ribbon-like structure reinforced by C–H⋯π interactions between the terminal methyl group of ETZ2 and the aromatic ring of CAT (Fig. 3b). The supramolecular structure of the crystal results from the additional participation of noncovalent interactions involving the ETZ1 and ETZ2 molecules, which associate with each other (Fig. 3c and d). On the one hand, pairs of ETZ1 molecules form a centrosymmetric dimer by π–π stacking interactions, which are further connected by C![[double bond, length as m-dash]](https://www.rsc.org/images/entities/char_e001.gif) O⋯π interactions, generating an infinite column. In contrast, ETZ2 molecules generate a centrosymmetric multi-stacked column via C–H⋯π interactions. Therefore, the 3D structure was obtained by connecting these columns through H-bonds and C–H⋯O interactions involving CAT coformers.
O⋯π interactions, generating an infinite column. In contrast, ETZ2 molecules generate a centrosymmetric multi-stacked column via C–H⋯π interactions. Therefore, the 3D structure was obtained by connecting these columns through H-bonds and C–H⋯O interactions involving CAT coformers.
 | ||
| Fig. 3 (a) Asymmetric unit in the cocrystal ETZ–CAT. (b) Fragment of the ribbon structure in ETZ–CAT. (c) Details of the π–π stacking interactions between ETZ1 molecules. (d) Details of the C–H⋯π interactions between ETZ2 molecules. | ||
:amide discrete heterosynthons (graph set D11(2)). Amide:amide ETZ dimers were also observed in the ETZ–RES cocrystal. They were connected by RES molecules, generating chain structures extending along the 21 screw axes (Fig. 4b). π–π stacking interactions between the aromatic rings of ETZ1 and ETZ2 molecules from different chains generated an interdigitated layer structure extending parallel to the bc plane (Fig. 4c). C–H⋯O interactions further associated the layers with the generation of the 3D structure.
 | ||
| Fig. 4 (a) Asymmetric unit in the cocrystal ETZ–RES. (b) Detailed view of the chain structure in ETZ–RES. (c) Fragment of 2D layered structure generated by π–π stacking interactions. | ||
. The asymmetric unit consists of a molecule of ETZ and half a molecule of HQ located in an inversion center, leading to a 2:1 stoichiometric ratio, where each HQ molecule connects two ETZ molecules via a phenol–amide heterosynthon on each side (graph set D11(2)) (Fig. 5a). Each ETZ:HQ:ETZ unit is further connected by an N–H(amide)⋯O(phenol) hydrogen bond to other units, resulting in a tape structure running along the c-axis (Fig. 5b). In the crystal structure, the robust R22(8) amide:amide homosynthon dimer was disrupted by the insertion of HQ molecules. The tape structures were then connected by C–H⋯O and amide⋯π interactions, generating a 2D layer structure extending parallel to the bc plane. These layers are stacked along the a-axis, resulting in 3D crystal packing.
 | ||
| Fig. 5 (a) Asymmetric unit in the cocrystal ETZ–HQ. (b) Fragment of tape structure built by H-bonding interactions. | ||
:1 molar ratio (Fig. 6a). As in the case of the cocrystals with CAT and RES as coformers, a robust amide:amide dimer homosynthon was observed. PHL molecules then connect dimers through two of their –OH groups (positions 1 and 3), resembling a syn–anti RES coformer, generating a tape structure with ETZ:ETZ dimers located in the periphery (Fig. 6b). The third –OH of the PHL is used to connect adjacent PHL molecules by –OH⋯O H-bonding interactions, affording a 2D grid structure, as illustrated in Fig. 6c. These structures are then associated by π–π stacking interactions involving two crystallographically independent ETZ molecules to build an interdigitated 3D structure reinforced by N–H⋯O H-bonds.
 | ||
| Fig. 6 (a) Asymmetric unit in the cocrystal ETZ–PHL. (b) Detailed view of the tape structure in ETZ–PHL. (c) Fragment of 2D grid structure in ETZ–PHL. | ||
Theoretical studies
The theoretical study is focused on the evaluation of H-bonding interactions as well as several π–π stacking complexation modes in ETZ cocrystals with polyphenolic coformers. One of our purposes is to analyze the formation of self-assembled ETZ dimers by means of two N–H⋯O bonds (R22(8) synthon) in ETZ–CAT, ETZ–RES, and ETZ–PHL, and the absence of such dimers in ETZ–HQ (see Scheme 3). As further commented below, in those co-crystals where the R22(8) self-assembled dimers are formed, the polyphenolic coformers connect the dimers through strong O–H⋯O H-bonds. | ||
| Scheme 3 Different H-bonding networks in the cocrystals reported herein. | ||
First, we have computed the molecular electrostatic potential (MEP) surfaces of all coformers, which are represented in Fig. 7. They evidence that ETZ is the best H-bond acceptor with the minimum MEP value located at the amidic O atoms (−48 kcal mol−1). The MEP maximum is located at the amidic H atom (+32 kcal mol−1). The MEP value over the aromatic ring is negative (−12 kcal mol−1) and positive at the H atoms of the ethyl (+20 kcal mol−1). The MEP value over the center of the aromatic ring in the rest of the coformers (polyphenols) is also negative, thus explaining the formation of C–H⋯π interactions in the solid state of some of these compounds (vide infra).
 | ||
| Fig. 7 MEP surfaces of ETZ (a), CAT (b), RES (c), HQ (d) and PHL (e) at the PBE0-D3/def2-TZVP. Isosurface 0.001 a.u. The MEP values at selected points of the surfaces are given in kcal mol−1. | ||
The MEP surfaces of the polyphenols show that they are excellent H-bond donors, as expected, with values ranging from +48 to +51 kcal mol−1 at the phenolic H atoms. However, they are worse H-bond acceptors than ETZ, with MEP values ranging from −21 kcal mol−1 to −39 kcal mol−1. The best H-bond acceptor is CAT due to the overlap of two lone pairs. For latter compounds, we have used the conformation observed in the solid state, which are not the global minima.
Several π–π stacking modes of the ETZ molecule (homodimers) exist in the solid state of the cocrystals, which are represented in Fig. 8 and 9, along with their QTAIM and NCIPlot analyses. Interestingly, in three of them the fused H-bonded ring also participates in the binding (ETZ–RES, ETZ–HQ and ETZ–PHL); see Fig. 8. In these complexes, the π-stacking is characterized by several bonds, green and cage critical points (CPs), represented by red, yellow and blue spheres. The bond CPs interconnect several atoms of both ETZ molecules, including those of the H-bonded six-membered ring (highlighted in fuchsia). It is interesting to highlight that in the case of ETZ–RES the antiparallel stacking is an almost perfect face-to-face stacking where the H-bonded ring is precisely located over the aromatic ring and vice versa.
 | ||
| Fig. 8 Distribution of bond, ring and cage critical points (red, yellow and blue spheres, respectively) and bond paths in the π-stacking dimers of ETZ–HQ (a), ETZ–RES (b) and ETZ–PHL (c). The overlapped NCIPlot index analysis is also shown. RDG isosurface 0.5 a.u., density cutoff = 0.04 a.u., color range: −0.04 a.u. ≤ sign(λ2) × ρ ≤ 0.04 a.u. Only the noncovalent interactions are represented in both QTAIM and NCIPlot analyses. | ||
 | ||
| Fig. 9 Distribution of bond, ring and cage critical points (red, yellow and blue spheres, respectively) and bond paths in the π-stacking dimers of ETZ1–CAT (a and b) and ETZ2–CAT (c). The overlapped NCIPlot index analysis is also shown. RDG isosurface 0.5 a.u., density cutoff = 0.04 a.u., color range: −0.04 a.u. ≤ sign(λ2) × ρ ≤ 0.04 a.u. Only the noncovalent interactions are represented in both QTAIM and NCIPlot analyses. | ||
The existence of π–π stacking interactions is further confirmed by the NCIPlot index analysis that shows a green isosurface (meaning attractive interaction) between the aromatic rings. We have computed the dimerization energies for the three homodimers and they are quite large, −12.8 kcal mol−1 for ETZ–HQ and −10.1 kcal mol−1 for ETZ–RES and ETZ–PHL cocrystals. The interaction energy is larger in ETZ–HQ likely due to the formation of two ancillary C–H⋯O interactions (see Fig. 8a) involving the ethyl group and the amidic O atom. This interaction is characterized by the corresponding bond CP, bond path and NCIPlot isosurface connecting the O and H atoms.
In the case of ETZ–CAT (Fig. 9), there are two symmetrically independent ETZ molecules in the X-ray structure, namely ETZ1 (ring C1–C6) and ETZ2 (ring C11–C16). We have found three different stacking modes, two involving ETZ1 and one involving ETZ2. One is similar to the bonding modes described in Fig. 8 with an antiparallel arrangement of the rings and identical binding energy (−10.1 kcal mol−1, see Fig. 9a) compared to ETZ–PHL and ETZ–RES. In the other π–π stacking involving ETZ1, both π systems are significantly displaced and the interaction is characterized by two bond CPs that interconnect the carbonyl O atoms to the aromatic carbon atoms. This biding mode is energetically weaker (−4.0 kcal mol−1) likely due to the smaller overlap of the π systems, as corroborated by the NCIPlot isosurfaces.
Finally, the stacking mode observed for the ETZ2 moiety is characterized by the interaction of the ethyl groups with the aromatic rings, thus establishing two sets of symmetrically equivalent CH⋯π interactions that are characterized by two bond CPs and a bond path connecting two H atoms of the ethyl group to two carbon atoms of the aromatic rings (see Fig. 8c). Interestingly, this binding mode is slightly stronger than that of ETZ1–CAT (see Fig. 9a and b).
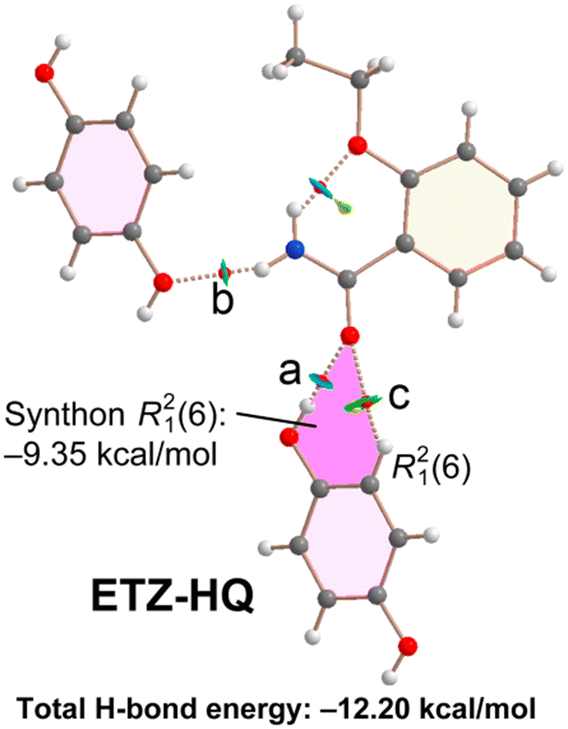
The combined QTAIM/NCIPlot analysis of the H-bonds observed in the solid state of cocrystal ETZ–HQ is shown in Fig. 10. In this compound, the self-assembled ETZ dimers were not formed. For this compound (and the rest of the compounds described below), each H-bond is characterized by a bond CP, a bond path and a green (weak) or blue (strong) NCIPlot isosurface, depending on the strength of the interaction. In fact, we have estimated the H-bond energy of the H-bonds using the potential energy density at the bond CP using the formula proposed by Espinosa et al.46 (Edis = 0.5 × Vr). The energies are summarized in Table 1. It can be observed that in the ETZ–HQ cocrystal the strongest H-bond is O–H⋯O (−8.25 kcal mol−1), in agreement with the MEP analysis. The N–H⋯O is significantly weaker (−2.85 kcal mol−1), in line with the poor H-bond acceptor ability of the –OH. Finally, the dissociation energy of the C–H⋯O contact is only −1.10 kcal mol−1. The energy associated to the R21(6) synthon (highlighted in pink) is significant (−9.35 kcal mol−1), even larger than that of the R22(8) synthons observed in the rest of the cocrystals (vide infra).
 | ||
| Fig. 10 Distribution of bond and ring critical points (red and yellow spheres, respectively) and bond paths in the H-bonding networks of ETZ–HQ. The overlapped NCIPlot index analysis is also shown. RDG isosurface 0.5 a.u., density cutoff = 0.04 a.u., color range: −0.04 a.u. ≤ sign(λ2) × ρ ≤ 0.04 a.u. For clarity, only the noncovalent interactions are represented in both QTAIM and NCIPlot analyses. | ||
| Compound and CP | ρ | V r | E dis |
|---|---|---|---|
| ETZ–HQ (a) | 0.0280 | −0.0263 | 8.25 |
| ETZ–HQ (b) | 0.0140 | −0.0091 | 2.85 |
| ETZ–HQ (c) | 0.0057 | −0.0035 | 1.10 |
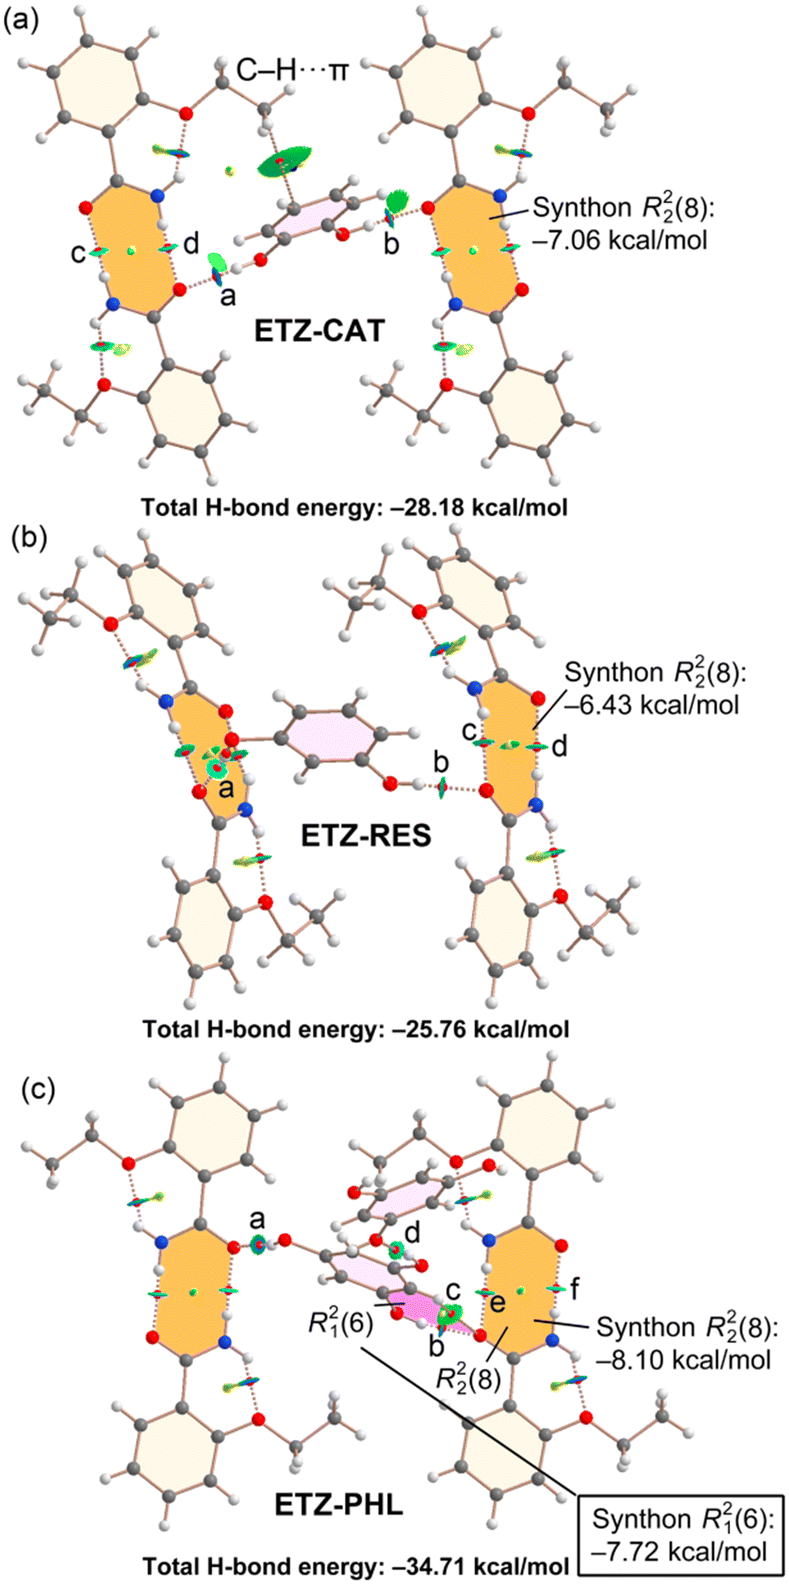
Fig. 11 shows the QTAIM/NCIPlot combined analyses of cocrystals ETZ–CAT, ETZ–RES and ETZ–PHL, which have in common the formation of the ETZ self-assembled dimers, which are interconnected by the bridging polyphenolic rings. The formation energies of the R22(8) self-assembled dimers (highlighted in orange) can be estimated by summing the dissociation energies associated to two bond CPs that characterize the HBs. The energies are gathered in Table 2 and the formation energies range from −6.43 kcal mol−1 in ETZ–RES to −8.10 kcal mol−1 in ETZ–PHL. The total H-bond energy in the ETZ–CAT and ETZ–RES assemblies are comparable (−28.18 kcal mol−1 and −25.76 kcal mol−1, respectively).
 | ||
| Fig. 11 Distribution of bond and ring critical points (red and yellow spheres, respectively) and bond paths for the H-bonding networks of ETZ–CAT (a), ETZ–RES (b) and ETZ–PHL (c). The overlapped NCIPlot index analysis is also shown. RDG isosurface 0.5 a.u., density cutoff = 0.04 a.u., color range: −0.04 a.u. ≤ sign(λ2) × ρ ≤ 0.04 a.u. For clarity, only the noncovalent interactions are represented in both QTAIM and NCIPlot analyses. | ||
| Compound and CP | ρ | V r | E dis |
|---|---|---|---|
| ETZ–CAT (a) | 0.0264 | −0.0240 | 7.53 |
| ETZ–CAT (b) | 0.0237 | −0.0208 | 6.53 |
| ETZ–CAT (c) | 0.0127 | −0.0035 | 1.10 |
| ETZ–CAT (d) | 0.0205 | −0.0152 | 4.77 |
| ETZ–RES (a) | 0.0217 | −0.0179 | 5.62 |
| ETZ–RES (b) | 0.0258 | −0.0232 | 7.28 |
| ETZ–RES (c) | 0.0154 | −0.0101 | 3.17 |
| ETZ–RES (d) | 0.0161 | −0.0104 | 3.26 |
| ETZ–PHL (a) | 0.0280 | −0.0260 | 6.46 |
| ETZ–PHL (b) | 0.0274 | −0.0260 | 6.46 |
| ETZ–PHL (c) | 0.0066 | −0.0040 | 1.26 |
| ETZ–PHL (d) | 0.0184 | −0.0138 | 4.33 |
| ETZ–PHL (e) | 0.0185 | −0.0129 | 4.05 |
| ETZ–PHL (f) | 0.0185 | −0.0129 | 4.05 |
In general, the O–H⋯O(ETZ) HBs are stronger than the N–H⋯O HBs, in agreement with the superior H-bond donor ability of the phenol groups compared to that of the –NH2 group of ETZ. In compound ETZ–PHL, where the aromatic ring presents three OH groups (PHL), two of them are used to interconnect the self-assembled ETZ dimers and the third one forms an HB with an adjacent PHL molecule (see CP “d” in Fig. 11c). This OH⋯O(PHL) H-bond is weaker than the OH⋯O(ETZ) H-bonds, which range from −5.7 to −7.5 kcal mol−1. In this assembly, the formation of a R21(6) synthon (highlighted in pink) is also observed, similar to that of the ETZ–HQ cocrystal (Fig. 10). The formation energy is also significant (−7.72 kcal mol−1) but smaller than that of the ETZ–HQ cocrystal, likely due to the simultaneous participation of the amidic O atom in ETZ in the R22(8) synthon.
The combined QTAIM/NCIPlot analysis of ETZ–CAT (Fig. 11a) also evidences the formation of a C–H⋯π interaction that is characterized by a bond CP and a bond path connecting one H atom of the ethyl group with the aromatic ring of CAT. This is also confirmed by the NCIPlot analysis that shows a quite extended green isosurface located between the C–H bond and the π system.
Fourier transform infrared (FT-IR) spectroscopy
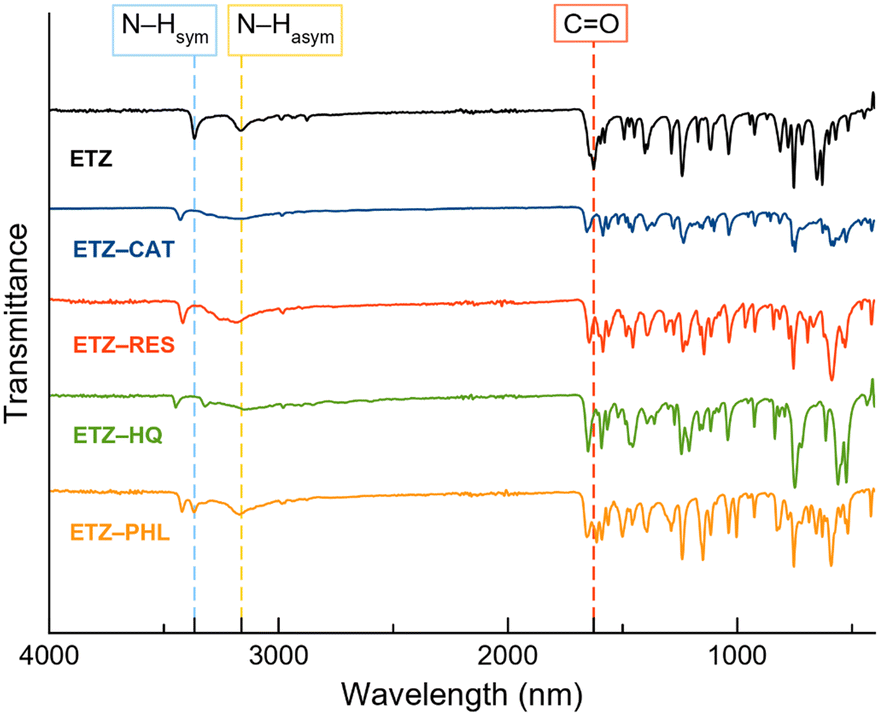
FT-IR spectroscopy was used as a complementary technique to study the interactions between the functional groups. Multicomponent material formation can be determined by shifting the wavenumber or changing the peak intensities of functional groups in comparison with their constituents.47Fig. 12 shows the FT-IR spectra of the ETZ and cocrystals. The significant bands of ETZ that are involved in the formation of cocrystals are at 1626 cm−1 due to the carbonyl stretching group (CO) and the bands at 3165 and 3366 cm−1, ascribed to the symmetric and asymmetric stretching modes of N–H, respectively. Shifts in the mentioned bands are clearly observed, indicating the formation of cocrystals, which is in good agreement with previous X-ray diffraction results. The relevant bands of ETZ and their respective shifts in the cocrystals are summarized in Table 3.
 | ||
| Fig. 12 FT-IR spectra of ETZ and the reported cocrystals. | ||
| Compound | Wavenumber (cm−1) | ||
|---|---|---|---|
| CO stretching |
N–H asymmetric | N–H symmetric | |
| ETZ | 1626 | 3165 | 3366 |
| ETZ–CAT | 1585 | 3153 | 3425 |
| ETZ–RES | 1585 | 3181 | 3416 |
| ETZ–HQ | 1591 | 3148 | 3322 |
| ETZ–PHL | 1613 | 3171 | 3368 |
Thermal analysis
To assess the thermal stability of the cocrystals, their melting points and weight losses were analyzed using simultaneous differential scanning calorimetry (DSC) and thermogravimetric analysis (TGA). Fig. 13 shows DSC traces of the cocrystals. One major endothermic event was observed in each sample, which was ascribed to its melting point. While ETZ–PHL presented a melting point between those of the API and the coformer, a common behaviour already reported in pharmaceutical multicomponent materials,48 the other cocrystals presented melting points below those of the parent components, thus indicating lower thermal stability. Interestingly, coformers with lower melting points (CAT and RES) led to the formation of cocrystals with lower melting points, indicating a positive correlation between the melting points of the coformer and those of the cocrystals. The melting points of the coformers and cocrystals are listed in Table 4.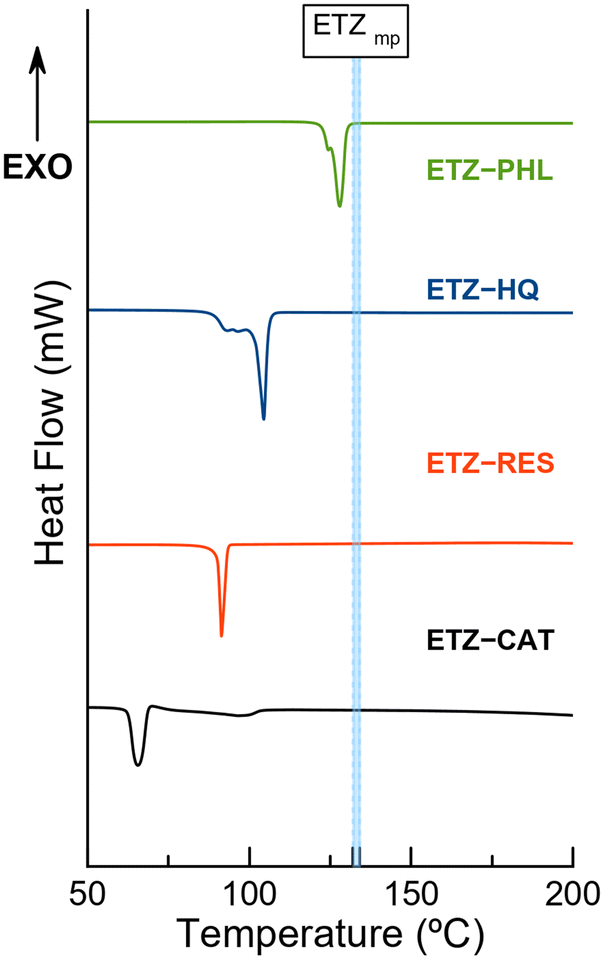 | ||
| Fig. 13 Differential scanning calorimetry (DSC) traces of the pure cocrystals. Blue dotted lines correspond to a range of temperatures reported for the melting point of ETZ. | ||
| Compound | Melting point (°C) | Cocrystal | Melting point (°C) |
|---|---|---|---|
| CAT | 105 | ETZ–CAT | 65–66 |
| RES | 110 | ETZ–RES | 91.4 |
| HQ | 172 | ETZ–HQ | 103 |
| PHL | 116–117 | ETZ–PHL | 127 |
| ETZ | 132–134 |
No endothermic events are observed below the melting point, confirming the purity of the phases observed by PXRD. In addition, thermogravimetric analysis (TGA) demonstrated the integrity of the phases because no weight loss was observed below the melting point. The decomposition of the phases occurred only above the melting point, as can be observed in Fig. S4.† In addition, DSC traces of novel cocrystals and isolated coformers with the corresponding onset and enthalpy values are given in Fig. S5 and S6,† respectively. Fig. 13 shows fusion–recrystallization–fusion events in the ETZ–PHL and ETZ–HQ samples, attributed to the transition among two/three non-identified phases, likely polymorph transformations. Surprisingly, despite the appearance of these phase transformations during the DSC experiment, the nature of such materials before and after the thermal experiment is identical, as supported by TGA results and confirmed by PXRD.
Stability studies
The stability of the cocrystals and their dissociation profiles were assessed in PBS buffer at 25 °C for 24 h (Fig. S7†). Although no changes in color or texture were observed, PXRD revealed that none of the cocrystals was stable in aqueous medium. In fact, the cocrystals dissociated in less than 30 min. It should be noted that the stability study and dissolution profile of ETZ–HQ have been performed only as a matter of comparison in order to elucidate, if possible, a structure–property relationship. Thus, ETZ–HQ is not considered a suitable pharmaceutical cocrystal according to the FDA's restrictions on this polyphenol.Low stability under accelerated aging conditions (40 °C and 75% RH) was also observed. The PXRD patterns of the samples after four months under the above-mentioned conditions demonstrated that only ETZ–PHL remained stable, whereas ETZ–RES and ETZ–HQ showed partial dissociation after one month. Finally, ETZ–CAT dissociated in the first 24 h and completely dissociated after one week (Fig. 14).
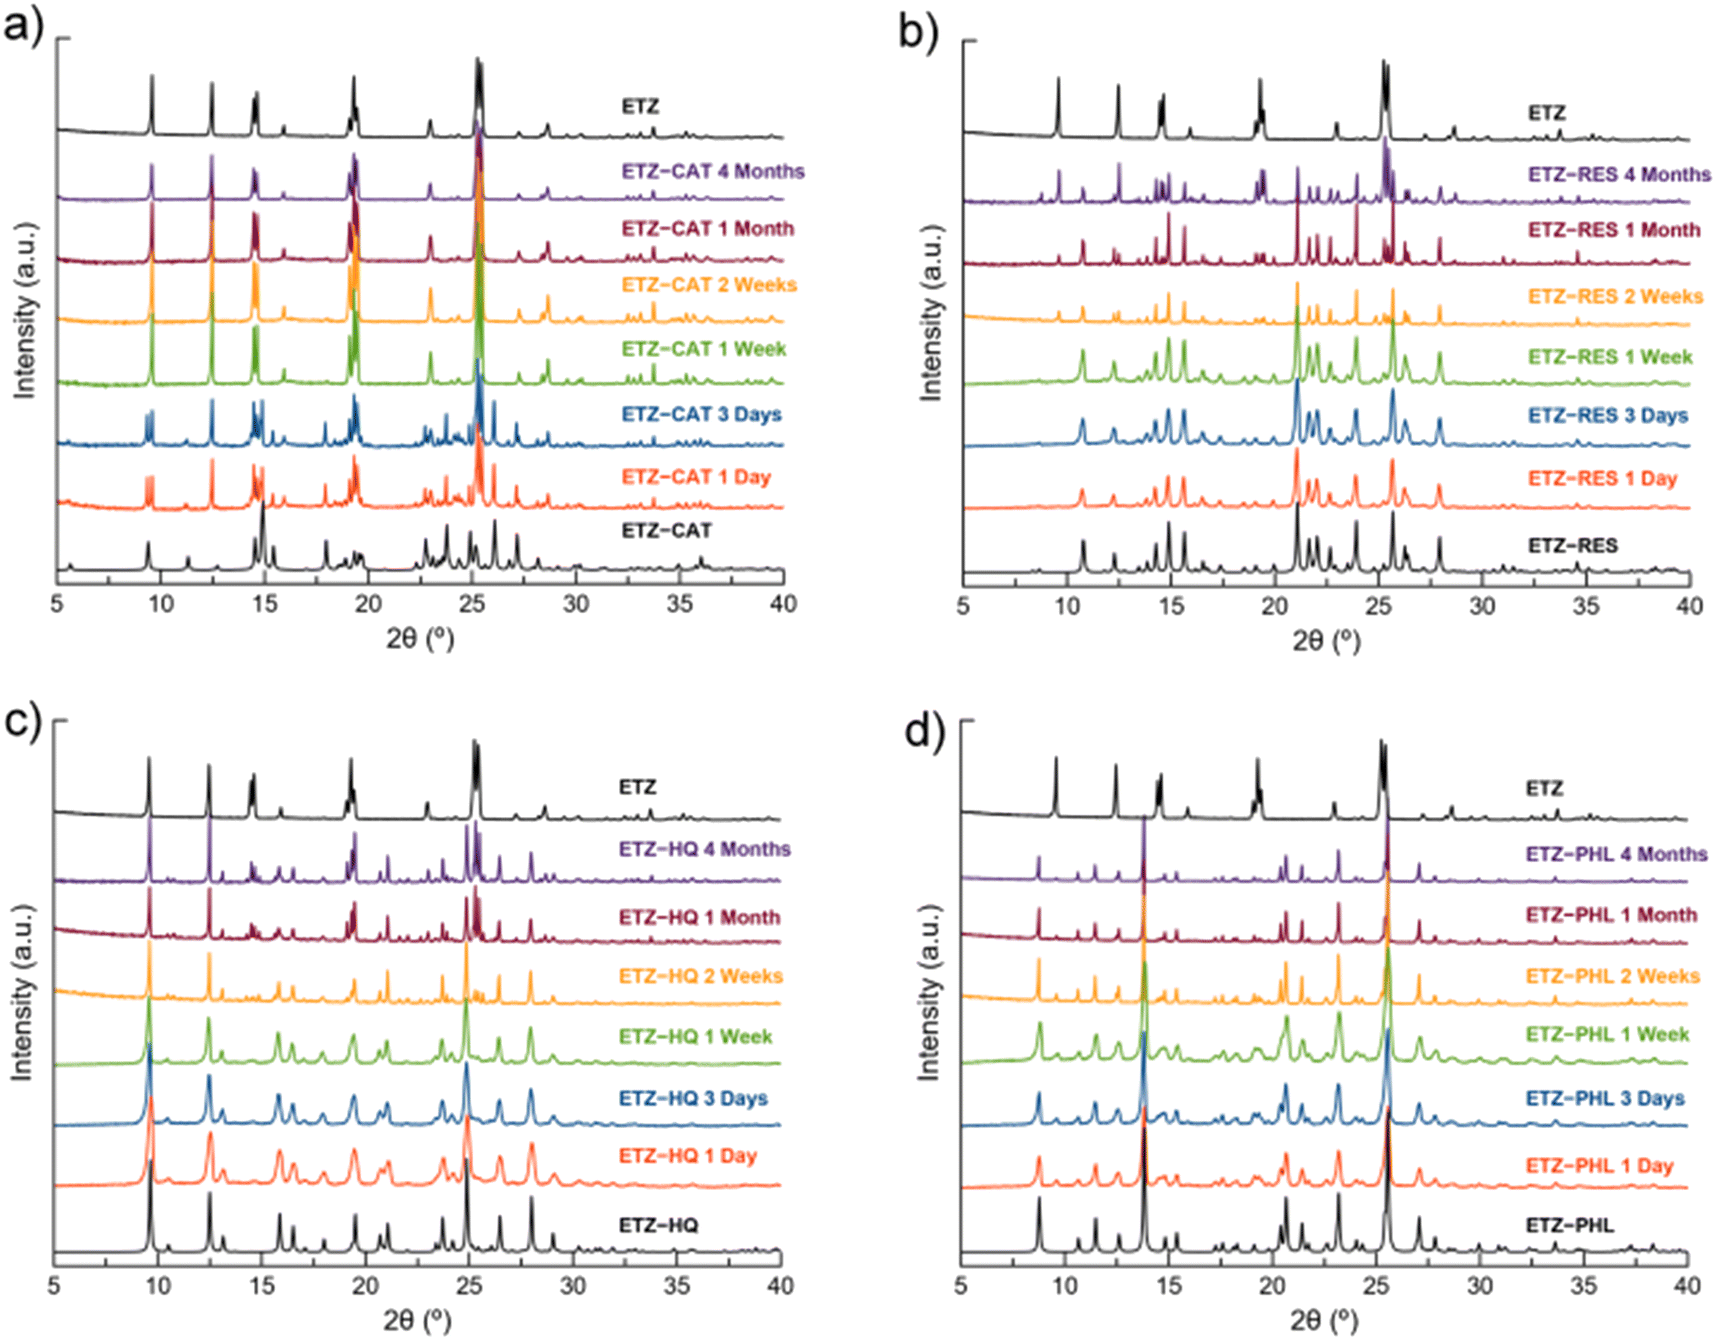 | ||
| Fig. 14 PXRD patterns of ETZ–CAT (a), ETZ–RES (b), ETZ–HQ (c) and ETZ–PHL (d) with respect to the stability under accelerated aging conditions (40 °C, 75% RH) at different time intervals. | ||
Powder dissolution profile
As observed in the previous section, cocrystals are not thermodynamically stable in aqueous solutions. Therefore, to monitor the evolution of ETZ concentration, the dissolution profile of pure ETZ and cocrystals was determined by UV-vis spectrophotometry in PBS buffer (pH 6.8), simulating the intestinal environment. Fig. 15 shows the dissolution profile of ETZ and cocrystals up to 120 min of experiments while Fig. S8† represents the complete dissolution profile up to 24 h. The solubility of ETZ is reported to be <0.05 mg mL−1 in PBS (pH 7.4) and increased up to 0.5 mg mL−1 in HCl aqueous solution at pH 1.2.49,50 Fig. S9† shows the PXRD patterns of the reported ETZ cocrystals after powder dissolution experiments.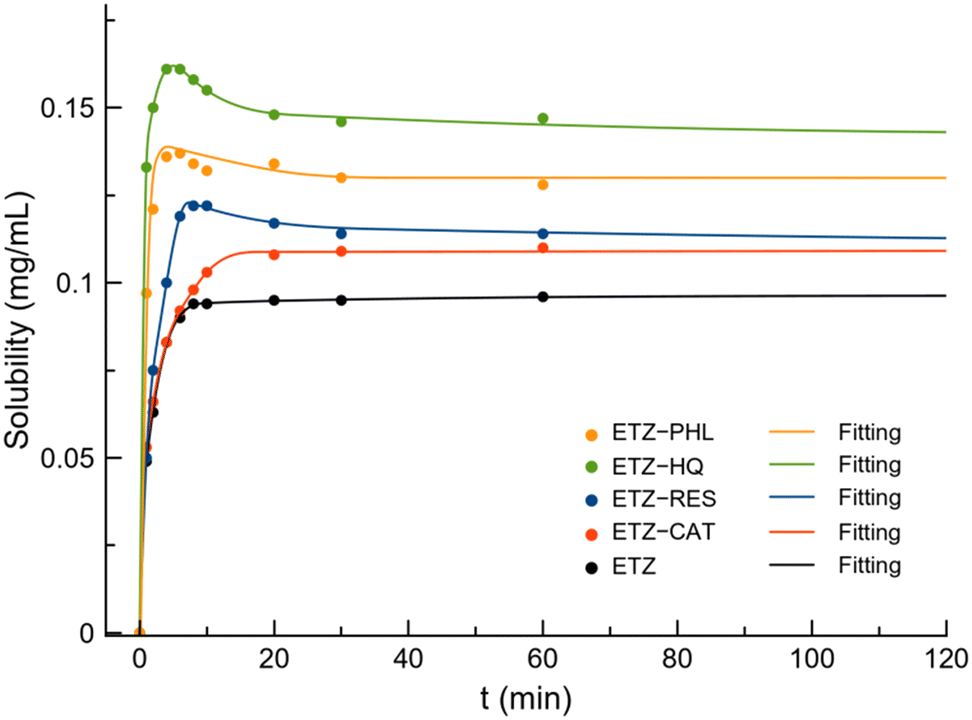 | ||
| Fig. 15 Dissolution profile of ETZ and cocrystals at 120 min. | ||
The equilibrium solubility of ETZ experimentally obtained in PBS (pH 6.8) is 0.09 mg mL−1, which is in good agreement with the reported solubility, while the solubility obtained for the cocrystals increased in the order ETZ–CAT (0.111 mg mL−1) < ETZ–RES (0.113 mg mL−1) < ETZ–PHL (0.131 mg mL−1) < ETZ–HQ (0.141 mg mL−1). Interestingly, a “spring and parachute” effect was observed in all the cocrystals except ETZ–CAT. This effect is well known among multicomponent materials and allows supersaturation and fast liberation of the API at the initial stages of the dissolution process.51
Based on the position of the hydroxyl substituents of the polyphenolic coformers in the supramolecular arrangement, crystal structural analysis provides a plausible explanation for the observed solubility trend. ETZ–HQ cocrystals display ETZ dimer disruption in favor of coformer shielding of the amide group while achieving a higher ETZ concentration at a faster rate. On the other hand, ETZ–PHL, ETZ–RES, and ETZ–CAT cocrystals exhibited better apparent solubility than ETZ, reaching a higher ETZ concentration below 10 min and subsequently decreasing over the API itself owing to the effective distance separation of ETZ dimers in their corresponding crystal structures.
Experimental
Materials
ETZ, the coformers, and all solvents were commercially available from Sigma-Aldrich (purity >98%, Sigma-Aldrich, St. Louis, MO, USA) and were used as received.General procedure for cocrystal synthesis
Mechanochemical synthesis was conducted by liquid-assisted grinding (LAG) in a Retsch MM2000 ball mill operating at 25 Hz frequency, using stainless steel jars along with two stainless steel balls of 7 mm diameter. All reaction syntheses lasted for 10 min, except for ETZ–PHL that lasted for 20 min. Reactions were repeated to ensure reproducibility.
ETZ–CAT was obtained by LAG of a mixture of ETZ (1 mmol, 165.18 mg) and the respective coformer (0.5 mmol, 55.05 mg), in a 2:1 stoichiometric ratio, using 100 μL of hexane as liquid additive.
ETZ–RES and ETZ–HQ were obtained by LAG of a mixture of ETZ (1 mmol, 165.18 mg) and the respective coformer (0.5 mmol, 55.05 mg), in a 2:1 stoichiometric ratio, using 100 μL of ethanol as liquid additive.
ETZ–PHL was obtained by LAG of a mixture of ETZ (1 mmol, 165.18 mg) and PHL (0.5 mmol, 63.076 mg), in a 2:1 stoichiometric ratio, using 100 μL of acetonitrile as liquid additive.
After milling, the bulk materials were collected and evaluated by PXRD to determine the formation of new materials.
Preparation of single crystals
Single crystals of the phases were grown by slow solvent evaporation at room temperature using saturated solutions of the polycrystalline material obtained from mechanical synthesis. Ethanol was used for preparing the saturated solutions of ETZ–CAT, ETZ–RES, and ETZ–HQ, and acetonitrile for ETZ–PHL. Suitable crystals for SCXRD appeared after 2 days of slow solvent evaporation at room temperature.X-ray diffraction analysis
Measured crystals were prepared under inert conditions and immersed in perfluoropolyether as protecting oil for manipulation. Suitable crystals were mounted on MiTeGen Micromounts™, and these samples were used for data collection. Data were collected at 298 K on a Bruker D8 Venture diffractometer (Bruker-AXS, Karlsruhe, Germany) with graphite-monochromated CuKα radiation (λ = 1.54178 Å). Integration and scaling of the intensity data were accomplished using the APEX4 suite.52 The structures were solved by intrinsic phasing using the ShelXT program,53 which revealed the position of all non-hydrogen atoms. These atoms were refined on F2 by a full-matrix least-squares procedure using the anisotropic displacement parameter.54 All hydrogen atoms were located in difference Fourier maps and included as fixed contributions riding on attached atoms with isotropic thermal displacement parameters 1.2 or 1.5 times those of the respective atom. The Olex2 (ref. 55) software was used as a graphical interface. Intermolecular interactions were calculated using the PLATON program.56 Molecular graphics were generated using Olex2 (ref. 55) and Mercury software.57 The crystallographic data for the reported structures were deposited with the Cambridge Crystallographic Data Center as supplementary publication no. CCDC 2247944–2247947. Additional crystal data are shown in Table 5.| ETZ–CAT | ETZ–RES | ETZ–HQ | ETZ–PHL | |
|---|---|---|---|---|
| a R 1 = ∑‖Fo| − |Fc‖/∑|Fo|. b wR2 = ∑w(|Fo|2 − |Fc|2)2/∑w(|Fo|2)1/2. | ||||
| Formula | C24H28N2O6 | C24H28N2O6 | C12H14NO3 | C24H28N2O7 |
| Formula weight | 440.48 | 440.48 | 220.24 | 456.48 |
| Crystal system | Triclinic | Monoclinic | Triclinic | Monoclinic |
| Space group |
P |
P21/c |
P |
Pn |
| a (Å) | 7.7814(12) | 10.2189(6) | 7.2548(5) | 9.9310(7) |
| b (Å) | 10.0144(12) | 13.8655(10) | 9.0844(6) | 10.0681(6) |
| c (Å) | 15.979(2) | 16.3778(10) | 9.5457(5) | 12.1027(8) |
| α (°) | 87.193(7) | 90 | 99.864(3) | 90 |
| β (°) | 77.808(7) | 93.473(3) | 99.082(3) | 99.780(4) |
| γ (°) | 69.864(7) | 90 | 107.888(3) | 90 |
| Volume (Å3) | 1142.3(3) | 2316.3(3) | 574.80(6) | 1192.52(14) |
| Z | 2 | 4 | 2 | 2 |
| d calc (g cm−3) | 1.281 | 1.263 | 1.273 | 1.271 |
| F(000) | 468 | 936 | 234 | 484 |
| Total reflections | 12456 |
31842 |
9342 | 16420 |
| Unique reflections | 3966 [R(int) = 0.0261] | 4058 [R(int) = 0.0538] | 1958 [R(int) = 0.0641] | 3793 [R(int) = 0.0556] |
| Completeness (%) | 98 | 99 | 97 | 99 |
| Data/restraints/parameters | 3966/0/293 | 4058/0/294 | 1958/0/148 | 3793/2/304 |
| Goodness of fit on F2 | 1.043 | 1.065 | 1.065 | 1.040 |
| R 1,a wR2b [I > 2σ(I)] | 0.0593, 0.1876 | 0.0395, 0.1139 | 0.0443, 0.1235 | 0.0404, 0.1043 |
| R 1,a wR2b [I > 2σ(I)] (all data) | 0.0686, 0.1971 | 0.0447, 0.1208 | 0.0465, 0.1264 | 0.0472, 0.1108 |
| CCDC number | 2247944 | 2247945 | 2247946 | 2247947 |
Powder X-ray diffraction (PXRD) analysis was performed at room temperature on a Bruker D8 Advance Vario diffractometer (Bruker-AXS, Karlsruhe, Germany) equipped with a LYNXEYE detector and CuKα1 radiation (1.5406 Å). The diffractograms were collected over an angular range of 5–40° (2θ) with a step size of 0.02° (2θ) and a constant counting time of 5 s per step.
Theoretical studies
The energies reported herein were computed either using Gaussian-16 (ref. 58) at the PBE0 (ref. 59)-D3 (ref. 60)/def2-TZVP61) level of theory using the supramolecular approach for the π-stacking dimers or using the quantum theory of “atoms-in-molecules”62 at the same level by means of the AIMAll program63 for the H-bonding networks. For the former the BSSE correction64 has been applied, and for the latter we have used the kinetic energy density values at the bond critical points that emerge upon complexation and applying the methodology proposed by Espinosa et al.46 This methodology has been recently used by some of us to evaluate noncovalent interactions in the solid state.65–72 The NCIPlot isosurfaces73,74 have been generated using the AIMAll program63 with the PBE0-D3/def2-TZVP wavefunction. The MEP surface plots have been performed using the 0.001 a.u. isosurface as the best estimate of the van der Waals envelope.Fourier transform infrared (FT-IR) spectroscopy
Fourier transform infrared (FTIR) spectroscopy measurements were performed on a Bruker Tensor 27 FT-IR instrument (Bruker Corporation, Billerica, MA, USA) equipped with a single-reflection diamond crystal platinum ATR unit and an OPUS data collection program. The scanning range was 4000–400 cm−1 with a resolution of 4 cm−1.Thermal analysis
Simultaneous differential scanning calorimetry (DSC) and thermogravimetric analysis were performed using a Mettler Toledo TGA/DSC1 thermal analyzer (Mettler Toledo, Columbus, OH, USA). Samples (3–5 mg) were placed into sealed aluminum pans and heated in a stream of nitrogen (100 mL min−1) from 25 to 400 °C at a heating rate of 10 °C min−1. Additional measurements were carried out using a Mettler-Toledo DSC-822e calorimeter. The calorimeter was calibrated with indium of 99.99% purity (m.p.: 156.4 °C; ΔH: 28.14 J g−1).Stability studies
The stability of ETZ and cocrystals in aqueous solution was evaluated through slurry experiments in which an excess of the pure samples was added to 10 mL of phosphate buffer (pH 6.8) and stirred for 24 h at 25 °C in sealed vials. The solids were collected at different times, filtered, dried at 35 °C and further analyzed by PXRD. The stability was also assessed at accelerated aging conditions (40 °C and 75% RH) by placing powder samples in a Memmert HPP110 climate chamber (Memmert, Schwabach, Germany) up to 2 months. The samples were analyzed by PXRD periodically to evaluate possible phase transformation during the time of the experiment.Powder dissolution profile
Powder dissolution profile studies for pure ETZ and for each new phase were performed using a Varian Cary 50 ultraviolet (UV)-visible spectrophotometer (Agilent Technologies, Santa Clara, CA, USA). The calibration curve was prepared using standard solutions of ETZ, which were analyzed at 244 nm to avoid coformer interference. Samples for the solubility studies were prepared following the shake-flask method. Saturated solutions of each solid were prepared by adding excess solid to a PBS buffer solution at pH 6.8. The solutions were stirred for 24 h at 25 °C in a water bath until thermodynamic equilibrium was reached. During this time, aliquots of the solutions at different times were taken, filtered through 0.22 μm polyether sulfone (PES) filters and directly measured by UV-vis spectrophotometry. Appropriate dilutions were made to obtain measurable absorbance values. The absorbance measurements were thereafter used to quantify the ETZ solubilized in each sample. The remaining solids were analyzed by PXRD to identify the crystalline phases and thus to check the stability of the initial crystalline phase.Conclusions
Rational screening of the synthon preference of ethenzamide revealed the suitability of polyphenolic ligands as coformers. As expected, the amide–carboxylic supramolecular heterosynthon dominates the molecular recognition pattern between ETZ and polyphenolic coformers. Interestingly, reciprocal N–H⋯O bonds build self-assembled ETZ dimers in the ETZ–CAT, ETZ–RES and ETZ–PHL cocrystals. This ETZ amide:amide R22(8) homosynthon has also been described in the crystal structure of pure ethenzamide and is preserved in the referred cocrystals although with larger distances due to the introduction of the corresponding coformers. Conversely, such a recognition pattern is disrupted in the crystal structure of ETZ–HQ, in which the presence of two close HQ ligands prevents the formation of such reciprocal amide:amide H-bonds, leading to an R21(6) synthon instead. The construction of the different architectures is supported by the calculated energy values, with the energy associated to the R21(6) synthon (−9.35 kcal mol−1) being larger than those of R22(8) synthons within the ETZ dimers (ETZ–RES −6.43 kcal mol−1 < E TZ–CAT −7.06 kcal mol−1 < ETZ–PHL −8.10 kcal mol−1).
Theoretical studies further evaluate the strength of all intermolecular interactions, with the total H-bonding energy being ETZ–HQ (−12.20 kcal mol−1) < ETZ–RES (−25.76 kcal mol−1) < ETZ–CAT (−28.18 kcal mol−1) < ETZ–PHL (−34.71 kcal mol−1). In addition, different π–π stacking modes were observed, which are in agreement with the experimental data in the solid state of the novel cocrystals. Remarkably, some structure–property relationships can be explained according to the overall energy values of the reported structures. For instance, the solubility of the novel multicomponent phases was enhanced compared to that of ETZ alone according to the following order: ETZ–CAT (×1.2) < ETZ–RES (×1.3) < ETZ–PHL (×1.5) < ETZ–HQ (×1.6). Note that the weaker structure (ETZ–HQ) shows the higher apparent solubility simply because it is easier to dissociate/hydrate. Their dissolution profiles also showed an interesting “spring and parachute” profile, which might be of interest for immediate-release formulations. Unfortunately, the novel pharmaceutical cocrystals do not show significant improvement regarding either the thermal or the thermodynamic stability when compared to the parent components. For instance, all ETZ cocrystals underwent dissociation under simulated physiological conditions before 24 h. Although the different disposition of the hydroxyl groups in the isomeric polyphenolic coformers determines the observed differences in the physicochemical behaviour of the novel cocrystals, the overall similarity of their crystal architectures resulted in similar weaknesses for all new drug formulations. These latter results compromise the development of future studies on these pharmaceutical cocrystals.
Author contributions
D. C.-L. conceived the project. F. J. A.-M., C. A.-P., A. I. and A. D.-M. performed the synthesis and characterization of the studied compounds. D. C.-L. solved the crystal structures. A. F. performed the theoretical calculations. D. C.-L. analyzed the data. D. C.-L., F. J. A.-M and A. D.-M. wrote the paper. D. C.-L. supervised the project. D. C.-L. and A. D.-M. were responsible for funding acquisition.Conflicts of interest
There are no conflicts to declare.Acknowledgements
This research was funded by Project B-FQM-478-UGR20 (FEDER-Universidad de Granada, Spain). A. F. thanks MICIU/AEI of Spain (project PID2020-115637GB-I00, FEDER) for financial support. F. J. A.-M. acknowledges an FPI grant (Ref. PRE2019-088832).References
- O. Kawano, T. Sawabe, N. Misaki and K. Fukawa, Jpn. J. Pharmacol., 1978, 28, 829–835 CrossRef CAS PubMed.
- H. Uehara, H. Otsuka and K. Izumi, Cancer Lett., 1998, 135, 83–90 CrossRef PubMed.
- S. Aoki, T. Mizutani and K. Danjo, Chem. Pharm. Bull., 2000, 48, 140–141 CrossRef CAS PubMed.
- S. Aitipamula, P. S. Chow and R. B. H. Tan, CrystEngComm, 2009, 11, 1823–1827 RSC.
- M. Kazuhiro, N. Yoshinobu, Y. Etsuo, O. Toshio and Y. Keiji, Int. J. Pharm., 1994, 108, 167–172 CrossRef.
- K. Danjo, T. Nakata and A. Otsuka, Chem. Pharm. Bull., 1997, 45, 1840–1844 CrossRef CAS.
- M. Ozawa, K. Hasegawa, Y. Yonezawa and H. Sunada, Chem. Pharm. Bull., 2002, 50, 802–807 CrossRef CAS PubMed.
- B. Saikia, P. Bora, R. Khatioda and B. Sarma, Cryst. Growth Des., 2015, 15, 5593–5603 CrossRef CAS.
- R. Kumar Bandaru, S. R. Rout, G. Kenguva, B. Gorain, N. A. Alhakamy, P. Kesharwani and R. Dandela, Front. Pharmacol., 2021, 12, 2954 Search PubMed.
- Generally Recognized as Safe (GRAS)|FDA, https://www.fda.gov/food/food-ingredients-packaging/generally-recognized-safe-gras, (accessed 2 March 2023) Search PubMed.
- Substances Added to Food (formerly EAFUS)|FDA, https://www.fda.gov/food/food-additives-petitions/substances-added-food-formerly-eafus, (accessed 2 March 2023) Search PubMed.
- S. Aitipamula, A. B. H. Wong, P. S. Chow and R. B. H. Tan, CrystEngComm, 2012, 14, 8515–8524 RSC.
- V. M. Hariprasad, S. K. Nechipadappu and D. R. Trivedi, Cryst. Growth Des., 2016, 16, 4473–4481 CrossRef CAS.
- R. Khatioda, B. Saikia, P. J. Das and B. Sarma, CrystEngComm, 2017, 19, 6992–7000 RSC.
- A. Kozak, P. H. Marek and E. Pindelska, J. Pharm. Sci., 2019, 108, 1476–1485 CrossRef CAS PubMed.
- S. Aitipamula, P. S. Chow and R. B. H. Tan, CrystEngComm, 2009, 11, 889–895 RSC.
- S. Aitipamula, P. S. Chow and R. B. H. Tan, Cryst. Growth Des., 2010, 10, 2229–2238 CrossRef CAS.
- S. Aitipamula, P. S. Chow and R. B. H. Tan, CrystEngComm, 2010, 12, 3691–3697 RSC.
- G. Pekoe, K. van Dyke, D. Peden, H. Mengoli and D. English, Agents Actions, 1982, 12, 371–376 CrossRef CAS PubMed.
- M. Wan, J. Fang, J. Xue, J. Liu, J. Qin, Z. Hong, J. Li and Y. Du, Int. J. Mol. Sci., 2022, 23, 8550 CrossRef CAS PubMed.
- A. Scalbert, I. T. Johnson and M. Saltmarsh, Am. J. Clin. Nutr., 2005, 81, S215–S217 CrossRef PubMed.
- S. Quideau, D. Deffieux, C. Douat-Casassus and L. Pouységu, Angew. Chem., Int. Ed. Engl., 2011, 50, 586–621 CrossRef CAS PubMed.
- M. Abbas, F. Saeed, F. M. Anjum, M. Afzaal, T. Tufail, M. S. Bashir, A. Ishtiaq, S. Hussain and H. A. R. Suleria, Int. J. Food Prop., 2017, 20, 1689–1699 CrossRef CAS.
- N. Magaña-Vergara, P. de la Cruz-Cruz, A. Peraza-Campos, F. Martínez-Martínez and J. González-González, Crystals, 2018, 8, 130 CrossRef.
- J. S. González-González, A. M. M. Martínez-Santiago, F. J. Martínez-Martínez, M. J. Emparán-Legaspi, A. Pineda-Contreras, M. Flores-Alamo and H. García-Ortega, Crystals, 2020, 10, 569 CrossRef.
- Y. Xiao, L. Zhou, H. Hao, Y. Bao, Q. Yin and C. Xie, Cryst. Growth Des., 2021, 21, 1202–1217 CrossRef CAS.
- C. Verdugo-Escamilla, C. Alarcón-Payer, F. J. Acebedo-Martínez, R. Fernández-Penas, A. Domínguez-Martín and D. Choquesillo-Lazarte, Crystals, 2022, 12, 798 CrossRef CAS.
- F. H. Allen, Acta Crystallogr., Sect. B: Struct. Sci., 2002, 58, 380–388 CrossRef PubMed.
- F. Acebedo-Martínez, C. Alarcón-Payer, L. Rodríguez-Domingo, A. Domínguez-Martín, J. Gómez-Morales and D. Choquesillo-Lazarte, Crystals, 2021, 11, 1339 CrossRef.
- S. K. Nechipadappu and D. R. Trivedi, J. Mol. Struct., 2018, 1171, 898–905 CrossRef CAS.
- S. K. Nechipadappu, V. Tekuri and D. R. Trivedi, J. Pharm. Sci., 2017, 106, 1384–1390 CrossRef CAS PubMed.
- K. R. Back, R. J. Davey, T. Grecu, C. A. Hunter and L. S. Taylor, Cryst. Growth Des., 2012, 12, 6110–6117 CrossRef CAS.
- R. Khatioda, P. Bora and B. Sarma, Cryst. Growth Des., 2018, 18, 4637–4645 CrossRef CAS.
- K. Moribe, M. Tsuchiya, Y. Tozuka, K. Yamaguchi, T. Oguchi and K. Yamamoto, Chem. Pharm. Bull., 2004, 52, 524–529 CrossRef CAS PubMed.
- V. M. Hariprasad, S. K. Nechipadappu and D. R. Trivedi, Cryst. Growth Des., 2016, 16, 4473–4481 CrossRef CAS.
- S. Aitipamula, P. S. Chow and R. B. H. Tan, Cryst. Growth Des., 2010, 10, 2229–2238 CrossRef CAS.
- J. Li, C. Li, X. Ji, Q. Sun, Z. Li, H. Liu, L. Zhou, D. Jing, J. Gong and W. Chen, New J. Chem., 2022, 46, 8708–8719 RSC.
- S. Aitipamula, P. S. Chow and R. B. H. Tan, Acta Crystallogr., Sect. E: Struct. Rep. Online, 2010, 66, o1045–o1046 CrossRef CAS PubMed.
- K. K. Sarmah, K. Boro, M. Arhangelskis and R. Thakuria, CrystEngComm, 2017, 19, 826–833 RSC.
- R. Khatioda, B. Saikia, P. J. Das and B. Sarma, CrystEngComm, 2017, 19, 6992–7000 RSC.
- J. Potticary, C. Hall, V. Hamilton, J. F. McCabe and S. R. Hall, Cryst. Growth Des., 2020, 20, 2877–2884 CrossRef CAS.
- S. Pagola and P. W. Stephens, Acta Crystallogr., Sect. C: Cryst. Struct. Commun., 2009, 65, o583–o586 CrossRef CAS PubMed.
- C. Loschen and A. Klamt, J. Pharm. Pharmacol., 2015, 67, 803–811 CrossRef CAS PubMed.
- Y. A. Abramov, C. Loschen and A. Klamt, J. Pharm. Sci., 2012, 101, 3687–3697 CrossRef CAS PubMed.
- D. Braga, L. Maini and F. Grepioni, Chem. Soc. Rev., 2013, 42, 7638 RSC.
- E. Espinosa, E. Molins and C. Lecomte, Chem. Phys. Lett., 1998, 285, 170–173 CrossRef CAS.
- A. Heinz, C. J. Strachan, K. C. Gordon and T. Rades, J. Pharm. Pharmacol., 2009, 61, 971–988 CrossRef CAS PubMed.
- G. Perlovich, Acta Crystallogr., Sect. B: Struct. Sci., Cryst. Eng. Mater., 2020, 76, 696–706 CrossRef CAS PubMed.
- R. Khatioda, B. Saikia, P. J. Das and B. Sarma, CrystEngComm, 2017, 19, 6992–7000 RSC.
- R. Khatioda, P. Bora and B. Sarma, Cryst. Growth Des., 2018, 18, 4637–4645 CrossRef CAS.
- D. D. Bavishi and C. H. Borkhataria, Prog. Cryst. Growth Charact. Mater., 2016, 62, 1–8 CrossRef CAS.
- Bruker, APEX3, 2022 Search PubMed.
- G. M. Sheldrick, Acta Crystallogr., Sect. A: Found. Adv., 2015, 71, 3–8 CrossRef PubMed.
- G. M. Sheldrick, Acta Crystallogr., Sect. C: Struct. Chem., 2015, 71, 3–8 Search PubMed.
- O. v. Dolomanov, L. J. Bourhis, R. J. Gildea, J. A. K. Howard and H. Puschmann, J. Appl. Crystallogr., 2009, 42, 339–341 CrossRef CAS.
- A. L. Spek, Acta Crystallogr., Sect. D: Biol. Crystallogr., 2009, 65, 148–155 CrossRef CAS PubMed.
- C. F. Macrae, I. Sovago, S. J. Cottrell, P. T. A. Galek, P. McCabe, E. Pidcock, M. Platings, G. P. Shields, J. S. Stevens, M. Towler and P. A. Wood, J. Appl. Crystallogr., 2020, 53, 226–235 CrossRef CAS PubMed.
- M. J. Frisch, G. W. Trucks, H. B. Schlegel, G. E. Scuseria, M. A. Robb, J. R. Cheeseman, G. Scalmani, V. Barone, B. Mennucci, G. A. Petersson, H. Nakatsuji, M. Caricato, X. Li, H. P. Hratchian, A. F. Izmaylov, J. Bloino, G. Zheng, J. L. Sonnenberg, M. Hada, M. Ehara, K. Toyota, R. Fukuda, J. Hasegawa, M. Ishida, T. Nakajima, Y. Honda, O. Kitao, H. Nakai, T. Vreven, J. A. Montgomery Jr., J. E. Peralta, F. Ogliaro, M. Bearpark, J. J. Heyd, E. Brothers, K. N. Kudin, V. N. Staroverov, R. Kobayashi, J. Normand, K. Raghavachari, A. Rendell, J. C. Burant, S. S. Iyengar, J. Tomasi, M. Cossi, N. Rega, J. M. Millam, M. Klene, J. E. Knox, J. B. Cross, V. Bakken, C. Adamo, J. Jaramillo, R. Gomperts, R. E. Stratmann, O. Yazyev, A. J. Austin, R. Cammi, C. Pomelli, J. W. Ochterski, R. L. Martin, K. Morokuma, V. G. Zakrzewski, G. A. Voth, P. Salvador, J. J. Dannenberg, S. Dapprich, A. D. Daniels, O. Farkas, J. B. Foresman, J. v. Ortiz, J. Cioslowski and D. J. Fox, Gaussian16 (Revision A.03), 2016 Search PubMed.
- J. P. Perdew, K. Burke and M. Ernzerhof, Phys. Rev. Lett., 1996, 77, 3865–3868 CrossRef CAS PubMed.
- S. Grimme, J. Antony, S. Ehrlich and H. Krieg, J. Chem. Phys., 2010, 132, 154104 CrossRef PubMed.
- F. Weigend and R. Ahlrichs, Phys. Chem. Chem. Phys., 2005, 7, 3297 RSC.
- R. F. W. Bader, Chem. Rev., 1991, 91, 893–928 CrossRef CAS.
- T. A. Keith, AIMALL (Version 19.10.12), TK Gristmill Software, Overland Park, KS, USA, 2019 Search PubMed.
- S. F. Boys and F. Bernardi, Mol. Phys., 1970, 19, 553–566 CrossRef CAS.
- Z. M. Efimenko, A. A. Eliseeva, D. M. Ivanov, B. Galmés, A. Frontera, N. A. Bokach and V. Yu. Kukushkin, Cryst. Growth Des., 2021, 21, 588–596 CrossRef CAS.
- L. E. Zelenkov, D. M. Ivanov, E. K. Sadykov, N. A. Bokach, B. Galmés, A. Frontera and V. Yu. Kukushkin, Cryst. Growth Des., 2020, 20, 6956–6965 CrossRef CAS.
- N. S. Soldatova, P. S. Postnikov, V. v. Suslonov, T. Yu. Kissler, D. M. Ivanov, M. S. Yusubov, B. Galmés, A. Frontera and V. Yu. Kukushkin, Org. Chem. Front., 2020, 7, 2230–2242 RSC.
- E. A. Katlenok, M. Haukka, O. V. Levin, A. Frontera and V. Yu. Kukushkin, Chem. – Eur. J., 2020, 26, 7692–7701 CrossRef CAS PubMed.
- A. v. Rozhkov, A. A. Eliseeva, S. v. Baykov, B. Galmés, A. Frontera and V. Yu. Kukushkin, Cryst. Growth Des., 2020, 20, 5908–5921 CrossRef CAS.
- A. v. Rozhkov, I. v. Ananyev, R. M. Gomila, A. Frontera and V. Yu. Kukushkin, Inorg. Chem., 2020, 59, 9308–9314 CrossRef CAS PubMed.
- C. Verdugo-Escamilla, C. Alarcón-Payer, A. Frontera, F. J. Acebedo-Martínez, A. Domínguez-Martín, J. Gómez-Morales and D. Choquesillo-Lazarte, Crystals, 2020, 10, 1088 CrossRef CAS.
- R. Barbas, V. Kumar, O. Vallcorba, R. Prohens and A. Frontera, Crystals, 2020, 10, 1126 CrossRef CAS.
- E. R. Johnson, S. Keinan, P. Mori-Sánchez, J. Contreras-García, A. J. Cohen and W. Yang, J. Am. Chem. Soc., 2010, 132, 6498–6506 CrossRef CAS PubMed.
- J. Contreras-García, E. R. Johnson, S. Keinan, R. Chaudret, J.-P. Piquemal, D. N. Beratan and W. Yang, J. Chem. Theory Comput., 2011, 7, 625–632 CrossRef PubMed.
Footnote |
| † Electronic supplementary information (ESI) available: PXRD, DSC/TG data for the studied cocrystals. CCDC 2247944–2247947. For ESI and crystallographic data in CIF or other electronic format see DOI: https://doi.org/10.1039/d3ce00234a |
| This journal is © The Royal Society of Chemistry 2023 |