
 Open Access Article
 This Open Access Article is licensed under a
 Creative Commons Attribution 3.0 Unported Licence
A homogeneity study on (Ce,Gd)3Ga2Al3O12 crystal scintillators grown by an optical floating zone method and a traveling solvent floating zone method
Tong
Wu
ab,
Ling
Wang
ab,
Yun
Shi
 *ac,
Qian
Zhang
a,
Yifei
Xiong
a,
Qiang
Yuan
a,
Tongtong
Li
a,
Kaicheng
Ma
a,
Hui
Wang
a,
Jinghong
Fang
a,
Jinqi
Ni
a,
Huan
He
a,
Zhenzhen
Zhou
a,
Qian
Liu
ac,
Jianding
Yu
ac and
Jun
Zou
d
*ac,
Qian
Zhang
a,
Yifei
Xiong
a,
Qiang
Yuan
a,
Tongtong
Li
a,
Kaicheng
Ma
a,
Hui
Wang
a,
Jinghong
Fang
a,
Jinqi
Ni
a,
Huan
He
a,
Zhenzhen
Zhou
a,
Qian
Liu
ac,
Jianding
Yu
ac and
Jun
Zou
d
aShanghai Institute of Ceramics, Chinese Academy of Sciences, Shanghai 200050, China. E-mail: shiyun@mail.sic.ac.cn
bCollege of Physical Science and Technology, Central China Normal University, Wuhan 430079, China
cCenter of Materials Science and Optoelectronics Engineering, University of Chinese Academy of Science, Beijing 100049, China
dShanghai Institute of Technology, Shanghai, 201418, China
First published on 29th May 2023
Abstract
1 at% Ce3+-doped Gd3Ga2Al3O12 (GGAG) single crystals were grown by an optical floating zone (OFZ) method and a traveling solvent floating zone (TSFZ) method. To reveal their structure and chemical composition homogeneity, X-ray diffraction (XRD) and high-resolution inductively coupled plasma atomic emission spectrometry (ICP-AES) were conducted on the as-grown Ce:GGAG crystals at 4 different positions along the growth direction. Compared with the Ce:GGAG crystals grown by the OFZ method (Ce:GGAG-OFZ), the Ce:GGAG crystals grown by the TSFZ method (Ce:GGAG-TSFZ) presented better Ce3+ distribution homogeneity which varied from 0.21 to 0.29 at%. However, the segregation coefficient of Ce3+ in Ce:GGAG-OFZ was found to be higher than that in Ce:GGAG-TSFZ, revealing a different solidification rate between them. The comparison study shows that the photoluminescence (PL) intensity of Ce:GGAG-TSFZ is about twice higher than that of Ce:GGAG-OFZ and the maximum light yield (LY) of 35![[thin space (1/6-em)]](https://www.rsc.org/images/entities/char_2009.gif) 340 photons per MeV also occurs in the former. Trap depths were measured to be 0.70 eV and 0.98 eV by TL glow curves. The LY value of Ce:GGAG-TSFZ along the growth direction fluctuated to a lesser extent with respect to that of Ce:GGAG-OFZ; the latter decreases gradually along the growth direction. It is concluded that the TSFZ method helps to improve the homogeneity of crystal composition when growing crystals with multiple compositions or incongruent compounds.
340 photons per MeV also occurs in the former. Trap depths were measured to be 0.70 eV and 0.98 eV by TL glow curves. The LY value of Ce:GGAG-TSFZ along the growth direction fluctuated to a lesser extent with respect to that of Ce:GGAG-OFZ; the latter decreases gradually along the growth direction. It is concluded that the TSFZ method helps to improve the homogeneity of crystal composition when growing crystals with multiple compositions or incongruent compounds.
1 Introduction
Driven by the development of radiation detectors, the core component of nuclear medicine imaging apparatus and other radiation detecting instruments, scintillators which can absorb and convert high-energy radiation (X- or γ-rays, α, β particles) to visible or ultraviolet (UV) photons have attracted worldwide research interests. Light yield (LY), decay time, energy resolution and afterglow of the scintillators are major factors.1–4 In the past decades, bandgap engineering strategy has been successfully used to optimize scintillation performance by adjusting the bandgap energy, electron structure (i.e., energy level position of activators or traps)5–8 and the thermal ionization length of the electron–hole pair9,10 as well. As a representative, Ce3+-doped multiple aluminate garnet compounds, (Ce,Gd)3(Al,Ga)5O12 (Ce:GGAG), have been proposed to be one of the promising scintillators for applications of X-ray detection, medical imaging etc.11–15 The emission of Ce3+ in it is characterized by an electron transition from the lowest 5d (5d1) energy level to the 4f energy level16,17 which could realize both fast decay time and high LY.By the Czochralski (CZ) method,18–20 crack-free Ce:GAGG crystals of 2, 3 and 4 inches were grown. However, an oxygen-rich condition is desired to inhibit the decomposition of Ga2O3 (Ga2O3 → Ga2O + O2), which occurs at high melting temperature,21 whereas it is difficult for the CZ method because of the need to avoid iridium crucible oxidation. The contamination coming from the iridium particles that evaporate during the high melting process and the anoxic environment usually leads to the twisted growth and composition segregation of Ce:GGAG crystals, especially in compositions where the Ga/Al ratio is or lower than 2/3,21 although higher luminescence efficiency occurs since their energy bandgap decreases with Ga content.7 In 2019, Bartosiewicz13et al. reported that the unbalanced substitution of Ga for Al makes the garnet phase thermodynamically unstable and results in the formation of undesired secondary perovskite phases (GdAlO3, GAP). Meanwhile, irregular profiles and opaque morphologies were exhibited as well as heavy segregation occurred, especially in the case of low Ga/Al ratio, which was caused by incongruent melting composition and formation of different phases during the crystal growth process.22 To improve the lattice stability of GAG phase, partial substitution of Ln (Ln = Y, Lu, Tb) with ion radii smaller than Gd3+ at dodecahedral sites has been extensively studied. Light output up to 230% relative to BGO and 20–40 ns decay times were achieved at Ga concentrations of 60–75 at% in Y3Al5−xGaxO12:Ce (YAGG:Ce) scintillator crystals.23 However, components with low Ga ratios are still difficult to obtain in bulk single crystals despite successful preparation in thin films using the liquid epitaxy (LPE) growth method24 with, unfortunately, slow decay of t1/e = 270–280 ns and t1/20 = 1280–1300 ns.
Alternatively, the OFZ method was proposed in the growth of scintillation single crystals. Highly transparent (Lu0.3Gd0.7)2SiO5:Y3+ (5 at%) single crystals were obtained by a laser floating zone (LFZ) technique in air at 10 mm h−1;25 the introduction of Y3+ increased the plasticity, thus reducing stress and therefore minimizing crack formation. Ce:GGAG crystals with low Ga/Al ratio (Ga/Al = 2/3) with a fast scintillation decay time and high ratio of the fast decay component (105 ns/80% + 349 ns/20%) were then obtained.26 Recently, we further optimized the scintillation decay performance of the Ce:GGAG crystal (Ga/Al = 2/3) to 52 ns/48% + 122 ns/52% and the optimum scintillation LY reached 33791 photons per MeV at 0.75 μs time gate by the OFZ method.27 This was attributed to the oxygen-rich environment (100% O2) during the growth process which can suppress Ga2O3 evaporation and formation of oxygen vacancies; the latter would act as shallow traps and degrade the luminescence efficiency and decay.28,29 Besides the growth atmosphere, heating power and rotation rates, the shape of the molten zone and solid–liquid interface are also essential to obtain crack-free crystals with uniform composition distribution.30,31 We explored the TSFZ method30 to grow Ce:GGAG (Ga/Al = 2/3) crystals by using (Gd2O3)x(Al2O3)1−x (x = 25, 27, 29 mol%) ceramic blocks as the traveling solvent. The optimum scintillation decay and LY value reached 64 ns/85%+ 164 ns/15%, 34132 photons per MeV, according to the stable zone.30
The TSFZ method is equivalent to the FZ growth with a solvent by the zone-leveling effect of the zone-melting process.32,33 It was widely used to grow incongruent-melting compounds and solid solutions, such as LaCuO2 superconductors34 and La2/3−xLi3xTiO3/LixLa(1−x)/3NbO3 solid electrolytes.33,35 Recently, Ce-doped Gd2Si2O7 and ZnO:Ga crystal scintillators were also successfully grown by the TSFZ method.36,37 However, the application of the TSFZ method in scintillation crystals is still comparatively rare.
In summary, both OFZ and TSFZ are available to grow Ce:GGAG crystals, especially for compositions with low Ga/Al ratio which are difficult to grow by traditional crystal methods, such as the CZ method, micro-pulling-down (μ-PD) method13etc. Considering the effect of segregation coefficient of Ce3+ ion in GGAG crystal,27,38 the Ce3+ distribution in the parallel and cross-sectional region of the crystals along the growth direction should be different, it would affect the homogeneity of the scintillation performance. In addition, the uneven heat distribution in the crystal volume may induce the formation of a heterogeneous phase,13,22 a homogeneity study on the crystals is essential. In this paper, we selected 4 positions of the crystals grown by the OFZ and TSFZ methods to elucidate the difference. In addition, different from our previous TSFZ work,30 CeO2 and Ga2O3 were added simultaneously into the solvent to investigate the compensation effect of Ce3+ and Ga3+ considering their possible evaporation loss during the crystal growth.
2 Experimental section
2.1. Crystal growth
Commercial CeO2, Gd2O3, Ga2O3 and Al2O3 powders with high purity (>4 N) were used as starting raw materials and mixed according to the composition (Ce0.01Gd0.99)3Ga2Al3O12. Then they were calcined at 1350 °C for 8 h in an air atmosphere. The resultant powders were reground and put into a balloon to form cylindrical shaped rods under a cold isostatic pressure of 70 MPa, after which the rods were sintered at 1600 °C for 8 h in an O2 atmosphere to form feed ceramic rods with high density. Then the feed rods and seed rods were installed in a furnace for crystal growth, as shown in Fig. 1.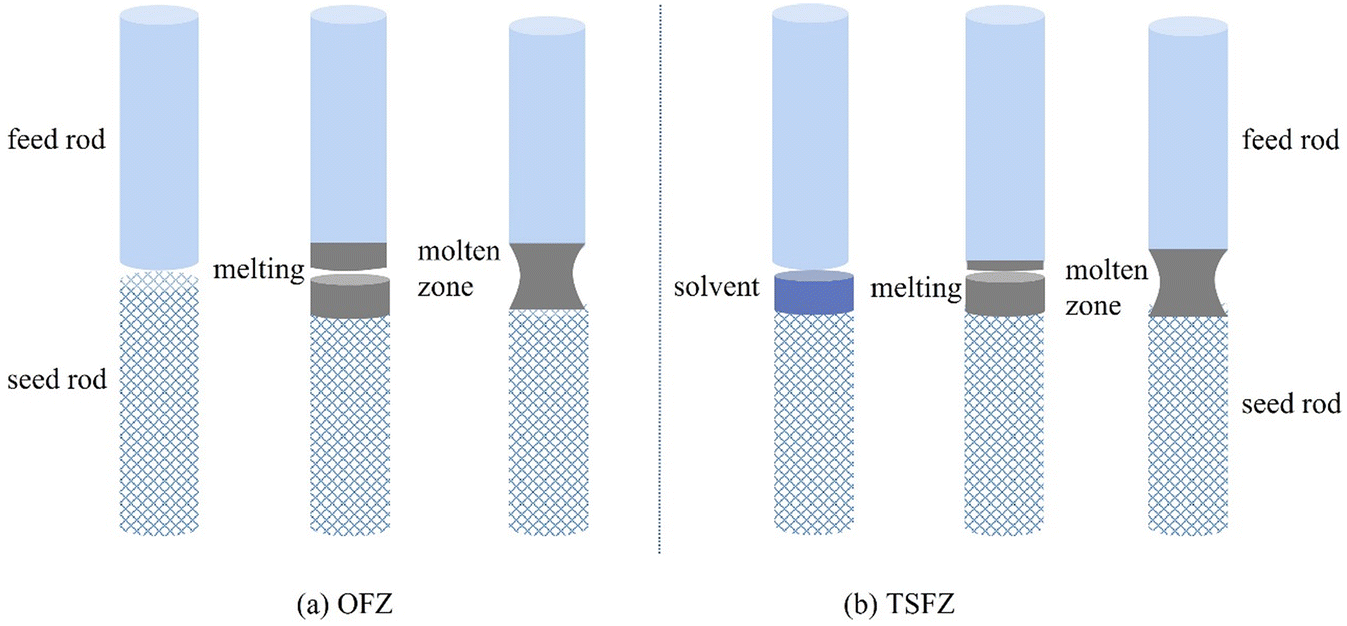 | ||
| Fig. 1 Formation of molten zone established by (a) the OFZ and (b) the TSFZ method. | ||
In addition, for the TSFZ method, the solvent block was fabricated by the same route according to the composition Ce0.01Gd0.99Ga0.55Al2.45O6.015. The solvent rods were sintered at 1500 °C in an oxygen atmosphere for 10 hours in a tube furnace to form ceramic rods which were then cut to a dimension of around ∅ 6 mm × 3 mm. The solvent ceramic rod was put onto the seed rod for the following crystal growth, as shown in Fig. 1(b). Ce:GGAG crystal rods grown by the OFZ method in our previous work27,30 were used as the seed rods.
Crystal growth was carried out in an optical floating zone furnace (Crystal Systems Corporation, FZ-T1000H CSC Cop., Japan) with 4 × 1 kW halogen lamps as infrared radiation sources focused by four polished elliptical mirrors. The program was set to the halogen lamp output power of 2000 W (70%) using the rise rate of 66 W min−1, and then the power was manually tuned until the upper surface of the seed rod (for the OFZ method, see Fig. 1(a)) or solvent blocks (for the TSFZ method, see Fig. 1(b)) melts slightly. Then, in quick succession, the feed rod would move down to achieve an abutting joint. After a while, a stable molten zone formed between the feed rod and the seed rod. The rotation rate of the seed rod and the feed rod was 10–15 rpm, and they rotated in opposite directions to realize full stirring in the molten zone. The crystal growth was carried out in a 3 bar oxygen atmosphere to inhibit the volatilization of Ga2O3 at high temperature. The as-grown Ce:GGAG crystal rods are around 6 mm in diameter. They were cut to wafers along the growth direction for the following measurement; the interval distance between the 4 cuts is 8 mm. All crystals were double face polished to a thickness of 2 mm for absorption spectrum measurement.
2.2. Characterization
Powder X-ray diffraction (PXRD) measurement of (Ce,Gd)3Ga2Al3O12 crystals was carried out in the range of 20–90° using a Rigaku Ultima IV diffractometer (Cu Kα, 40 kV, 40 mA, Rigaku Ultima IV, Japan); the baseline was subtracted using Jade software. The scanning step and rate were 0.02 and 5° min−1, respectively. High-resolution inductively coupled plasma atomic emission spectrometry (ICP-AES) was performed to analyze the composition variation of the as-grown crystals along the growth direction. The absorption spectra were recorded using a Varian Cary 5000 UV-vis-NIR photometer. The photoluminescence (PL) and photoluminescence excitation (PLE) spectra were measured in a Hitachi F-4600 fluorescence spectrometer. X-ray excited luminescence (XEL) spectra were measured using a self-assembled X-ray spectrometer (X-ray tube: 70 kV, 1.5 mA).Thermoluminescence (TL) curves were measured using a thermoluminescent dosimeter (Guangzhou Radiation Science and Technology Co. Ltd., China). The TL spectra were characterized from room temperature to 300 °C. The crystals were in situ radiated with UV light from a xenon lamp. The pulse height spectra were recorded by a Hamamatsu R878 photomultiplier (1 kV) using 662 keV γ-ray excitation (137Cs source) as a radiation source. LY values (photons per MeV) of the as-grown Ce:GGAG crystals were calculated by comparing with a standard Ce:GGAG crystal (LY 58000 photons per MeV, size: 27 mm × 15 mm × 2.37 mm) with a corresponding peak at 481.6 nm, FWHM 33.60, E.R. 6.98%.
3 Results and discussion
3.1. Morphology and quality of the crystals
For incongruently melting compounds, there is a significant composition difference between the solid and the crystalline melt. The solvent composition should be close to the liquidus region of the target composition to obtain sufficient molten zone volume.39,40 Therefore, the solvent of the Al2O3-rich and Gd2O3-poor composition was used to grow 1% Ce:GGAG crystals in this work. Fig. 1 shows the schematic of the crystal growth process by the OFZ and TSFZ methods. During the growth process of the OFZ method, as shown in Fig. 1(a), both the feed rod and seed rod should be melted before junction, and then the feed rod should be quickly put down to form a joint with the seed rod. During the growth process of the TSFZ method, the solvent wafer needs to be melted first and then the upper feed rod was timely moved to stick to the solvent wafer, and in quick succession, they were pulled up together after junction (see Fig. 1(b)).Photographs of the as-grown Ce:GGAG-OFZ and Ce:GGAG-TSFZ crystal rods are shown in Fig. 2. Ce:GGAG-OFZ presents an irregular contour while Ce:GGAG-TSFZ holds a regular shape. It is ascribed to the introduced solvent since the shape of the molten zone was continuously stabilized during the crystal growth process of the TSFZ method with respect to the OFZ method. We can also find the color difference between the as-grown Ce:GGAG-OFZ and Ce:GGAG-TSFZ, and the Ce:GGAG-OFZ rod is more opaque than that of Ce:GGAG-TSFZ (see Fig. 2(c)). It might be due to the possibly slight Ga2O3 evaporation of the feed rod or inhomogeneous composition distribution caused by incongruent melting in Ce:GGAG,18 which might accordingly introduce the variation of growth rate in different directions and thus lead to unstable change of the molten zone during the OFZ method. Comparatively, the molten zone of Ce:GGAG-TSFZ can be formed at a relatively low temperature according to the use of solvent, whereas the Ga2O3 evaporation and incongruent melting were inhibited effectively. In addition, the stable solid–liquid interface and the high temperature gradient near the molten zone can maintain a higher crystallization driving force.37,41
 | ||
| Fig. 2 Photographs of the as-grown (a) Ce:GGAG-OFZ crystal rod, (b) Ce:GGAG-TSFZ crystal rod and (c) their cross section. | ||
3.2. Structure and composition homogeneity
For the application of crystal scintillators, it is also important to have a uniform distribution of the doping elements which will directly affect the consistency and homogeneity of their optical and luminescence performance. The segregation coefficient of the Ce3+ ion in GGAG crystals grown by the CZ method was reported to be K(Ce3+) = 0.36,38 much less than 1. The low segregation coefficient may lead to significant segregation of the dopants in the crystal growth,36 that is, the non-uniform distribution of doped elements.42 We investigated the composition distribution of Ce3+ in the as-grown Ce:GGAG-OFZ and Ce:GGAG-TSFZ crystals by ICP-AES and calculated its segregation coefficient according to the equation:| K0 = CA/Cm | (1) |
| As-grown crystals | Different positions of crystals | Ce:GGAG-OFZ | Ce:GGAG-TSFZ |
|---|---|---|---|
| Experimental Ce (wt%) concentration by ICP-AES | A | 0.24 | 0.13 |
| B | 0.36 | 0.14 | |
| C | 0.34 | 0.11 | |
| D | 0.25 | 0.10 | |
| Calculated Ce (at%) concentration from experimental data of ICP-AES | A | 0.5 | 0.27 |
| B | 0.76 | 0.29 | |
| C | 0.71 | 0.23 | |
| D | 0.52 | 0.21 | |
| Nominal Ce (at%) concentration in crystals | 1 | 1 |
 | ||
| Fig. 3 The variation of Ce3+ concentrations along the crystal growth direction. | ||
Fig. 4 shows the PXRD patterns of the as-grown Ce:GGAG-OFZ and Ce:GGAG-TSFZ. Ceramic solvent with the composition CeO2:Gd2O3:Ga2O3:Al2O3 = 0.01:1:0.55:2.45 was used in the TSFZ method. It is shown that all of the as-grown crystals are in the single cubic garnet phase compared with the standard Gd3Al3Ga2O12 diffraction pattern (PDF #46-0448) and no obvious secondary phase (i.e., GAP) was observed. We calculated its lattice constant through JADE software. It was found that the crystal lattice of Ce:GGAG-TSFZ (lattice constant 12.2096 nm) shrinks compared to that of Ce:GGAG-OFZ (lattice constant 12.2286 nm), which may be attributed to the relatively low concentration of Ce3+ retained in Ce:GGAG-TSFZ. According to the Bragg equation (2dsinθ = nλ), the Ce:GGAG-OFZ crystal with more Ce3+ ions occupied (1.14 Å, 8 coordination number) will lead to lattice expansion since its radius is larger than that of Gd3+ (1.05 Å, 8 coordination number).
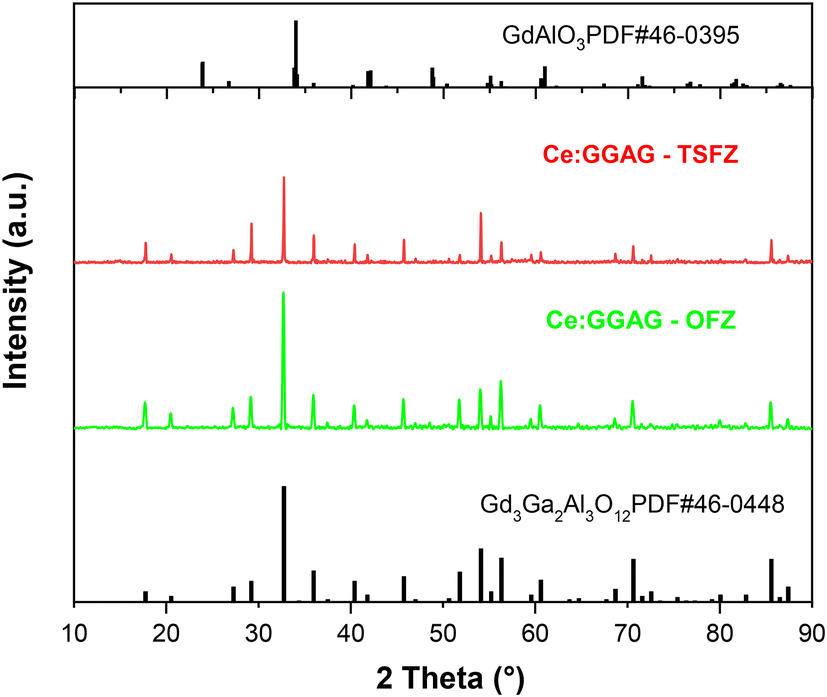 | ||
| Fig. 4 PXRD patterns of the as-grown 1 at% Ce-doped GGAG single crystals. The green line represents Ce:GGAG-OFZ and red line represents Ce:GGAG-TSFZ. | ||
3.3. Optical and luminescence properties
The crystal blocks at 4 different positions along the growth direction were polished to a thickness of 2 to 3 mm for measurement. The absorption spectra in the 200–800 nm range of the Ce:GGAG crystals are shown in Fig. 5. The absorption band peak around 450 nm, which belongs to the transition from the 4f ground state to the 5d1 excited state, is attributed to the allowed electric dipole transition between Ce3+ levels splitting under the crystal field. Broad absorption in the 200–350 nm region may be derived from the overlap of the Ce3+ 4f–5d2,3 transitions, Ce4+ charge transfer (CT) transition and Gd3+ (8S7/2 → 6Ij, 6Pj transitions) related absorption.44–46 In addition, the overall absorption difference in the 500–800 nm range is related to the diffraction or reflection caused by the light scattering sources inside the crystals, such as cracks, inclusions and or other possible defects on the atomic level. In Fig. 4(a), the transmittance in the visible light range of Ce:GGAG-OFZ in the D position is obviously low, which is consistent with its opaque appearance and visible cracks revealed by the cross section photograph in Fig. 2(c). | ||
| Fig. 5 Absorption spectra of (a) Ce:GGAG-OFZ and (b) Ce:GGAG-TSFZ (2 mm thickness). | ||
The PLE and PL spectra of the Ce:GGAG-OFZ and Ce:GGAG-TSFZ crystal powders are shown in Fig. 6. Excitation between 300 and 400 nm can be observed from the PLE spectra for emission at 530 nm which corresponds to the 4f → 5d2 and 4f → 5d1 transition of Ce3+, respectively.45 The sharp lines observed in the 302–313 nm range are ascribed to the 8S7/2 → 6IJ excitation transition of the Gd3+ ion.15 The PL intensity of Ce:GGAG-TSFZ is about twice that of Ce:GGAG-OFZ. According to the ICP test results, the calculated Ce3+ concentration in the as-grown crystals ranged from 0.21 to 0.29 at% (Ce:GGAG-TSFZ, 0.08% variation scale) and 0.50 to 0.76 at% (Ce:GGAG-OFZ, 0.26% variation scale). The results are consistent with our previous study on PL intensity dependence on Ce3+ concentration;27 in that study we found that the PL intensity in the Ce3+ concentration range of 0.11–0.29 at% is higher than that of the 0.2–0.8 at% range. The difference in actual Ce3+ concentration between the different positions may be attributed to (1) composition deviation caused by Ce evaporation. During crystal growth, the feed rod is continuously moved down to the heating area for crystal growth. Considering that the end of the feed rod of crystal growth lasts for a long time at high temperature, the volatilization loss of Ce may be more serious than that in the early and middle stages of growth. (2) The fluctuation of Ce concentration distribution. The variation scale of Ce3+ concentrations in the two methods is 0.08% for the OFZ method and 0.26% for the TSFZ method; in a sense, little has changed.
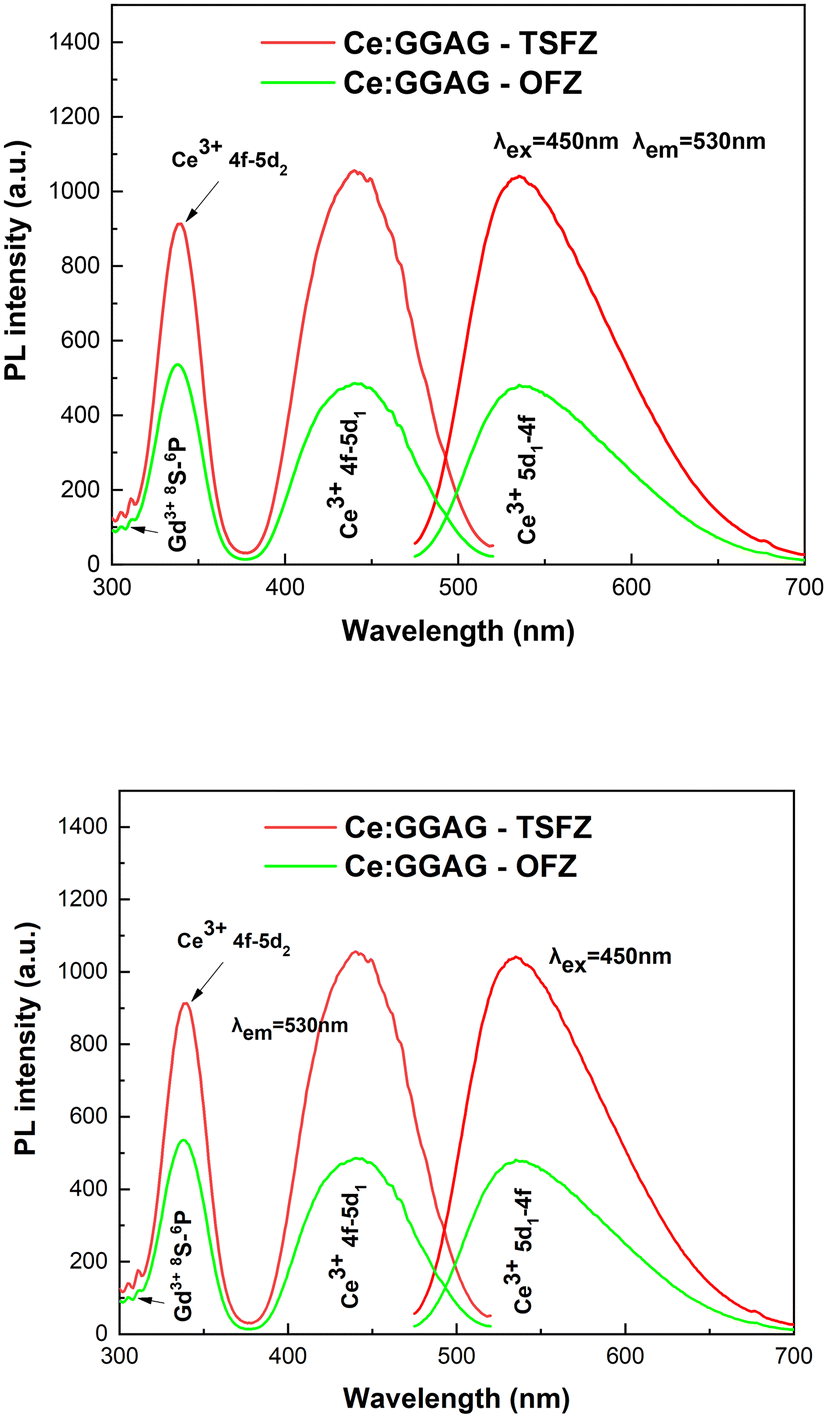 | ||
| Fig. 6 PLE and PL spectra of Ce:GGAG-OFZ (green line) and Ce:GGAG-TSFZ (red line), λex = 450 nm, λem = 530 nm. | ||
In order to clarify the concentration quenching phenomenon more clearly, we investigated the distance (R) between Ce3+–Ce3+ ions according to the formula:47,48
 | (2) |
| As-grown crystals | The distance (R) between Ce3+–Ce3+ ions in GGAG (Å) | Average center distance (Å) | |||
|---|---|---|---|---|---|
| A | B | C | D | ||
| Ce:GGAG-OFZ | 44.12 | 38.37 | 39.25 | 43.55 | 41.32 |
| Ce:GGAG-TSFZ | 54.18 | 52.90 | 57.16 | 58.92 | 55.79 |
3.4. RL and scintillation properties
Fig. 7 shows the RL performance of Ce:GGAG-OFZ and Ce:GGAG-TSFZ at 4 different positions in the growth direction by XEL spectra. The emission at 530 nm corresponds to the 5d–4f transition of Ce3+ ions. An additional emission peak at 710 nm appeared in both Ce:GGAG-OFZ and Ce:GGAG-TSFZ which was also reported in previously published 0.2 at% Ce, Mg:LuAG ceramics and Ce,Eu:Gd3Ga2Al3O12 powders.49,50 It is possibly due to the trace impurities of Cr3+ or Eu3+ introduced from the raw material. The integral XEL intensity of Ce:GGAG-OFZ at 4 different positions decreased gradually, while the trend in Ce:GGAG-TSFZ is disordered, as shown in Fig. 7(c). The detailed mechanism is considered to be related to the difference in actual Ce3+ concentrations in the different positions arising from the different segregation coefficients between the OFZ method and the TSFZ method as well as the different situation of point defects inside the crystals. | ||
| Fig. 7 XEL spectra of (a) Ce:GGAG-OFZ and (b) Ce:GGAG-TSFZ; (c) comparison of the XEL integral intensity. | ||
Scintillation conversion can be divided into three consecutive sub-processes: conversion, transport and luminescence.51 In the sub-processes of transport, electrons and holes (eventually created excitons) migrated through the material, repeated trapping at defects. The electrons and holes stored in traps can escape at a higher temperature by getting enough energy from the lattice vibration. To understand the defect distribution and trap depth, 4 wafers cut along the growth direction were used to record the TL glow curves of the Ce:GGAG-OFZ or Ce:GGAG-TSFZ single crystals.
The trap depths can be estimated according to Randall and Wilkins' method, as shown by eqn (3):52,53
| ε = Tm/500 | (3) |
| As-grown crystals | Trap depth (eV) | |||
|---|---|---|---|---|
| A | B | C | D | |
| Ce:GGAG-OFZ | 0.702 | 0.708 | 0.704 | 0.706 |
| 0.967 | 0.984 | 0.974 | 0.974 | |
| Ce:GGAG-TSFZ | — | — | — | 0.690 |
As shown in Fig. 8 and Table 3, these TL glow peaks occurred at 352 K (trap depth of 0.704 eV) and 490 K (trap depth of 0.984 eV). Meanwhile, the TL intensity of Ce:GGAG-TSFZ crystals was distinctively lower than that of Ce:GGAG-OFZ crystals, which reveals a similar defect type whereas different defect concentration between the Ce:GGAG-TSFZ and Ce:GGAG-OFZ crystals. From the intensity of the TL glow curves, it was found that Ce:GGAG-OFZ exhibited a higher defect concentration than Ce:GGAG-TSFZ, especially for deep traps (trap depth of 0.984 eV); they can introduce energy levels into the forbidden gap and modify/degrade scintillation performance.51 It also can help to explain the XEL intensity difference revealed in Fig. 7c. The obviously decreased TL intensity showed the advantages of the TSFZ method which exhibited lower growth temperature and stable molten zone.27
 | ||
| Fig. 8 TL glow curves of the (a) Ce:GGAG-OFZ and (b) Ce:GGAG-TSFZ crystals after X-ray irradiation at 77 K for 15 min; heating rate 5 K min−1. | ||
The pulse height spectra of the as-grown Ce:GGAG crystals were measured at room temperature under 662 keV γ-rays, as shown in Fig. 9. The results show that the LY values of Ce:GGAG-TSFZ, which were calculated by comparing with the standard Ce:GGAG crystal (LY 58000 photons per MeV, size: 27 × 15 × 2.37 mm3) with a corresponding peak at 481.6 nm, FWHM 33.60, E.R 6.98%, were mostly higher than that of Ce:GGAG-OFZ. As shown in Fig. 10, along the direction of crystal growth, the LY values of Ce:GGAG-OFZ and Ce:GGAG-TSFZ showed comparatively different evolution trends. Similar to the variation of XEL intensity, the LY values of Ce:GGAG-TSFZ in 4 different positions showed less variation than that of Ce:GGAG-OFZ; the latter decreased in a monodirectional way along the crystal growth direction. The results are considered to be attributable to the effect of solvent on the growth process, which can improve Ce3+ distribution homogeneity in the crystal.
 | ||
| Fig. 9 Pulse height spectra of (a) Ce:GGAG-OFZ and (b) Ce:GGAG-TSFZ. The shaping time is 0.75 μs. | ||
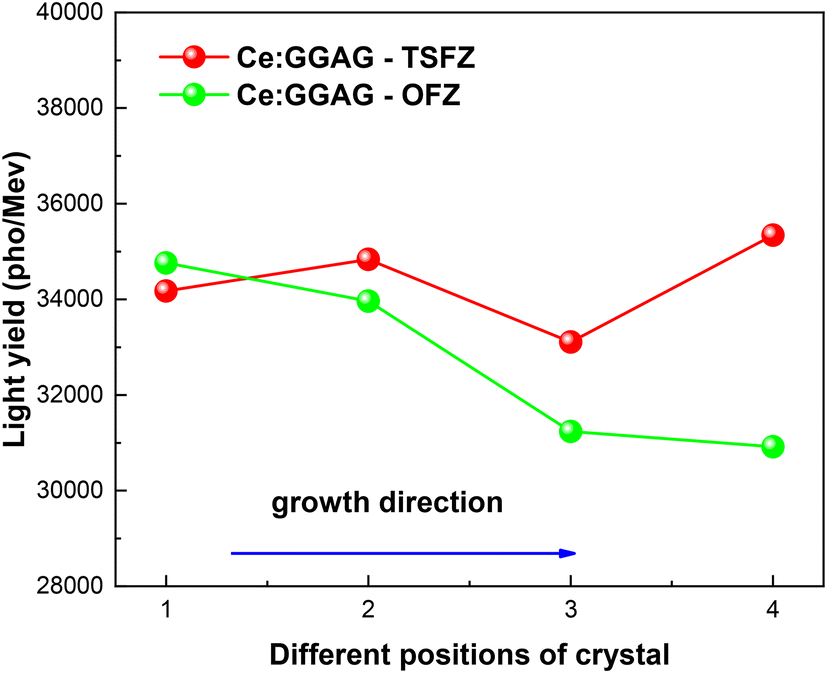 | ||
| Fig. 10 The comparison of LY values of 4 different positions along the crystal growth direction of Ce:GGAG-OFZ and Ce:GGAG-TSFZ. | ||
The concentration of Ce3+ in the crystals is one of the factors which would influence the scintillation light yield. As we have demonstrated in our previous work,24 there is a quenching concentration at around nominal Ce (at%) of 0.6 at%, below which the luminescence intensity or light yield value usually increases with the Ce3+ concentration. However, defects inside the crystals, especially defects in atomic level, are also important factors which would influence the scintillation light yield acting as traps during the conversion, transport and luminescence process which are more complicated and unpredictable.51 We attributed the similar light yield value in the same position of Ce:GGAG-OFZ and Ce:GGAG-TSFZ to the different defect status which compensated for their largely different Ce3+ concentration effect. The growth of Ce:GGAG crystal started from a 1 at% Ce3+ nominal concentration, while the resulting Ce3+ concentrations and scintillation light yield are different in Ce:GGAG-OFZ and Ce:GGAG-TSFZ, as shown in Fig. 3 and 10. It reveals a different interaction between the two methods with respect to the temperature gradient, temperature field fluctuations and environmental factors, which would lead to different status of cracks, color centers, dislocations, inclusions and scattered particles in the as-grown crystals.
4 Conclusions
A comparison study was conducted on 1 at% Ce3+-doped GGAG crystal scintillators grown by the OFZ and TSFZ method. The Ce3+ distribution and PL and RL intensity as well as scintillation LY at 4 different positions along the crystal growth direction were investigated to elucidate the homogeneity of the crystals. The XRD patterns show that all of the as-grown crystals are in the dominant GGAG phase with a cubic garnet structure. According ICP-AES quantitative analysis, the distribution of Ce3+ in Ce:GGAG-TSFZ was found to be more homogeneous (0.08% variation scale) than that of Ce:GGAG-OFZ (0.26% variation scale). The main PL and RL emissions of Ce:GGAG were observed to peak at 540 nm which corresponds to 5d–4f transition of Ce3+ ions. Meanwhile, the PL intensity of Ce:GGAG-TSFZ is higher than that of Ce:GGAG-OFZ. Additionally, the TL glow curves revealed the existence of defects with trap depths of 0.70 eV and 0.98 eV. The LY value of Ce:GGAG-TSFZ in the 4 different parts fluctuates in a small range and the maximum LY reached 35340 photons per MeV which is higher than that of Ce:GGAG-OFZ (34760 photons per MeV). The superior performance of Ce:GGAG-TSFZ with respect to Ce:GGAG-OFZ was ascribed to the stable molten zone realized by the travelling solvent. The stable growth achieved by the TSFZ method is also suspected to be able to increase the extent of Ce3+ segregation and the incongruent melting with respect to the OFZ method and thus lead to a significant improvement of the crystal composition homogeneity. The mechanism of the PL intensity and LY value difference between Ce:GGAG-OFZ and Ce:GGAG-TSFZ was ascribed to the difference in actual Ce3+ concentrations in the as-grown crystals introduced by different Ce3+ segregation coefficients. The results show that the TSFZ method could be a more competitive way to grow Ce:GGAG crystals with low Ga/Al ratio or other crystal scintillators whose melt is incongruent.
Conflicts of interest
There are no conflicts to declare.Acknowledgements
The authors are thankful for the financial support by the National Natural Science Foundation of China (No. 62175249), the Research Program of Shanghai Sciences and Technology Commission Foundation (No. 22511100300, 23DZ2201500) and the Strategic Priority Research Program of the Chinese Academy of Sciences (XDA22010301).References
- M. J. Weber, Inorganic scintillators: today and tomorrow, J. Lumin., 2002, 100, 35–45 CrossRef CAS.
- M. Nikl and A. Yoshikawa, Recent R&D Trends in Inorganic Single-Crystal Scintillator Materials for Radiation Detection, Adv. Opt. Mater., 2015, 3(4), 463–481 CrossRef CAS.
- P. Buechele, M. Richter, S. F. Tedde, G. J. Matt, G. N. Ankah, R. Fischer, M. Biele, W. Metzger, S. Lilliu, O. Bikondoa, J. E. Macdonald, C. J. Brabec, T. Kraus, U. Lemmer and O. Schmidt, X-ray imaging with scintillator-sensitized hybrid organic photodetectors, Nat. Photonics, 2015, 9(12), 843–848 CrossRef CAS.
- T. M. Shaffer, C. M. Drain and J. Grimm, Optical Imaging of Ionizing Radiation from Clinical Sources, J. Nucl. Med., 2016, 57(11), 1661–1666 CrossRef CAS PubMed.
- A. Markovskyi, W. Gieszczyk, P. Bilski, A. Fedorov, K. Bartosiewicz, K. Paprocki, T. Zorenko and Y. Zorenko, Composition engineering of Tb3-xGdxAl5-yGayO12:Ce single crystals and their luminescent, scintillation and photoconversion properties, J. Alloys Compd., 2020, 849, 155808 CrossRef CAS.
- T. Zorenko, V. Gorbenko, S. Witkiewicz-Lukaszek and Y. Zorenko, Luminescent properties of (La,Lu,Gd)3(Al,Sc,Ga)5O12:Ce mixed garnets under synchrotron radiation excitation, J. Lumin., 2018, 199, 483–487 CrossRef CAS.
- K. Kamada, T. Endo, K. Tsutumi, T. Yanagida, Y. Fujimoto, A. Fukabori, A. Yoshikawa, J. Pejchal and M. Nikl, Composition Engineering in Cerium-Doped (Lu,Gd)3(Ga,Al)5O12 Single-Crystal Scintillators, Cryst. Growth Des., 2011, 11(10), 4484–4490 CrossRef CAS.
- M. Fasoli, A. Vedda, M. Nikl, C. Jiang, B. P. Uberuaga, D. A. Andersson, K. J. McClellan and C. R. Stanek, Band-gap engineering for removing shallow traps in rare-earth Lu3Al5O12 garnet scintillators using Ga3+ doping, Phys. Rev. B: Condens. Matter Mater. Phys., 2011, 84, 081102 CrossRef.
- A. V. Gektin, A. N. Belsky and A. N. Vasil'ev, Scintillation Efficiency Improvement by Mixed Crystal Use, IEEE Trans. Nucl. Sci., 2014, 61(1), 262–270 CAS.
- O. Sidletskiy, A. Belsky, A. Gektin, S. Neicheva, D. Kurtsev, V. Kononets, C. Dujardin, K. Lebbou, O. Zelenskaya, V. Tarasov, K. Belikov and B. Grinyov, Structure-Property Correlations in a Ce-Doped (Lu,Gd)2SiO5:Ce Scintillator, Cryst. Growth Des., 2012, 12(9), 4411–4416 CrossRef CAS.
- I. Gerasymov, T. Nepokupnaya, A. Boyarintsev, O. Sidletskiy and S. Tretyak, GAGG:Ce composite scintillator for X-ray imaging, Opt. Mater., 2020, 109, 110305 CrossRef CAS.
- L. Lu, M. Sun, Q. Lu, T. Wu and B. Huang, High energy X-ray radiation sensitive scintillating materials for medical imaging, cancer diagnosis and therapy, Nano Energy, 2021, 79(1), 105437 CrossRef CAS.
- K. Bartosiewicz, V. Babin, K. Kamada, A. Yoshikawa, S. Kurosawa, A. Beitlerova, R. Kucerkova, M. Nikl and Y. Zorenko, Ga for Al substitution effects on the garnet phase stability and luminescence properties of Gd3GaxAl5-xO12:Ce single crystals, J. Lumin., 2019, 216, 116724 CrossRef CAS.
- Y. Boyarintseva, S. Neicheva, P. Zhmurin, P. Arhipov, I. Gerasymov, S. Tkachenko, O. Sidletskiy, V. Baumer, O. Vovk and S. Nizhankovskyi, Optical study of Y3-xGdxAl5O12:Ce crystals grown from the melt, Opt. Mater., 2019, 96, 109283.1–109283.5 CrossRef.
- M. Kučera, M. Nikl, M. Hanuš and Z. Onderišinová, Gd3+ to Ce3+ energy transfer in multi-component GdLuAG and GdYAG garnet scintillators, Phys. Status Solidi RRL, 2013, 7(8), 571–574 CrossRef.
- G. Dantelle, G. Boulon, Y. Guyot, D. Testemale, M. Guzik, S. Kurosawa, K. Kamada and A. Yoshikawa, Research on Efficient Fast Scintillators: Evidence and X-Ray Absorption Near Edge Spectroscopy Characterization of Ce4+ in Ce3+, Mg2+-co-Doped Gd3Al2Ga3O12 Garnet Crystal, Phys. Status Solidi B, 2020, 257, 1900510 CrossRef CAS.
- A. Satoh, N. Kitaura, K. Kamada, A. Ohnishi, M. Sasaki and K. Hara, Time-resolved photoluminescence spectroscopy of Ce:Gd3Al2Ga3O12 crystals, Jpn. J. Appl. Phys., 2014, 53(5S1), 89–100 Search PubMed.
- K. Kamada, S. Kurosawa, P. Prusa, M. Nikl, V. V. Kochurikhin, T. Endo, K. Tsutumi, H. Sato, Y. Yokota and K. Sugiyama, Cz grown 2-in. size Ce:Gd3(Al,Ga)5O12 single crystal; relationship between Al, Ga site occupancy and scintillation properties, Opt. Mater., 2014, 36(12), 1942–1945 CrossRef CAS.
- K. Kamada, Y. Shoji, V. V. Kochurikhin, S. Okumura, S. Yamamoto, A. Nagura, J. Y. Yeom, S. Kurosawa, Y. Yokota, Y. Ohashi, M. Nikl and A. Yoshikawa, Growth and scintillation properties of 3 in. diameter Ce doped Gd3Ga3Al2O12 scintillation single crystal, J. Cryst. Growth, 2016, 452, 81–84 CrossRef CAS.
- V. Kochurikhin, K. Kamada, K. Jin Kim, M. Ivanov, L. Gushchina, Y. Shoji, M. Yoshino and A. Yoshikawa, Czochralski growth of 4-inch diameter Ce:Gd3Al2Ga3O12 single crystals for scintillator applications, J. Cryst. Growth, 2020, 531, 125384 CrossRef CAS.
- M. Meng, Q. Qi, D. Z. Ding, C. J. He, S. W. Zhao, B. Wan, L. Chen, J. J. Shi and G. H. Ren, Twisted Growth, Component Segregation and Characteristics of Gd3(Al,Ga)5O12:Ce Scintillation Crystal, J. Inorg. Mater., 2021, 36(2), 188–196 CrossRef.
- S. Lakiza, O. Fabrichnaya, C. Wang, M. Zinkevich and F. Aldinger, Phase diagram of the ZrO2–Gd2O3–Al2O3 system - ScienceDirect, J. Eur. Ceram. Soc., 2006, 26(3), 233–246 CrossRef CAS.
- O. Sidletskiy, I. Gerasymov, D. Kurtsev, V. Kononets, V. Pedash, O. Zelenskaya, V. Tarasov, A. Gektin, B. Grinyov, K. Lebbou, E. Auffray, V. Dormenev, A. Borisevich and M. Korjik, Engineering of bulk and fiber-shaped YAGG:Ce scintillator crystals, CrystEngComm, 2017, 19(6), 1001–1007 RSC.
- S. Witkiewicz-Lukaszek, V. Gorbenko, T. Zorenko, K. Paprocki, O. Sidletskiy, A. Fedorov, R. Kucerkova, J. A. Mares, M. Nikl and Y. Zorenko, Epitaxial growth of composite scintillators based on Tb3Al5O12: Ce single crystalline films and Gd3Al2.5Ga2.5O12: Ce crystal substrates, CrystEngComm, 2018, 20(28), 3994–4002 RSC.
- F. Rey-García, J. Rodrigues, A. J. S. Fernandes, M. R. Soares, T. Monteiro and F. M. Costa, (Lu0.3Gd0.7)2SiO5:Y3+ single crystals grown by the laser floating zone method: structural and optical studies, CrystEngComm, 2018, 20(45), 7386–7394 RSC.
- A. Yoshikawa, Y. Fujimoto, A. Yamaji, S. Kurosawa, J. Pejchal, M. Sugiyama, S. Wakahara, Y. Futami, Y. Yokota and K. Kamada, Crystal growth and characterization of Ce:Gd3(Ga,Al)5O12 single crystal using floating zone method in different O2 partial pressure, Opt. Mater., 2013, 35(11), 1882–1886 CrossRef CAS.
- T. Wu, L. Wang, Y. Yun Shi, T. Z. Xu, H. Wang, J. H. Fang, J. Q. Ni, H. He, C. Y. Wang, B. Wan, D. Z. Ding, Z. Z. Zhou, Q. Liu, Q. Li, J. D. Yu, X. T. Huang, O. Shichalin and E. K. Papynov, Fast (Ce,Gd)3Ga2Al3O12 Scintillators Grown by the Optical Floating Zone Method, Cryst. Growth Des., 2021, 22(1), 180–190 CrossRef.
- A. Suzuki, S. Kurosawa, J. Pejchal, V. Babin, Y. Fujimoto, A. Yamaji, M. Seki, Y. Futami, Y. Yokota and K. Yubuta, The effect of different oxidative growth conditions on the scintillation properties of Ce:Gd3Al3Ga2O12crystal, Phys. Status Solidi C, 2012, 9(12), 2251–2254 CrossRef CAS.
- S. M. Koohpayeh, D. Fort, A. I. Bevan, A. J. Williams and J. S. Abell, Study of ferromagnetism in Co-doped rutile powders and float-zone grown single crystals, J. Magn. Magn. Mater., 2008, 320(6), 887–894 CrossRef CAS.
- T. Wu, L. Wang, Y. Shi, X. T. Huang, T. Z. Xu, H. Wang, J. H. Fang, J. Q. Ni, H. He, C. Y. Wang, Z. Z. Zhou, Q. Liu, B. Wan, Q. Li, J. D. Yu, M. Yang, H. Y. Li, Y. T. Wu, O. Shichalin and E. K. Papynov, Stable growth of (Ce,Gd)3Ga2Al3O12 crystal scintillators by the traveling solvent floating zone method, CrystEngComm, 2022, 24(11), 2050–2056 RSC.
- M. Higuchi and K. Kodaira, Solid-Liquid Interface Shapes in the Floating-Zone Growth of Rutile Single-Crystals, Mater. Res. Bull., 1994, 29(5), 545–550 CrossRef CAS.
- W. G. Pfann, Principles of Zone-Melting, J. Met., 1952, 4(7), 747–753 CAS.
- Y. Maruyama, S. Minamimure, C. Kobayashi, M. Nagao, S. Watauchi and I. Tanaka, Crystal growth of La2/3-xLi3xTiO3 by the TSFZ method, R. Soc. Open Sci., 2018, 5(12), 181445 CrossRef CAS PubMed.
- A. Mohan, B. Buchner, S. Wurmehl and C. Hess, Growth of single crystalline delafossite LaCuO2 by the travelling-solvent floating zone method, J. Cryst. Growth, 2014, 402, 304–307 CrossRef CAS.
- M. S. Ali, N. Sato, I. Fukasawa, Y. Maruyama, M. Nagao, S. Watauchi and I. Tanaka, Crystal Growth and Characterization of LixLa(1-x)/3NbO3 by the Traveling Solvent Floating Zone Method, Cryst. Growth Des., 2019, 19(11), 6291–6295 CrossRef CAS.
- S. Watauchi, K. Matsuya, M. Nagao, I. Tanaka, S. Kurosawa, Y. Yokota and A. Yoshikawa, Control of the solid-liquid interface during growth of a Ce-doped Gd2Si2O7 crystal by the traveling solvent floating zone method, J. Cryst. Growth, 2017, 468, 465–468 CrossRef CAS.
- Y. F. Ma, Y. Zeng, D. Perrodin, E. Bourret and Y. J. Jiang, Single-Crystal Growth of ZnO:Ga by the Traveling-Solvent Floating Zone Method, Cryst. Growth Des., 2017, 17(3), 1008–1015 CrossRef CAS.
- K. Kamada, T. Yanagida, J. Pejchal, M. Nikl, T. Endo, K. Tsutsumi, Y. Fujimoto, A. Fukabori and A. Yoshikawa, Crystal Growth and Scintillation Properties of Ce Doped Gd3(Ga, Al)5O12 Single Crystals, IEEE Trans. Nucl. Sci., 2012, 59(5), 2112–2115 CAS.
- A. Revcolevschi and J. Jegoudez, Growth of large high-Tc single crystals by the floating zone method: A review, Prog. Mater. Sci., 1997, 42(1–4), 321–339 CrossRef CAS.
- G. J. Zhao, X. H. Zeng, J. Xu, Y. Q. Xu and Y. Z. Zhou, Characteristics of large-sized Ce: YAG scintillation crystal grown by temperature gradient technique, J. Cryst. Growth, 2003, 253(1–4), 290–296 CrossRef CAS.
- R. Parvin, Y. Maruyama, M. Nagao, S. Watauchi and I. Tanaka, Effects of the Mirror Tilt Angle on the Growth of LiCoO2 Single Crystals by the Traveling Solvent Floating Zone (TSFZ) Technique Using a Tilting-Mirror-type Image Furnace, Cryst. Growth Des., 2020, 20(5), 3413–3416 CrossRef CAS.
- H. Ogino, A. Yoshikawa, M. Nikl, A. Krasnikov, K. Kamada and T. Fukuda, Growth and scintillation properties of Pr-doped Lu3Al5O12 crystals, J. Cryst. Growth, 2006, 287(2), 335–338 CrossRef CAS.
- H. D. A. Dabkowski, Crystal Growth of Oxides by Optical Floating Zone Technique, Handbook of Crystal Growth, Springer, 2010, pp. 367–391 Search PubMed.
- L. Trinkler, B. Berzina, D. Jakimovica, J. Grabis and I. Steins, UV-light induced luminescence processes in Al2O3 bulk and nanosize powders, Opt. Mater., 2010, 32(8), 789–795 CrossRef CAS.
- K. Bartosiewicz, V. Babin, K. Kamada, A. Yoshikawa, J. A. Mares, A. Beitlerova and M. Nikl, Luminescence quenching and scintillation response in the Ce3+ doped GdxY3-xAl5O12 (x=0.75, 1, 1.25, 1.5, 1.75, 2) single crystals, Opt. Mater., 2017, 63, 134–142 CrossRef CAS.
- S. P. Liu, X. Q. Feng, Z. W. Zhou, M. Nikl, Y. Shi and Y. B. Pan, Effect of Mg2+ co-doping on the scintillation performance of LuAG: Ce ceramics, Phys. Status Solidi RRL, 2014, 8(1), 105–109 CrossRef CAS.
- G. Blasse, Energy Transfer between Inequivalent Eu2+ Ions, J. Solid State Chem., 1986, 62, 207–211 CrossRef CAS.
- G. Peng, Z. Zou, J. Li, J. Liao and H. Wen, (Gd1-xTbx)3(Al1-yGay)5O12 green phosphors with high quantum yield and low thermal quenching via modulation the Ga3+ admixture, J. Lumin., 2021, 236, 118066 CrossRef CAS.
- A. Yoshikawa, K. Kamada, S. Kurosawa, Y. Shoji, Y. Yokota, V. I. Chani and M. Nikl, Crystal growth and scintillation properties of multi-component oxide single crystals: Ce:GGAG and Ce:La-GPS, J. Lumin., 2016, 169, 387–393 CrossRef CAS.
- J. Barta, V. Cuba, V. Jary, A. Beitlerova, D. Panek, T. Parkman and M. Nikl, Photoinduced Preparation of Bandgap-Engineered Garnet Powders, IEEE Trans. Nucl. Sci., 2018, 65(8), 2184–2190 CAS.
- M. Nikl, Scintillation detectors for X-rays, Meas. Sci. Technol., 2006, 17(4), R37–R54 CrossRef CAS.
- D. Zhou, Z. Wang, Z. Song, F. Wang and Q. Liu, Enhanced Persistence Properties through Modifying the Trap Depth and Density in Y3Al2Ga3O12:Ce3+,Yb3+ Phosphor by Co-doping B3+, Inorg. Chem., 2019, 58(2), 1684–1689 CrossRef CAS PubMed.
- J. T. Randall and M. H. F. Wilkins, Phosphorescence and electron traps-I. The study of trap distributions, Proc. R. Soc. London, Ser. A, 1945, 184(999), 365–389 CAS.
| This journal is © The Royal Society of Chemistry 2023 |