
 Open Access Article
 This Open Access Article is licensed under a Creative Commons Attribution-Non Commercial 3.0 Unported Licence
Nonclassical crystal growth and growth rate hysteresis observed during the growth of curcumin in impure solutions†
K.
Vasanth Kumar
 *ab,
Srinivas
Gadipelli
c,
Kiran A.
Ramisetty‡
a,
Claire
Heffernan§
a,
Andrew A.
Stewart
d,
Vivek
Ranade
a,
Chris
Howard
e and
Dan
Brett
c
*ab,
Srinivas
Gadipelli
c,
Kiran A.
Ramisetty‡
a,
Claire
Heffernan§
a,
Andrew A.
Stewart
d,
Vivek
Ranade
a,
Chris
Howard
e and
Dan
Brett
c
aSynthesis and Solid State Pharmaceutical Centre, Department of Chemical Sciences, Bernal Research Institute, University of Limerick, V94 T9PX, Ireland
bDepartment of Chemical and Process Engineering, University of Surrey, Guildford, GU2 7XH, UK. E-mail: v.kannuchamy@surrey.ac.uk
cElectrochemical Innovation Lab, Department of Chemical Engineering, UCL, London, WC1E 7JE, UK
dDepartment of Chemistry, University College London, 20 Gordon St, London, WC1H 0AJ, UK
eDepartment of Physics & Astronomy, University College London, London WC1E 6BT, UK
First published on 19th April 2023
Abstract
During the growth of crystals in impure solution, impurities can pin the flow of the elementary steps and decrease the growth rate or even arrest the crystal growth. In this work, for the first time, we showed that curcumin crystals can grow in impure solution that contains two structurally similar impurities, following a non-classical crystallisation pathway that deviates from the pinning mechanism. We showed that, in a highly impure solution that contains 20 wt% of impurities, a high supersaturation can initiate the crystal growth via sympathetic nucleation that involves the formation of new growth surfaces on the seed crystals. These new surfaces formed on the seed crystals at the expense of higher supersaturation act like active growth surfaces and dictate the entire crystal growth kinetics especially at lower supersaturations. We showed that, if we can artificially create new surfaces that look like giant macrosteps at the micron scale on the crystal surface, then these macrosteps can not only speed-up the crystallisation rate but also control the rate of transfer of impurities into the bulk crystals.
1. Introduction
Crystal growth occurs due to the accumulation of molecules or atoms in a highly ordered manner to form a crystal lattice. The presence of impurities in the solution often disturbs the growth events and alter the crystal growth kinetics as well as the properties of the produced crystals. Depending on the nature and type, impurities may either increase or decrease the growth rate. Impurities may also lead to a growth behaviour different than that observed in pure solutions. Impurities that decrease the growth rate introduce dead-zones on the crystal surface which stops the flow of the elementary steps.1–6 The growth impedance due to the presence of dead-zones is often explained based on the theoretical concepts of Cabrera and Vermilyea assuming that these zones are created via pinned impurities on the elementary steps.6 Though this classical approach explains the growth behaviour observed in controlled environments, many systems exhibit growth behaviour that highlights that this concept may be too simplistic to capture the growth events.2,3,7–9 Impurity pinning may not always necessarily lead to growth dampening. For example, Land et al. showed the resurrection of growth of pinned elementary steps via propagation of a bunch of monolayers or also called macrosteps.7 The theoretical investigation of Lutsko et al. also showed the possibility of the formation of three-dimensional clusters near impurity pinned zones which eventually transform into macrosteps and overflow on the dead-zones until they encounter the next-dead zone on the crystal surface.8In this work, we found an alternate route occurring at the nanoscale during the crystallization of curcumin (CUR), an industrially important molecule, from its solution that contains two structurally similar impurities, bisdemethoxycurcumin (BDMC) and desmethoxycurcumin (DMC). These crystal growth events occur at a length scale which is large enough to be probed and scaled with a scanning electron microscope (SEM). A series of SEM images collected during the crystal growth of CUR in impure solutions showed the formation of several few nanometer thick and featureless solid structures on one of the crystal facets with the largest surface area, which eventually evolve into nanometre sized crystals with an aspect ratio that differs from the aspect ratio of the seed crystals. Through a carefully designed experimental protocol, we showed that these newly formed nanometre sized structures act like active surfaces and continue to grow from a highly supersaturated solution until they reach saturation via a series of new and unconventional mechanisms that cannot be explained by the established pinning mechanism. In highly impure solutions, these active surfaces seem to be essential for the growth of the seed crystals, especially in the low supersaturation regime as practically no growth or slower growth is observed in the absence of active surfaces. Furthermore, through an innovative partial dissolution and crystal growth technique, we showed that the crystals evolving from the nanoscopic precursors exhibit an accelerated growth rate hysteresis as a function of supersaturation. For the first time we observed that, this accelerated crystal growth rate hysteresis (GRH) controls the impurity transfer into the bulk crystal. These results are extremely important as this new crystallisation mechanism allows the improvement of the batch yield of the crystal growth in impure solutions without adding any additives. In industrial crystallisation, our results are important as they provide a new technique to obtain a product with better purity via the crystal growth process.
2. Results and discussion
2.1. Effect of initial supersaturation and supersaturation on the crystal growth rate of curcumin in impure solutions
In Fig. 1a we show the plot of the overall growth rate of CUR seed crystals in isopropanol (IPA) solution versus the supersaturation ratio for two different initial supersaturations, S = 4.77 and S = 3.8 (see Experimental section 4 for the definition of S). The crystal growth of CUR from the solution of initial supersaturation, S = 4.77, exhibited two growth regimes: in the initial regime over supersaturation from 4.77 to 4.23, the crystals grow at a rapid rate (typically in the range of 4.32 × 10⁻⁶ to 1.75 × 10⁻⁶ g cm−2 min−1) with a remarkably high order (greater than seven according to a power law kinetics) with respect to supersaturation. Typically, such a higher order of crystallisation kinetics means that the growth is associated with mechanisms that cannot be explained by simple classical crystal growth theories which assume that crystals grow via addition (or integration) of adatoms or molecules on the active sites available on the surface of the crystals. In the second regime, which corresponds to the growth observed during the consumption of supersaturation from 4.23 to 1, the order of the crystal growth kinetics with respect to supersaturation was found to be equal to 2.5 with growth rates ranging from 1.75 × 10⁻⁶ to 3.4 × 10⁻⁸ g cm−2 min−1. This is a characteristic value of a crystal growth process limited by a surface integration process.10–12 Merely based on the order of the crystal growth, it is possible to speculate that the growth of CUR seed crystals was limited by the classical surface integration process in the second regime. Meanwhile in the first regime, the growth must be associated with a mechanism that may deviate from the classical crystal growth process. | ||
| Fig. 1 (a) The effect of initial supersaturation and supersaturation on the overall crystal growth rate of CUR at 20 °C in impure solutions. (b) Initial supersaturation versus the overall crystal growth rate of CUR at 20 °C (blue circles/lines represent the plot of Rg of the seed crystals versus initial supersaturation, filled blue circles correspond to the Rg of the parent crystals that started to grow from a solution of So = 4.77, filled green circle corresponds to the Rg of the partially dissolved crystals that are growing from a solution of S ∼ 4.52). | ||
During the growth of CUR seed crystals that started to grow from a solution of low initial supersaturation, S = 3.6, the crystallization kinetics followed a different route (black line in Fig. 1a) to that of seed crystals grown from a solution of higher initial supersaturation (S = 4.77). For instance, when S = 3.4, the growth rate of the seeds growing in solutions of initial supersaturation, S = 4.77 and S = 3.66, was found to be equal to 7.4 × 10⁻⁷ and 5.2 × 10⁻⁷ g cm−2 min−1, respectively. During the consumption of supersaturation from S = 3.8 to 2.94, the growth rate deviates from the growth rate of the seeds that started to grow from a solution of higher initial supersaturation (S = 4.77). Once the supersaturation reached, S = 2.94, the overall growth rate of the seed crystals that started to grow from the solution of initial supersaturation, S = 3.66 is commensurate with the growth kinetics of the seeds that started to grow from a solution of initial supersaturation, S = 3.66. The order of the growth kinetics calculated using the power-law expression was found to be equal to 2.45, which means that the growth kinetics was controlled by the surface integration process. This value is comparable to the growth rate of several organic/inorganic crystals grown via classical crystallisation processes.10,11,13–17
Experimental attempts to perform crystal growth experiments with a solution of initial supersaturation confirms that there is no growth of the seed crystals (Fig. 1b, for a growth rate as a function of the initial supersaturation, So). CUR seeds added to a solution of initial supersaturation, So ≤ 3.5, indicate that there exists no growth zone as a function of initial supersaturation. Practically, we observed no growth of CUR crystals after seeding the solutions of initial supersaturation, So ≤ 3.5. If we compare this particular experimentally-observed fact with the overall growth rate of the crystals (Fig. 1a) that are seeded in a solution of initial supersaturation, So = 4.77 or So = 3.68, it can be realized that crystals not only grow in this solution but also with a much faster rate. Theoretically, for a fixed seed mass and crystal size, the overall growth rate at any supersaturation should remain constant irrespective of the initial concentration (as the growth rate is normalised with respect to the external surface area of the crystals – see Experimental section 4.5). However, during the crystal growth of CUR in impure solutions, there exists an unconventional relationship between the initial supersaturation and the overall growth rate of the CUR crystals. In fact, our results clearly show that the initial supersaturation determines the fate of the growth of the seed crystals and the overall crystal growth kinetics. During the consumption of the supersaturation from S = 3.68 to S = 1.8, we observed a noticeable difference between the growth rates of the crystals (the black line in Fig. 1a) that started to grow in solution of initial supersaturation, So = 4.77 (the blue line in Fig. 1a). On the other hand, the difference between the crystal growth rates of the seed crystals during the consumption of S from 1.8 to saturation concentration was almost negligible.
To expose the effect of initial supersaturation on the growth rate or the fate of the crystal growth rate, we plotted the supersaturation as a function of initial supersaturation, So in Fig. 1b. It clearly exposes the existence of a critical initial supersaturation, So,criticial during the crystal growth of CUR in impure solutions. If So < So,critical, practically no growth of seed crystals can be detected. It is clear from Fig. 1b that there is no growth of seed crystals in the solution of initial supersaturation, So ≤ 3.5. In Fig. 1b, we showed the growth rate of seed crystals that started to grow in a solution of initial supersaturation So = 3.68 and So = 4.77. It is clear that the seed crystals exhibit a growth rate of 7.71 × 10⁻⁷ and 4.33 × 10⁻⁶ g cm−2 min−1 in a solution of initial supersaturation So = 3.68 and 4.77, respectively. Clearly, there exists an unusual relation between the overall crystal growth kinetics and the initial supersaturation of the impure CUR solution.
The absence of growth of seed crystals in the solution of low initial supersaturation (So ≤ 3.5) can be explained based on the classical pinning mechanisms.4,6,9,18,19 According to the classical theory of Cabrera and Vermilyea, even a trace amount of impurity present in the supersaturated solution can adsorb onto the active sites of the growing surface, thereby decreasing the growth rate via the pinning mechanism or can introduce fluctuations in the growth or in many cases even stop the crystal growth.6 Theoretically, in a low supersaturated solution, the crystals tend to grow via the flow of the elementary (typically monolayered) steps. If the impurities are adsorbed onto the terraces or onto the kink sites, then they can create dead-zones that can stop the motion of the elementary steps and thus the growth of the crystals. According to the impurity pinning theory, the flow of elementary steps stops when the average distance between the adsorbed impurities is less than the Gibbs–Thomson diameter and this diameter increases with a decrease in supersaturation.4,6,9,18,19 Our experimental results clearly indicate that the seed crystals added to the impure CUR solution of initial supersaturation, S = 4.77 do not follow the rules of the impurity pinning theory, rather they tend to grow instantaneously after seeding at a rate of 4.33 × 10⁻⁶ g cm−2 min−1 which eventually decreases with an decrease in supersaturation due to the consumption of supersaturation via crystal growth. Likewise, the seed crystals that started to grow from the impure solution of supersaturation, S = 3.8 tend to grow instantaneously at a rate of 2.24 × 10⁻⁸ g cm−2 min−1, although the growth rate is slightly lower than the growth rate of seed crystals that started to grow from a highly supersaturated solution. It must be mentioned here that in all the experiments when the time, t = 0, irrespective of the initial supersaturation, we maintained the ratio of the two structurally impurities to the pure CUR in the supersaturated solution a constant. The absence of growth of seed crystals in impure solutions of initial supersaturations, So < 3.5 and the growth of the seed crystals in So > So,critical clearly expose the effect of initial supersaturation on the growth kinetics of the crystals in impure solutions. The growth of the seeds crystals in impure solutions from our results also clearly indicates that, when So > So,critical, the crystal growth process should have followed a mechanism that cannot be explained theoretically using the pinning mechanism.
To gain insights on this peculiar crystal growth behaviour, we performed microscopic investigations on the surfaces of the crystals obtained from the partial dissolution experiments (the results obtained from partial dissolution experiments are discussed later in section 2.2). For this, we carefully analysed the surface features and the overall morphology of the seeds (Fig. 2) and the samples of the crystals collected at different time intervals during the crystal growth experiments using a scanning electron microscope (SEM). In Fig. 3–5, we showed the SEM images of the crystals collected at different time intervals (such as point A, B, and C of Fig. 1a) during the crystal growth of the seed crystals that started to grow from a solution of So = 4.77. For comparison purposes, we showed the SEM images of the seeds (Fig. 2) used in this work. The SEM images of seeds shown in Fig. 2 clearly indicate that they are needle shaped, the expected crystal habit of form I (FI) CUR crystals.20,21 The crystals collected at point A (Fig. 3) and point B (Fig. 4) of Fig. 1a should expose the morphology of the growing crystals when the supersaturation reached approximately, S = 4.68 and 4.14, respectively. The crystals obtained at point C (Fig. 5) of Fig. 1a correspond to the final crystals collected at the end of the crystal growth experiment or once the concentration of the solution reached the solubility limit (i.e., S = 1).
 | ||
| Fig. 2 (a and b) SEM images of the seed crystals of curcumin (note: seed crystals were obtained via crystallisation assisted by microwave – see section 4.2). | ||
 | ||
| Fig. 3 (a–f) SEM images of the crystals collected at point A of Fig. 1a (at this point S = 4.66 and the amount of supersaturation consumed due to crystal growth is equal to ∼0.11) during the crystal growth process. The green arrows in the SEM images show the newly formed structures on the seed crystals. White arrows show the rough spots observed on the surface of the parent crystals (seeds), which could be the structural precursors of the newly formed crystalline units on the parent seed crystals. | ||
 | ||
| Fig. 4 (a–d) SEM images of the crystals collected at point B in Fig. 1a. The green arrows indicate the approximate thickness of the new crystalline units grown on the parent (seed) crystals. Note: the several nanometer thick crystalline units (only a few are shown by green arrows for the guidance) observed earlier in the crystals shown in Fig. 3, now evolved into micron size thick crystalline structures. | ||
 | ||
| Fig. 5 (a–d) SEM images of the crystals collected at point C in Fig. 1a (at this point the solution concentration will be equal to solubility concentration or S = 1). | ||
From the SEM images in Fig. 3a–f for the crystals collected at point A of Fig. 1a, we noticed the appearance of several few hundred nanometre to micron-size or micrometre thick crystals (some of these units are indicated by green arrows in Fig. 3 for guidance) popping out of the crystal faces. We will show later that these few hundred nanometre thick crystalline units act like active surfaces for the crystal growth. The growth of new nanometre thick structures on the larger sized seed crystals itself is an important and unique growth behaviour which cannot be explained by the classical crystal growth theory. According to the classical crystal growth theories, in a crystal population, individual larger crystals grow at the expense of smaller crystals via Ostwald ripening.6,22 However, the SEM images shown in Fig. 3 expose the fact that the larger crystal favours or allows the formation of several smaller sized, typically few nm thick needle shaped crystal structures on their surfaces.
Another noteworthy observation is that, in the crystals collected at point A in Fig. 1a, we observed several rough spots (we indicated these spots for the readers using white arrows in Fig. 3a, c and f) on all the crystals analysed (only a few are shown here for demonstration purposes) under the scanning electron microscope. We presume that the existence of these rough surfaces observed at the micron scale should correspond to the solid precursors of the needle shaped nanocrystals observed on the surface of the crystals. It is worth mentioning here that, the microscopic analysis of the multiple seed crystals during the analysis time confirmed that the surfaces of the seed crystals are flawless at the micron scale, smooth and there is no evidence for the existence of rough spots or nanocrystals on the surface of the seed crystals. This clearly points towards the experimental fact that these rough solid surfaces and the nanometre thick crystalline structures observed in the crystals collected at point A in Fig. 1a should have formed on the seed crystal surfaces only during the crystal growth process (i.e., after seeding). We also eliminated the possibility of the formation of such new crystalline units on the crystal surface during the sample preparation time by performing few trial experiments where we drop a supersaturated solution on the seed crystals placed on a microscopic slide followed by drying. We then checked the surfaces of these crystals under SEM for the possible existence of any new structural units on the crystal surfaces (these results are not presented in this work). Crystals obtained from these trial experiments do not show any presence of new surface units or rough spots on the crystalline surface that we observed in the crystals collected at point A in Fig. 1a. Furthermore, we observed these rough spots only in the crystals collected at point A and no such structural features were observed in the crystals collected at point B and point C or in the partially dissolved crystals. This essentially confirms the experimental fact that these rough spots should have been formed during the early stage of the crystal growth process. Another key observation from the SEM images in Fig. 3 is that the outgrowth of the several nanometre thick crystals seems to appear predominantly on the slowest growing face {0 0 1} of the CUR crystals, rather than on the fastest growing face (however, no such units were observed in the fastest growing face). Based on this unique structural feature observed on the slowest growing crystal facet, we speculate that, after seeding and during the early stage of the crystal growth, the structurally similar impurities are prone to adsorb preferentially on the fastest growing face (that has the smallest surface area) rather than on the slowest growing face. At this stage, the seed crystals should be desperate to grow in a highly supersaturated solution. If the crystallizing compounds are least adsorbed on the impurity adsorbed growing facets, then it is more likely that they can adsorb and accumulate on the slowest growing facets which also have the highest surface area (as opposed to the fastest growing face that also has the lowest surface area available for the addition of adatoms) that can host more guest or impurity molecules. The accumulated molecules on the slowest growing face of CUR can eventually settle into a stable crystalline form (which appears as rough spots and nanometre thick rod-shaped crystals on this crystalline facet) via heterogeneous nucleation on the seed surface. This type of crystal growth was previously reported in the biological crystallization literature as double nucleation or sometimes called as sympathetic nucleation during crystallisation from melts.22,23 Sympathetic nucleation and double nucleation refer to the process of two-dimensional (2D) nucleation occurring repeatedly on the crystal surface. Typically, crystalline structures evolved via repeated 2D nucleation often exhibit filament, rod or needle shaped structures on the crystal surfaces like the ones observed in our work.21 Based on the SEM images, it can be said that, for the case of CUR, the crystal facets with a larger surface area or the slowest growing crystal facet {0 0 1} predominantly favour the repeated 2D nucleation process as the nanoscopic clusters (or rough spots) and the nanometre sized structures evolved only on this particular facet.
As the kinetics of nucleation is generally faster than the crystal growth, the growth rate of the crystalline structures growing via the repeated 2D nucleation can be expected to be faster than the crystalline structures growing via addition of molecules on the terrace, steps and kink sites of the crystal surface. Earlier reports on the repeated 2D nucleation of biological molecules were associated with a linear growth rate of 1.2 × 10⁻² to 2.4 × 10⁻² cm min−1.24 For the case of CUR, we assumed that the depletion in concentration during the early stages of crystallization (in particular, during the consumption of S from 4.77 to 4.2 – Fig. 1a) was associated with the repeated 2D nucleation, and we calculated the growth kinetics via double nucleation which seems to be remarkably slower and approximately equivalent to 4 × 10⁻⁶ to 3 × 10⁻⁶ g cm−2 min−1. In terms of the linear growth rate, this is equivalent to 5.6 × 10⁻⁴ to 4.2 × 10⁻⁴ cm min−1, respectively. Clearly, our values are much lower than the values reported in the biological literature.24 However, these values seem to match with the growth rate of the organic molecule in its pure solution.12,25 It should be noted here that, the growth rate shown in Fig. 1a was obtained assuming that there is no change in the crystal shape factor during crystal growth. This means that the growth rate shown in Fig. 1a, obtained using a simple mass balance expression (Experimental section 4.6, where we explained the method used to calculate the crystal growth rate), can be taken only as an equivalent overall growth rate of the crystals, as the calculated overall growth rate ignores the existence any non-classical events associated with the crystal growth. This means that the calculated overall growth rate value or its equivalent linear growth rate cannot be cross validated from the difference between the average crystal size of the seed crystals and the final crystal size distribution. Nevertheless, the overall growth rate expressed in terms of g cm−2 min−1 in Fig. 1a can provide a theoretical estimate of the equivalent overall growth rate of the CUR crystals in the impure solutions.
The SEM images (Fig. 4) of the crystals collected at point B in the growth kinetic curve of Fig. 1a showed a slightly different morphology when compared to the crystals (Fig. 3) collected at point A in Fig. 1a. At this point, the consumption of supersaturation, S = 4.77 − 4.14 = 0.63. The SEM images of the crystals collected at point B in Fig. 1a clearly show the outgrowth of few nanometre to micron thick crystals popping out from the slowest growing crystal facet of surfaces of the seed crystals. Specifically, they emerge from the slowest growing facet. Practically there is no evidence of any rough spots or nanoclusters on the crystal facets. The SEM images of the crystals collected at point B in Fig. 1a clearly indicate that the rough surfaces and the new crystalline units observed earlier in the crystals collected at point A now evolved into several nanometre to few micron thick crystal structures or crystalline surface units. Furthermore, a careful analysis of multiple crystals under the SEM showed no evidence for the presence of any rough spots on the crystal surface. This indicates that the growth was due to the growth of the seed crystals and the new surface units that were formed during the initial stages of the crystal growth process. The aspect ratio of these newly crystals that emerged on the surface seed crystals is roughly in the range of 0.022–0.35 (values obtained from the SEM images based on the analysis of up to ∼50 new surface units that emerged from the surface of five seed crystals). In most of the cases, the aspect ratio deviates from the aspect ratio of the actual FI needle shaped CUR crystals (∼0.108).
The outgrowth of new crystalline units with a smaller surface area on the parent seed crystals followed by their growth on the parent seed crystals of nearly >80 μm itself is a noteworthy result. According to Ostwald's rule of growth stages, the individual larger sized crystals grow at the expense of smaller crystals. We expected a similar behaviour during the crystal growth of CUR. Specifically, we expected the surface ripening of smaller crystalline units that were evolving on the parent crystals. However, the SEM images in Fig. 4 clearly show that the earlier formed new crystalline units (observed in the crystals collected at point A in Fig. 1a – see Fig. 3) with a smaller surface area on the parent seed crystals have now evolved into slightly larger crystals (see the green arrows in Fig. 4). The formation of smaller sized new crystalline units observed in crystals collected at point A in Fig. 1a followed by their growth on the larger sized seed crystals exposes the non-classical crystal growth behaviour of CUR. In particular and as pointed out earlier, the microscopy images in Fig. 4 clearly expose the growth of crystals possibly via the sympathetic nucleation or the repeated 2D nucleation.
In the SEM images of the crystals (Fig. 5) collected at point C in Fig. 1a, the new surface units observed earlier in the crystals collected at point A and B in Fig. 1a now fully evolved into crystals with a needle habit that resembles the habit of the parent seed crystals. At this point, the solution reached complete saturation due to the consumption of all the supersaturation via crystal growth. The SEM images clearly show that the final crystals do not possess the actual topological features of the seed crystals as their growth rate was dictated by the outgrowth of the newly formed surface units rather than the uniform growth of the crystal facets. To expose the effect of this observed non-classical crystal growth process on the final size of the crystals, we plotted both the crystal size distribution and the elongation factor of the seeds and the crystals collected at point C in Fig. 1a which are shown in Fig. 6a and b, respectively. The representative images of the seed crystals and the ones collected at point C are shown in Fig. 6c and d, respectively. In terms of the crystal size distribution (see Fig. 6), the crystal size distribution was not greatly altered during the growth. The crystal size distribution of the seed crystals and the crystals collected at point C in Fig. 1a exhibited a unimodal size distribution. The only noticeable difference between the seed crystals and the crystals collected at point C in Fig. 1a is the existence of a small shoulder peak in the crystal size distribution of the crystals obtained from the crystal growth experiments. Based on the mean particle size of the seeds and the crystals collected at point C in Fig. 1a, we calculated the linear growth rate of CUR which was found to be equal to 1.31 × 10⁻⁶ cm min−1. In terms of the overall growth rate, this value will be equal to 1.21 × 10⁻⁷ g cm−2 min−1. The magnitude of the crystal growth rate was approximately equal to the growth rates observed at the supersaturation ranging from ∼3.78 to ∼1.4 values (see Fig. 1a). It is worth mentioning here that the growth rates obtained using the simple mass balance expressions cannot be compared directly to the ones from the crystal size distribution. The Rg values shown in Fig. 1a were obtained assuming that the crystal shape factors remain constant during the growth process. However, the SEM images in Fig. 2–5 clearly show that the CUR crystals grow via the non-classical crystallisation route and the seeds tend to lose the shape factors during the crystal growth process. The SEM images clearly indicate that the growth behaviour of CUR was unique and the consumption in supersaturation must be due to combination of the growth of the surfaces of the seed crystals and the growth of new surfaces formed on the seed crystals via the earlier proposed repeated 2D nucleation mechanism. This means that either the increase in linear growth rate or the overall growth rate will not be proportional to the supersaturation consumed during the growth process. In fact, the distribution of the elongation factor clearly shows that the elongation factor is not retained during the growth process. The narrow distribution of the elongation factor of the seed crystals with a mean elongation value of 0.9 indicates that the seeds possess the expected needle shaped crystal habit. However, for the case of the crystals collected at point C in Fig. 1a, we observed a wide distribution of the elongation factor with a mean value of 0.825. Clearly, this indicates that non-classical growth behaviour alters the overall crystal morphology and thus the crystal shape factors, which agrees with the results observed in the SEM images. These observations clearly point out the fact that the estimated linear growth rate using eqn (5) or the overall growth rate estimated using eqn (7) can be only taken as a value that is equivalent to the overall or linear growth rate of CUR crystals if the growth solely occurred in the absence of any non-classical events (the equations and the calculation procedures are described in detail in section 4.5). Thus, mathematically the Rg values (shown in Fig. 1c) estimated using the simple mass balance can be expected to be higher than the ones (in our case it differs by an order of a magnitude) obtained from the mean value of crystal size distribution.
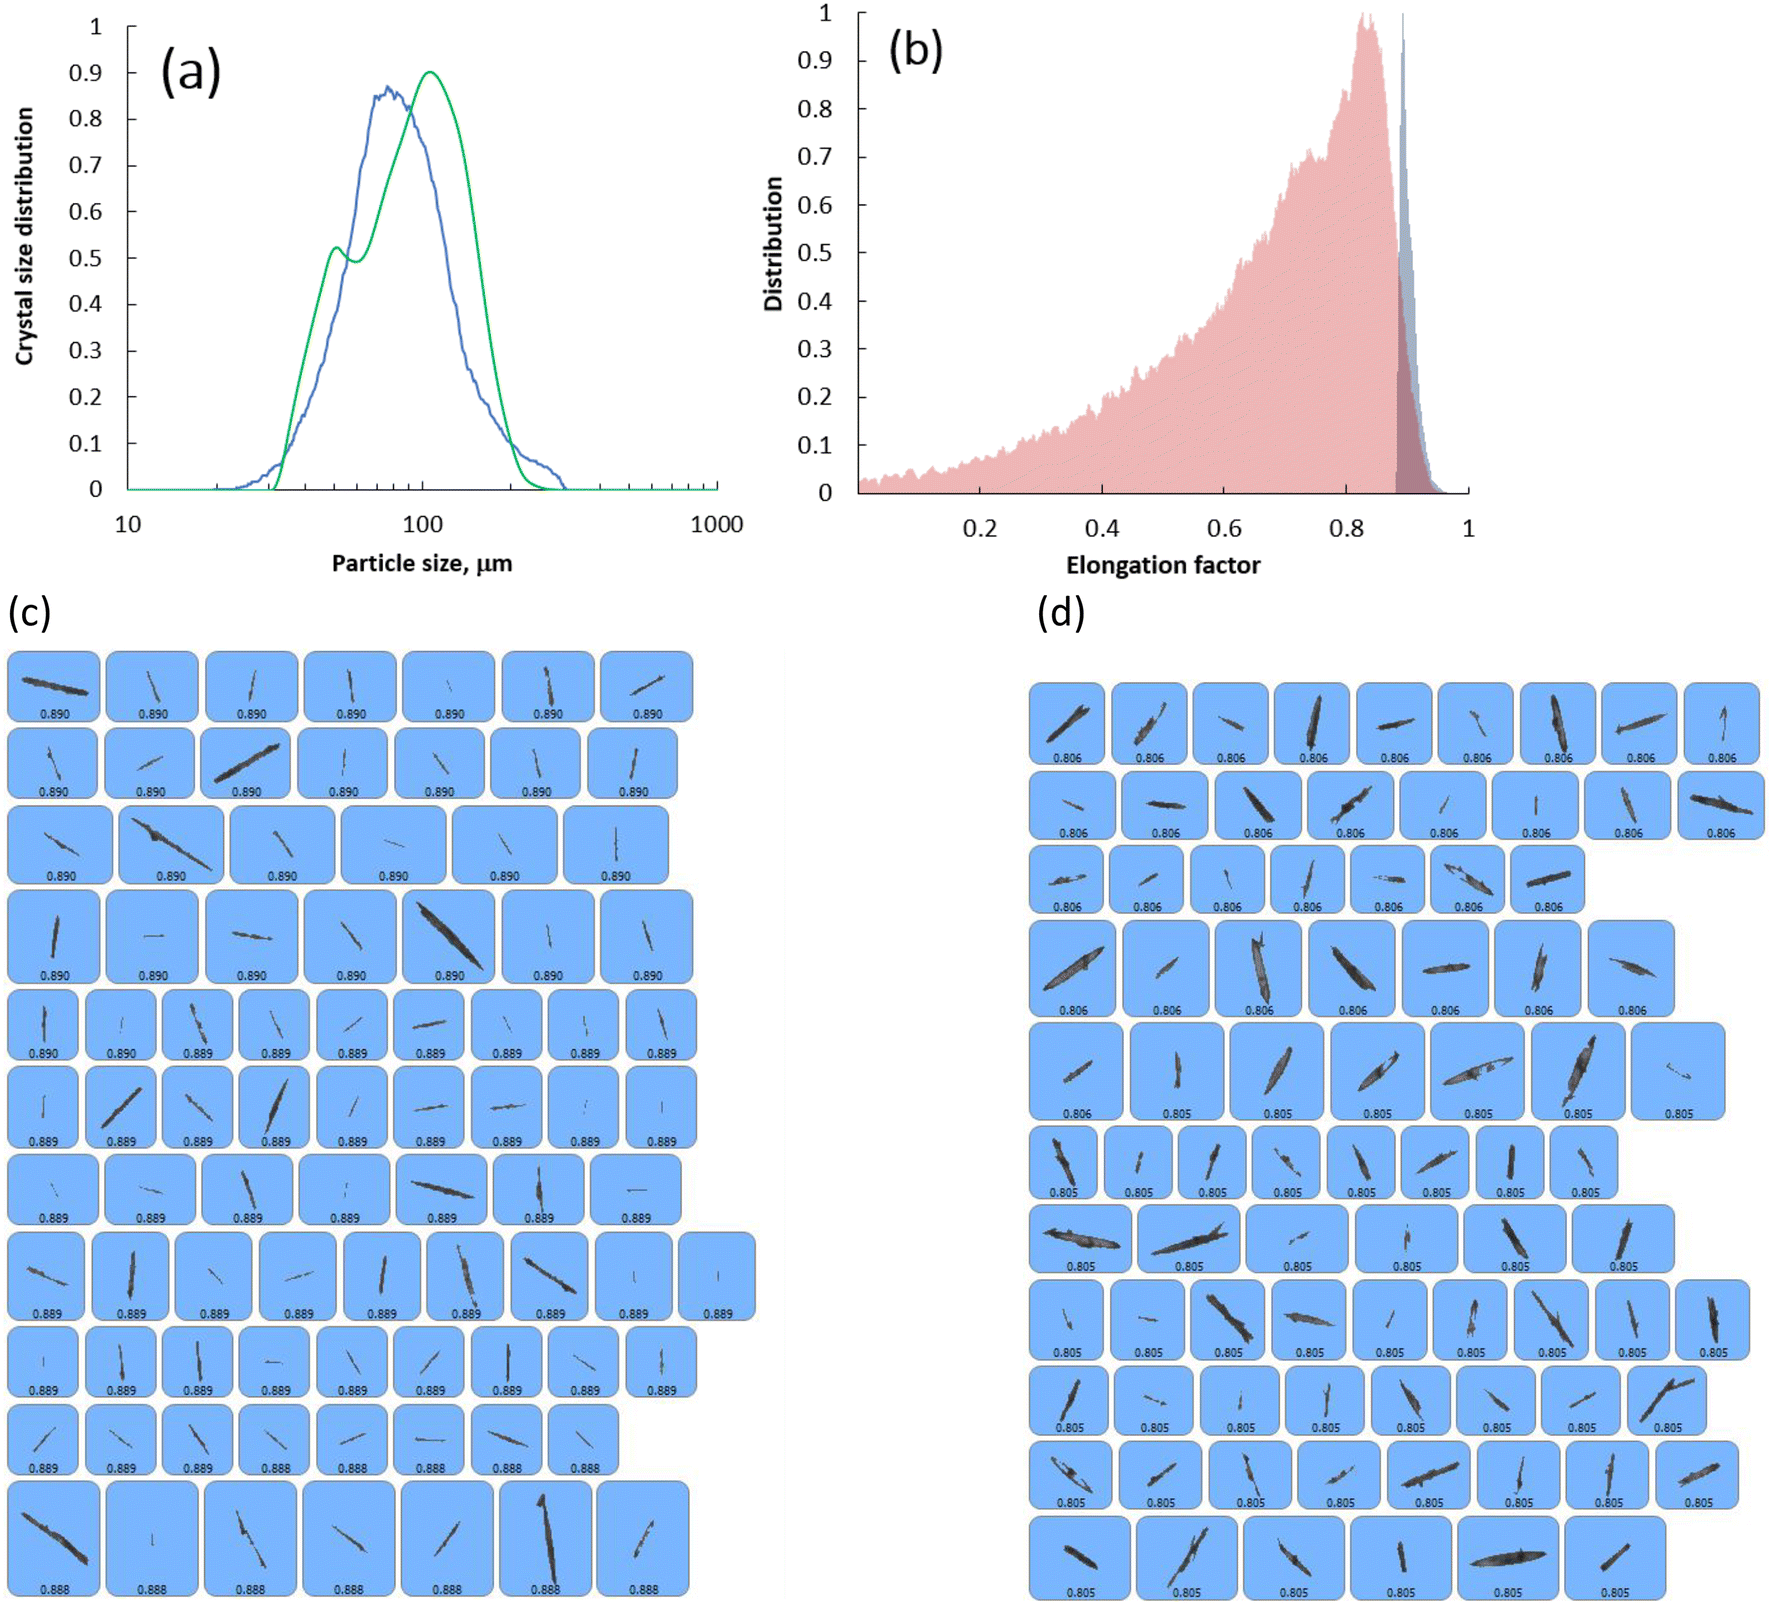 | ||
| Fig. 6 (a) Crystal size distribution of the seed CUR (blue lines) and the crystals collected at point C in Fig. 1a (green line) of the crystal growth experiment. (b) Distribution of elongation factor of the seed CUR (blue shaded area) and the crystals (parent crystals) collected at point C in Fig. 1a (red shaded area). (c) Representative images of seed crystals obtained using the Morphologi G3 system. (d) Representative images of parent crystals collected at point C in Fig. 1a obtained using the Morphologi G3 system. | ||
The unique crystal growth behaviour of CUR that started to grow from a solution of So = 4.77 was not altered when seed crystals started to grow from a supersaturated solution (the black lines in Fig. 1a) of low initial supersaturation, So = 3.8. The SEM images of the final crystals (Fig. 7) that started to grow from a slightly lower supersaturated solution (So = 3.8) are morphologically similar to the ones grown from a solution of higher initial supersaturation (So = 4.77). The final crystals obtained from this batch also contains several nanometre thick to micron thick crystals that emerged from the slowest growing facet {0 0 1} of CUR. According to the power law kinetics, the order of the overall crystal growth kinetics was found to be equal to 2.45. Irrespective of the fact that the SEM images that clearly show the unconventional growth of CUR, the order of the growth kinetics seems to match with the growth of several organic/inorganic crystals in their pure solutions.10,11,13–16 The SEM images of the seed crystals added to the supersaturated solution of initial supersaturation, So ≤ 3.5 (not shown here), which exhibited no crystal growth, show no structural features, like rough spots or active nanocrystals on their surfaces and in fact they look similar to that of the seed crystals. Based on our experimental results, it can be concluded that there exists a critical initial supersaturation, So,critical, above which, it is possible trigger the growth of crystals in impure solutions via the unconventional growth mechanisms like the repeated double nucleation.
 | ||
| Fig. 7 (a and b): SEM images of the final crystals (i.e., once all the supersaturation is consumed and the solution concentration is equal to the solubility concentration) of CUR that started to grow from a solution of initial supersaturation, So = 3.8. | ||
2.2. On the existence of the accelerated crystal growth rate hysteresis
The classical crystal growth model, terrace-step-kink (TSK) model, states that crystals grow in a supersaturated solution via the growth of elementary steps.26 However, as discussed in the earlier sections, if So ≥ So,critical, then the CUR seed crystals tend to grow via the evolution of multiple nanocrystals that emerge on the surfaces of the parent crystal followed by the growth of these new surfaces. Typically, growth of crystals via this type of mechanism hints toward the molecular frustration occurring at the crystal surface that induces the formation of new active surfaces in the form of nanocrystals via the repeated 2D nucleation rather than the growth via addition of adatoms on the active sites. Clearly, the growth kinetics was dictated by the existence of the newly formed active nanocrystals. Typically, the kinetics of such crystal growth processes cannot be explained by the conventional TSK theory for crystal growth as the growth of each crystal was associated with the formation of new nanocrystals which bring a new form of surface heterogeneity among the growing crystals. For instance, the length and width of each newly formed nanocrystals differ from each other and even the number of nanocrystals that appears on the seed crystals also varies from crystal to crystal. To gain more understanding on the crystal growth process itself and to expose the importance and the role of active nanocrystals in the non-classical crystal growth process, we performed a series of the so-called ‘partial dissolution followed by re-crystal growth’ experiments (Experimental section 4.3).For the partial dissolution experiments, once the solution reached saturation (point C in Fig. 1a) we partially re-dissolved the crystals by heating the solution to 40 °C at a heating rate of 0.1 °C min−1 followed by rapid cooling (at a cooling rate of −8 °C min−1) of the solution to the working temperature of 20 °C. This operation will create a solution of supersaturation, S = 1.311 (point D in Fig. 1a) required for the re-crystal growth of the partially dissolved crystals. We assume that the growth of crystals is negligible during the rapid cooling of the solution. For the sake of convenience, to differentiate the partially dissolved crystals which are growing in the impure solutions from the crystals that were freshly added to the supersaturated solution, we will call the latter one as parent crystals. Our experimental results confirmed that, during the consumption of supersaturation from S = 1.311 to S = 1, the crystal growth kinetics of the partially dissolved crystals overlaps (the kinetics of the partially dissolved crystals are not shown in Fig. 1a, as they overlap with each other) with the growth of kinetics of parent crystals that originally started to grow from a solution of initial supersaturation, So = 4.77. In Fig. 8 and 9, we showed the crystals collected at the end of the partial dissolution process (point D in the growth kinetics shown in Fig. 1a) and their regrown versions, respectively. Clearly, the partial dissolution process does not bring any noticeable change to the morphology of the parent crystals collected at point C and in fact the SEM images of the partially dissolved crystals retain the new surface units that are originally formed on the crystal surface via the earlier explained repeated two-dimensional nucleation. Furthermore, the SEM images of the parent crystals collected at point C in Fig. 1a and partially dissolved crystals that are growing from a solution of S = 1.311 (point D in Fig. 1a) resemble each other and in both the cases, the crystals contain the active surface units grown possibly via the repeated two-dimensional nucleation on the crystal facets. This essentially points to the fact that the crystal growth kinetics seems to be predictable and repeatable within this supersaturation range. In fact, the crystal growth kinetics of the partially dissolved crystals from point D to C overlaps with the growth kinetics of the parent crystals that started to grow from a solution of initial supersaturation, So = 4.77. This points to the fact that the characteristic surface features of the crystal population inside the crystalliser are not greatly altered by the partial dissolution process. Furthermore, the results also signify that the number of new crystalline units formed on the crystal surfaces that were originally observed in the crystals collected at point C in Fig. 1a is not greatly altered by the partial dissolution process. In that case, it is less likely that the growth kinetics will be altered during the crystal growth of the partially dissolved crystals in the impure solutions.
 | ||
| Fig. 8 (a and b) SEM images of the crystals collected at point D in Fig. 1a (green arrows show the existence of the newly formed surface units on the parent seed crystal). | ||
 | ||
| Fig. 9 (a–d): SEM images of the regrown crystals collected at point C in Fig. 1a. Note: these crystals were grown at the expense of supersaturation from point D to point C of the growth kinetics shown in Fig. 1a. | ||
To stress the importance of the influence of active surface units on the crystal growth, we performed another partial dissolution followed by the crystal growth of the partially dissolved crystal experiment. This was done by partially dissolving the final crystals obtained from the above experiment by heating the saturated solution (point C in Fig. 1a) to 55 °C at a rate of 0.1 °C min−1 followed by rapid cooling to the working temperature, Tw = 20 °C at 8 °C min−1. This should create a solution of supersaturation, S = 4.52 (this corresponds to point E in the growth kinetics shown in Fig. 1a). The growth kinetics of the partially dissolved CUR crystals observed in this experiment (the green lines in Fig. 1a) completely deviates from the growth kinetics of the seed crystals that started to grow from a solution of high initial supersaturation, S = 4.77 (black lines in Fig. 1a). The overall growth kinetics of the partially dissolved crystals is relatively high when compared to that of the seed crystals that started to grow from a solution of initial supersaturation, S = 4.77. For instance, when S = 3.7, the overall growth rate kinetics of the partially dissolved crystals was roughly twice that of the original seed crystals that started to grow in a solution of initial supersaturation, S = 4.77. The observed significant difference in the crystal growth kinetics between the partially dissolved crystals and the parent seed crystals can be directly attributed to the crystal morphology and the crystallisation mechanisms involved.
In Fig. 10 and 11, we showed the partially dissolved crystals (at 55 °C) and their regrown versions at 20 °C, respectively. Clearly the partial dissolution process (collected at point E in Fig. 1a) changed completely the morphology of the crystals observed earlier in the crystals collected at point C in Fig. 1a (see Fig. 5 and 9). In fact, the crystals lost some of the so-called active surfaces that existed on the fully grown crystals before partial dissolution. The SEM images in Fig. 10 clearly show that the partial dissolution of the crystals at slightly elevated temperature (55 °C) created highly corrugated surfaces that resemble a saw tooth like topology. Clearly, the saw tooth topology like structures can be taken as macrosteps created artificially by the partial dissolution process. Theoretically, during the crystal growth, depending on the external surface area and the attachment energy of the crystal facets, each crystal facet grows at different rates. The presence of several sawtooth like structures clearly shows that the crystals lost the morphology of all the facets and now all the crystal faces contain multiple facets with a saw-tooth like topology especially on the {0 0 1} face of the parent crystals. Clearly the dissolution process takes a completely different mechanistic route to that of the crystal growth process. In terms of crystal growth, the growth rate of the partially dissolved crystals growing from point E to point C in Fig. 1a is faster than the growth rate of the parent crystals at different supersaturation and clearly exhibits a growth rate hysteresis. This itself is a noteworthy result as it clearly shows that, by artificially creating multiple macrosteps on the growing crystal surface via simple partial dissolution the crystal growth rate can be ultimately sped up. The noteworthy observation is that the partially dissolved crystals grow faster at all the supersaturation (from S = 4.52 to S = 1; see the green lines in Fig. 1a) than the actual seed crystals added originally to the solution of initial supersaturation, S = 4.77. This clearly indicates that, under the same experimental conditions, the saw-tooth like structures that contain several macro steps flow faster during the crystal growth when compared to the parent crystals. Clearly, if we observe the growth kinetics of seed crystals (see Fig. 1a) starting from point A to point D and the growth kinetics of partially dissolved crystals starting from point E to point C, there exists a growth rate hysteresis. This type of growth rate hysteresis observed with partially dissolved crystals is observed for the first time during a crystal growth process and we label this peculiar, accelerated growth behaviour as accelerated growth rate hysteresis.
 | ||
| Fig. 10 (a–d): SEM images of the partially dissolved crystals collected at point E of the growth kinetics in Fig. 1a (note: at point E, S = 4.52). | ||
 | ||
| Fig. 11 (a–d) SEM images of the regrown versions of the partially dissolved crystals collected at point C (i.e., at the end of the re-crystal growth experiments) in the growth kinetics shown in Fig. 1a (note: at this point solution concentration will be equal to solubility concentration. The green arrows show the emergence of crystals that are multifaceted with a curved-staircase topology). | ||
It is worth mentioning here that the initial supersaturation dependent crystal growth behaviours and the growth rate hysteresis were observed during the crystallisation of potassium dihydrogen phosphate in the presence of Fe3+ impurities, crystallisation of potassium sulfate in the presence of Cr3+ impurity2,3 and during the growth of the {1 0 0} face of KDP crystals in the presence of Fe3+ ions.2,3,7,9 In all of these studies, the crystal growth was associated with a growth rate hysteresis induced by either the degree of supercooling or by the degree of the initial supersaturation. Using atomic force microscopy, Land et al.,7 showed that the growth of crystals in impure solutions was associated with the flow of macrosteps as opposed to the flow of the elementary steps. They showed that, if the supersaturation is less than the critical supersaturation, then the crystal growth relies on the flow of the elementary steps. As the elementary steps are pinned by the impurities in the solution, the impurities ultimately impede or kinetically arrest the crystal growth. They proved that, if the initial supersaturation is higher than the critical supersaturation, then it creates macrosteps composed of few to several elementary steps. This experimental observation was later theoretically tested by Lutsko et al.8 using kinetic Monte Carlo simulations. Both Land et al. and Lutsko et al. showed that the macrosteps in the crystal surface boast strength in numbers and the velocity of the macrosteps that flows on the crystal surface is due to the sum of the elementary steps which seems to be enough to push the system outside of the kinetic arrest.7,8 Thus, according to the results of Land et al. and Lutsko et al., the macrosteps can effectively reduce the induction time required to push past regions where the elementary steps are pinned by the adsorbed impurities and furthermore the velocity of the flowing macrosteps on the crystal surface is higher than the velocity of the elementary steps by orders of magnitude. If we compare our results with the studies of Land et al., it can be realised that CUR also shows an initial supersaturation-dependent crystal growth rate. In fact, as we are performing isothermal desupersaturation experiments to grow CUR in impure solutions, we observed that the initial supersaturation not only alters the growth rate but also dictates the fate of the seed crystals. In our case, the morphology of the crystals clearly indicates the possible growth of the seed crystals via a repeated 2D nucleation, when So > So,critical. Another noteworthy observation is that, once the active crystalline structures are formed on the surface of the seed crystals at the expense of the high supersaturation, especially during the early stage of crystal growth, then these nanocrystals continue to grow even when the supersaturation drops below the So,critical and eventually they consume all the supersaturation until the solution reaches the solubility concentration. This points to the fact that the growth of the new surfaces created on the surfaces of the seed crystals via the repeated 2D nucleation can be taken as the active growth surface whose growth is solely dictated by the supersaturation of the crystallising compound, irrespective of the impurity concentration in the solution. In the case of partially dissolved crystals, their accelerated growth when compared to the growth of their parent crystals can explained based on the studies of Land et al. discussed above. Based on the saw-tooth topology of the partially dissolved crystals, it can be proposed that these saw-tooth structures resemble a macro-step composed of numerous numbers of elementary steps. Then according to Land et al. these macrosteps should theoretically surpass the kinetics of the parent crystals. To gain insight into the growth mechanism, we collected the fully regrown crystal once the solution concentration reached the solubility concentration (point C in Fig. 1a). The morphology of the fully re-grown crystals collected from the crystalliser at point C of the growth kinetics in Fig. 1a clearly shows that the saw tooth topology was fully resurrected during the re-crystal growth process, although the final structure does not resemble the expected needle shaped morphology. More importantly, the final crystals collected from the partial dissolution and re-crystal growth experiments do not contain any of the active surfaces on the crystal, rather the morphology looks unique. The bulk crystals are multi-facetted with a curved-staircase topology (see the green arrows in the SEM images shown in Fig. 11). These structures should have occurred via the flow of the micron scale sawtooth like structures observed (see Fig. 10) in the partially dissolved crystals during the growth process. During the growth of the seed crystals, followed by the partial dissolution and re-crystal growth of the partially dissolved crystals it clearly shows the existence of a growth rate hysteresis which is slightly different to that of the ones observed by Land et al.,7 Guzman et al.,3 and Kubota et al.2 The evolution of saw-tooth topology to a multi-faceted crystal typically reflects the crystal growth via the parallel addition of adatoms on the terrace, steps and kink sites on the macrosteps that should be composed of elementary steps. Additionally, as macrosteps contain multiple elementary steps, the resultant velocity must be higher than the kinetics of the flow of the elementary steps. This explains the faster growth rate of the partially dissolved crystals when compared to the parent seed crystals.
It is worth mentioning here that the growth kinetics also depend on the crystal polymorph.27,28 Conceptually, different polymorphs grow at different rates due to the different chemistry of the crystalline facets and the attachment energies involved. In this work, during crystallisation we monitored the suspension density using in situ Raman spectroscopy (see section 4.4). In Fig. 12, we showed the Raman spectra of the suspension after the point of seeding and the Raman spectra of the suspension at point A, B, C, D and E in Fig. 1a. For comparison purposes, we also showed the Raman spectra of the form I seed crystals. The Raman spectra collected at different stages of the crystallisation clearly reflect the footprint of form I (FI) CUR and seem to be comparable to the ones reported in the studies of Ukrainczyk et al.29 and Kumar et al.21 This clearly indicates that during the growth of the parent seed crystals and during the growth of the partially dissolved crystals, the suspension contains only FI CUR. To complement the results obtained from the Raman spectra, we also recorded the powder X-ray diffraction pattern (PXRD) of the FI seed crystals and the regrown version of the partially dissolved crystals (collected at point C of the growth kinetics shown in Fig. 1a) which is shown in Fig. 13. For comparison purposes, we also showed the simulated PXRD of FI CUR (BINMEQ04). The diffractogram of the seeds and the final crystals collected at point C (the parent crystals and regrown version of the partially dissolved crystals) of the growth kinetics shown in Fig. 1a reflects the diffraction pattern of the simulated FI CUR. Additionally, the PXRD patterns of the seeds and the crystals collected from the crystal growth experiments also matched with diffractogram of the FI CUR reported in the studies of Ukrainczyk et al.29 and Sanphui et al.20 Clearly there is no polymorphic transformation of CUR during the crystal growth process, which can be expected in seeded crystal growth processes. It is worth mentioning here that FI CUR is the most stable polymorph of CUR and it is least likely to expect a solvent induced polymorphic change during the seeded crystal growth process. Our results point out to the experimental fact that the accelerated growth of the partially dissolved crystals observed during the growth process is solely dictated by the presence of the macrosteps observed on the crystal surface and not by the surface chemistry of the crystal facets. As the PXRD and Raman results clearly reflect solely the characteristic properties of FI curcumin, it can be concluded that the bulk crystals obtained from the crystal growth experiments are essentially FI CUR. Thus, the new surface units formed via the earlier explained repeated two-dimensional nucleation or the surfaces that were resurrecting from the partially dissolved crystals should essentially be the same as those of the FI parent (seed) crystals.
 | ||
| Fig. 12 Raman spectra of the seed CUR and the crystals collected at different stages of crystal growth experiments. | ||
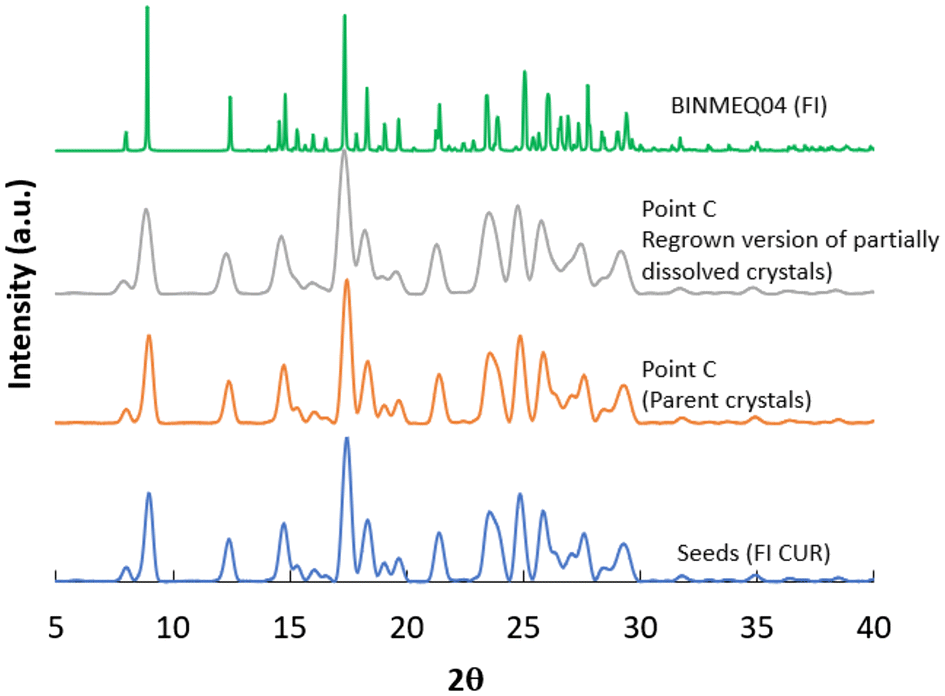 | ||
| Fig. 13 Powder X-ray diffraction (PXRD) of the seeds and the crystals collected at point C in Fig. 1a (both the parent crystals and the regrown versions of the partially dissolved crystals). The simulated diffractogram of FI CUR (BINMEQ04) is shown for comparison purposes. | ||
From the crystallisation and purification point of view, this is a noteworthy data as our results clearly show that the crystal growth rate can be improved without adding any additives but by simply seeding the crystalliser with the seed crystals enriched with macrosteps that are created artificially via partial dissolution. From the purification point of view, this is important as we will show in the later sections (section 2.3) that the rate of impurity transfer into the crystals can be controlled by simply increasing the crystal growth rate with partially dissolved crystals.
2.3. Impurity transfer into the crystal versus crystal growth kinetics
Theoretically, the growth kinetics of a crystal growing in an impure solution can alter the amount of impurities transferred into the crystals during the crystallisation process.30 If the rate of transfer of CUR from the bulk solution to the bulk of the crystal is faster than the residence time of the impurities on the crystal surface, then it is more likely that fewer impurities will be transferred into the bulk of the crystals.21 To test this hypothesis, we checked the concentration of the impurities in the bulk solution during the growth of the parent seed crystals and their partially dissolved crystals in impure solutions. As a case study, we monitored the concentration of the structural impurities, DMC and BDMC, during the growth of the seed (parent) crystals added to the solution of initial supersaturation, So = 4.77 and during the growth of the partially dissolved crystals that started to grow from a solution of supersaturation of S = 4.52 (point E in Fig. 1a).In Fig. 14, we plotted the concentration of the two structurally similar impurities, DMC and BDMC, versus the supersaturation. It can be observed that during the growth of the CUR seed crystals, the concentration of DMC in the bulk of the solution decreases at a much faster rate with respect to the consumption in the supersaturation when compared to the rate of decrease in DMC concentration during the growth of the partially dissolved crystals. During the crystal growth process, the concentration of BDMC remains constant as a function of supersaturation and was found to be equal to the initial concentration of BDMC. This essentially indicates the experimental fact that no BDMC is transferred to the bulk crystal during the growth process. In the previous sections (also see Fig. 1a) we showed that the parent seed crystals grow at a slightly slower rate when compared to the partially dissolved crystals at the same supersaturation. If we compare this result with the concentration of DMC shown in Fig. 13, it can be realised that the crystal growth rate has a noticeable effect on the rate of impurity transfer into the bulk crystals during the growth process. Fig. 14 shows that during the growth of parent seed crystals, the concentration of DMC in the solution at all supersaturations is lower when compared to the concentration of DMC in the solution during the growth of the partially dissolved crystals. This indicates the experimental fact that, during the growth of parent seed crystals, a higher amount of impurities is transferred into the crystals. Meanwhile, during the re-crystal growth of the partially dissolved crystals, a lower amount of impurities is transferred into the crystals. If we correlate this observation with their growth rates, then it can be concluded that the lower the crystal growth rate, the higher the quantity of the impurities transferred into the crystals. Likewise, the faster the crystal growth rate, then the lower the quantity of the impurities transferred into the bulk crystals. The observed less transfer of impurities during the growth of partially dissolved crystals can also be correlated to the actual morphology of these crystals and the associated crystal growth mechanisms. The crystal surfaces of the partially dissolved crystals enriched with macrosteps (see the SEM images shown in Fig. 10) can not only push the growing steps forward, thus dominating the kinetic arrest of the impurities adsorbed on elementary steps, but can also reduce the induction time favouring the repeated formation of a 2D nucleus which can evolve into a three dimensional nucleus that can overflow on the impurity pinned steps (such effects were observed earlier in the work of Lutsko et al.8). In this case, if the rate of impurity adsorption is slower than the velocity of the macrosteps, then the rate of impurity incorporation into the crystals will be less when compared to the impurities incorporated into the crystals growing via the above discussed repeated 2D nucleation mechanism. The relatively higher transfer of impurities into the parent crystals when compared to the impurities transferred into partially dissolved crystals can be due to the involvement of both the target compound and the structurally similar impurities during the formation of the two-dimensional nucleus on the crystal surface. The process of repeated two-dimensional nucleation involves the formation of prenucleation clusters on the crystallising surface. If the prenucleation clusters have selectivity for both the target compound and the impurities, then it is more likely that the structures that evolve from such molecular clusters will contain impurities. This mechanism should affect the growth kinetic rate as the presence of impurities in the prenucleation clusters can interfere with and break the self-assembling pattern of the prenucleation molecular clusters on the surface into a 2D nucleus on the crystal surface. This could be a theoretical reason for the observed growth rate of the parent crystals which is lower than the growth rate of the partially dissolved conditions at all the studied supersaturations. To estimate the purity of the final products, we performed a mass balance based on the concentration of the impurities in the solution at S ∼ 1. According to the mass balance, the percentage (weight%) purity of parent seed crystals and the partially dissolved crystals collected at point C in Fig. 1a is equal to 94.9% and 98.98%, respectively. From the purification point of view, our results clearly show that seeding the supersaturated solution with partially dissolved crystals can be taken as a novel method to control the transfer of impurities and to improve the product quality. At least for the studied system, crystal growth of partially dissolved crystals favours the selective transfer of the target compound and minimises the impurity transfer into the crystals.
 | ||
| Fig. 14 Plot of the concentration of the impurities in the solution versus the supersaturation. Blue circles correspond to the concentration of DMC or BDMC in the solution during the growth of the parent seed crystals. Green circles correspond to the concentration of DMC or DMC during the re-crystal growth of the partially dissolved crystals. Filled circles correspond to the concentration of DMC and the open circles correspond to the concentration of BDMC. | ||
3. Conclusions
Batch crystal growth experiments were carried out to grow CUR crystals in impure solutions that contain two structurally similar impurities. Our results clearly show that in a highly impure solution CUR crystals grow via a non-classical pathway. In a highly supersaturated impure solution, the seed CUR crystals started to grow at the slowest growing face via formation of nanoscopic crystalline clusters which eventually evolved into nanostructures or nanocrystals on the seed surface. These nanocrystals act like active surfaces and eventually dictate the rest of the crystal growth kinetics especially at lower supersaturations. Our results show that these active nanocrystals are essential for the growth of CUR crystals in solutions that contain high concentration of impurities. Importantly, our experimental results also confirm that if the crystals contain the active surfaces, then such crystals can grow even in the presence of impurities in the solution. Batch crystal growth, followed by a partial dissolution and re-crystal growth experiments, exposes the tendency of the partially dissolved crystals to grow faster than the single (seed) crystals. Based on this observation, we conclude that macrosteps created via the partial dissolution of the seed crystals can drive the crystal growth via the flow of macrosteps and control the transfer of impurities into the solution during the crystal growth process. Overall, our experimental results confirm that if the crystals contain active surfaces that can be created on the seed crystals at the expense of high supersaturation or the giant macrosteps that can be created by partial dissolution, then these structural features can drive the crystal growth in impure solutions even if the solution supersaturation is less than the critical supersaturation, thus exhibiting the so-called ‘accelerated crystal growth rate hysteresis’. This type of crystal growth is observed for the first time during the crystal growth of an organic compound in impure solutions and deviates from the earlier observed crystal growth rate hysteresis, where the growth rate hysteresis was associated with the flow of macrosteps at higher supersaturations followed by no growth of crystals at lower supersaturations.Crystallisation via crystal growth is essentially a purification process. The results and analysis presented in this work are important as they point to a possibility of improving the batch purity and yield. Our results clearly show that CUR crystals can be grown (and thus increasing the product yield) in the presence of impurities by simply increasing the initial supersaturation above the critical initial superstation. Furthermore, we propose simple partial dissolution followed by the growth of the partially dissolved crystals as a new strategy to simultaneously increase the growth rate and to control the amount of impurities transferred into the bulk crystals during the crystal growth process.
4. Experimental
4.1. Materials
Crude curcumin of nominal purity was purchased from Sigma-Aldrich. High performance liquid chromatography (HPLC) analysis performed in our laboratory confirmed that the as-received product contains 78.6 wt% CUR, 17.8 wt% DMC, and 3.6 wt% BDMC; the method used for the HPLC analysis is described elsewhere.31,32 For the crystallisation experiments, we used the as-received crude curcumin without further purification.4.2. Preparation of CUR seed crystals
Seed crystals were prepared using cooling crystallisation experiments. For seed preparation, we purposely used an automatic microwave reactor (ATPIO XO-SM100, 0–1000 W) as crystallisation under microwave irradiation produced agglomeration free single crystals (form I). Seed crystals were obtained using a 50 mL jacketed reactor placed within the microwave reactor. Accurately, 0.3 g of pure CUR was dissolved in 50 mL of isopropanol-2 at 75 °C using microwave for 10 min. Then the solution was cooled to a working temperature of 20 °C at a cooling rate of 8 °C min−1. Once the solution reached the working temperature, we set the reactor temperature to 20 °C for 2 h and the jacket temperature to 5 °C for 2 h. This set temperature difference between the jacket temperature and the reactor temperature allowed us to maintain the microwave environment throughout the crystallisation experiment. Once the solution reached 20 °C, we observed primary nucleation in less than 2 min. After 2 h, we collected the final crystals via filtration using Whatman filter paper (no. 1). The filtered crystals were then dried using an oven maintained at a temperature of 60 °C for 24 h. The obtained crystals were used as such as seeds in the crystal growth experiments.4.3. Crystal growth, partial dissolution and re-crystal growth experiments
All the crystal growth experiments were performed in batch mode in a Mettler Toledo 100 mL EasyMax synthesis workstation at the working temperature. A reactor volume of 100 mL was used for all the experiments. Agitation was provided using an overhead (with a pitched blade) stirrer. The temperature inside the crystallizer was maintained using an external jacket that relies on electrical heating and solid-state cooling technology. The agitation speed inside the crystallizer in all the experiments was maintained at 250 rpm. The solution of crude CUR was obtained by dissolving a known mass of crude in 78.6 g of isopropanol-2 solution above the working temperature. All the solids are dissolved by heating the solution to 15 °C above the solubility temperature for 45 min. To create supersaturation, the solution was then cooled down to the working temperature, Tw (20 °C) at a cooling rate of 8 °C min−1. In this work, we performed crystal growth experiments with solutions of five different initial supersaturations, S = 2.8, 2.6, 3.0, 3.6, and 4.77. The term S refers to the supersaturation ratio, defined in terms of the ratio of the initial concentration of CUR in the solution to the solubility concentration at the working temperature, S = c/c*. Irrespective of the initial supersaturation, in all the crystal growth experiments, once the solution reached the working temperature, we immediately seeded the solution with a known mass of CUR crystals. Irrespective of the initial supersaturation, we fixed the seed loading to 10 wt%. After seeding, we maintained the solution temperature at the working temperature for 24 h, which is more than enough to attain complete saturation. During the crystal growth experiments, the suspension density was monitored using in situ Raman spectroscopy that relies on a calibration-free method (see the next section).For partial dissolution experiments, once the solution reached complete saturation, the solution is heated to a fixed temperature, Tf at a slow heating rate of 0.1 °C min−1. Once the solution temperature reached Tf, the solution is then cooled to the working temperature of 20 °C at a rapid cooling rate of 8 °C min−1. The Tf was determined based on the supersaturation value to be achieved during the partial dissolution process that can be obtained from the solubility data of CUR at different temperatures. The rapid cooling rate of 8 °C min−1 was used in this work, both for experimental consistency and to rapidly achieve the working temperature from Tf to avoid any noticeable crystal growth during the cooling process. Once the solution reached the working temperature, then the crystals are allowed to consume all the supersaturation, while the concentration was monitored using in situ Raman spectroscopy.
4.4. Characterisation of the solid phase
The number based crystal size distribution and mean size of the seeds and crystals collected from the crystal growth experiments were measured using a Malvern Morphologi G3SE microscopy image analysis instrument. A standard operating procedure (SOP) was defined to disperse the sample of particles using a sample dispersion unit (SDU) with an area of 5541 mm2 on a glass plate (180 mm × 110 mm) with an injection pressure of 4.0 bar, an injection time of 10 μs, and a settling time of 60 s. Diascopic light was passed from the bottom of the glass plate with automatic light calibration intensity using a set value of 80 and an intensity tolerance of 0.20. The particles were analysed using 5× magnification optics (Nikon TU plan ELWD). The length of the particle, defined as the longest projection of two points on the major axis of the particle 2D area or also called the maximum ferret diameter, was used to determine the average particle size. To improve the statistics, we analysed up to 30![[thin space (1/6-em)]](https://www.rsc.org/images/entities/char_2009.gif) 000 seed crystals to obtain the average seed size. In the SOP, we added a series of procedures to automatically separate aggregated particles that rely on an automatically estimated image threshold value and watershed segmentation method. The SOP reports the number crystal distribution based on the length of the crystal which is defined as the longest projection of two points on the major axis of the particle two-dimensional area.
000 seed crystals to obtain the average seed size. In the SOP, we added a series of procedures to automatically separate aggregated particles that rely on an automatically estimated image threshold value and watershed segmentation method. The SOP reports the number crystal distribution based on the length of the crystal which is defined as the longest projection of two points on the major axis of the particle two-dimensional area.
The morphological features of the CUR crystals were analysed using a scanning electron microscope (SEM). For microscopic analysis, the solid samples were collected at different time intervals using 2 mL polyethylene Pasteur pipettes and then dropped on filter-paper placed on top of a hot-plate maintained at 85 °C. This instantaneously evaporates the solvent leaving the dry crystals on the filter paper. The dry crystals are then pasted on carbon tape mounted on a SEM stage for microscopic analysis. Samples were coated with gold for 1 min, and the images were obtained using an SU70 Hitachi FEG-SEM instrument.
PXRD patterns of the CUR crystals were recorded using a PANalytical Empyrean diffractometer with Cu Kα1 radiation (λ = 1.5406 Å) at 40 kV and 35 mA over the 2θ range of 5–40°, using a step size of 0.1° and total collection time of 15 min. The crystallinity of FI curcumin was confirmed by the flat baseline in the entire range of 2θ = 5–40°.
4.5. Determining the solid concentration and solution concentration using Raman spectroscopy
In situ Raman spectroscopy was used to monitor the concentration of the solids in the crystalliser. Raman spectra were collected using an RXB1 Raman spectrometer from Kaiser Optical Systems, Inc. (Ann Arbor, MI, USA). Backscattered radiation was collected from the sample using a 1/4 in. immersion probe, which is coupled to the spectrometer via a fiber-optic cable. The power at the sample is approximately 150 mW. The probe was immersed in the crystallizer (positioned roughly 2 cm above the vessel base). iC Raman software (Mettler Toledo) was used to monitor and collect the spectra; the measurement region of 150–3425 cm−1 at 786 nm excitation, and the spectral resolution of 4 cm−1. As detailed in our earlier work, a calibration-free method was successfully used to calculate the supersaturation concentration in the solution, ΔC, and the mass crystallised at any time, Mt, in the solution using the expressions| ΔC = C − C* = (It − Io/Io − If) × Mc | (1) |
| Mt = Mc − ΔC | (2) |
![[double bond, length as m-dash]](https://www.rsc.org/images/entities/char_e001.gif) C ring of CUR. This peak was selected purposely, as the intensity of this peak is more sensitive to the change in the solid-phase concentration. The peak intensity of CUR here refers to the height of this band from the two-point baseline that connects 1617 and 1571 cm−1 in the Raman spectra.
C ring of CUR. This peak was selected purposely, as the intensity of this peak is more sensitive to the change in the solid-phase concentration. The peak intensity of CUR here refers to the height of this band from the two-point baseline that connects 1617 and 1571 cm−1 in the Raman spectra.
The term Mt (g) in eqn (2) refers to the mass of CUR transferred from the solution to the seed crystals at any time, t. As the crystalliser already contains seed crystals, the actual mass of crystals in the suspension, Mactual (g), can be calculated using the expression
| Mactual = Mt + Mseeds | (3) |
Likewise, the concentration in the solution, C (g L−1) at any instant of time, t, can be obtained by a simple mass balance.
| C = ΔC + C* | (4) |
4.6. Impurity profiling
The depletion in the concentration of impurities during the crystallization of CUR in impure solutions was monitored in offline mode using HPLC. Samples were taken at different time intervals during crystallization using a 1 mL syringe. The samples were then filtered using a 0.2 μm poly(tetrafluoroethylene) filter, and the concentration of the impurities in the filtrate was quantified (HPLC Agilent Technologies 1260 Infinity Series) using the procedure reported elsewhere.214.7. Calculation of the crystal growth rate
Assuming no spontaneous nucleation and crystal breakage, the mass of the crystals inside the crystallizer at any time was calculated from mass balance. The crystal growth kinetics was estimated from the change in the mass of crystals, Δm, with respect to a given interval Δt.For any time, interval Δt, the linear growth rate of CUR crystals, R, (cm min−1) considering constant supersaturation, was given by:11,19,30,33
 | (5) |
If we assume that there is no crystal breakage or agglomeration, then N is a constant and can be predicted using the expression:11,19,30,33
 | (6) |
000 seed crystals using Morphologi G3 and was found to be approximately equal to 8 × 10⁻³ cm.
The overall growth rate, Rg, (g cm−2 min−1) can be determined using eqn (7) after introducing the shape factors for the CUR crystals:11,19,30,33
 | (7) |
Conflicts of interest
There are no conflicts to declare.Acknowledgements
We acknowledge the financial support of the Science Foundation Ireland (Grant 12/RC/2275, 12/RI/2345/SOF and 18/SIRG/5479).References
- B. Simon and R. Boistelle, J. Cryst. Growth, 1981, 52, 779–788 CrossRef CAS.
- N. Kubota, M. Yokota and L. A. Guzman, in Separation and Purification by Crystallization, ed. G. D. Botsaris and K. Toyokura, American Chemical Society, 1997, pp. 36–44 Search PubMed.
- L. A. Guzman, K. Maeda, S. Hirota, M. Yokota and N. Kubota, J. Cryst. Growth, 1997, 181, 272–280 CrossRef CAS.
- R. J. Davey and J. W. Mullin, J. Cryst. Growth, 1974, 26, 45–51 CrossRef CAS.
- R. Davey, W. Fila and J. Garside, J. Cryst. Growth, 1986, 79, 607–613 CrossRef CAS.
- N. Cabrera and D. A. Vermilyea, in Growth and perfection of crystals, ed. R. Doremus, B. Roberts and D. Turnbell, Wiley, Cooperstown, NY, 1958, pp. 393–410 Search PubMed.
- T. A. Land, T. L. Martin, S. Potapenko, G. Tayhas Palmore and J. J. De Yoreo, Nature, 1999, 399(6735), 442–445 CrossRef CAS.
- J. F. Lutsko, A. E. S. Van Driessche, M. A. Durán-Olivencia, D. Maes and M. Sleutel, Phys. Rev. Lett., 2016, 116, 015501 CrossRef PubMed.
- N. Kubota, M. Yokota, N. Doki, L. A. Guzman, S. Sasaki and J. W. Mullin, Cryst. Growth Des., 2003, 3, 397–402 CrossRef CAS.
- K. Vasanth Kumar, Ind. Eng. Chem. Res., 2009, 48, 7852–7859 CrossRef.
- K. Vasanth Kumar and F. Rocha, Surf. Sci., 2010, 604, 981–987 CrossRef.
- K. Vasanth Kumar, Ind. Eng. Chem. Res., 2009, 48, 11236–11240 CrossRef.
- Ö. Şahin, M. Özdemir, H. Kendirci and A. N. Bulutcu, J. Cryst. Growth, 2000, 219, 75–82 CrossRef.
- I. Khaddour, A. Ferreira, L. Bento and F. Rocha, J. Cryst. Growth, 2012, 355, 17–25 CrossRef CAS.
- A. Ferreira, N. Faria, F. Rocha, S. Feyo de Azevedo and A. Lopes, Chem. Eng. Res. Des., 2005, 83, 331–338 CrossRef CAS.
- A. Ferreira, N. Faria and F. Rocha, Cryst. Res. Technol., 2009, 44, 521–533 CrossRef CAS.
- I. Khaddour, F. Martins and F. Rocha, Chem. Eng. Res. Des., 2011, 89, 2049–2053 CrossRef CAS.
- K. Sangwal, Additives and Crystallization Processes: From Fundamentals to Applications, John Wiley and Sons, 1st edn, 2007 Search PubMed.
- J. W. Mullin, Crystallization, Butterworth-Heinemann, 4th edn, 2001 Search PubMed.
- P. Sanphui, N. R. Goud, U. B. R. Khandavilli, S. Bhanoth and A. Nangia, Chem. Commun., 2011, 47, 5013–5015 RSC.
- K. V. Kumar, K. A. Ramisetty, K. R. Devi, G. R. Krishna, C. Heffernan, A. A. Stewart, J. Guo, S. Gadipelli, D. J. L. Brett, E. P. Favvas and Å. C. Rasmuson, ACS Omega, 2021, 6, 23884–23900 CrossRef CAS PubMed.
- A. Mersmann, Crystallization Technology Handbook, CRC Press, 1st edn, 2001 Search PubMed.
- H. I. Aaronson, G. Spanos, R. A. Masamura, R. G. Vardiman, D. W. Moon, E. S. K. Menon and M. G. Hall, Mater. Sci. Eng., B, 1995, 32, 107–123 CrossRef.
- P. G. Vekilov, Br. J. Haematol., 2007, 139, 173–184 CrossRef CAS PubMed.
- P. Bennema, J. Cryst. Growth, 1968, 3–4, 331–334 CrossRef CAS.
- W. K. Burton, N. Cabrera and F. C. Frank, Philos. Trans. R. Soc., A, 1951, 243, 299–358 CrossRef.
- A. J. Cruz-Cabeza, N. Feeder and R. J. Davey, Commun. Chem., 2020, 3(1), 1–4 CrossRef PubMed.
- A. J. Cruz-Cabeza, S. M. Reutzel-Edens and J. Bernstein, Chem. Soc. Rev., 2015, 44, 8619–8635 RSC.
- M. Ukrainczyk, B. K. Hodnett and Å. C. Rasmuson, Org. Process Res. Dev., 2016, 20, 1593–1602 CrossRef CAS.
- K. Vasanth Kumar, Transfer of impurities into crystals in industrial processes: Mechanism and kinetics, PhD Thesis, University of Porto, 2010 Search PubMed.
- C. Heffernan, M. Ukrainczyk, R. K. Gamidi, B. K. Hodnett and Å. C. Rasmuson, Org. Process Res. Dev., 2017, 21, 821–826 CrossRef CAS.
- C. Heffernan, M. Ukrainczyk, J. Zeglinski, B. K. Hodnett and Å. C. Rasmuson, Cryst. Growth Des., 2018, 18, 4715–4723 CrossRef CAS.
- J. Garside, J. W. Mullin and S. N. Das, Ind. Eng. Chem. Process Des. Dev., 1973, 12, 369–371 CrossRef CAS.
Footnotes |
| † KVK would like to dedicate this manuscript to his late dad Dr V. Kannuchamy. |
| ‡ Present address: MSD Ballydine, Kilsheelan, Clonmel, Co Tipperary, E91 V091, Ireland. |
| § Present address: AstraZeneca, Charter Way, Macclesfield SK10 2NA, United Kingdom. |
| This journal is © The Royal Society of Chemistry 2023 |