
 Open Access Article
 This Open Access Article is licensed under a
 Creative Commons Attribution 3.0 Unported Licence
The pressure and temperature evolution of the Ca3V2O8 crystal structure using powder X-ray diffraction†
Josu
Sánchez-Martín
 a,
Daniel
Errandonea
*a,
Houri Sadat
Rahimi Mosafer
b,
Wojciech
Paszkowicz
b,
Roman
Minikayev
b,
Robin
Turnbull
a,
Marek
Berkowski
b,
Jordi
Ibáñez-Insa
c,
Catalin
Popescu
d,
Andrew
Fitch
e,
Plácida
Rodríguez-Hernández
f and
Alfonso
Muñoz
f
a,
Daniel
Errandonea
*a,
Houri Sadat
Rahimi Mosafer
b,
Wojciech
Paszkowicz
b,
Roman
Minikayev
b,
Robin
Turnbull
a,
Marek
Berkowski
b,
Jordi
Ibáñez-Insa
c,
Catalin
Popescu
d,
Andrew
Fitch
e,
Plácida
Rodríguez-Hernández
f and
Alfonso
Muñoz
f
aDepartamento de Física Aplicada-ICMUV, MALTA-Consolider Team, Universidad de Valencia, Dr. Moliner 50, Burjassot, 46100 Valencia, Spain. E-mail: daniel.errandonea@uv.es
bInstitute of Physics, Polish Academy of Sciences, Aleja Lotnikow 32/46, Warsaw 02-668, Poland
cGeosciences Barcelona (GEO3BCN), Spanish Council for Scientific Research (CSIC), Lluís Solé i Sabarís s/n, 08028 Barcelona, Spain
dCELLS-ALBA Synchrotron Light Facility, Cerdanyola del Vallès, 08290 Barcelona, Spain
eEuropean Synchrotron Radiation Facility, 71 avenue des Martyrs, Grenoble 38000, France
fDepartamento de Física, MALTA-Consolider Team, Instituto de Materiales y Nanotecnología, Universidad de La Laguna, San Cristóbal de La Laguna, E-38200 Tenerife, Spain
First published on 13th January 2023
Abstract
We present a comprehensive experimental study of the crystal structure of calcium vanadate (Ca3V2O8) under systematic temperature and pressure conditions. The temperature evolution (4–1173 K) of the Ca3V2O8 structural properties is investigated at ambient pressure. The pressure evolution (0–13.8 GPa) of the Ca3V2O8 structural properties is investigated at ambient temperature. Across all pressures and temperatures used in the present work, the Ca3V2O8 crystal structure was determined by Rietveld refinement of powder X-ray diffraction data. The experimental high-pressure data are also supported by density-functional theory calculations. According to the high-pressure results, Ca3V2O8 undergoes a pressure-induced structural phase transition at a pressure of 9.8(1) GPa from the ambient pressure trigonal structure (space group R3c) to a monoclinic structure (space group Cc). The experimentally determined bulk moduli of the trigonal and monoclinic phases are, respectively, B0 = 69(2) GPa and 105(12) GPa. The trigonal to monoclinic phase transition appears to be prompted by non-hydrostatic conditions. Whilst the trigonal and monoclincic space groups show a group/subgroup relationship, the discontinuity in the volume per formula unit observed at the transition indicates a first order phase transition. According to the high-temperature results, the trigonal Ca3V2O8 structure persists over the entire range of studied temperatures. The pressure-volume equation of state, axial compressibilities, Debye temperature (264(2) K), and thermal expansion coefficients are all determined for the trigonal Ca3V2O8 structure.
1. Introduction
Calcium vanadate materials exhibit a wide variety of chemical compositions, including calcium orthovanadate (Ca3V2O8), metavanadate (CaV2O6) and pyrovanadate (Ca2V2O7).1–3 Based on their electronic, transport and dielectric properties, calcium vanadates are used in ceramics for potential applications such as electrode materials for green energy storage devices.4–6 In particular, calcium orthovanadate (Ca3V2O8) has been studied as a potential medium for solid-state lasers,7 and it has therefore been doped with various cations, including Sm3+,8 Eu3+,9 Tb3+,10 (Li+, Nd3+),11 and (Tm3+/Ho3+),12 to enhance its lasing properties.At ambient conditions, Ca3V2O8 crystallizes in a trigonal crystal structure (space group R3c).13 Additionally, a monoclinic polymorph of Ca3V2O8 (space group C2/m) has been synthesized under high-pressure (HP) and high-temperature (HT) conditions of 11 GPa and 1373 K.14 This monoclinic polymorph can be recovered from high temperature to ambient conditions. HT experiments have previously been conducted to study the dielectric constant4,15 and vibrational properties16,17 of the monoclinic Ca3V2O8. Temperature-induced changes observed in the experimental Raman spectra have been attributed to structural phase transitions between 550 and 800 K,16 and between 1123 and 1148 K.17 To the best of the authors' knowledge, no low-temperature studies have been reported for Ca3V2O8. Regarding HP Ca3V2O8 studies, room-temperature (RT) HP X-ray diffraction (XRD) and Raman experiments have been reported, finding pressure-induced amorphization between 8.1 and 14.8 GPa.18 One Raman study on the related compound Ca9−xR(VO4)7 (R = La, Nd, Gd) reported signs of partial amorphization around 9–10 GPa.19 According to the results summarized above, the HP behavior of Ca3V2O8 is different from that of other orthovanadates with equivalent chemical formulae. For instance, Zn3V2O8, Ni3V2O8, and Ba3V2O8 remain stable up to at least 15,20 2321 and 29 GPa22 respectively. Mn3V2O8 and Sr3V2O8 exhibit pressure-induced phase transitions around 10 GPa23 and 13.8 GPa22,24 respectively, and Cu3V2O8 chemically decomposes at 1.35 GPa.25 Such different results from various HP studies in the M3V2O8 family, and the apparent contradictions between different HT studies, clearly show that further investigation into the pressure and temperature evolution of the Ca3V2O8 is needed to understand its structural behavior under extreme conditions of pressure and temperature.
In the present study, we characterize the pressure and temperature evolution of the whitlockite-related Ca3V2O8 polymorph by performing synchrotron and in-house X-ray diffraction (XRD) experiments. Firstly, Ca3V2O8 was studied at ambient temperature under high pressure conditions (up to 13.8(1) GPa). Secondly, Ca3V2O8 was studied at ambient pressure between 4(1) and 292(1) K using a synchrotron X-ray source, and at ambient pressure between 300(1) and 1173(1) K using an in-house X-ray diffractometer. The structural models were refined against the observed diffraction data via the Rietveld refinement method.26,27 The structural data extracted from the refined models was used to determine equation of state (EOS) parameters and thermal expansions coefficients. Density-functional theory calculations have been also performed which support the experimental HP observations.
2. Methods
2.1 Experimental details
Ca3V2O8 was synthesized by a solid-state reaction between V2O5 and CaCO3 (99.6% purity). The reactants were mixed in the stoichiometric proportion and formed into a pellet. The pellet was annealed over three consecutive 5 hour periods, with the temperature being 1100(1) K for the first 5 hour period, and 1150(1) K for the other two. The obtained sample was used for all reported experiments. Energy dispersive X-ray spectroscopy analysis, using a scanning electron microscope (Thermo Fisher Scios 2 Dual Beam) equipped with an Oxford Ultima Max 170 detector, confirmed the stoichiometry of the material. No impurities were detected within an accuracy of approximately 1 atomic%. Within this accuracy, the relative ratio of Ca![[thin space (1/6-em)]](https://www.rsc.org/images/entities/char_2009.gif) :V was 3:2 in agreement with the stoichiometry of the compound.
:V was 3:2 in agreement with the stoichiometry of the compound.
The crystal structure of the Ca3V2O8 sample at ambient conditions was verified by powder XRD using a Philips X'Pert Pro Alpha1 diffractometer with a Bragg–Brentano geometry, working in continuous scanning mode, and using Cu Kα1 radiation (λ = 1.54056 Å). The set-up is equipped with a linear photon-counting detector and a primary-beam Johansson monochromator. Powder XRD data were collected over the range of 6–159° (2θ) and recorded increments of 0.0167°. The crystal structure of the obtained compound was refined by the Rietveld method26,27 using the Fullprof software.28 HT XRD experiments were performed in the temperature range 300(1)–1173(1) K using the same set-up and an HTK 1200 N (Anton Paar) temperature stage. In this experiment, XRD data were collected at high temperatures over the range 2θ = 9–87° (2θ).
Low temperature (LT) powder diffraction measurements were performed by high-resolution X-ray powder diffraction at the ID22 beamline at the European Synchrotron Radiation Facility (ESRF) in the temperature range 4(1)–292(1) K using a helium cryostat. The high-resolution diffraction data were collected at LT over the range of 2–40° (2θ) using a wavelength of 0.3998 Å and a nine-crystals multi-analyzer stage.29 XRD patterns were measured from a fine powder of Ca3V2O8 sealed in a 0.5 mm diameter borosilicate glass capillary.
HP powder XRD measurements up to 13.8(1) GPa were carried out at room temperature (RT) using a membrane-type diamond-anvil cell (DAC). A 4:1 ratio methanol–ethanol mixture (ME) was used as the pressure-transmitting medium (PTM). The pressure was determined using the equation of state of copper (Cu)30 with a precision of ±0.1 GPa. We performed angle-dispersive powder XRD measurements under HP at the MSPD beamline of the ALBA synchrotron31 using a monochromatic beam of wavelength 0.4246 Å. The X-ray beam was focused to a 20 μm × 20 μm (FWHM) spot. A Rayonix CCD detector was used to collect XRD patterns, with a sample-detector distance of 280 mm. The structural analysis was performed using FullProf28 and PowderCell.32
2.2 Ab initio density-functional theory calculations
First-principles simulations have proven to be a very powerful technique for studying materials under high pressure.33 In this study ab initio simulations were carried out within the framework of density-functional theory (DFT) with the Vienna ab initio Simulation Package (VASP).34–36 Calculations were implemented within the framework of the generalized-gradient approximation (GGA) using the Perdew–Burke–Ernzerhof for solids (PBEsol) functional37 to describe the exchange-correlation energy. Interactions between valence and core electrons were treated using the projector-augmented-wave (PAW) scheme.38 All calculations have been carried out with temperature T = 0 K and without including dispersion corrections. We have tested including the Grimme D3 corrections, but under this approximation we obtained an equilibrium volume which agrees worse with experiments than the volume obtained without dispersive corrections. The equilibrium volume is 2% larger than in experiments when the Grimme D3 corrections are included and only 0.5% smaller than in experiments when they are not included. Based on this result and the fact that calculations without dispersive corrections usually works well to describe the changes induced by pressure in the crystal structure of vanadates,39,40 we decided to neglect dispersion corrections in our simulations. Finite temperature calculations are beyond the scope of the present work. To solve the Schrödinger equation with high accuracy we used a plane wave basis set using an energy cutoff of 540 eV. The integrations over the Brillouin zone (BZ) of the two studied structures were calculated with a dense Monkhorst–Pack41 grid of 4 × 4 × 4 special k-points. The unit-cell parameters and the atomic positions were fully optimized at different volumes to obtain, at selected fixed volumes, the crystal structure. Pressure is obtained in our simulations from the stress tensor. During optimization we requested that the forces on the atoms were less than 0.003 eV Å−1, and the deviations of the stress tensors from a diagonal hydrostatic form were lower than 0.1 GPa. This procedure allows us to obtain a set of volume, energy, and pressure data from our simulations determining the crystal structure at different pressures.42 Lattice-dynamics calculations were performed using the direct force constant approach using the Phonopy package.43 To calculate the phonon dispersion, we used a 2 × 2 × 2 supercell to study the dynamical stability of the system under pressure. These calculations were performed with the aim of testing the dynamical stability of the calculated crystal structure. The mechanical properties were evaluated by computing the elastic constants with the method implemented in the VASP code.443. Results and discussion
3.1 Crystal structure at ambient conditions
XRD patterns acquired at ambient conditions (using Cu Kα1 radiation) confirm the known trigonal structure of Ca3V2O8 with space group R3c (space group number 161). The results of Rietveld refinement are shown in Fig. 1. The diffraction peaks are well matched to the Ca3V2O8 structure reported in the literature.13 The atomic coordinates, atomic displacement parameters and peak shape parameters were refined using initial values given in ref. 13. The refined lattice parameters of Ca3V2O8 are a = 10.81221(8) Å and c = 38.0262(3) Å, which are consistent with earlier reported values.13,15,18,45–49 The refined atomic positions, reported in Table S1 in the ESI,† are also in agreement with those reported in the literature. In Table 1 we compare unit-cell parameters at ambient conditions from our four experiments (ambient conditions, HP, HT, and LT) to show the mutual agreement. Fig. 2 shows the crystal structure of Ca3V2O8. The structure is known to be composed of only two building units, namely columns called A and B.50,51 Each A column is surrounded by 6 B columns and the 5 cationic sites (Ca1–Ca5) are divided between columns A and B. The proportion of columns A:B is 1:3. The A column has the cation site sequence described by the following order of polyhedra: V1O4–Ca4O6–Ca5O6–V1O4 and the corresponding sequence in column B is V3O4–Ca1O7–Ca3O8–Ca2O8–V2O4 (see Fig. 2). The VO4 tetrahedral units are isolated from each other. In this Ca3V2O8 structure there is also a position half-occupied by Ca atoms (Ca4), which is surrounded by three oxygen atoms in a triangular coordination.
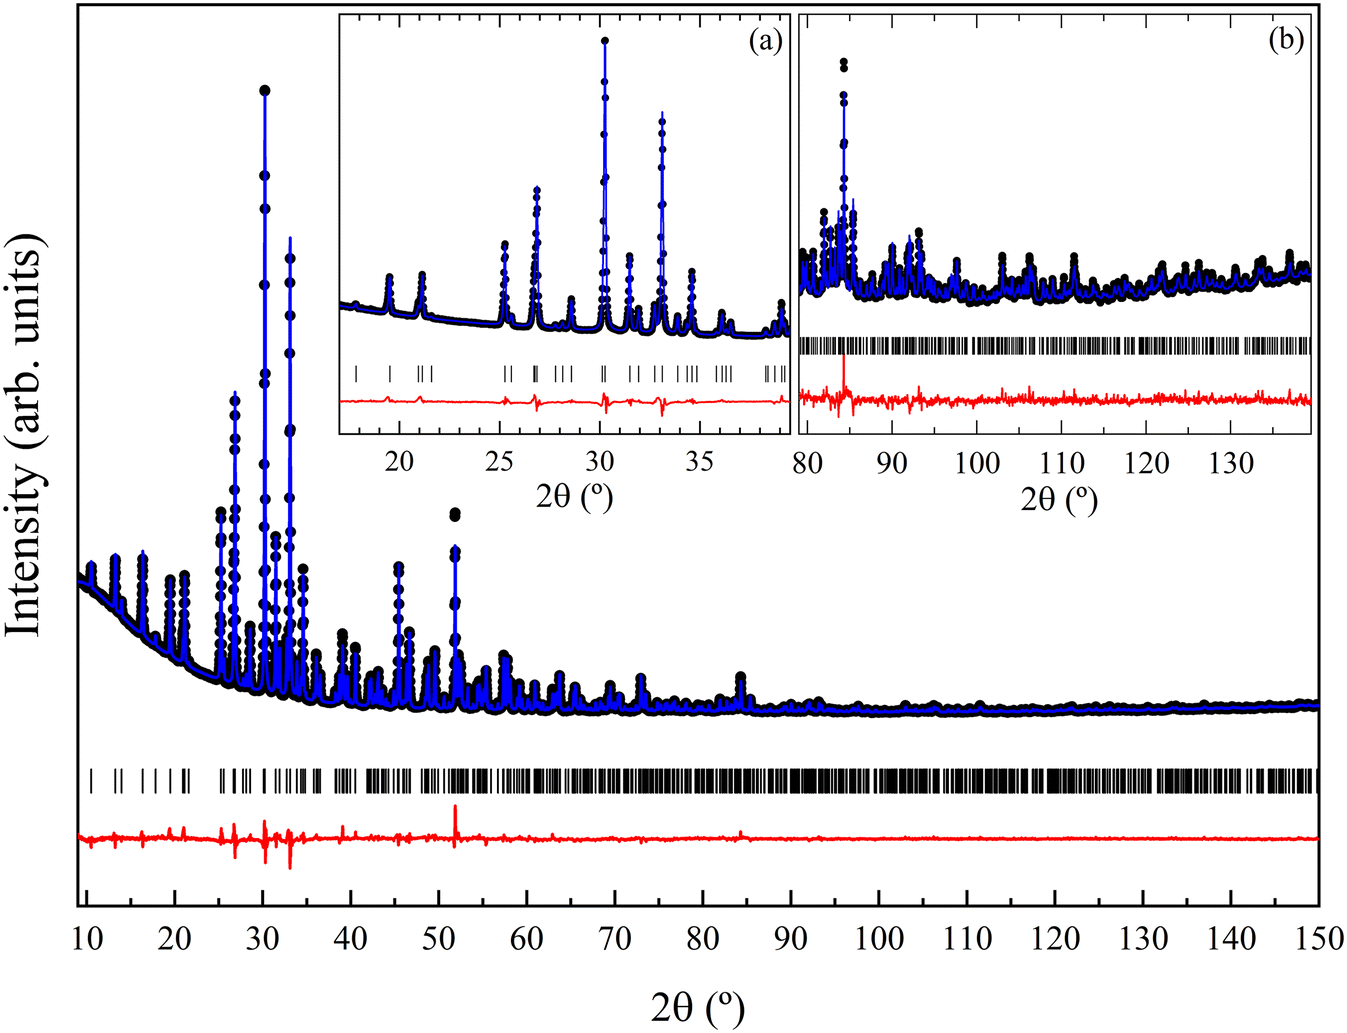 | ||
| Fig. 1 Rietveld refinement of trigonal Ca3V2O8 at RT. black dots correspond to the experimental data, the blue line to the calculated profile, ticks to the Bragg reflections, and the red line to the residual. The R-factors are: Rwp = 4.46%, Rexp = 1.61%, and Rp = 3.08%. The insets present an enlarged view of the 20–40° region of the refinement (a) and an enlarged view of the 80–140° region (b) in order to illustrate the quality of refinement. | ||
| Type of measurement | λ (Å) | a (Å) | c (Å) | V (Å3) | T (K) |
|---|---|---|---|---|---|
| Amb. Cond. Exp. (laboratory) | 1.5406 | 10.81221(8) | 38.0262(3) | 3849.84(5) | 298(2) |
| HT experiment (laboratory) | 1.5406 | 10.8133(3) | 38.031(1) | 3851.1(2) | 300(1) |
| LT experiment (ESRF) | 0.3998 | 10.81370(2) | 38.03276(8) | 3851.56(1) | 292(1) |
| HP experiment (ALBA) | 0.4246 | 10.807(1) | 38.073(4) | 3850.8(5) | 296(1) |
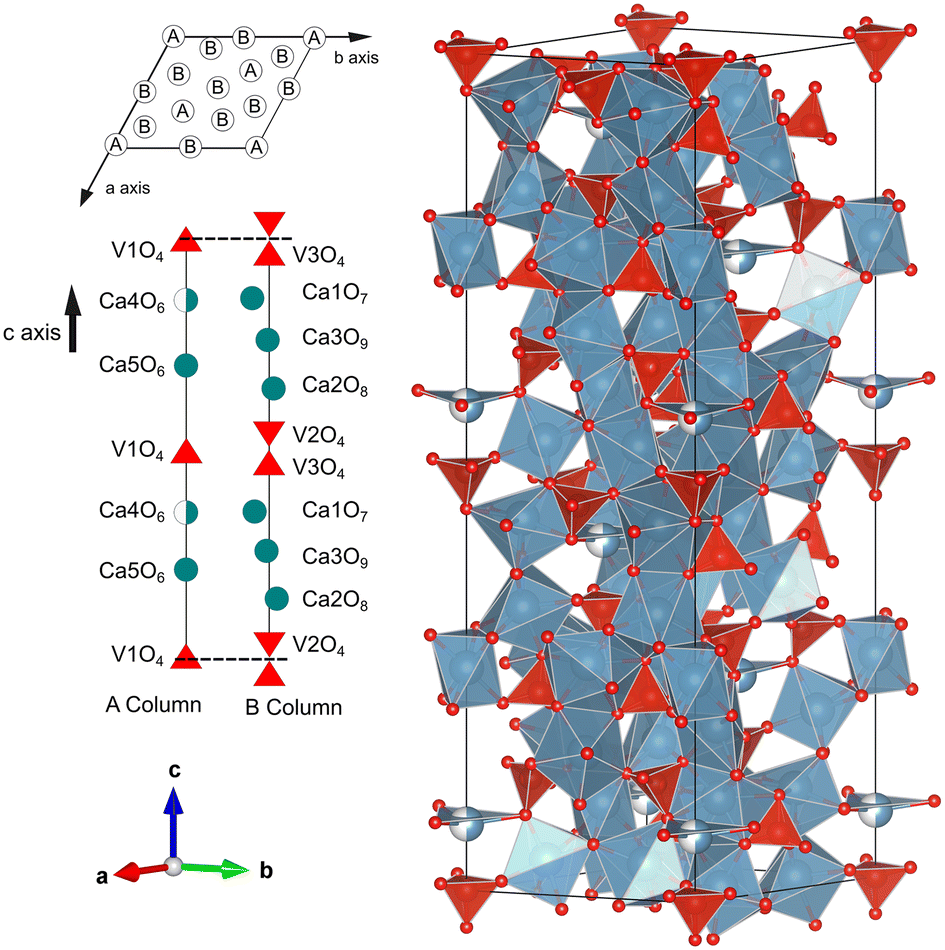 | ||
| Fig. 2 (Right) Crystal structure of trigonal Ca3V2O8 at ambient conditions. The coordination polyhedra of Ca are shown in blue and the VO4 tetrahedra in red. The sites with partial occupation of Ca atoms are shown with half blue/half white spheres. (Left) The layout of A and B columns and column composition. The red triangles represent the vanadium centered V1, V2, and V3 tetrahedra, and the circles show the calcium-centered polyhedral located at the Ca1–Ca5 sites. | ||
3.2 Variable-temperature measurements at ambient pressure
The low-temperature Ca3V2O8 XRD patterns from 4(1) to 292(1) K (λ = 0.3998 Å) are very similar to those acquired at ambient temperature. They can be described by the same R3c crystal structure, as confirmed by the Rietveld refinements (see Fig. 3(b)). Therefore, Ca3V2O8 always maintains its trigonal structure in the temperature range of 4(1)–292(1) K at ambient pressure, and no structural phase transition occurs. Lattice parameters and the crystal structure were refined for all LT XRD patterns using the ambient temperature structure as starting model.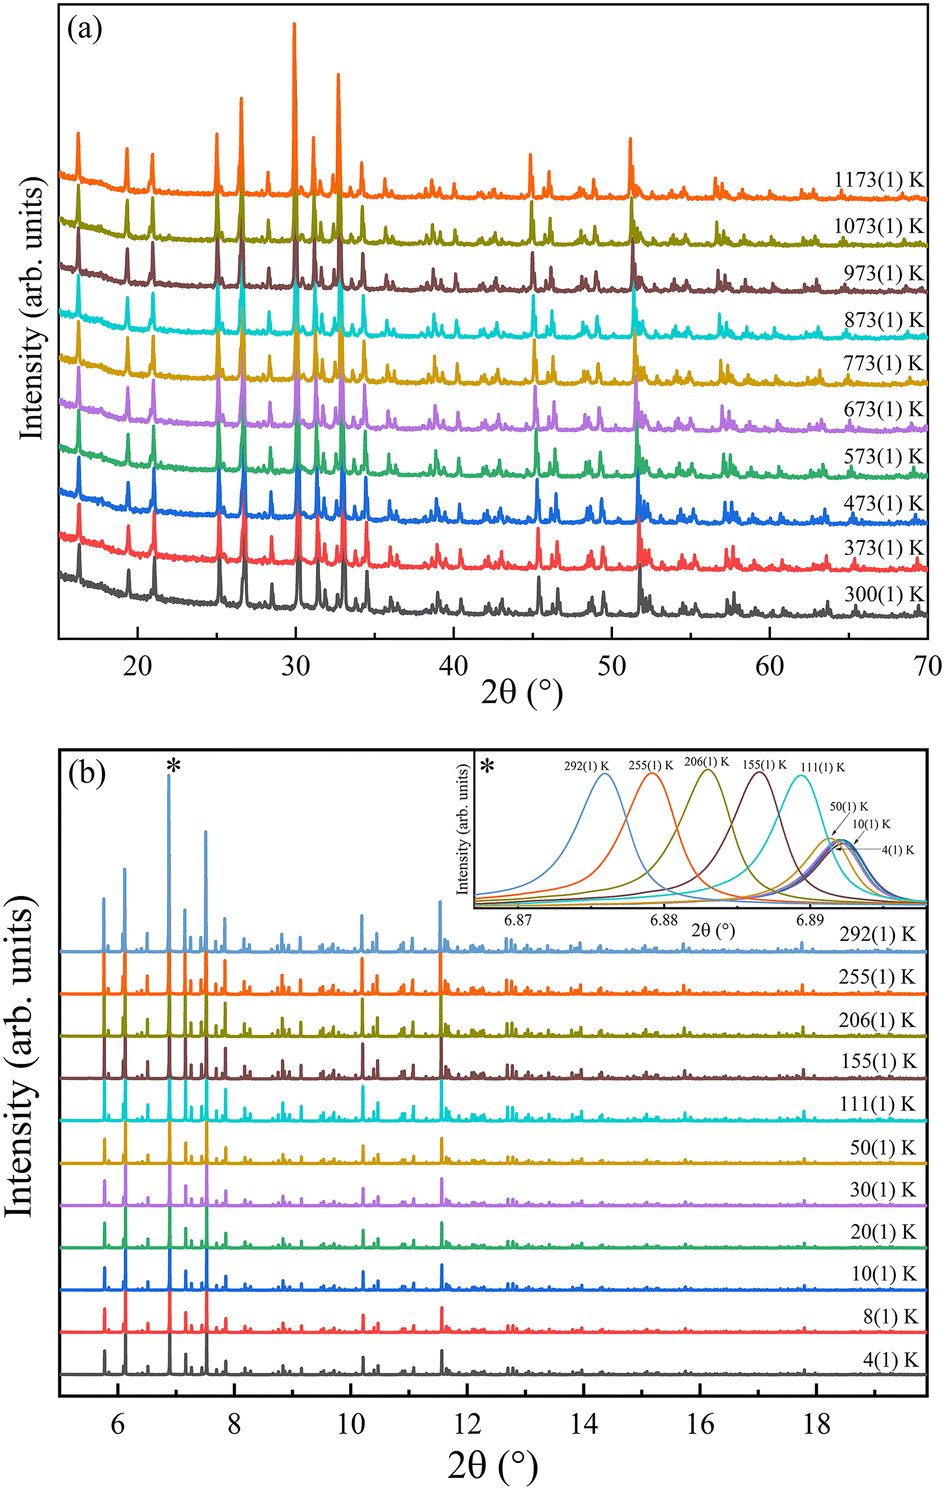 | ||
| Fig. 3 Variable-temperature X-ray diffractograms of Ca3V2O8 in the temperature range of (a) 300(1)–1173(1) K and (b) 4(1)–292(1) K. The inset in (b) shows the most intense reflection marked with an asterisk peak (0, 2, 10). Due to the use of an ateanuator at the lowest temperature the observed intensity is reduced by 50% from 50(1) to 4(1) K. | ||
X-ray diffraction patterns of Ca3V2O8 at HT can be all explained with the same R3c crystal structure as that of the ambient-conditions XRD patterns. The evolution with temperature of XRD is gradual with no new peaks appearing up to the highest temperature covered by this study; see Fig. 3(a). Consequently, there is no phase transition up to 1173(1) K. This observation is in line with previous Raman scattering studies. The only reported phase transition reported is ferroelectric–paraelectric and it occurs at 1383 K.16 In whitlockite-related materials, a change of symmetry from R3c to R![[3 with combining macron]](https://www.rsc.org/images/entities/char_0033_0304.gif) m occurs at high temperatures.52,53 Attempts to use the space group Rm for refinement of Ca3V2O8 XRD patterns acquired at high temperature have not been successful. Therefore, the change of symmetry from R3c to Rm is ruled out for Ca3V2O8. In particular, the structure with space group Rm fails to explain several peaks experimentally observed which can be identified with Miller indexes (223), (315), (137), (1115), and (2113) in the structure described by space group R3c.
m occurs at high temperatures.52,53 Attempts to use the space group Rm for refinement of Ca3V2O8 XRD patterns acquired at high temperature have not been successful. Therefore, the change of symmetry from R3c to Rm is ruled out for Ca3V2O8. In particular, the structure with space group Rm fails to explain several peaks experimentally observed which can be identified with Miller indexes (223), (315), (137), (1115), and (2113) in the structure described by space group R3c.
From the low-temperature and high-temperature diffraction experiments, we have determined the temperature dependence of the unit-cell parameters. In the case of the LT experiments atomic positions have also been refined. The Ca3V2O8 unit cell parameters and atomic positions for the low-temperature and high-temperature diffraction experiments are given in Table S2 of the ESI.† The temperature evolution of lattice parameters and unit cell volume are shown in Fig. 4. The variation of the lattice parameters over the whole temperature range are at the level of 1.742% for a and 1.640% for c. There is a weakly anisotropic expansion which can be better seen in the variation of axial ratio (c/a) with temperature. From 4 K to 306(5) K the expansion of c is larger than the expansion of a. Above 306(5) K, and up to 888(10) K, the sign of anisotropy is reversed with larger expansion along the a-axis than that along c-axis. The behavior changes once again beyond 888(10) K, whereafter it becomes isotropic. Notice that changes in c/a are included within the range of 3.5124 and 3.5172; i.e., the maximum variation is quite low, 0.1%. We attribute the nonlinear behavior of c/a to changes in the vibrations of polyhedral units forming the crystal structure54 and/or to the hypothetical variation in occupancies of Ca sites due to the migration of Ca atoms to the half-occupied Ca4 site just at the highest temperatures.55 In Fig. 5, linear (αa and αc) and volumetric (αV) thermal expansion coefficients (TEC) are shown. They have been obtained from experiments using a Lagrange interpolation.56
 | ||
| Fig. 4 Temperature evolution of the trigonal Ca3V2O8 unit-cell parameters (top), volume/Z (bottom), and c/a axial ratio (inset). Solid symbols correspond to the LT experiment and empty symbols to the HT experiment. The results of modeling by a second order Grüneisen approximation, discussed in the text, are shown with a solid line. Vertical dashed lines separate the regions of different c/a evolution. | ||
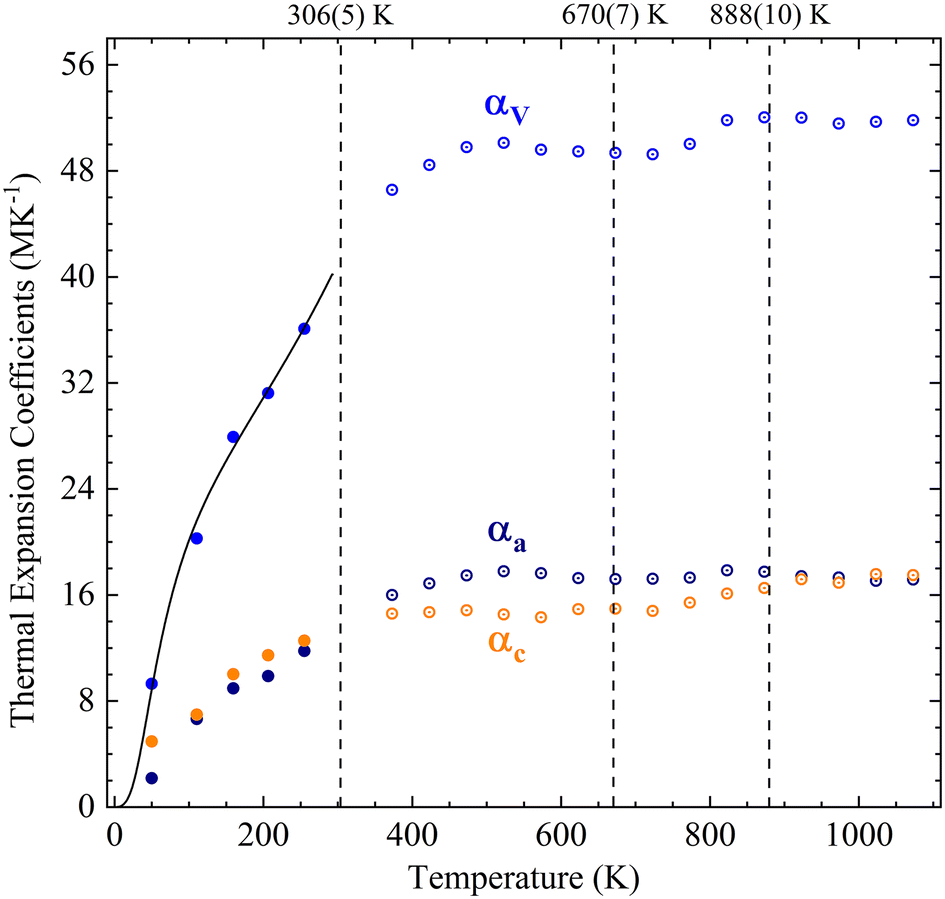 | ||
| Fig. 5 Thermal expansion coefficients (TEC) of unit-cell parameters and unit-cell volume of Ca3V2O8. Solid dots are from the LT experiment and empty dots are from the HT experiment. The solid line represents the result of modeling by a second order Grüneisen approximation, discussed in the text. Vertical dashed lines separate the regions where the behavior of c/a varies. | ||
At low-temperature, the variation of unit-cell volume with temperature can be modeled by a second order Grüneisen approximation.57,58 Using this model to fit low-temperature experiments (4–292 K), the Debye temperature (θD) was evaluated as θD = 264(2) K. In Fig. 4 and 5 we show that the Grüneisen approximation agrees quite well with the experimental data. There are few reports concerning the Debye temperature using DFT calculations for materials related to Ca3V2O8 but described by different space groups. For example, in Sr3P2O8 (space group R3m)59 the calculated Debye is 559 K. The structure rigidity will increase by replacing Ca with the heavier atom Sr, which could cause the differences in Debye temperatures. A similar difference in Debye temperatures is observed when comparing Ca3(PO4)2:0.07Ce3+ (θD = 541 K) to Ca1.5Sr1.5(PO4)2:0.07Ce3+ (θD = 730 K).60
3.3 High-pressure studies
The trigonal Ca3V2O8 crystal structure model was successfully refined against the observed powder XRD patterns acquired under high pressure conditions from 0.1(1) to 9.3(1) GPa. The Rietveld refinement results are shown in Fig. 6 for selected pressures. The fit indicators of the Rietveld refinement obtained at the lowest pressure were Rp = 6.55%, Rexp = 5.24% and Rwp = 9.80%. Similar goodness-of-fit quantities were obtained at all pressures. At 9.8(1) GPa, we notice a partial splitting, broadening of some reflections, and the appearance of extra peaks at low angles. The phenomenon becomes more evident as pressure is increased. To highlight the changes of XRD patterns, Fig. 7 shows enlarged versions of the XRD patterns measured at 9.3(1) and 13.8(1) GPa for 2θ ≤ 10°. In particular, the broadening and splitting of peaks are noticeable at 6° and around 7–8° (see the peaks marked with arrows in Fig. 7). The extra peaks are marked with asterisks in Fig. 7. The phenomenon described above can be interpreted as the occurrence of a phase transition into a monoclinic structure (space group Cc). In Fig. 7 it can be seen that the trigonal structure cannot index all the peaks observed at 13.8(1) GPa. In particular, the trigonal structure does not explain the four peaks marked with asterisks in Fig. 7. The structural information of the monoclinic HP phase can be found in the ESI† (Table S3). The crystallographic information file for the monoclinic Ca3V2O8 is structure can be obtained from the Cambridge Crystallographic Data Centre under deposition number 2192772. The crystal structure of the monoclinic phase is shown in Fig. 8. The HP structure was inferred from the low-pressure structure by means of group-subgroup relations. The HP–HT structure reported in the literature16 does not explain any of our XRD patterns thus it was excluded from the search for the Ca3V2O8 structure at HP and room temperature. The room-temperature HP phase reported here has a similar structural framework to the trigonal phase, but with a monoclinic distortion of the β angle and subtle changes of the unit-cell parameters which indicate a symmetry reduction of the structure. The same kind of transformations have been observed in piezoelectric materials, which are associated with a disorder induced by external fields.61 The subsequent analysis of the unit-cell parameters shows a small discontinuity in the volume per formula unit at the phase transition. Therefore, despite the continuous symmetry change from R3c to Cc, the structural transformation can be interpreted as a first-order phase transition. From 9.8(1) to 13.8(1) GPa the XRD patterns can be fitted with the HP monoclinic structure. Two Ca3V2O8 diffraction patterns were collected on pressure-release at 9.7(1) GPa and 4.3(1) GPa. The pattern at 9.7(1) GPa remains in the monoclinic structure, while the other at 4.3(1) GPa can be assigned to the original trigonal structure, indicating that the phase transition is reversible and the return to the trigonal phase occurs on decompression somewhere between 9.7(1) and 4.3(1) GPa.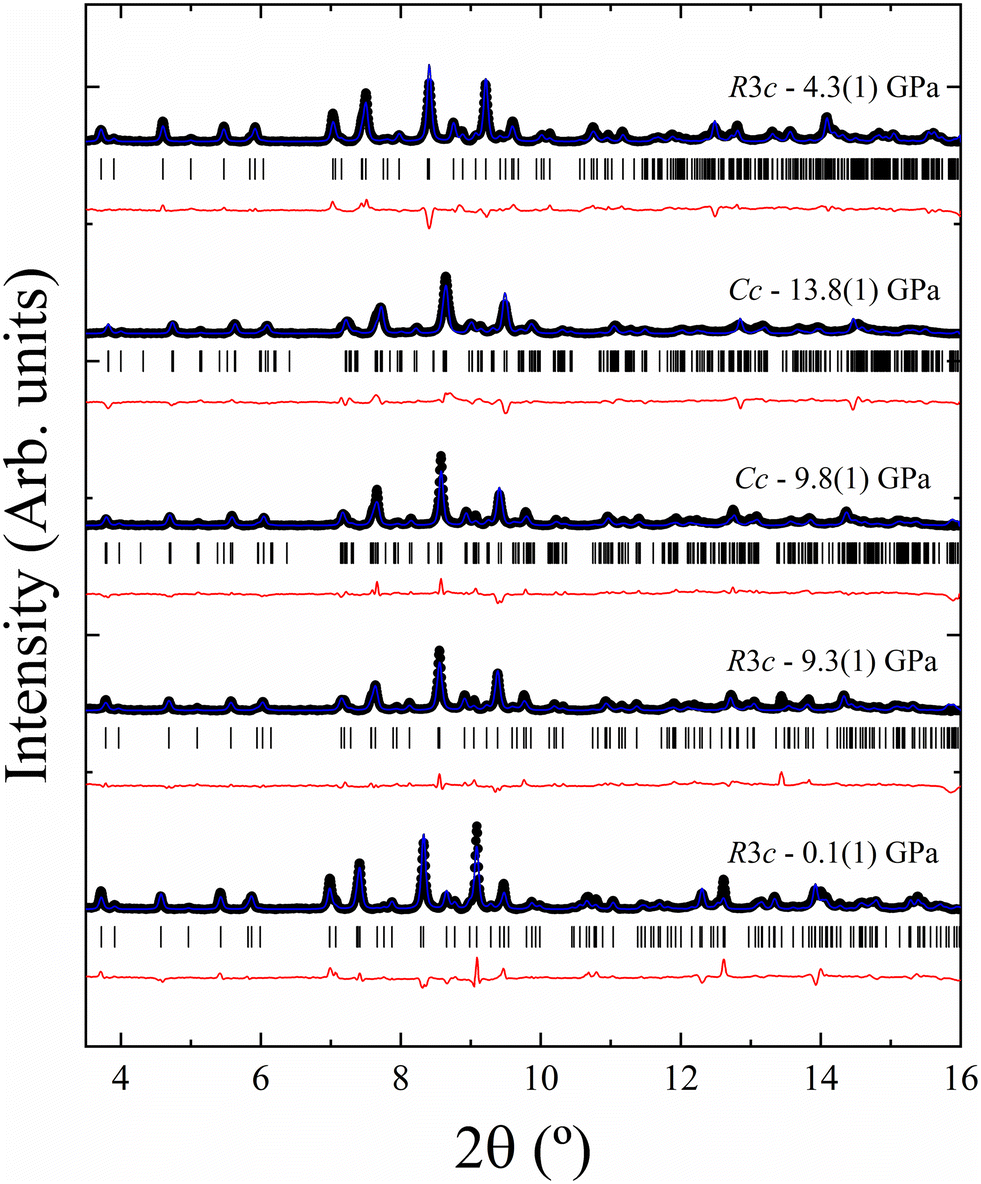 | ||
| Fig. 6 XRD patterns at selected pressures (black symbols). Rietveld fits, and residuals are shown with blue and red lines, respectively. Ticks indicate the positions of the Bragg peaks for the phase indicated in the figure. Pressures are indicated in the figure. The top trace corresponds to data acquired on sample decompression. | ||
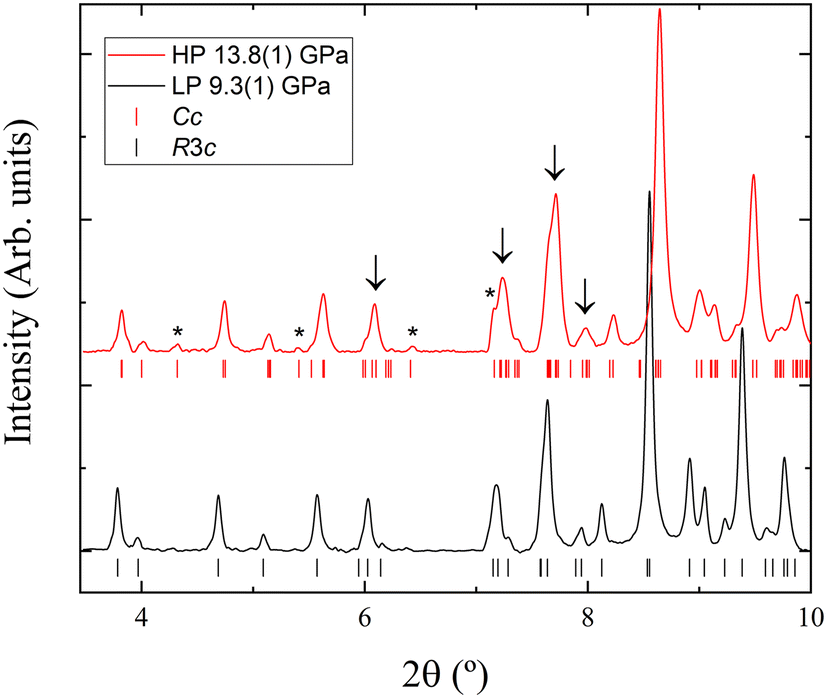 | ||
| Fig. 7 Enlarged view of the low-angle region of XRD patterns acquired from Ca3V2O8 at 9.3(1) and 13.8(1) GPa. The figure highlights the broadening and splitting of peaks described in the text. The phenomena are noticeable for the peaks located at 6° between 7° and 8°. The figure also highlights the presence of extra peaks which are a fingerprint of the occurrence of a phase transition. The ticks give the position of Bragg peaks according to indexation. The trigonal structure (space group R3c) cannot explain the peaks marked with asterisks at 13.8(1) GPa. | ||
 | ||
| Fig. 8 Crystal structure of the monoclinic phase Ca3V2O8. The coordination polyhedra of Ca are shown in blue and the VO4 tetrahedra in red. | ||
Interestingly, the phase transition takes place at a pressure that coincides with the limit of quasi-hydrostatic conditions for the used pressure medium (9.8(1) GPa).62 Therefore, one possibility is that the pressure-driven transition could be triggered by non-hydrostatic stresses. A similar phenomenon has previously been observed in other vanadates.63 Our density functional theory (DFT) calculations support this hypothesis. For example, when considering the two polymorphs observed in our experiments, DFT calculations found that the low-pressure trigonal structure is the stable structure within the pressure range covered by our studies. In particular, when calculations were performed for the HP monoclinic structure (described by a subgroup (Cc) of the space group of the trigonal structure (R3c)), we found that under hydrostatic conditions optimization of the monoclinic structure always led to the trigonal structure (i.e. the structural parameters of the lower monoclinic structure satisfy the conditions to allow it to be described by the higher symmetry trigonal structure (R3c)), which means that the trigonal structure is the ground state in the pressure range covered in our studies. Lattice dynamics calculations also show that the trigonal structure is dynamically stable at 0 GPa and at pressures where we experimentally observed the monoclinic phase. In the calculated phonon dispersion plots (see Fig. S1 in the ESI†) all phonon branches are positive at 0 and 11.2 GPa, supporting the dynamical stability of the trigonal structure also under HP. In addition, elastic constants calculations (see results in Table S4 in ESI†) show that the generalized Born stability criteria are fulfilled at 0 and 11.2 GPa. This means that the trigonal structure is also mechanically stable. Based on calculations we believe that the observed phase transition could have been triggered by non-hydrostatic stresses. In particular, our DFT calculations show that a uniaxial stress of 1.2 GPa is sufficient to trigger the transition from trigonal to monoclinic. This hypothesis should be confirmed by future experiments using different pressure transmitting media.
We report the pressure dependence of the unit-cell parameters and corresponding volume per formula unit of both phases of Ca3V2O8 and the results of the DFT calculations for the trigonal phase in Fig. 9. Theoretical results for the monoclinic HP phase are not reported because under hydrostatic conditions this phase is not stable in the pressure range covered by our studies as discussed before. For the low-pressure phase, the agreement between calculations and experiments is good. According to experiments, at 9.8(1) GPa we detected a 1% volume reduction associated with the phase transition into the monoclinic structure. This volume discontinuity is consistent with the existence of the phase transition. Notice that for proper comparison volumes per formula unit are used. We have analyzed the unit-cell volume using a third-order Birch–Murnaghan equation of state (EOS)64 employing the EosFit7 software.65 The third order EOS was determined from the Eulerian strain-normalized pressure dependence of the data.66 All EOS parameters of this work are shown and compared to the literature in Table 2. As discussed in the next paragraph, the bulk modulus at zero pressure (B0) and its pressure derivative ( ) agree within confidence ellipses with the values obtained from the second-order EOS. The B0 obtained is close to the bulk moduli found for other calcium compounds with the whitlockite-related structure, such as Ca9R(VO4)7 (R = La, Nd, Gd)19 and β-Ca3P2O8.67,68 The reported bulk modulus for the low-pressure trigonal Ca3V2O8 phase is much smaller that of other orthovanadates with similar chemical formulae, for example: Mn3V2O8, Co3V2O8, Ni3V2O8, and Zn3V2O8, however these compounds have different crystal structures which have been recently systematically studied.69 The higher compressibility of whitlockite-related compounds is related to its lower packing efficiency. For the monoclinic Ca3V2O8 phase, based on the conclusions obtained from the trigonal phase EOS and because we have only six data points, we have used a second-order EOS. The corresponding EOSs are also plotted in Fig. 9. The observed increase of the bulk modulus after the transition is comparable with results from other vanadates, such as CeVO4, TbVO4, BiVO4 and other zircon, scheelite, or fergusonite structured orthovanadates, where phase transitions near 10 GPa induce an increase of the bulk modulus.70,71
 | ||
| Fig. 9 Pressure dependence of the Ca3V2O8 unit-cell parameters (top), beta angle (top inset), volume/Z (bottom), and normalized volume (bottom inset). Blue and red symbols represent the trigonal and monoclinic phases, respectively. Black empty symbols represent literature data from the trigonal phase,18 and black squares represent DFT calculations. Circles represent upward pressure, while triangles releasing pressure data. The calculated EOS are shown with solid lines. The vertical dashed line in the inset shows the pressure where non-hydrostatic experiments deviate from quasi-hydrostatic experiments. Z = 21/14 for the trigonal/monoclinic phase. | ||
 )) for trigonal Ca3V2O8 from this work and from the literature. Data of structurally related vanadates and phosphates are included for comparison. The first line shows the results of the HP phase here reported
| V 0/Z (Å3) | B 0 (GPa) |
|
|
|---|---|---|---|
| Monoclinic Ca3V2O8 (HP experiment) | 175.4(16) | 105(12) | 4 (fixed) |
| Trigonal Ca3V2O8 (HP experiment) | 182.83(15) | 69(2) | 3.7(6) |
| 182.88(12) | 68.2(8) | 4 (fixed) | |
| Trigonal Ca3V2O8 (DFT calculations) | 181.83(10) | 61.9(7) | 5.5(2) |
| 181.53(16) | 68.2(9) | 4 (fixed) | |
| Trigonal Ca3V2O818 |
184.6(2) | 92.50(8.23) | 5.89(2.38) |
| 184.49(17) | 99.08(2.25) | 4 (fixed) | |
| Trigonal Ca9La(VO4)719 |
186.71(19) | 63(4) | 4(1) |
| 186.7(3) | 63(1) | 4 (fixed) | |
| Trigonal Ca9Nd(VO4)719 |
185.05(10) | 63(2) | 5.6(6) |
| 185.38(14) | 69.2(7) | 4 (fixed) | |
| Trigonal Ca9Gd(VO4)719 |
184.29(19) | 61(5) | 6(1) |
| 184.7(3) | 69(1) | 4 (fixed) | |
| Trigonal Ca3P2O867 |
167.1(3) | 79.5(20) | 4 (fixed) |

The confidence ellipses of B0vs. for the trigonal phase are shown in Fig. 10. We include in the plot the results of 2nd and 3rd order Birch–Murnaghan EOS, results from a previous study18 as well as the DFT calculations from this work. Fig. 10 shows that both experimental fits lead to similar parameters. In particular, the result of the 2nd order EOS is within the 68.3% confidence level ellipse of the 3rd order EOS; i.e. both EOSs describe equally well the pressure dependence of the volume. For the fits of the DFT calculations, the 2nd order EOS overlaps with the experimental one, while the 3rd order EOS ends up being inside the 99.7% confidence level ellipse of the experimental fitting. Therefore, the DFT calculations are in a good agreement with the results of this work. Fig. 10 shows that the bulk modulus of previous studies18 is probably overestimated. This could be related to non-hydrostatic effects. In the V/V0 figure (inset of the bottom panel of Fig. 9) we show that the results of this experiment depart from our results at 2 GPa. The PTM used in that work was silicone oil, which is hydrostatic only up to 2 GPa.62 Otherwise, the ME 4:1 mixture we have used is quasi-hydrostatic up to 10 GPa.62 This substantial difference, which makes deviatoric stresses larger under silicone oil than under ME 4:1, might explain the previously overestimated B0.62 In fact, there are many studies in oxides where non-hydrostatic effects have induced a decrease of compressibility as an artifact.72 For instance, in YBO3 and GdYO3 non-hydrostatic effects induce an overestimation by 50% of the bulk modulus.73 In HoVO4, non-hydrostatic experiments give a bulk modulus 25% larger than quasi-hydrostatic experiments.74 Then it is quite reasonable to assume the non-hydrostatic effects could lead to a 30% overestimation of the bulk modulus of Ca3V2O8. They can be also the cause of the previously observed amorphization, which could have been triggered by large non-hydrostatic effects, as those created when silicone oil is used as pressure medium, as previously observed in ternary oxides.75 Generally, under non-hydrostatic conditions, the EOS fitting provides an overestimated value of B0.75
 | ||
Fig. 10
 versus B
0 plot from results of the trigonal phase of Ca3V2O8 are represented with blue empty circles. Confidence ellipses from the present experiment are shown. The black empty circles are previous results from the literature,18 and the red empty squares are DFT calculations.
versus B
0 plot from results of the trigonal phase of Ca3V2O8 are represented with blue empty circles. Confidence ellipses from the present experiment are shown. The black empty circles are previous results from the literature,18 and the red empty squares are DFT calculations. | ||
From our experiments, we have also derived the linear isothermal compressibility coefficients for the a and c axis of the trigonal structure;  , where x = a or c. The linear compressibilities obtained are κa = 5.2(4) 10−3 GPa−1 and κc = 3.8(2) 10−3 GPa−1. The region used for the fits is from 0.1(1) to 4.8(1) GPa to guarantee that only hydrostatic data are used. Compared to the results of previous experiments18 (κa = 2.6(5) 10−3 GPa−1 and κc = 3.4(7) 10−3 GPa−1) we have obtained a similar compressibility for the c-axis but a two times larger compressibility along the a-axis. Thus, the axis along the hexagonal planes of the structure seems to be more sensitive to non-hydrostatic stresses than the perpendicular axis.
4. Conclusions
In the present study, polycrystalline calcium orthovanadate Ca3V2O8 (space group R3c) was investigated via synchrotron powder XRD as a function of pressure up to 13.8(1) GPa at ambient temperature, and as a function of temperature between 4(1) and 1173(1) K at ambient pressure. Experiments at room temperature confirm the previously reported trigonal low-pressure structure of the studied crystal and confirms its phase purity. The high-pressure experiments provide information on the compressibility of both the trigonal and monoclinic Ca3V2O8 phases and show the occurrence of a reversible phase transition between these two polymorphs at 9.8(1) GPa on compression. The phase transition is interpreted based on the results of Rietveld refinements. The experimental conditions and ab initio calculations suggest that the transition could be triggered by non-hydrostatic stresses. The trigonal structure of Ca3V2O8 remains stable at ambient pressure throughout the wide range of temperatures studied in this work (4(1)–1173(1) K). The results obtained via X-ray diffraction have enabled the determination of the Birch–Murnaghan equation of state and thermal expansion coefficients. We have determined a bulk modulus B0 = 69(2) GPa for the trigonal phase and B0 = 105(12) GPa for the monoclinic phase. The value obtained for the trigonal phase under quasi-hydrostatic conditions shows that the bulk modulus of Ca3V2O8 was previously overestimated by more than 20%. The value of the Debye temperature is evaluated as 264(2) K. Thermal expansion coefficients have also been reported, clearly finding three distinct temperature regions in which the c/a ratio exhibits distinct behaviors. The acquired knowledge for this compound will facilitate analysis of the properties of such compounds, treating it as a reference material.Data availability
The data that support the findings of this study are available from the corresponding author upon reasonable request.Author contributions
J. Sánchez-Martín, D. Errandonea, R. Turnbull, J. Ibáñez, and C. Popescu were involved in the pressure experiments and analysis. H. Sadat Rahimi Mosafer, W. Paszkowicz, R. Minikayev, and A. Fitch were involved in the temperature experiments and analysis. M. Berkowski was responsible for the material synthesis. P. Rodríguez-Hernández and A. Muñoz were involved in the DFT calculations. The manuscript was written through contributions of all authors. All authors have given approval to the final version of the manuscript.Conflicts of interest
The authors declare no competing interests.Acknowledgements
The authors acknowledge financial support from the Spanish Research Agency (AEI) and Spanish Ministry of Science and Investigation (MCIN) under grant PID2019-106383GB-41/43 (DOI: https://doi.org/10.13039/501100011033). This work was also supported by the Generalitat Valenciana under Grant No. PROMETEO CIPROM/2021/075-GREENMAT. This study forms part of the Advanced Materials Programme and was supported by MCIN with funding from European Union NextGenerationEU (PRTR-C17.I1) and by Generalitat Valenciana (Grant MFA/2022/007). J. S.-M. acknowledges the Spanish Ministry of Science, Innovation and Universities for the PRE2020-092198 fellowship. The authors thank ALBA synchrotron for providing beam time for the HP XRD experiments (Proposal 2021085271). The high-resolution powder diffraction at low-temperature experiments were performed on beamline ID22 at the European Synchrotron Radiation Facility (ESRF), Grenoble, France. The access to ESRF was financed by the Polish Ministry of Education and Science – decision number 2021/WK/11. R.T. acknowledges funding from the Generalitat Valenciana through the APOSTD postdoctoral Fellowship No. CIAPOS/2021/20.References
- Y. Yang, H. Mao and M. Selleby, An Assessment of the Ca-V-O System, Calphad, 2017, 56, 29–40 CrossRef CAS.
- Z. Cao, N. Wang, W. Xie, Z. Qiao and I. H. Jung, Critical Evaluation and Thermodynamic Assessment of the MgO-V2O5 and CaO-V2O5 Systems in Air, Calphad, 2017, 56, 72–79 CrossRef CAS.
- J. Xiang, X. Wang, G. Pei, Q. Huang and X. Lü, Solid-State Reaction of a CaO−V2O5 Mixture: A Fundamental Study for the Vanadium Extraction Process, Int. J. Miner., Metall. Mater., 2021, 28, 1462–1468 CrossRef CAS.
- H. Ning, H. Yan and M. A. Reece, High Curie Point Ferroelectric Ceramic Ca3(VO4)2, Ferroelectrics, 2015, 487, 94–100 CrossRef CAS.
- G. Yao, C. Pei, J. Xu, P. Liu, J. Zhou and H. Zhang, Microwave Dielectric Properties of CaV2O6 Ceramics with Low Dielectric Loss, J. Mater. Sci.: Mater. Electron., 2015, 26, 7719–7722 CrossRef CAS.
- K. Thiagarajan, J. Theerthagiri, R. A. Senthil and J. Madhavan, Simple and Low Cost Electrode Material Based on Ca2V2O7/PANI Nanoplatelets for Supercapacitor Applications, J. Mater. Sci.: Mater. Electron., 2017, 28, 17354–17362 CrossRef CAS.
- L. H. Brixner and P. A. Flournoy, Calcium Orthovanadate Ca3(VO4)2 - A New Laser Host Crystal, J. Electrochem. Soc., 1965, 112, 303 CrossRef CAS.
- C. Li, W. Yang and Y. Chang, Fluorescence Spectrum of Calcium Orthovanadate Doped with Samarium, Ferroelectrics, 1993, 142(1), 131–135 CrossRef CAS.
- H. Lin, Y. Fang, X. Huang and S. Chu, Luminescence and Site Symmetry Studies of New Red Phosphors (Ca, Ba)3(VO4)2:Eu3+ Under Blue Excitation, J. Am. Ceram. Soc., 2010, 93, 138–141 CrossRef CAS.
- S. S. Parab and A. V. Salker, Structural and Optical Properties of Tb and Na-Tb Co-doped Ca3V2O8 Phosphors Prepared by Sol-gel Process, Mater. Res. Express, 2018, 5, 016302 CrossRef.
- M. B. Kosmyna, B. P. Nazarenko, V. M. Puzikov, A. N. Shekhovtsov, W. Paszkowicz, A. Behrooz, P. Romanowski, A. S. Yasukevich, N. V. Kuleshov and M. P. Demesh, et al. Ca10Li(VO4)7:Nd3+, a Promising Laser Material: Growth, Structure and Spectral Characteristics of a Czochralski-Grown Single Crystal, J. Cryst. Growth, 2016, 445, 101–107 CrossRef CAS.
- L. I. Ivleva, E. E. Dunaeva, I. S. Voronina, M. E. Doroshenko, A. G. Papashvili, J. Sulc, J. Kratochvíl and H. Jelinkova, Impact of Tm3+/Ho3+ Co-Doping on Spectroscopic and Laser Properties of Ca3(VO4)2 Single Crystal, J. Cryst. Growth, 2019, 513, 10–14 CrossRef CAS.
- R. Gopal and C. Calvo, The Structure of Ca3(V04)2, Z. Kristallogr., Kristallgeom., Kristallphys., Kristallchem., 1973, 137, 7–85 Search PubMed.
- A. Grzechnik, Crystal Structure of Ca3(VO4)2 Synthesized at 11 GPa and 1373 K, Solid State Sci., 2002, 4, 523–527 CrossRef CAS.
- A. M. Glass, S. C. Abrahams, A. A. Ballman and G. Loiacono, Calcium Orthovanadate, Ca3(VO4)2-a New High-temperature Ferroelectric, Ferroelectrics, 1978, 17, 579–582 CrossRef CAS.
- A. Grzechnik, High-Temperature Transformations in Calcium Orthovanadate Studied with Raman Scattering, Chem. Mater., 1998, 10, 1034–1040 CrossRef CAS.
- M. K. Ryu, J. G. Choi, G. H. Kim, S. Kojima, M. Takashige and M. S. Jang, Raman Scattering Study in Ca3V2O8, Ferroelectrics, 2006, 332, 1–5 CrossRef CAS.
- A. Grzechnik, Amorphization of Ca3(VO4)2 at High Pressure, J. Solid State Chem., 1998, 139, 161–167 CrossRef CAS.
- K. M. Kosyl, W. Paszkowicz, O. Ermakova, D. Wlodarczyk, A. Suchocki, R. Minikayev, J. Z. Domagala, A. N. Shekhovtsov, M. Kosmyna and C. Popescu, et al. Equation of State and Amorphization of Ca9R(VO4)7 (R = La, Nd, Gd): A Combined High-Pressure X-ray Diffraction and Raman Spectroscopy Study, Inorg. Chem., 2018, 57, 13115–13127 CrossRef CAS PubMed.
- D. Diaz-Anichtchenko, D. Santamaría-Pérez, T. Marqueño, J. Pellicer-Porres, J. Ruíz-Fuertes, R. Ribes, J. Ibáñez, S. N. Achary, C. Popescu and D. Errandonea, Comparative study of the high-pressure behavior of ZnV2O6, Zn2V2O7, and Zn3V2O8, J. Alloys Compd., 2020, 837, 155505 CrossRef CAS.
- D. Diaz-Anichtchenko, R. Turnbull, E. Bandiello, S. Anzellini and D. Errandonea, High-Pressure Structural Behavior and Equation of State of Kagome Staircase Compound, Ni3V2O8, Crystals, 2020, 10, 910 CrossRef CAS.
- A. Grzechnik and P. F. McMillan, High-pressure X-ray diffraction of Sr3(VO4)2 and Ba3(VO4)2, Phys. B, 1998, 252, 268–273 CrossRef CAS.
- S. Kesari, A. B. Garg, O. Clemens, B. Joseph and R. Rao, Pressure-Induced Structural Behavior of Orthorhombic Mn3(VO4)2: Raman Spectroscopic and X-ray Diffraction Investigations, ACS Omega, 2022, 7, 3099–3108 CrossRef CAS PubMed.
- A. Grzechnik and P. F. McMillan, High Pressure Behavior of Sr3(VO4)2 and Ba3(VO4)2, J. Solid State Chem., 1997, 132, 156–162 CrossRef CAS.
- D. Diaz-Anichtchenko, R. Turnbull, E. Bandiello, S. Anzellini, A. N. Achary and D. Errandonea, Pressure-Induced Chemical Decomposition of Copper Orthovanadate (α-Cu3V2O8), J. Mater. Chem. C, 2021, 9, 13402 RSC.
- B. O. Loopstra and H. M. Rietveld, The Structure of Some Alkaline-Earth Metal Urinates, Acta Crystallogr., Sect. B: Struct. Crystallogr. Cryst. Chem., 1969, 25, 787–791 CrossRef CAS.
- H. M. Rietveld, A Profile Refinement Method for Nuclear and Magnetic Structures, J. Appl. Crystallogr., 1969, 2, 65–71 CrossRef CAS.
- J. Rodrígez-Carvajal, Recent Advances in Magnetic Structure Determination by Neutron Powder Diffraction, Phys. B, 1993, 192, 55 CrossRef.
- J. L. Hodeau, P. Bordet, M. Anne, A. Prat, A. N. Fitch, E. Dooryhee, G. Vaughan and A. Freund, Nine Crystal Multi-Analyser Stage for High-Resolution Powder Diffraction Between 6 and 40 keV, in Crystal and Multilayer Optics, Proceedings 3448, 353 of the SPIE's International Symposium on Optical Science, Engineering, and Instrumentation, San Diego, CA, United States, 1998 Search PubMed.
- A. Dewaele, P. Loubeyre and M. Mezouar, Equations of State of Six Metals Above 94 GPa, Phys. Rev. B: Condens. Matter Mater. Phys., 2004, 70, 094112 CrossRef.
- F. Fauth, I. Peral, C. Popescu and M. Knapp, The New Material Science Powder Diffraction Beamline at ALBA Synchrotron, Powder Diffr., 2013, 28, S360–S370 CrossRef CAS.
- W. Kraus and G. Nolze, POWDER CELL – a Program for the Representation and Manipulation of Crystal Structures and Calculation of the Resulting X-ray Powder Patterns, J. Appl. Crystallogr., 1996, 29, 301–303 CrossRef CAS.
- A. Mujica, A. Rubio, A. Muñoz and R. J. Needs, High-Pressure Phases of Group-IV, III-V, and II-VI Compounds, Rev. Mod. Phys., 2003, 75, 863 CrossRef CAS.
- G. Kresse and J. Hafner, Ab Initio Molecular Dynamics for Liquid Metals, Phys. Rev. B: Condens. Matter Mater. Phys., 1993, 47, 558 CrossRef CAS PubMed.
- G. Kresse and J. Furthmüller, Efficiency of Ab-Initio Total Energy Calculations for Metals and Semiconductors Using a Plane-Wave Basis Set, Comput. Mater. Sci., 1996, 6, 15 CrossRef CAS.
- G. Kresse and J. Furthmüller, Efficient Iterative Schemes for Ab Initio Total-Energy Calculations Using a Plane-Wave Basis Set, Phys. Rev. B: Condens. Matter Mater. Phys., 1996, 54, 11169 CrossRef CAS PubMed.
- J. P. Perdew, A. Ruzsinszky, G. I. Csonka, O. A. Vydrov, G. E. Scuseria, L. A. Constantin, X. Zhou and K. Burke, Restoring the Density-Gradient Expansion for Exchange in Solids and Surfaces, Phys. Rev. Lett., 2008, 100, 136406 CrossRef PubMed.
- P. E. Blöchl, Projector Augmented-Wave Method, Phys. Rev. B: Condens. Matter Mater. Phys., 1994, 50, 17953 CrossRef PubMed.
- S. López-Moreno, D. Errandonea, J. Pellicer-Porres, D. Martínez-García, S. J. Patwe, S. N. Achary, A. K. Tyagi, P. Rodríguez-Hernández, A. Muñoz and C. Popescu, Stability of FeVO4 under Pressure: An X-ray Diffraction and First-Principles Study, Inorg. Chem., 2018, 57, 7860–7876 CrossRef PubMed.
- T. Marqueño, D. Errandonea, J. Pellicer-Porres, D. Santamaría-Pérez, P. Rodríguez-Hernández and A. Muñoz, Competing dynamical and lattice instabilities in RVO4 rare-earth vanadium oxides under high pressure, Phys. Rev. Mater., 2020, 6, L060601 CrossRef.
- H. J. Monkhorst and J. D. Pack, Special Points for Brillouin-Zone Integration, Phys. Rev. B: Solid State, 1976, 13, 5188 CrossRef.
- E. Bandiello, P. Rodríguez-Hernández, A. Muñoz, M. Bajo Buenestado, C. Popescu and D. Errandonea, Electronic properties and high-pressure behavior of wolframite-type CoWO4, Mater. Adv., 2021, 2, 5955–5966 RSC.
- A. Togo and I. Tanaka, First Principles Phonon Calculations in Materials Science, Scr. Mater., 2015, 108, 1 CrossRef CAS.
- Y. Le Page and P. Saxe, Symmetry-General Least-Squares Extraction of Elastic Data for Strained Materials from Ab Initio Calculations of Stress, Phys. Rev. B: Condens. Matter Mater. Phys., 2002, 65, 104104 CrossRef.
- V. D. Zhuravlev, V. A. Makarov and A. A. Fotiev, Binary Systems of Calcium, Strontium, and Barium Orthovanadates, Russ. J. Inorg. Chem., 1976, 21(1218), 1221 Search PubMed.
- I. A. Leonidov, M. Y. Khodos, A. A. Fotiev and A. S. Zhukovskaya, Effect of Vacancies on 45Ca Diffusion in the Solid Solutions Ca/sub 3(1-x)/Eu/sub 2x/square/sub x/(VO4)2, Izv. Akad. Nauk SSSR, Neorg. Mater., 1988, 24, 347–348 CAS.
- B. I. Lazoryak, L. O. Dmitrienko and S. V. Grechkin, Zh. Neorg. Khim., 1990, 35, 1095 CAS . ICDD database 04-005-5987.
- J. Macicek, Data Base, International Centre for Diffraction Data, Newton Square, PA, 1995, JCPDS-ICDD database 00–046-0756 Search PubMed.
- G. M. Kuz'micheva, L. I. Ivleva, I. A. Kaurova, E. V. Khramov, V. B. Rybakov and M. E. Doroshenko, Pure and Tm3+-doped Ca3(VO4)2 crystals: Growth, Statistical and Local Structure, and Luminescent Properties, J. Alloys Compd., 2021, 854, 155918 CrossRef.
- B. L. Dickens, W. Schroeder and W. E. Brown, Crystallographic Studies of the Role of Mg as a Stabilizing Impurity in β-Ca3(PO4)2. The Crystal Structure of pure β-Ca3(PO4)2, J. Solid State Chem., 1974, 10, 232–248 CrossRef CAS.
- M. Yashima, A. Sakai, T. Kamiyama and A. Hoshikawa, Crystal Structure Analysis of β-tricalcium phosphate Ca3(PO4)2 by Neutron Powder Diffraction, J. Solid State Chem., 2003, 175, 272–277 CrossRef CAS.
- B. I. Lazoryak, S. M. Aksenov, S. Y. Stefanovich, N. G. Dorbakov, D. A. Belov, O. V. Baryshnikova, V. A. Morozov, M. S. Manylov and Z. Lin, Ferroelectric Crystal Ca9Yb(VO4)7 in the Series of Ca9R(VO4)7 Non-Linear Optical Materials (R = REE, Bi, Y), J. Mater. Chem. C, 2017, 5, 2301–2310 RSC.
- B. I. Lazoryak, V. A. Morozov, A. A. Belik, S. Y. Stefanovich, V. V. Grebenev, I. A. Leonidov, E. B. Mitberg, S. A. Davydov, O. I. Lebedev and G. V. Tendeloo, Ferroelectric Phase Transition in the Whitlockite-Type Ca9Fe(PO4)7; Crystal Structure of the Paraelectric Phase at 923 K, Solid State Sci., 2004, 6, 185–195 CrossRef CAS.
- F. Datchi, A. Dewaele, Y. Le Godec and P. Loubeyre, Equation of State of Cubic Boron Nitride at High Pressures and Temperatures, Phys. Rev. B: Condens. Matter Mater. Phys., 2007, 75, 214104 CrossRef.
- H. S. R. Mosafer, W. Paszkowicz, R. Minikayev, M. Kozłowski, R. Diduszko and M. Berkowski, The Crystal Structure and Thermal Expansion of Novel Substitutionally Disordered Ca10TM0.5(VO4)7 (TM = Co, Cu) orthovanadates, Dalton Trans., 2021, 50, 14762 RSC.
- E. Sülli and D. F. Mayers, An Introduction to Numerical Analysis, Cambridge University Press, Cambridge, U.K., 2003 Search PubMed.
- D. C. Wallace, Thermodynamics of Crystals, Am. J. Phys., 1972, 40, 1718–1719 CrossRef.
- L. Vočadlo, K. S. Knight, G. D. Price and I. G. Wood, Thermal Expansion and Crystal Structure of FeSi Between 4 and 1173 K Determined by Time-of-Flight Neutron Powder Diffraction, Phys. Chem. Miner., 2002, 29, 132–139 CrossRef.
- Z. Sun, B. Sun, X. Zhang, D. Wen and P. Dai, Superb Thermal Stability Purple-Blue Phosphor Through Synergistic Effect of Emission Compensation and Nonradiative Transition Restriction of Eu2+, Mater. Today Chem., 2022, 24, 100877 CrossRef CAS.
- X. Pan, L. Mei, Y. Zhuang, T. Seto, Y. Wang, M. Plyaskin, W. Xi, C. Li, Q. Guo and L. Liao, Anti-Defect Engineering Toward High Luminescent Efficiency in Whitlockite Phosphors, Chem. Eng. J., 2022, 434, 134652 CrossRef CAS.
- E. Aksel, J. S. Forrester, B. Kowalski, J. L. Jones and P. A. Thomas, Phase Transition Sequence in Sodium Bismuth Titanate Observed Using High-Resolution X-Ray Diffraction, Appl. Phys. Lett., 2011, 99, 222901 CrossRef.
- S. Klotz, J.-C. Chervin, P. Munsch and G. L. Marchand, Hydrostatic Limits of 11 Pressure Transmitting Media, Phys. Rev. D: Part., Fields, Gravitation, Cosmol., 2009, 42, 075413 Search PubMed.
- A. B. Garg, D. Errandonea, P. Rodríguez-Hernández and A. Muñoz, ScVO4 under non-hydrostatic compression: a new metastable polymorph, J. Phys.: Condens. Matter, 2017, 29, 055401 CrossRef PubMed.
- F. Birch, Finite Elastic Strain of Cubic Crystals, Phys. Rev., 1947, 71, 809–824 CrossRef CAS.
- J. Gonzalez-Platas, M. Alvaro, F. Nestola and R. Angel, EosFit7-GUI: a New Graphical User Interface for Equation of State Calculations, Analyses and Teaching, J. Appl. Crystallogr., 2016, 49, 1377–1382 CrossRef CAS.
- R. J. Angel, Equations of State, Rev. Mineral. Geochem., 2000, 41, 35–59 CrossRef.
- S. Zhai and X. Wu, X-Ray Diffraction Study of β-Ca3(PO4)2 at High Pressure, Solid State Commun., 2010, 150, 443–445 CrossRef CAS.
- L. Liang, P. Rulis and W. Y. Ching, Mechanical Properties, Electronic Structure and Bonding of α- and β-Tricalcium Phosphates with Surface Characterization, Acta Biomater., 2010, 6, 3763–3771 CrossRef CAS PubMed.
- D. Díaz-Anichtchenko and D. Errandonea, Comparative Study of the Compressibility of M3V2O8 (M = Cd, Zn, Mg, Ni) Orthovanadates, Crystals, 2022, 12, 1544 CrossRef.
- T. Xie, S. E. Nikitin, A. I. Kolesnikov, E. Mamontov, L. M. Anovitz, G. Ehlers, I. Huskić, T. Friščić and A. Podlesnyak, Direct Determination of the Zero-Field Splitting for the Fe3+ Ion in a Synthetic Polymorph of NaMgFe(C2O4)3·9H2O: A Natural Metal-Organic Framework, Phys. Rev. B, 2021, 103, 024402 CrossRef CAS.
- J. Sánchez-Martín, D. Errandonea, J. Pellicer-Porres, D. Vázquez-Socorro, D. Martínez-García, S. N. Achary and C. Popescu, Phase Transitions of BiVO4 under High Pressure and High Temperature, J. Phys. Chem. C, 2022, 126, 7755–7763 CrossRef.
- D. Errandonea, A. Muñoz and J. Gonzalez-Platas, Comment on “High-Pressure X-Ray Diffraction Study of YBO3/Eu3+, GdBO3, and EuBO3: Pressure-Induced Amorphization in GdBO3”, J. Appl. Phys., 2014, 115, 216101 CrossRef.
- R. Turnbull, D. Errandonea, J. A. Sans, V. P. Cuenca-Gotor, R. I. Vilaplana, J. Ibáñez, C. Popescu, A. Szczeszak, S. Lis and F. J. Manjón, GdBO3 and YBO3 Crystals under Compression, J. Alloys Compd., 2021, 866, 158962 CrossRef CAS.
- A. B. Garg, D. Errandonea, P. Rodríguez-Hernández, S. López-Moreno, A. Muñoz and C. Popescu, High-Pressure Structural Behaviour of HoVO4: Combined XRD Experiments and Ab Initio Calculations, J. Phys.: Condens. Matter, 2014, 26, 265402 CrossRef PubMed.
- D. Errandonea, M. Somayazulu and D. Häusermann, Phase Transitions and Amorphization of CaWO4 at High Pressure, Phys. Status Solidi B, 2002, 235, 162–169 CrossRef.
Footnote |
| † Electronic supplementary information (ESI) available. See DOI: https://doi.org/10.1039/d2ce01676a |
| This journal is © The Royal Society of Chemistry 2023 |