
 Open Access Article
 This Open Access Article is licensed under a
 Creative Commons Attribution 3.0 Unported Licence
On the role of torsional dynamics in the solid-state fluorescent properties of a new bifluorene–tetracarboxylic acid and its supramolecular assemblies: a structural and TD-DFT investigation†
Enrico
Podda
 ab,
Massimiliano
Arca
a,
Anna
Pintus
a,
Vito
Lippolis
a,
Claudia
Caltagirone
a,
Simon J.
Coles
d,
James B.
Orton
d,
Guido
Ennas
a,
Giacomo
Picci
a,
Robert P.
Davies
*c and
M. Carla
Aragoni
*a
ab,
Massimiliano
Arca
a,
Anna
Pintus
a,
Vito
Lippolis
a,
Claudia
Caltagirone
a,
Simon J.
Coles
d,
James B.
Orton
d,
Guido
Ennas
a,
Giacomo
Picci
a,
Robert P.
Davies
*c and
M. Carla
Aragoni
*a
aDipartimento di Scienze Chimiche e Geologiche, Università degli Studi di Cagliari, Cittadella Universitaria, SS. 554 bivio Sestu, 09042 Monserrato – Cagliari, Italy. E-mail: aragoni@unica.it
bCentro Servizi di Ateneo per la Ricerca, Università degli Studi di Cagliari, Cittadella Universitaria, SS. 554 bivio Sestu, 09042 Monserrato – Cagliari, Italy
cDepartment of Chemistry, Imperial College London, White City Campus, 80 Wood Lane, London W12 0BZ, UK. E-mail: r.davies@imperial.ac.uk
dUK National Crystallography Service, School of Chemistry, Faculty of Engineering and Physical Sciences, University of Southampton, SO17 1BJ, UK
First published on 17th January 2023
Abstract
A novel butterfly-shaped tetracarboxylic acid [9,9′-methylene-bis(9-methylfluorene-2,7-dicarboxylic acid), H4L] featuring a co-facial bifluorene core was designed and synthesised. Reactions of H4L with CdII produced the luminescent supramolecular frameworks 2 and 3, with different dimensionalities and wingspans of L4−. Their solid-state emission properties were rationalised based on the torsional dynamics of the facing bifluorene units by means of X-ray diffraction analysis and TD-DFT calculations.
Introduction
Fluorene derivatives have been extensively studied in the past years owing to their versatile role in materials science, and particular interest has been devoted to polyfluorenes due to their electroactive and photoactive nature that allows for the preparation of blue-light emitting diodes with tunable electronic and emission properties.1–6 Oligo- and poly-fluorenes were employed as models in the design of functional polymeric materials for the understanding of excimer formation and hole stabilization in π-stacked assemblies.7–12 Supramolecular constructs originating from the interaction of fluorene derivatives and metal ions were prepared giving rise to coordination polymers (CPs) and metal–organic frameworks (MOFs) featuring remarkable properties allowing for their application as separating agents,13–15 sensors16–18 and electro-phosphorescent materials.19 The key role of fluorene derivatives in the preparation of sensing materials lies in the variation of their photoluminescent response according to the nature of the interacting guests. The role of poly-fluorenes as supramolecular synthons is still largely untapped, and all the above-cited examples include either single fluorene or spiro-bifluorene derivatives.20,21 Belonging to the above-mentioned class of poly-fluorene derivatives, co-facial bifluorenes can provide additional advantages when applied to crystal engineering, since the overlapping extent of the facing fluorene units may potentially lead to variations in the fluorescent response. The chemical and geometrical features of the substituents introduced in the fluorene rings influence in turn the face-overlapping and the resulting emission properties of the material.7 Moreover, the interaction with metal nodes in the self-assembly could itself affect the geometry adopted by the organic linkers leading to unprecedented architectures and modulated fluorescence properties. Therefore, we designed a brand new co-facial bifluorene-based linker, 9,9′-methylene-bis(9-methylfluorene-2,7-dicarboxylic acid), H4L, as a tecton for the assembly of fluorescent supramolecular networks. The unprecedented design of H4L with four carboxylic acid groups distributed on two methylene-bridged fluorene units opens new perspectives in the preparation of robust and optically active porous materials based on polycarboxylic acids.22Results and discussion
Synthesis and structural characterization
The precursors 1b and 1c were prepared starting from the commercial compound 1a, as previously described.7 The linker H4L was prepared according to the synthetic route outlined in Scheme 1 by adapting a procedure we previously reported for the synthesis of siloxane-based linkers.23 | ||
| Scheme 1 Synthetic steps leading to H4L starting from compound 1a. | ||
The tetrabrominated compound 1c and the linker H4L were structurally characterized by means of single crystal X-ray diffraction (XRD) analysis (Tables S1 and S4†).‡ Compound 1c crystallises in the monoclinic space group P21/c with a single molecule in the asymmetric unit (Fig. S1†). The two fluorene units are almost co-facial with an angle α = 14° between the planes of the fluorene moieties and a dihedral angle τ = 25° calculated along the torsional coordinate via methylene linkers, in a “closed wing” configuration (see Fig. 1 for the α and τ definitions).
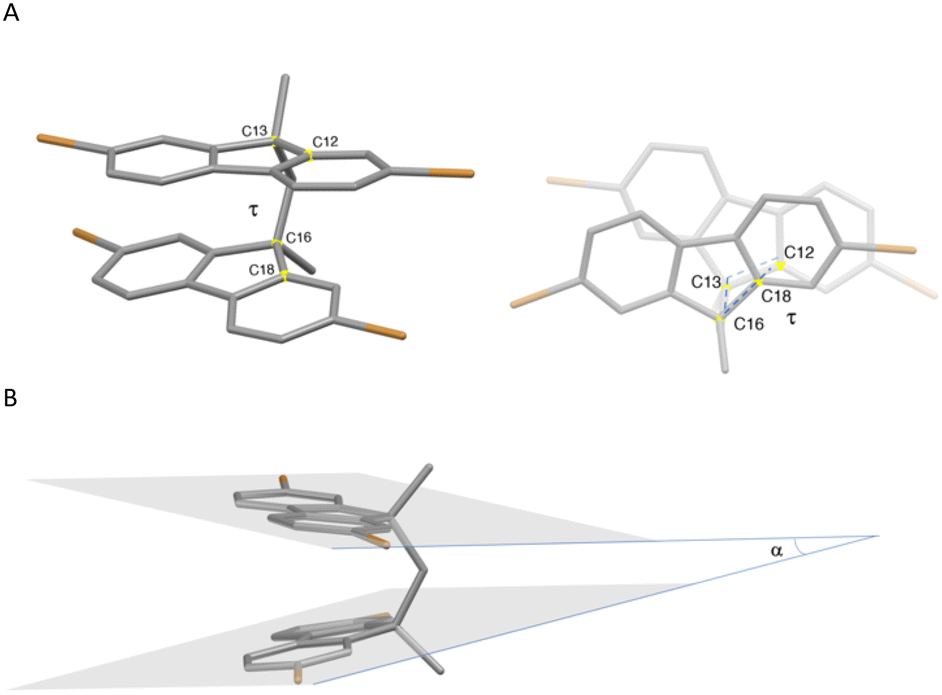 | ||
| Fig. 1 Crystal structure of 1c: Torsion angle τ (C12–C13–C16–C18, A) and angle α (B) parameters. | ||
The outer rings of both fluorene units show intra- and inter-molecular π–π interactions with centroid distances of 3.63 and 3.73 Å, respectively, leading to face-to-face dimeric constructs packed along the a-axis through Br⋯Br weak contacts in a herringbone pattern leading to a 2D network (Fig. S2 and S3†).
The tetracarboxylic acid H4L crystallises in the triclinic space group P![[1 with combining macron]](https://www.rsc.org/images/entities/char_0031_0304.gif) with one molecule in the asymmetric unit (Fig. 2A).
with one molecule in the asymmetric unit (Fig. 2A).
 | ||
| Fig. 2 A: Asymmetric unit of H4L. Thermal ellipsoids were drawn at a 50% probability level. B: Packing view of the 1D hydrogen-bonded chains; intramolecular and intermolecular π–π centroid distances: a = 3.47, b = 3.66, and c = 3.89 Å; HBs: d: O6i–H6i⋯O1 2.641(3), 1.79(6), 175(5); e: O2–H2⋯O5i 2.604(3), 1.82(2), 160(2); f: O8ii–H8ii⋯O3 2.589(3), 1.75(5), 170(6); g: O4–H4⋯O7ii 2.664(3) Å, 1.84(6) Å, 171(6)°. Hydrogen atoms were omitted for clarity except for those involved in HBs. i = 1 − x, −y, −z; ii = 1 − x, 2 − y, 1 − z. | ||
This butterfly-shaped compound features an opening angle α = 20° wider than that found for 1c.
The compound H4L features four carboxylic groups, located at the 2 and 7 positions of each fluorene moiety, almost coplanar to the respective fluorene moieties [torsion angles in the range 5.8(5)–13.7(3)°]. The HBs involving the carboxylic groups of both fluorene moieties induce a dramatic decrease of τ angle (τ = 5°) and a larger overlap between the co-facial fluorene units, which results in intramolecular (a and b in Fig. 2B) and intermolecular (c in Fig. 2B) π–π interactions featuring centroid distances of 3.47, 3.66, and 3.89 Å, respectively, that stack the chains in 2D layers (Fig. 2B). The layers interact by means of weak HBs in an overall 3D network (Fig. S4 in the ESI†).
Upon deprotonation, the four carboxylic groups are potentially available for metal coordination. H4L was therefore reacted with Cd(NO3)2·4H2O in a 1![[thin space (1/6-em)]](https://www.rsc.org/images/entities/char_2009.gif) :2 molar ratio in a dimethylacetamide (DMA)/H2O mixture (2:1 v/v) at 90 °C for 24 h. The reaction yielded colourless crystals characterized by single-crystal XRD as the CP [Cd2L(H2O)6·2H2O]∞ (2). Compound 2 crystallised in the triclinic space group P with a single L4− unit, two CdII ions, six coordinated and two co-crystallised water molecules in the asymmetric unit (Fig. 3A and Table S2†).
:2 molar ratio in a dimethylacetamide (DMA)/H2O mixture (2:1 v/v) at 90 °C for 24 h. The reaction yielded colourless crystals characterized by single-crystal XRD as the CP [Cd2L(H2O)6·2H2O]∞ (2). Compound 2 crystallised in the triclinic space group P with a single L4− unit, two CdII ions, six coordinated and two co-crystallised water molecules in the asymmetric unit (Fig. 3A and Table S2†).
 | ||
| Fig. 3 Crystal structure of CP 2: A: view of 2 with the atom labelling scheme, ellipsoids at a 50% probability level (H atoms omitted for clarity). B: View of the coordination polymer (only H atoms of the water molecules are shown). HBs: a: O9–H9A⋯O6 2.759(4), 1.97(3), 152.2(2); b: O12–H12A⋯O4i 2.693(4) Å, 1.85(3) Å, 174.2(2)°. i = −x, −y, 1 − z; ii = 1 − x, 2 − y, −z. | ||
Both CdII ions are hepta-coordinated in a pentagonal–bipyramidal geometry: the five equatorial positions are occupied by two chelating carboxylates and one water molecule; two axially bound water molecules complete the coordination sphere around the metal ions (Fig. 3A).
The tetracarboxylate bifluorene unit features α and τ angles of 19 and 25° and intramolecular centroid distances of 3.77 and 3.70 Å, respectively, slightly longer than those found in H4L, due to the increased displacement between the facing bifluorene planes. The L4− spacers bridge couples of symmetry-related Cd1 and Cd2 ions through the four carboxylate anions giving rise to infinite ribbons (Fig. 3B). The ribbons pack through strong HB interactions involving the carboxylate oxygen atoms and both coordinated and co-crystallised water molecules (Fig. S5 and S6 and Table S5 in the ESI†).
A 1:2 molar ratio reaction between H4L and Cd(NO3)2·4H2O in the same DMA/H2O (2:1 v/v) mixture was also performed at 120 °C affording crystals of two different morphologies derived via the concurrent formation of the previously described CP 2 and a 3D-MOF with the formula [Cd2L(H2O)3·3H2O]∞ (3).‡ Compound 3 crystallised in the orthorhombic non-centrosymmetric space group Cmc21. The asymmetric unit comprises halves of four crystallographically independent CdII ions, a fully deprotonated L4− ligand and five coordinated water molecules, four of which lie on special positions (Fig. 4A and Table S3†).§ The linker shows angles α and τ of 7 and 22°, respectively, with intramolecular centroid distances of 3.56, 3.24 and 3.62 Å.
 | ||
| Fig. 4 Crystal structure of MOF 3: A: asymmetric unit. B: Cd coordination environments. Interactions are summarised in Table S6.†i = 3/2 − x, 1/2 + y, z; ii = 3/2 − x, 3/2 − y, −1/2 + z; iii = 2 − x, 2 − y, −1/2 + z; iv = 3/2 − x, 1/2 + y, z; v = 2 − x, y, z; vi = 1/2 + x, 3/2 − y, −1/2 + z. | ||
The four carboxylate groups of L4− coordinate four independent cadmium ions adopting three different coordination modes (see Scheme S1†): I) chelating; II) chelating/bridging; III) bridging. A detailed description of the different coordination geometries around each cadmium ion is shown in Fig. 4B.
Cd1, Cd3, and Cd4 are hepta-coordinated and adopt a capped trigonal prismatic geometry constructed by six differently coordinated symmetry related carboxylates and one capping H2O molecule. The Cd2 ion is hexa-coordinated into a distorted octahedral geometry by two μ2-oxygen atoms from two different L4− anions and four water molecules (Fig. 4B and Table S6†). The described coordination environments generate a MOF with S-shaped (sinusoidal) secondary building units (SBUs) formed by edge-shared Cd-polyhedra of different shapes (Fig. 5A).24 The overall three-dimensional MOF 3 shown in Fig. 5B is characterized by ellipsoidal channels with openings of approximatively 8.5 × 3 Å2 that occupy 17% of the unit cell volume.
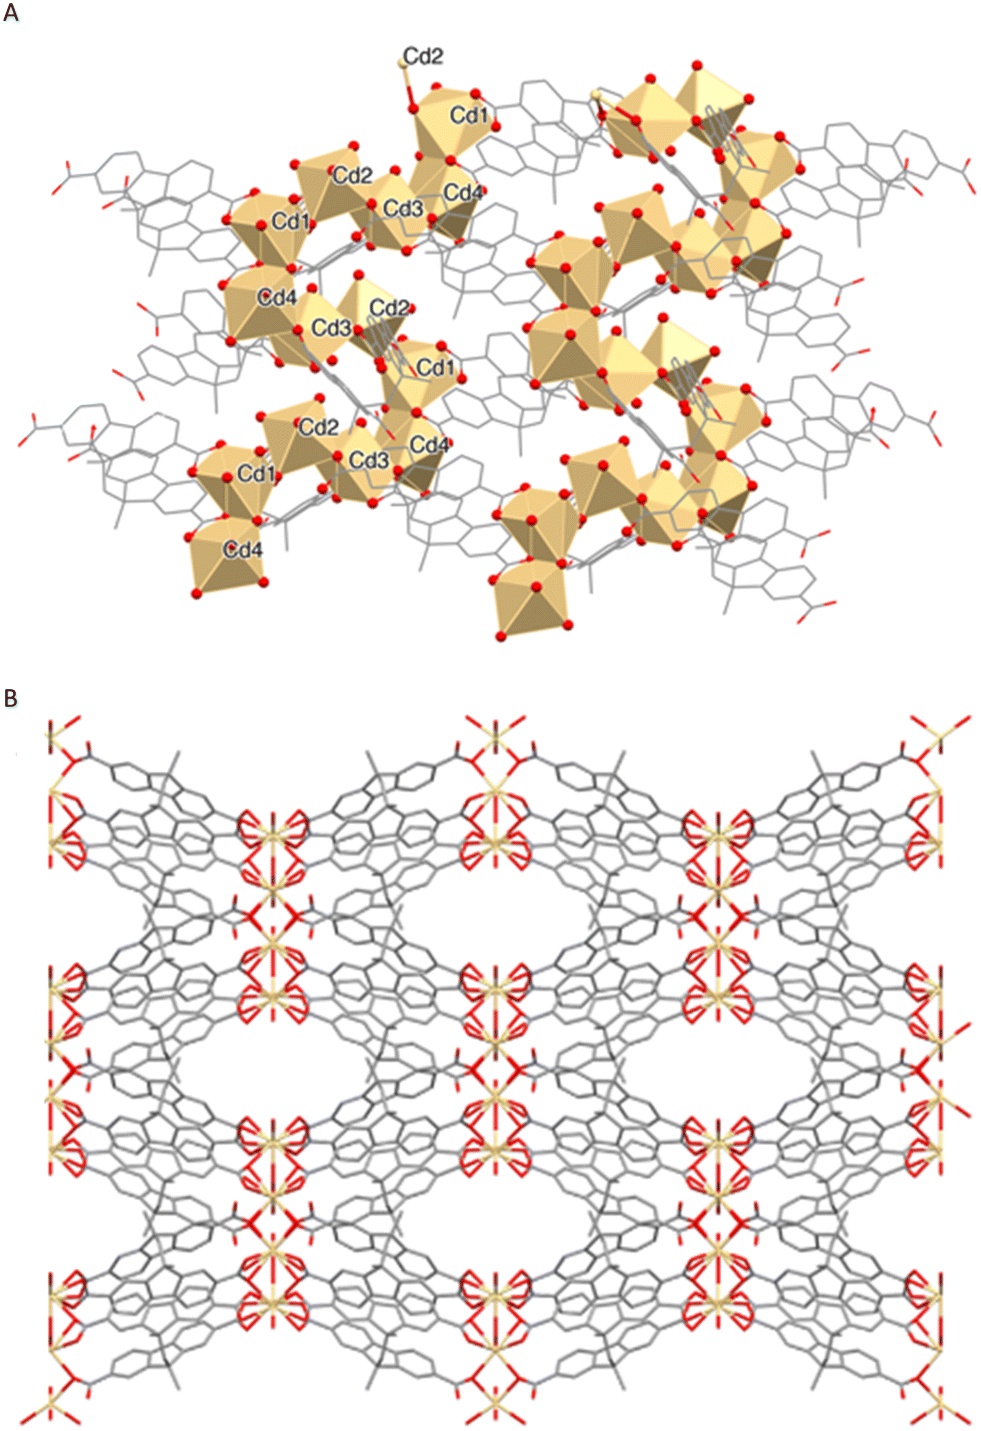 | ||
| Fig. 5 A: Packing view of the infinite sinusoidal arrangement formed by edge-shared Cd-polyhedra. B: Packing diagram along the c-axis. | ||
Three disordered water molecules are present in the asymmetric unit and were subjected to the SQUEEZE routine.§ Unfortunately, since compound 3 was not obtained pure, stability on evacuation, porosity measurements, and gas sorption studies were not carried out.
Powder XRD measurements were carried out on the solid-state products obtained by different reactions of H4L and Cd(NO3)2·4H2O performed under different experimental conditions. The experimental results, compared with the simulated patterns calculated from the single crystal XRD data of CP 2 and MOF 3 (Fig. S7†), show that depending on the reaction temperature, either pure CP 2 (90 °C) or a mixture of 2 and 3 (120 °C) is formed (named 2 + 3 subsequently). All attempts to obtain a bulk sample of pure 3 failed. TGA analyses performed on 2 and 2 + 3 show that both samples had a significant weight loss in the range 120–170 °C suggesting a decomposition of both compound 2 and mixture 2 + 3. Accordingly, the DSC measurements show endothermic processes in the same temperature range (Fig. S8†).
Photophysical measurements
The absorption and emission spectra of the synthesised compounds were recorded both in solution and in the solid state for H4L and in the solid state for 2 and mixture 2 + 3, whilst no emission was observed for 1c. In DMSO solution, H4L featured a structured absorption band at about 310 nm. A similar spectral shape could be seen in the diffuse reflectance spectrum, showing a broad absorption in the range 300–380 nm, with a maximum at about 335 nm (Fig. S9†). Compound 2 and mixture 2 + 3 display diffuse reflectance spectra very similar to that of H4L (Fig. S10†).Excitation at 303 and 372 nm led to strong fluorescence emission bands at 436 and 491 nm in DMSO solution and in the solid-state, respectively, for H4L (Fig. S9†). Therefore, in the solid state both the absorption and emission energies are bathochromically shifted as compared to those recorded in DMSO solution. A comparison with the solid-state emission properties of the mono-fluorene derivative 9,9′-dimethylfluorene-2,7-dicarboxylic acid,25 reported at 410 nm, evidences a significative difference in the emission wavelength on passing from the mono- to the bi-fluorene derivative, tentatively ascribable to the co-facial arrangement of the fluorene units (τ = 5°). A comparison of the normalized emission spectra of H4L, 2 and 2 + 3 (Fig. 6) shows a shift of the emission band to 433 nm for both cadmium supramolecular constructs 2 and 2 + 3.
 | ||
| Fig. 6 Normalised solid-state emission spectra determined for H4L (blue), 2 (green) and mixture 2 + 3 (red). λex = 372, 330, and 340 nm for H4L, 2, and 2 + 3, respectively. | ||
It is worth pointing out that differences of only 5 nm in the solid-state emission wavelengths were evidenced on passing from the above mentioned 9,9′-dimethylfluorene-2,7-dicarboxylic acid to the corresponding zinc and cadmium supramolecular constructs.25 The significant variation observed in the case of our systems can be tentatively explained by taking into account the increased displacement between the facing fluorene planes found in cadmium supramolecular constructs as compared to free H4L (τ = 5, 25 and 22° for H4L, 2 and 3, respectively; see above).
TD-DFT calculations
The absorption and emission properties of H4L were elucidated by means of DFT26 and TD-DFT calculations (PBE0//def2-SVP; see the Experimental section and Tables S7–S9†)27,28 carried out in the gas phase and in DMSO by using the polarizable continuum self-consistent reaction field model in its integral-equation formalism (SCRF IEF-PCM).29 Notably, in the gas phase the four carboxylic groups show orientations very close to those determined by XRD, with torsion angles with respect to the relevant fluorene moieties in the range 2.7–10.5°. The torsion angle between the two fluorene units calculated at the optimised geometry for H4L is τ = 26.0°, i.e., it is very similar to the structural value of 1c. This similarity suggests that the crystal-packing interactions and, in particular, the strong HBs involving the carboxylic acids, could be responsible for the small τ value of the facing fluorene units found in the crystal structure of H4L, which was proved to be directly related to the energies of the ground (GS) and excited states (ES) involved in the absorption and emission processes calculated for H4L. In Fig. 7 a quantitative Jablonski diagram for the singlet states calculated for H4L at the optimised geometry is depicted. | ||
| Fig. 7 Quantitative energy diagram for the absorption and emission processes calculated for H4L. The energies of the GS (red curve) and ES #1 (black line) are depicted as a function of the torsion angle τ. EGS and EES are the minimum energies of the ground state and excited states, respectively (neglecting ZPE corrections). Arrows schematically represent the excitation and relaxation paths (see Experimental section and Table S8† for calculated absorption and emission energies and wavelengths). | ||
The allowed vertical transition lying at the lowest energy (GS → ES #4) is calculated for H4L at Eabs = 4.162 eV (corresponding to λabs = 297.9 nm) in the gas phase. In DMSO, the corresponding excitation involves the GS → ES #3 transition (Eabs = 4.089 eV; λabs = 303.2 nm) in excellent agreement with the experimental value (λabs = 310 nm; see above). These transitions are assigned to Kohn–Sham (KS) HOMO−1 → KS-LUMO+1 and KS-HOMO → KS-LUMO one-electron π–π* excitations [see Fig. S11† and Table 1; natural transition orbitals (NTOs)30 involved in the GS → ES #4 transition are depicted in Fig. S12†], i.e., they involve MOs delocalised on both fluorene units of H4L. To investigate the emission properties of H4L, the geometry of ES #1 was optimised, and the emission energy Efluo and wavelength λfluo were calculated (see the ESI† for details; λfluo = 450.2 and 468.2 nm in the gas phase and DMSO solution, respectively, Table S8†). According to Kasha's rule,31 after internal conversion ES #4 → ES #1 and vibrational relaxation of the first excited state, luminescent emission occurs from ES #1 to GS.
| Gas phase | DMSO | |||||||
|---|---|---|---|---|---|---|---|---|
| Exc. State | #1 | #2 | #3 | #4 | #1 | #2 | #3 | #4 |
| a KS-HOMO = MO 143. | ||||||||
| E abs | 3.869 | 3.917 | 3.974 | 4.162 | 3.727 | 3.920 | 4.089 | 4.093 |
| λ abs | 320.5 | 316.6 | 312.0 | 297.9 | 332.7 | 316.3 | 303.2 | 302.9 |
| f | 0.009 | 0.014 | 0.025 | 0.842 | 0.014 | 0.032 | 1.257 | 0.016 |
| Excitationsa | 143 → 144 (93%) | 142 → 144 (41%) | 142 → 145 (94%) | 142 → 144 (54%) | 143 → 144 (98%) | 142 → 144 (35%) | 142 → 144 (62%) | 142 → 145 (99%) |
| 143 → 145 (58%) | 143 → 145 (36%) | 143 → 145 (63%) | 143 → 145 (32%) | |||||
The most remarkable difference between the metric parameters optimised for the GS and ES #1 involves the τ angle (Fig. 1; τ = 26.0 and 7.7° for GS and ES #1, respectively in the gas phase; τ = 21.6 and 2.3° for GS and ES #1, respectively in DMSO), indicating that vibrational relaxation processes result in a variation of the relative orientation of the two fluorene units. After the emission due to the radiative relaxation ES #1 → GS, the GS undergoes a vibrational thermalization to the equilibrium geometry. As previously observed, the XRD analysis showed that in the solid state H4L is locked in a co-facial conformation of the two fluorene moieties with a τ angle (5°) that is very close to that optimised for ES #1 (7.7°), thus possibly accounting for the difference in the transition energies determined in the solid state with respect to the corresponding values recorded in DMSO (see above).
DFT calculations were extended to the [Cd4L2(H2O)16] model complex (4, Fig. S13†), mimicking a portion of CP 2. In complex 4, the L4− anion bridges four CdII metal ions by means of the four carboxylate groups, the water molecules completing a distorted octahedral coordination at each metal ion. Notably, the frontier KS-MOs calculated for complex 4 at the optimised geometry (τ = 24.43°) are π-in-nature MOs exclusively localized on the aromatic portion of the bifluorene moieties of the L4− anion (Fig. S13†). Accordingly, excitation processes are completely ligand-centred and occur at energy values very similar to that calculated for H4L. In fact, the first allowed electronic absorption at the lowest energy involves the transition from the GS to ES #4 (EGS–ES#4 = 3.941 eV; λGS–ES#4 = 314.6 nm; f = 0.959; Table S9†) and this is mainly due to the KS-HOMO−1 → LUMO and HOMO → LUMO+1 monoelectronic excitations (the main NTOs involved in the GS → ES #4 transition are depicted in Fig. S14†). Finally, neglecting the vibrational relaxation of ES #1 of H4L and 4, the lowest energy of the GS → ES #1 transition calculated 4 with respect to H4L might account for the blue-shift of 2 and the 2 + 3 mixture as compared to the starting ligand H4L (Fig. 6).
Conclusion
The results reported on the new bifluorene–tetracarboxylate 9,9′-methylene-bis(9-methylfluorene-2,7-dicarboxylic acid) (H4L) and its CP (2) and MOF (3) assemblies show the potential of the spacer in the realm of supramolecular chemistry due to its structural features and intrinsic fluorescence and of the possibility of varying the emission properties either by changing the carboxylate coordination environments or by acting on its geometrical features.In summary, the peculiar solid-state co-facial constrained conformation of H4L (absent in DMSO solution) can be considered responsible for its emission at higher energy as compared to mono-fluorene derivatives and to the CdII complexes 2 and 3. This suggests not only that the emission energies of bifluorene derivatives can be fine-tuned by structural modifications affecting their rigidity but also that subtle structural modifications, such as the introduction of terminal carboxylates, can be fundamental in determining the resulting emission energies.
The presented ligand can thus be considered the first precursor of a novel family of π-stacked carboxylate synthons to be used in crystal engineering suitable for sensing applications. Further work is being conducted in our labs at both the theoretical and experimental levels to study the reactivity of H4L and structurally related ligands with different cations and anions in solution and in the solid state.
Experimental
Materials
All chemicals, reagents, and solvents were purchased from Sigma-Aldrich, TCI, Fluorochem, or VWR Chemicals and used as received without any further purification if not otherwise stated.Spectroscopic characterisation
FT-Infrared spectra were recorded on a Thermo Nicolet 5700 spectrometer on KBr pellets.Mass spectra were recorded on a Waters LCT Premier (ES-ToF)/Acquity i-Class spectrometer.
NMR measurements were performed using a Bruker Avance III HD 400 MHz spectrometer. The chemical shifts (δ) are reported in ppm and referenced against the solvent residue. UV-vis measurements in solution were recorded in the range 190–1100 nm using quartz cuvettes with a path length of 1 cm by means of an Agilent Cary 5000 UV-vis–NIR dual-beam spectrophotometer.
Diffuse reflectance measurements were carried out using an Agilent Cary 5000 UV-vis–NIR dual-beam spectrophotometer equipped with a diffuse reflectance accessory. Photoluminescence emission spectra in solution and in the solid-state were collected either with a Varian Cary Eclipse spectrofluorometer or a PerkinElmer LS55 fluorescence spectrometer.
DSC and TGA measurements
Thermogravimetric analysis (TGA) and differential scanning calorimetry analysis (DSC) were performed using a PerkinElmer series 7 thermal analyzer in the temperature range between 100 and 400 °C (20 °C min−1) under nitrogen flow (40 mL min−1).X-ray diffraction
Single-crystal X-ray diffraction data of H4L and 3 were collected with CuKα radiation using a Rigaku 007HF diffractometer equipped with VariMax confocal mirrors, an AFC11 goniometer, a HyPix-6000 detector, and an Oxford Cryosystems low-temperature device operating at 100 K. The diffractometric data for compounds 1c and 2 were collected with MoKα radiation using a Rigaku FRE+ diffractometer equipped with VHF VariMax confocal mirrors, an AFC12 goniometer, a HyPix-6000 detector, and an Oxford Cryosystems low-temperature device operating at 100 K. Data collection and processing were performed using CrysAlisPro (Rigaku Oxford Diffraction).32 The structures were then solved with the ShelXT33 structure solution program (using the Intrinsic Phasing solution method) and by using Olex234 as the graphical interface with their models refined with version 2018/3 of ShelXL35 using least squares minimization.Powder X-ray diffraction analyses were performed using a Bruker D8 ADVANCE equipped with CuKα radiation and a LYNXEYE detector in 1D mode. The scan step was set to 0.05° and a scan speed of 0.5 s per step in the range from 4 to 30° (2Θ) was used. Experimental patterns were then compared with those calculated from single-crystal X-ray diffraction analysis by means of DIFFRAC.EVA.
TD-DFT calculations
Theoretical calculations were carried out at the density functional theory (DFT)26 level by using the Gaussian 1636 commercial suite of computational software on H4L by adopting the PBE027 hybrid functional paralleled by different basis sets, namely, 6-31G, 6-311G, 6-311+G(d,p)37 and Ahlrichs split-valence double-ζ plus polarization (pVDZ) sets, both in their original form38 and in Weigend's28 recent formulation (def2-SVP), and the corresponding triple-ζ plus polarization def2-TZVP.39 Notwithstanding numerous attempts, including the variation of the SCF convergence algorithm and the energy optimization threshold, the optimization of excited state ES #1 was unsuccessful with the largest basis sets. The validation of the computational setup was carried out by comparing the results from TD-DFT calculations with the experimental values, in particular the absorption and the emission wavelengths (λabs and λem, respectively) for H4L. Among the remaining basis sets, absorption and emission energies were calculated both in the gas phase and in DMSO solution, solvation being implicitly considered by means of the polarizable continuum SCRF model in its integral equation formalism (IEF-PCM), describing the cavity of the complexes within the reaction field (SCRF) through a set of overlapping spheres.29 Very similar results were obtained (with τ angles varying within 1.5° and absorption energies within 0.07 eV), with an optimal balance between the reliability of the calculated parameters and the computational costs obtained with the def2-SVP basis set (Table S7 in the ESI†).Finally, the results achieved with the PBE0 functional were compared with those obtained with the hybrid exchange–correlation functional using the Coulomb-attenuating method CAM-B3LYP,40 including long-range corrections.41 Unfortunately, this functional largely overestimated both absorption and emission energies and was eventually discharged (CAM-B3LYP/def2SVP: gas phase, λabs = 279.2 nm, λem = 393.0 nm; DMSO λabs = 284.1 nm, λem = 406.2 nm). The effect of the mutual orientation of the carboxylic groups was investigated by optimizing H4L separately not only in the structural conformation, showing the OH groups disposed one above the other, but also in the alternate disposition. The energy difference between the two isomers was found to be negligible differing from the former by 4.94 × 10⁻⁴ Hartree (corresponding to 0.31 kcal mol−1). Calculations were extended to complex 4 at the same PBE0//def2-SVP theoretical level. For all the compounds, tight SCF convergence criteria and fine numerical integration grids were used. Optimized geometries were verified by harmonic frequency calculations, including the determination of thermochemistry parameters (zero-point energy ZPE corrections and thermal corrections to enthalpy and Gibbs free energy) and the calculation of FT-Raman frequencies. A complete natural population analysis (NPA) was carried out with the natural bond orbital (NBO)42 partitioning scheme to investigate the charge distributions. Absorption vertical transition energies, wavelengths, and oscillator strengths were calculated at the time-dependent (TD) DFT level, by evaluating the ten lowest excited states. The calculation of absorption and emission energies was carried out as outlined previously.43,44 The frontier Kohn–Sham molecular orbitals involved in the electronic absorption at the lowest energies are depicted in Fig. S11† for H4L and Fig. S13† for the model complex 4. The absorption maximum at the lowest energy was calculated at the TD-DFT level by considering the lowest vertical transition with non-negligible oscillator strength (GS → ES #4). The natural transition orbitals (NTOs)30 with the largest occupation for the transition GS → ES #4 in the gas phase are depicted in Fig. S12 and S14† for H4L and complex 4, respectively.
Emission energies were calculated for H4L by evaluating the GS → ES #1 energy at the geometry optimized for ES #1. Although any attempts to optimize ES #4 did not achieve an acceptable SCF convergence, the geometry of ES #1 in the gas phase converged to τ = 35.3°, thus suggesting the hypothesis that a direct crossing of ES #4 and ES #1 may occur at about τ = 30°. The energy curves in Fig. 7 were calculated by adapting a Morse-type equation to the electronic energy E as a function of τ:
| E = Ee·{[1 − ea(τ−τe)]2} |
with k being the force constant at the minimum energy value and being fitted with the calculated Eabs and Efluo values (Tables 1 and S8;† |a| = 1.826 × 10⁻⁴ and 2.206 × 10⁻⁴ for the GS and ES #1, respectively). Solvation in absorption/emission processes was calculated within a non-equilibrium approach, by neglecting solvent molecular motion in the timescale of absorption and fluorescence processes.

Molden 6.245 and GaussView 6.0.1646 were used to analyze Kohn–Sham (KS) molecular orbital (MO) compositions and energies. Chemissian 4.5447 was used to evaluate the atomic orbital contributions to KS-MOs and to analyse the contribution of one-electron excitations to molecular transitions. All calculations were carried out using the CINECA Galileo100 supercomputer.
Synthesis
Compounds 1a–1c were prepared as previously described.7:1 v/v), a solution of H4L in DMA (200 μL, 0.25 M), and an aqueous solution of Cd(NO3)2·4H2O (400 μL, 0.25 M). The mixture was sonicated for a few minutes and then heated to 90 °C for 24 h. The mixture was then cooled to room temperature at a rate of 10 °C h−1. Colorless crystals were isolated and structurally characterized.
:1 v/v), a solution of H4L in DMA (200 μL, 0.25 M), and an aqueous solution of Cd(NO3)2·4H2O (400 μL, 0.25 M). The mixture was sonicated for a few minutes and then heated to 120 °C for 24 h. The mixture was then cooled to room temperature at a rate of 10 °C h−1. Two different morphologies of colorless crystals were isolated and structurally characterized as compounds 2 and 3.
Author contributions
Conceptualisation: MCA, RPD, EP, and MA. Data curation: MCA, EP, RPD, MA, SJC, JBO, and GE. Investigation: MCA, EP, RPD, MA, SJC, JBO, GE, and AP. Writing (original draft): MCA, RD, and EP. Writing (review and editing): all the authors. Funding acquisition: CC and LP. Validation: all the authors.Conflicts of interest
There are no conflicts to declare.Acknowledgements
The authors kindly acknowledge CINECA for the computational resources on the Galileo100 supercomputer accessed within the ISCRA project BIFluoex, Fondazione di Sardegna for financial support, CeSAR for PXRD facilities, and Daniele Mele for the TOC and the cover artwork. GP would like to thank the Italian Ministry of Education (MUR) for a postdoc scholarship (PRIN 2017 project 2017EKCS35).Notes and references
- B. Liu, W.-L. Yu, Y.-H. Lai and W. Huang, Chem. Mater., 2001, 13, 1984–1991 CrossRef CAS.
- X. Guo, M. Baumgarten and K. Müllen, Prog. Polym. Sci., 2013, 38, 1832–1908 CrossRef CAS.
- M. Leclerc, J. Polym. Sci., Part A: Polym. Chem., 2001, 39, 2867–2873 CrossRef CAS.
- U. Scherf and E. J. W. List, Adv. Mater., 2002, 14, 477–487 CrossRef CAS.
- W. L. Yu, J. Pei, W. Huang and A. J. Heeger, Adv. Mater., 2000, 12, 828–831 CrossRef CAS.
- X. Gong, P. K. Iyer, D. Moses, G. C. Bazan, A. J. Heeger and S. S. Xiao, Adv. Funct. Mater., 2003, 13, 325–330 CrossRef CAS.
- D. Wang, M. V. Ivanov, D. Kokkin, J. Loman, J.-Z. Cai, S. A. Reid and R. Rathore, Angew. Chem., Int. Ed., 2018, 57, 8189–8193 CrossRef CAS PubMed.
- R. Rathore, S. H. Abdelwahed and I. A. Guzei, J. Am. Chem. Soc., 2003, 125, 8712–8713 CrossRef CAS PubMed.
- D. Kokkin, M. Ivanov, J. Loman, J. Z. Cai, B. Uhler, N. Reilly, R. Rathore and S. A. Reid, J. Chem. Phys., 2018, 149, 13431 CrossRef PubMed.
- H. Qi, J. Chang, S. H. Abdelwahed, K. Thakur, R. Rathore and A. J. Bard, J. Am. Chem. Soc., 2012, 134, 16265–16274 CrossRef CAS PubMed.
- B. Uhler, M. V. Ivanov, D. Kokkin, N. Reilly, R. Rathore and S. A. Reid, J. Phys. Chem. C, 2017, 121, 15580–15588 CrossRef CAS.
- C. Poriel, C. Quinton, F. Lucas, J. Rault-Berthelot, Z. Jiang and O. Jeannin, Adv. Funct. Mater., 2021, 31, 2104980 CrossRef CAS.
- X. Duan, R. Lv, Z. Shi, C. Wang, H. Li, J. Ge, Z. Ji, Y. Yang, B. Li and G. Qian, J. Solid State Chem., 2019, 277, 159–162 CrossRef CAS.
- X. Duan, Q. Zhang, J. Cai, Y. Cui, C. Wu, Y. Yang and G. Qian, Microporous Mesoporous Mater., 2014, 190, 32–37 CrossRef CAS.
- H. J. Park, J. K. Jang, S. Y. Kim, J. W. Ha, D. Moon, I. N. Kang, Y.-S. Bae, S. Kim and D. H. Hwang, Inorg. Chem., 2017, 56, 12098–12101 CrossRef CAS PubMed.
- P. Wang, J. Xu, Q. D. Zhuo, Y. S. Ma, H. J. Cheng, X. Y. Tang and R. X. Yuan, Inorg. Chem. Commun., 2016, 67, 14–16 CrossRef CAS.
- J. P. Ma, Y. Yu and Y. Bin Dong, Chem. Commun., 2012, 48, 2946–2948 RSC.
- Y. Hong, S. Sun, Q. Sun, E.-Q. Gao and M. Ye, Mater. Chem. Phys., 2020, 243, 122601 CrossRef CAS.
- Z. You, H. Li, L. Zhang, B. Yu, J. Zhang and X. Wu, J. Phys. Chem. C, 2017, 121, 23072–23079 CrossRef CAS.
- F. Moreau, N. Audebrand and C. Poriel, CrystEngComm, 2019, 22, 293–303 RSC.
- H. D. Guo, X. M. Guo, S. R. Batten, J. F. Song, S. Y. Song, S. Dang, G. L. Zheng, J. K. Tang and H. J. Zhang, Cryst. Growth Des., 2009, 9, 1394–1401 CrossRef CAS.
- L. C. Delmas, A. J. P. White, D. Pugh, A. Evans, M. A. Isbell, J. Y. Y. Heng, P. D. Lickiss and R. P. Davies, Chem. Commun., 2020, 56, 7905–7908 RSC.
- L. C. Delmas, P. N. Horton, A. J. P. White, S. J. Coles, P. D. Lickiss and R. P. Davies, Chem. Commun., 2017, 53, 12524–12527 RSC.
- A. Schoedel, M. Li, D. Li, M. O'Keeffe and O. M. Yaghi, Chem. Rev., 2016, 116, 12466–12535 CrossRef CAS PubMed.
- S. Su, C. Qin, Z. Guo, H. Guo, S. Song, R. Deng, F. Cao, S. Wang, G. Li and H. Zhang, CrystEngComm, 2011, 13, 2935–2941 RSC.
- R. O. Jones, Rev. Mod. Phys., 2015, 87, 897–923 CrossRef.
- C. Adamo and V. Barone, J. Chem. Phys., 1999, 110, 6158–6170 CrossRef CAS.
- F. Weigend and R. Ahlrichs, Phys. Chem. Chem. Phys., 2005, 7, 3297 RSC.
- J. Tomasi, B. Mennucci and R. Cammi, Chem. Rev., 2005, 105, 2999–3094 CrossRef CAS PubMed.
- R. L. Martin, J. Chem. Phys., 2003, 118, 4775–4777 CrossRef CAS.
- M. Kascha, Discuss. Faraday Soc., 1950, 9, 14–19 RSC.
- CrysAlisPro Software System, Rigaku Oxford Diffraction, 2020 Search PubMed.
- G. M. Sheldrick, Acta Crystallogr., Sect. A: Found. Adv., 2015, 71, 3–8 CrossRef PubMed.
- O. V. Dolomanov, L. J. Bourhis, R. J. Gildea, J. A. K. Howard and H. Puschmann, J. Appl. Crystallogr., 2009, 42, 339–341 CrossRef CAS.
- G. M. Sheldrick, Acta Crystallogr., Sect. C: Struct. Chem., 2015, 71, 3–8 Search PubMed.
- M. J. Frisch, G. W. Trucks, H. B. Schlegel, G. E. Scuseria, M. A. Robb, J. R. Cheeseman, G. Scalmani, V. Barone, G. A. Petersson, H. Nakatsuji, X. Li, M. Caricato, A. V. Marenich, J. Bloino, B. G. Janesko, R. Gomperts, B. Mennucci, H. P. Hratchian, J. V. Ortiz, A. F. Izmaylov, J. L. Sonnenberg, D. Williams-Young, F. Ding, F. Lipparini, F. Egidi, J. Goings, B. Peng, A. Petrone, T. Henderson, D. Ranasinghe, V. G. Zakrzewski, J. Gao, N. Rega, G. Zheng, W. Liang, M. Hada, M. Ehara, K. Toyota, R. Fukuda, J. Hasegawa, M. Ishida, T. Nakajima, Y. Honda, O. Kitao, H. Nakai, T. Vreven, K. Throssell, J. A. Montgomery Jr. , J. E. Peralta, F. Ogliaro, M. J. Bearpark, J. J. Heyd, E. N. Brothers, K. N. Kudin, V. N. Staroverov, T. A. Keith, R. Kobayashi, J. Normand, K. Raghavachari, A. P. Rendell, J. C. Burant, S. S. Iyengar, J. Tomasi, M. Cossi, J. M. Millam, M. Klene, C. Adamo, R. Cammi, J. W. Ochterski, R. L. Martin, K. Morokuma, O. Farkas, J. B. Foresman and D. J. Fox, Gaussian 16, Revision C.01, Gaussian, Inc., Wallingford CT, 2016 Search PubMed.
- (a) R. Krishnan, J. S. Binkley, R. Seeger and J. A. Pople, J. Chem. Phys., 1980, 72, 650–654 CrossRef CAS; (b) T. Clark, J. Chandrasekhar, G. W. Spitznagel and P. Von Ragué Schleyer, J. Comput. Chem., 1983, 4, 294–301 CrossRef CAS; (c) M. J. Frisch, J. A. Pople and J. S. Binkley, J. Chem. Phys., 1984, 80, 3265–3269 CrossRef CAS.
- A. Schäfer, H. Horn and R. Ahlrichs, J. Chem. Phys., 1992, 97, 2571–2577 CrossRef.
- F. Weigend, Phys. Chem. Chem. Phys., 2006, 8, 1057–1065 RSC.
- Y. Takeshi, P. D. Tew and N. C. Handy, Chem. Phys. Lett., 2004, 393, 51–57 CrossRef.
- Y. Tawada, T. Tsuneda and S. Yanagisawa, J. Chem. Phys., 2004, 120, 8425–8433 CrossRef CAS PubMed.
- A. E. Reed, R. B. Weinstock and F. Weinhold, J. Chem. Phys., 1985, 83, 735–746 CrossRef CAS.
- D. Jacquemin, E. A. Perpète, G. Scalmani, M. J. Frisch, I. Ciofini and C. Adamo, Chem. Phys. Lett., 2006, 421, 272–276 CrossRef CAS.
- D. Jacquemin and C. Adamo, Chem. Soc. Rev., 2012, 42, 845–856 Search PubMed.
- G. Schaftenaar and J. H. Noordik, J. Comput.-Aided Mol. Des., 2000, 14, 123–134 CrossRef CAS PubMed.
- R. Dennington, T. A. Keith and J. M. Millam, GaussView, Version 6, Semichem Inc., Shawnee Mission, KS, 2016 Search PubMed.
- Chemissian v. 4.67, a computer program to analyze and visualize quantum-chemical calculations written by L. Skripnikov, for the current version, see https://www.chemissian.com Search PubMed.
Footnotes |
| † Electronic supplementary information (ESI) available: Spectroscopic characterization: FT-IR spectra, solution and solid-state absorption and emission spectra, NMR spectra, SC-XRD and PXRD patterns, and DSC and DFT calculations. CCDC 2214498–2214501 For ESI and crystallographic data in CIF or other electronic format see DOI: https://doi.org/10.1039/d2ce01552h |
| ‡ Structural characterization data and selected bond lengths and angles are reported in the ESI.† |
| § A solvent mask was calculated, and 250 electrons were found in a volume of 1220 Å3 per unit cell. This is consistent with the presence of 24 H2O molecules per unit cell. |
| This journal is © The Royal Society of Chemistry 2023 |