DOI:
10.1039/D2CE01149B
(Paper)
CrystEngComm, 2023,
25, 770-784
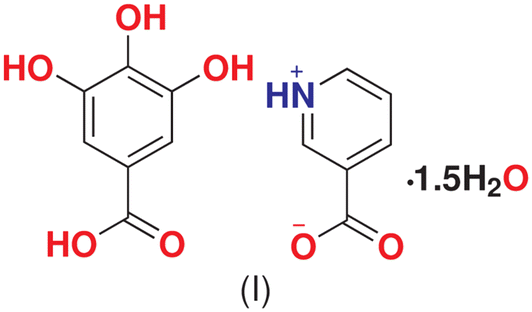
Crystal engineering, electron density analysis, and in situ variable temperature studies on co-crystal between nicotinic acid and gallic acid sesquihydrate†
Received
20th August 2022
, Accepted 21st December 2022
First published on 22nd December 2022
Introduction
Designing co-crystals, using the concept of molecular recognition and self-assembly, has become a fascinating field of crystal engineering. The core of crystal engineering involves intermolecular interactions especially hydrogen bonds utilized to design supramolecular synthons joining the complementary molecules without disturbing their covalent bonds and consequently modifying the bulk properties of the molecular solid state system.1–3 Crystal engineering, especially co-crystallization has gained the attention of scientists in medicinal chemistry to enhance the physical properties such as solubility, bioavailability, stability,4,5 and tabletability, while retaining the biophysical activity of the molecules.6–11 Pharmaceutical drugs are co-crystallized either to reduce their unpleasant effects or to enhance their already existing properties and a number of pharmaceutical co-crystals have been reported in the literature with modified properties.12,13 Crystal engineering is the art of designing new building blocks from already existing molecules following Etter's rules of hydrogen bonding and supramolecular chemistry.14 X-ray diffraction performed with in situ variable temperature gives structural details along with the thermal stability of the co-crystal. Furthermore, if high resolution data become available, electrostatic and topological properties provide deeper insight into the relative strengths of various interactions, which help understanding the mechanism of co-crystallization.
Nicotinic acid (pyridine-3-carboxylic acid), an essential human nutrient obtained from a variety of food items, is available in the market as a supplementary drug under the brand names Niacinol, Niacor, Niaspan, Nicotinex, and Slo-Niacin, it is also used to treat dyslipidemia and recognized as broad-spectrum lipid drug.15,16 In the human body, being a major constituent of NAD (nicotine adenine dinucleotide) and NADP (nicotine adenine dinucleotide phosphate), an essential coenzyme in metabolism, a certain level of nicotinic acid is required for proper body functioning, its concentration below a particular recommended level (13–18 mg per day) leads to pellagra.17 In order to deal with such conditions, niacin supplements are used that cause a harmless but unpleasant effect of cutaneous flushing.18 Nicotinic acid contains a pyridine ring and carboxyl group that are preferentially involved in supramolecular synthon formation. In view of its wider significance, it has been used as an API (active pharmaceutical ingredient) to be co-crystallized with a variety of coformers, such as 4-aminobenzoic acid–nicotinic acid (2/1) co-crystal,19 hesperetin–nicotinic acid co-crystal,20 gallic acid–nicotinic acid,20 3,5-dinoitrobenzoic acid–nicotinic acid molecular complex,21 nicotinium p-hydroxybenzoic acid monohydrate,22 dipicolinic acid–nicotinic acid zwitterionic co-crystal,23 modafinil-nicotinic acid co-crystal,24 and pyrogallol–nicotinic acid co-crystal.25,26
Gallic acid (3,4,5-trihydroxybenzoic acid) monohydrate, a naturally occurring dietary triphenol,27 is an ideal co-former in co-crystallization.28 Along with its biological significance as an anticancer, antibacterial, antioxidant, and anti-inflammatory agent,29–31 the presence of hydroxyl and carboxyl groups has been shown to be responsible for the co-crystal formation, e.g., with a carboxylic acid in which pyridine nitrogen–carboxylic acid heterosynthon or carboxylic acid–carboxylic acid homosynthon is observed.32 The crystal structure and polymorphs of gallic acid monohydrate have been reported.33,34
Our group is working on the applications of charge density methods to understand the mechanism and stability of pharmaceutical cocrystals. Recently, we reported the charge density analysis of a cocrystal between nicotinic acid and pyrogallol (NAPY), which provided insight into the role of nicotinic acid.26 Now, we extend our work to nicotinic acid–gallic acid co-crystal to study if the behavior of nicotinic acid is persistent (Scheme 1). Herein, we report the in situ thermal analysis of NAGA [nicotinic acid and gallic acid (3,4,5-trihydroxybenzoic acid)] co-crystal to explore the behavior of water molecules in maintaining the co-crystal assembly. Detailed electron-density distribution (EDD) analysis was also performed to provide reliable information about all intramolecular and intermolecular interactions involved in maintaining the co-crystal assembly.35
 |
| | Scheme 1 | |
Though charge density studies of small molecules are common in the literature, it is still rare to find charge density analysis of co-crystals. This is mainly due to the reason that co-crystals usually do not diffract to very high resolutions. There are few reports in the literature on the electron density analysis of co-crystals, such as nicotinamide-salicylic acid and oxalic acid,36 melamine–barbital co-crystal,37 piroxicam–saccharin co-crystal,38 carbamazepine–saccharin co-crystal,39 carbamazepine–aspirin co-crystal,40 NAPY,26 antipyrene-2,4 dihydroxy benzoic acid,41 which highlight the significance of electron-density-based topological analysis in the co-crystal assembly. Highly diffracting co-crystals of NAGA allow a thorough multipolar modeling of the electron density to derive electrostatic properties.
Materials and methods
Crystallization
Nicotinic acid (NA) and gallic acid monohydrate (GA) were purchased from Sigma-Aldrich and were used without further purification. An equimolar homogeneous mixture of GA (0.018 g, 0.1 mmol) and NA (0.012 g, 0.1 mmol) was dissolved in 20 ml ethanol–methanol (1![[thin space (1/6-em)]](https://www.rsc.org/images/entities/char_2009.gif) :1) and stirred for an hour. The resulting clear solution was evaporated and colorless block-shaped crystals were formed after one week. The structure solution confirmed the formation of the co-crystal.
:1) and stirred for an hour. The resulting clear solution was evaporated and colorless block-shaped crystals were formed after one week. The structure solution confirmed the formation of the co-crystal.
Characterization, powder X-ray diffraction (PXRD)
The powder diffraction data of GA monohydrate, NA, and GA–NA co-crystal were recorded at room temperature on a Bruker D8 Advance X-ray diffractometer (Cu Kα radiation, λ = 1.54056 Å) in a continuous scanning mode at 40 kV voltage and 40 mA current. Data were collected over a 2θ angle range of 10 to 80° at a scanning rate of 0.1° per minute.
Thermogravimetric analysis
Thermogravimetric analysis (TGA) and differential scanning calorimetry (DSC) of the NAGA co-crystal (1.495 mg in an alumina crucible) were conducted simultaneously using the Perkin-Elmer STA 6000 system-Thermo gravimetric analyzer. The sample was heated at the rate of 10 °C min−1 with a temperature range of 30–500 °C under continuous purging of nitrogen at a flow rate of 20 ml per minute.
Data collection for charge-density analysis
For charge density analysis, NAGA crystals were grown by a slow evaporation method. A single crystal with dimensions of 0.4 × 0.35 × 0.18 mm3 was selected for X-ray diffraction data collection at variable temperatures. The crystal was carefully cleaned using a drop of cedar wood oil and harvested using a Hampton loop. All the data sets were collected on a Bruker D8 Venture diffractometer equipped with a Photon II detector attached to a four-circle goniometer using Mo Kα (λ = 0.71073 Å) from a microfocus radiations source. Initially, room temperature data were collected (CCDC # 2169422). Subsequently, the crystal was cooled to 100(1) K with a stream of dry nitrogen using an Oxford Cobra device to collect high-resolution data up to sinθ/λ 1.163 Å−1 (CCDC # 2169471–2169473). The Cobra device offers a variable temperature between 90–400 K with excellent thermal stability (better than 1 K).
Variable temperature in situ X-ray diffraction (VTXRD) and GA polymorphism
In order to understand the thermal stability and the role of water molecules in the co-crystal assembly, an in situ X-ray diffraction analysis was performed on the basis of the TGA/DSC profile. The temperature was gradually increased at a rate of 6 K per minute to collect data at 310, 350, 355, 360, and 362 K (CCDC # 2169423–2169427) using an Oxford Cobra cryo-device. During all these experiments, no change in the position of the crystal was noted although no adhesive was used to glue the crystal. The crystal structure analysis revealed that the co-crystal assembly remained intact with a small unit cell volume expansion up to 360 K (Fig. S4†). The first significant thermal event happened at 361–363 K, which corresponds to the loss of water. At 362 K, the single crystal pattern changes to a powder pattern. The crystal did not remain a single entity and broke into fragments (Fig. S3†). From this residual mass, we were able to pick a small crystal appropriate for diffraction, the data were then collected at 298 K, the structure solution revealed an anhydrated polymorph of GA42 (CIF # 7 in the ESI†).
The cell refinement, data integration, and data reduction were carried out using the SAINT program.43 The “Index Crystal Faces”44 tool was used for analytical absorption correction using real face indices. Details on the crystal data collection and structure refinement are given in Table 1.
Table 1 Experimental details
| Crystal data |
| Chemical formula |
2(C7H6O5·C6H5NO2·1.5H2O) |
|
M
r
|
640.48 |
| Crystal system, space group |
Triclinic, P![[1 with combining macron]](https://www.rsc.org/images/entities/char_0031_0304.gif) |
| Temperature (K) |
100(1) |
|
a, b, c (Å) |
11.7567(3), 11.7617(3), 12.4158(3) |
|
α, β, γ (°) |
92.673(10), 115.8370(10), 115.5560(10) |
|
V (Å3) |
1334.57(6) |
|
Z Z′ |
4, 2 |
| Radiation type |
Mo Kα (λ = 0.71073 Å) |
|
μ (mm−1) |
0.14 |
| Crystal size (mm) |
0.4 × 0.35 × 0.18 |
| Data collection |
| Diffractometer |
Bruker D8 Venture Photon II detector |
| Absorption correction |
Analytical SADABS2016/2 (Bruker, 2016/2) |
|
T
min, Tmax |
0.948, 0.976 |
| No. of measured and independent reflections |
265516, 34626 |
|
R
int
|
0.042 |
| (sinθ/λ)max (Å−1) |
1.163 |
| Refinement |
IAM_MoPro |
Multipolar_MoPro |
Theoretical |
|
R[F2 > 2σ(F2)], wR(F2), S |
0.042, 0.148, 1.00 |
0.029, 0.046, 1.01 |
0.006, 0.010, 1.00 |
| No. of reflections used (using full data) |
34626 |
34626 |
34626 |
| Weighting scheme |
σw
2 = (asigYo2 + bFo2) where a = 1.08227 b = 0.00026 |
| No. of parameters |
658 |
1311 |
906 |
| Δρmax, Δρmin (e Å−3) |
0.79, −0.61 |
0.20, −0.18 |
0.23–0.25 |
Structure solution and refinement
The crystal structure was solved in the space group P by direct methods using Olex2-1.2.45 All the hydrogen atoms were visible in the different Fourier maps and refined with a riding model for those attached to the carbon atoms. All non-hydrogen atoms were refined anisotropically. The model from Olex2 was imported to Mopro (MoPro_1805_win) software package46 and full-matrix-least squares refinement was carried out using an independent atom model (IAM). The refinement was against the intensity (F2) using full data (I > 0). Initially, the scale factor was refined using data set of the whole resolution range, and the atomic positions (x, y, z) and thermal parameters (Uij) of all non-hydrogen atoms were refined using high-resolution reflections sinθ/λ > 0.7 Å−1 for better thermal deconvolution. The atomic displacement parameters for H atoms were constrained to estimated values from the SHADE server47 [Table S1(a)†]. A weighting scheme, σw2 = (asigYo2 + bFo2) where a = 1.08227 and b = 0.00026 was used; Yo represents the observed intensity. At convergence, deformation electron density maps confirmed the quality of the data, as shown in Fig. S1.† At the end of IAM refinement, R factor, weighted R factor wR (F2) reached 0.042 and 0.148, respectively. The minimum and maximum electron density peaks and r.m.s. values were 0.797, −0.619, and 0.108 e Å−3 respectively (using all data). These maxima are the bonding density residuals (Fig. S1†).
The final model of IAM MoPro46 refinement was used for further multipolar refinement based on Hansen–Coppens (HC) multipolar atom model (MAM) (1978).48 With all positive I(H) data, chemical symmetry constraints were generated and applied to chemically equivalent atoms (see Table S1(b)†). The first scale factor was refined followed by refinement of Pval, κ, Plm, κ′ terms of the HC equation in a stepwise manner together with a scale factor refinement. Subsequently, all the electron density parameters along with position (x, y, z) and thermal parameters (Uij) were refined. All the hydrogen atoms were refined to the dipolar level and their κ and κ′ were restrained to 1.16(0.02), while all non-hydrogen atoms (C, O and N atoms) were refined to the octapolar level. The H atoms were restrained to optimized values from DFT calculations (details are in the subsequent section, Table S1†). Initially, the allowed standard deviation was 0.00001, which was gradually relaxed to 0.001. The chemical and local symmetry constraints were gradually removed for all the heteroatoms. As a result of multipolar refinement, the R (F) factor and wR (F2) were reduced to 0.029 and 0.046,48 respectively, for all 34626 reflections with sinθ/λ less than 1.163 Å−1. The minimum and maximum electron density peaks and r.m.s. values dropped to −0.18, 0.20, and 0.049 e Å−3, respectively. The residual electron density maps are quite featureless after multipolar refinement, as shown in Fig. S1.† A fractal dimension plot comparing the residual densities after multipolar refinements is given in Fig. S2b,† which showed that the results are comparable.
Theoretical calculations.
The periodic density functional theory (DFT) based calculations were carried out in two steps using the CRYSTAL17 (ref. 49) suite of programs. In the first step, the atomic positions of the hydrogen atoms were refined starting with the lattice parameters and atomic coordinates obtained from Mopro IAM refinements converged with the standard neutron distances. The optimization used the B3LYP-D3 (ref. 50 and 51) exchange–correlation function in combination with Grimme's D3 correction for the dispersion interactions and pob-TZVP-rev2 (ref. 52) basis sets for all atoms. During the partial geometry optimization, the coordinates of all non-hydrogenic atoms in the unit cell were fixed and only hydrogen atoms were allowed to relax until convergence. The shrinking factors (IS1, IS2, and IS3) along with the reciprocal lattice vectors were set to 8, corresponding to 260 k points in the irreducible Brillouin zone. The bielectronic Coulomb and ref. 49 exchange series values for the truncation parameter (ITOLi, for i = 1–4) were set to 9 and ITOL5 to 30, while the eigenvalue level shifter was set to 1.0 Hartree and maintained after diagonalization. The percent of Fock/KS matrices mixing was set 20 and the default extra-large integration grid and convergence criteria were adopted during the calculations. The obtained optimized hydrogen distances were used for the further Mopro IAM and multipolar refinements.
In the second step, a single-point periodic DFT calculation was carried out using the final geometry obtained from the multipolar refinement as an input. The calculation used the same level of theory and other parameters adopted for the partial geometry optimization except for the shrinking factors (IS1, IS2, and IS3) along with the reciprocal lattice vectors were increased to 12 which corresponded to 868 k points in the irreducible Brillouin zone. The obtained wavefunction was used to calculate the theoretical structure factors in the experimental sinθ/λ limits. Multipolar refinement of scale factors and electron density parameters was performed using the obtained static structure factors by excluding the refinement of atomic positions and setting the thermal parameters of atoms to zero. The results of the refinement are mentioned as “MMtheo” in all subsequent studies.
The final refinement parameters were used for the integration of electron density to obtain the atomic partial charges and volumes from both experimental and theoretical refinement models using the WinXPRO53 suite. Statistical errors on the electrostatic properties and AIM parameters were calculated according to Fournier et al. (2018).66 This method implemented in Mopro is based on calculations on sample standard deviations of properties using randomly deviated charge density models. Note that our method allows calculating the precision of the derived properties but does not account for systematic errors.
Table 1 gives crystallographic information and compares MoPro IAM, and multipolar refinement based on experimental and theoretical structure factors.
Results and discussion
Powder X-rays diffraction analysis and crystal structure
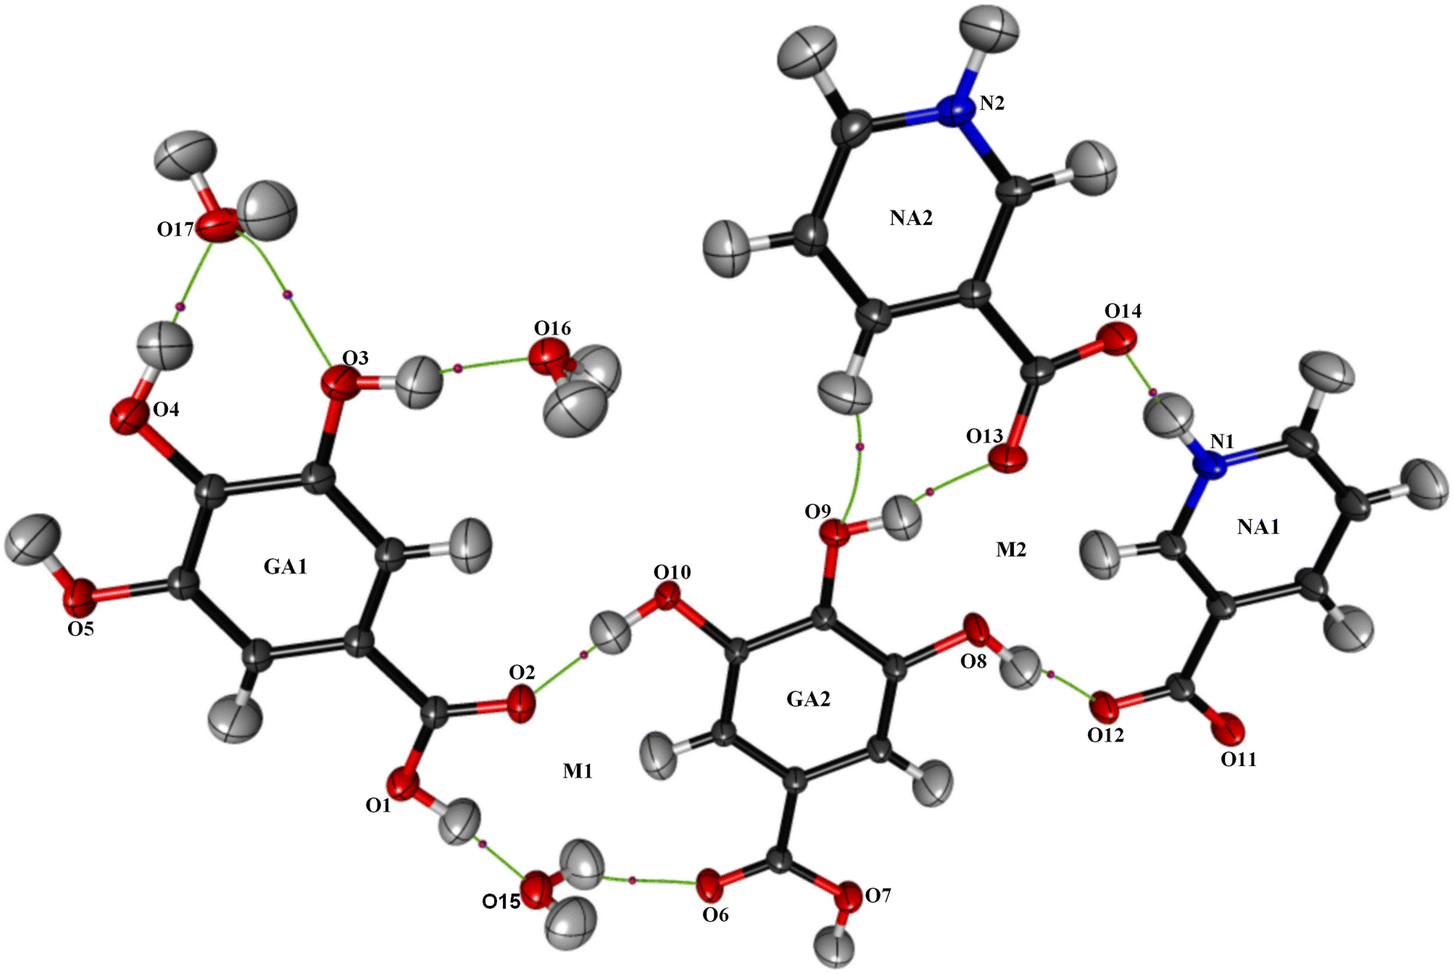
The powder diffraction analysis of the NAGA co-crystal confirms that it is a distinct new phase Fig. S2† CIF # 1S1. The experimental powder pattern of the co-crystal is comparable to the simulated one [Fig. S2(a)†] and thus establishes the phase purity of the NAGA co-crystal. The crystal structure exhibits two GA, two NA, and 1.5 water molecules in the asymmetric unit (Fig. 1). The molecular structure showed ring motif M1 with a graph-set notation R33(15) and ring motif M2 (12) between two NA zwitterions and the GA2 molecule including two strong hydrogen bonds N1+–H⋯O14− and O8–H⋯O12 and a contact O13⋯O8 in the asymmetric unit shown in Fig. 1, while the significant hydrogen bonds in stabilizing co-crystal assembly are given in Table 2.
 |
| | Fig. 1 A thermal displacement ellipsoid plot (50% probability) of the asymmetric unit showing the atom numbering scheme for all non-hydrogen atoms as well as hydrogen bonds within the asymmetric unit. | |
Table 2 Hydrogen-bond geometry (Å, °) for (NAGA)
| D—H⋯A |
D—H |
H⋯A |
D⋯A |
D—H⋯A |
| Symmetry codes: (i) x − 1, y, z − 1; (ii) x − 1, y + 1, z; (iii) x, y − 1, z − 1; (iv) −x, −y + 1, −z + 1; (v) x + 1, y − 1, z; (vi) x + 1, y, z + 1; (vii) –x + 1, −y + 1, −z + 1; (viii) –x + 1, −y + 1, −z + 2; (ix) –x + 2, −y + 1, −z + 2. |
| N1—H14⋯O14 |
1.087(2) |
1.489(3) |
2.58(3) |
175(1) |
| N2—H2⋯O11i |
1.018(1) |
1.634(3) |
2.67(3) |
175(1) |
| O1—H1⋯O15 |
1.025(1) |
1.628(4) |
2.64(3) |
172(1) |
| O10—H10⋯O2 |
0.998(2) |
1.642(3) |
2.63(3) |
171(1) |
| O8—H8⋯O12 |
1.002(2) |
1.651(4) |
2.64(2) |
167(1) |
| O3—H3⋯O16 |
0.996(3) |
1.717(4) |
2.70(3) |
169(1) |
| O4—H4⋯O17 |
0.995(3) |
1.763(3) |
2.75(3) |
170(1) |
| O16—H16B⋯O13vii |
0.995(4) |
1.760(3) |
2.75(3) |
173(1) |
| O7—H7⋯O16vi |
0.997(3) |
1.782(2) |
2.75(3) |
163(1) |
| O9—H9⋯O13 |
0.992(6) |
1.794(3) |
2.73(3) |
157(1) |
| O16—H16A⋯O17iv |
0.995(5) |
1.789(3) |
2.78(3) |
177(1) |
| O15—H15A⋯O11ix |
0.977(5) |
1.822(3) |
2.81(3) |
176(1) |
| O5—H5⋯O11ii |
0.979(5) |
2.171(2) |
2.89(2) |
130(1) |
| C17—H17⋯O4v |
1.079(5) |
2.207(4) |
3.16(3) |
146(1) |
| C18—H18⋯O15iii |
1.08(1) |
2.229(3) |
3.24(3) |
156(1) |
| O15—H15B⋯O10viii |
0.977(4) |
2.388(4) |
3.11(3) |
131(1) |
TGA/DSC analysis and single crystal in situ thermal analysis
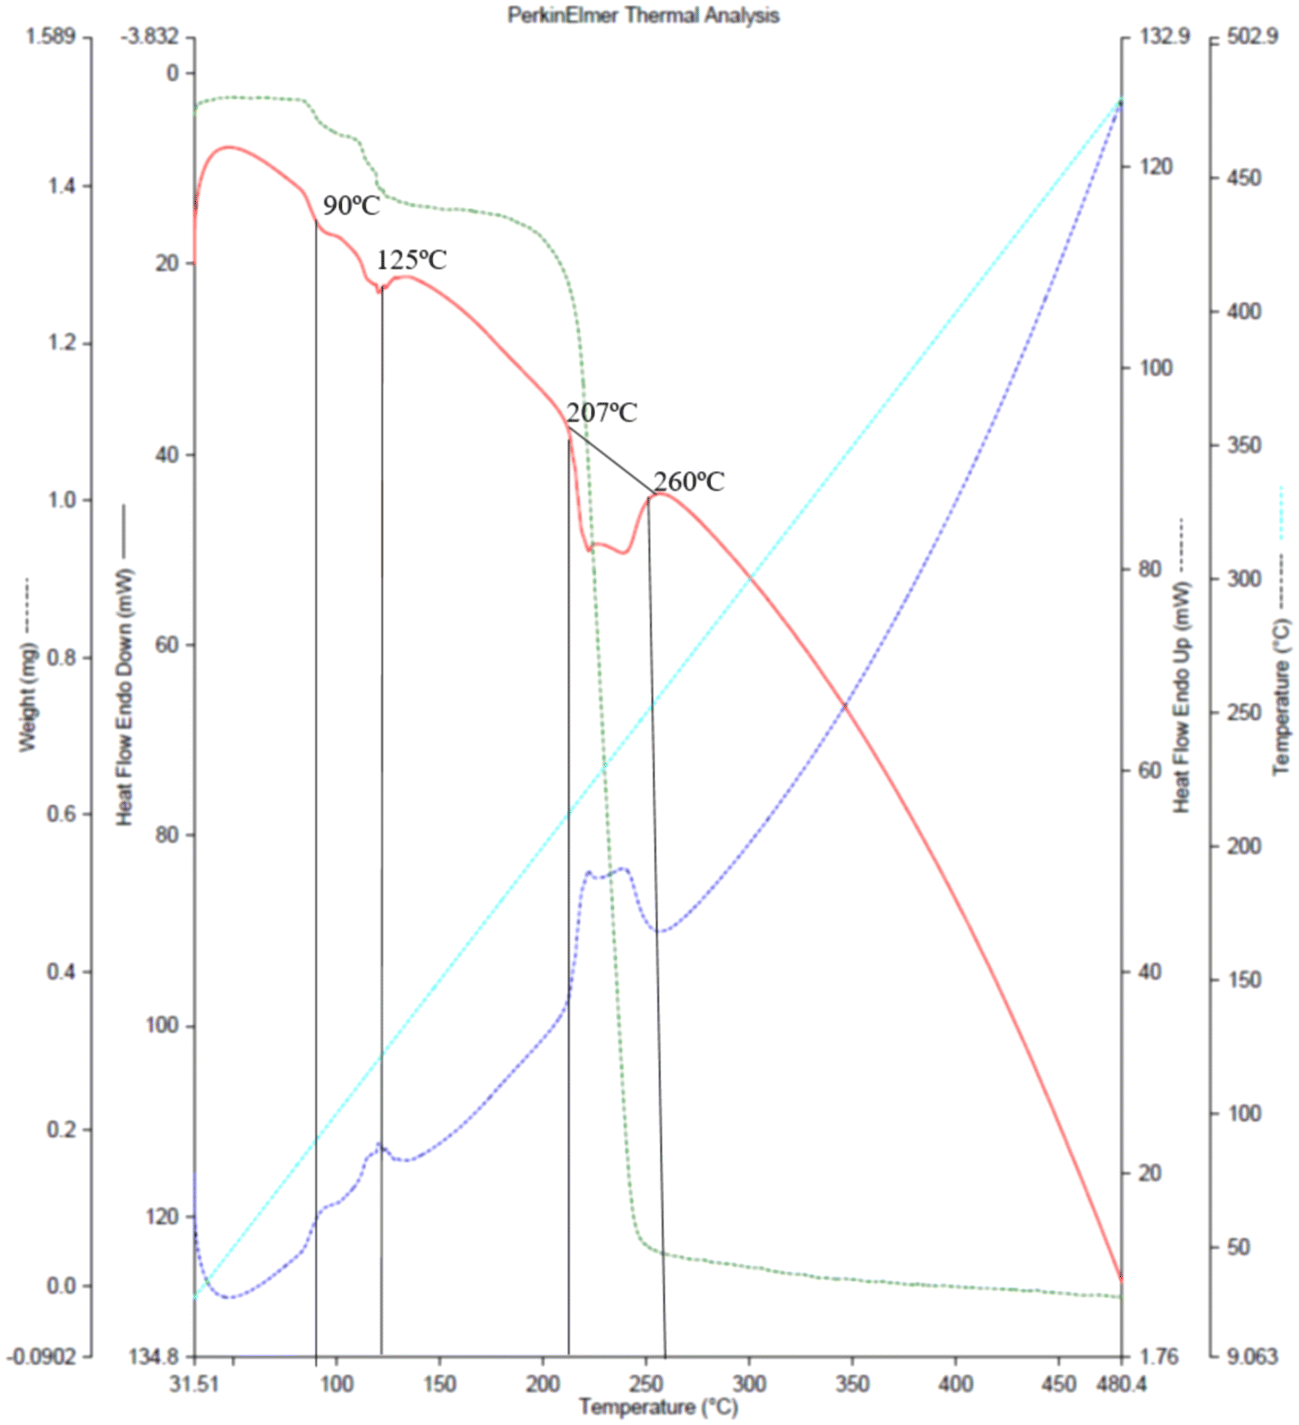
The TGA/DSC plot Fig. 2, (red curve) of the co-crystal shows an endothermic peak nearly at 88–90 °C (361.15–363.15 K) and further at 125 °C (398.15 K). These two peaks show 8% weight loss, indicating the loss of water molecules through evaporation. The melting points of NA and GA monohydrate are 237 °C and 252 °C, respectively, while the NAGA co-crystal starts melting at 88 °C. The co-crystal appears to be completely decomposed between 207–260 °C exhibiting 33% weight loss at 244 °C and 99% at 330 °C. This thermograph indicates that water molecules are necessary for the co-crystal assembly. To understand the role of water molecules in the co-crystal assembly, an in situ variable temperature single crystal X-ray diffraction analysis was performed keeping in view the TGA profile. The unit cell parameters collected at selected temperatures of 310 K, 350 K, 355 K, and 360 K approximately remained the same (CIF # S3, S4, S5, and S6), with the expected linear-volume expansion with rising temperature (Table S2, Fig. S4†). Between 360 K to 361 K, the single crystal pattern transformed into a powder diffraction pattern in agreement with the observed crystal cracking. A phase transformation occurred leading to the formation of an agglomerate of new crystallites. A small single crystal was located in the residual mass of the crystallites (ESI† Fig. S3a and b). Its structure determination at 298 K revealed that it is an anhydrated polymorph of GA (CIF # S7) The conversion of GA monohydrate into GA anhydrate polymorph is evidence that all three water molecules were evaporated. Therefore, heating the co-crystals removed the water molecules and broke the co-crystal assembly, leaving the precursor molecules (GA and NA) in the residue. This experiment showed that GANA co-crystal water molecules are important for the co-crystal formation and stability. Monoclinic forms of GA monohydrate (CIF # S2, P2/n space group) have already been reported34 while the GA anhydrate phase is also known with its structure determined through powder XRD in the triclinic P space group. The unit cell parameters of the hydrated and anhydrated polymorphs of GA molecules are consistent with the previously reported, however, the anhyrated structure from the current study can be regarded as superior to the previous one in terms of having refined parameters of anisotropic thermal motion. Thermal analysis and in situ X-ray diffraction studies show the vital role of water molecules in the co-crystal assembly. In order to quantify the intermolecular interactions, Hirshfeld surface analysis of the asymmetric unit was performed, the details of this analysis are given in the ESI.† From this analysis, O⋯H/H⋯O contacts account for 38.0% of interactions and are the most abundant interactions. This analysis also gives a clue to the significant role of water molecules in co-crystal assembly and stability.
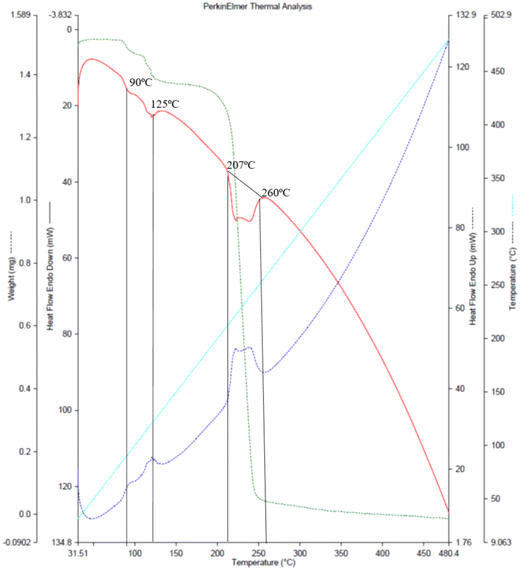 |
| | Fig. 2 Thermogravimetric (red) and DSC (purple) curves of GANA co-crystal. | |
Electrostatic potential and complementarity
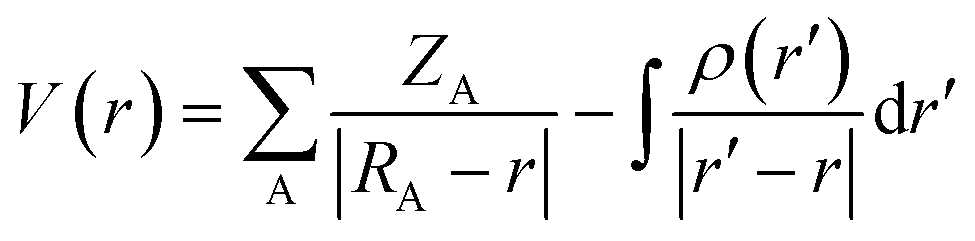
The electrostatic potential is one of the most important properties for describing interactions in the solid state. It exhibits the electrophilic (positive potential) and nucleophilic (negative potential) regions of a molecule and is a good indicator of chemical reactivity.54,55 The electrostatic potential is calculated directly from the multipolar electron density| |  | (1) |
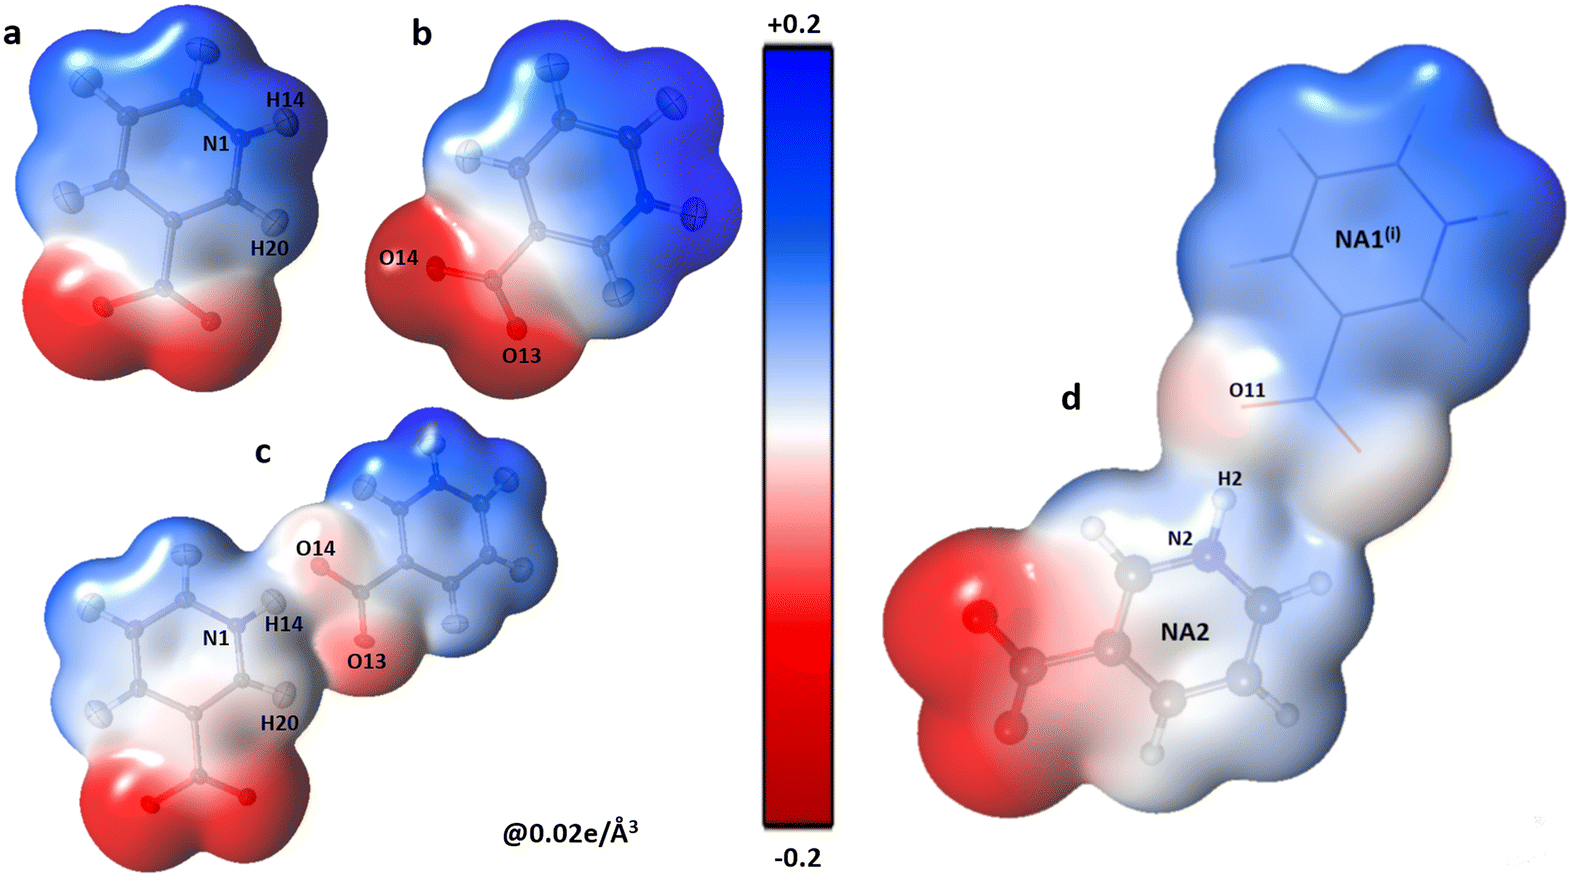
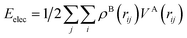
ZA is the charge of nucleus A situated at a distance RA and ρr′ is the total electron density.56 The electrostatic potential of all the molecules present in the asymmetric unit of the co-crystal was calculated using the Su and Coppens' method (1992).56Fig. 3 shows the electrophilic and nucleophilic regions of NA dimers and their complementarity with each other.
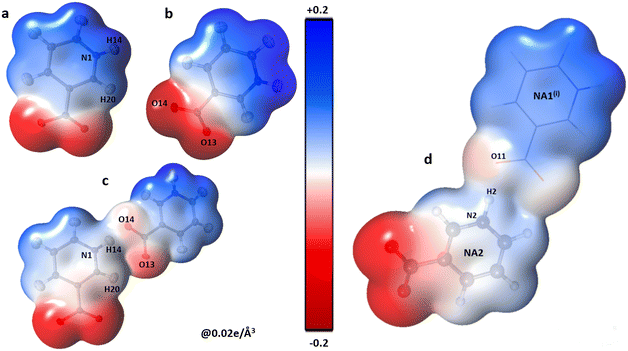 |
| | Fig. 3 Three-dimensional electron density of NA1 (a), NA2 (b), the co-crystal NA1–NA2 dimer (c) and NA2⋯NA1i (d); generated at an isosurface value of 0.02 e Å−3 coloured according to the electrostatic potential showing the electrostatic complementarity between the fragments. The symmetry codes are the same as mentioned in Table 2. | |
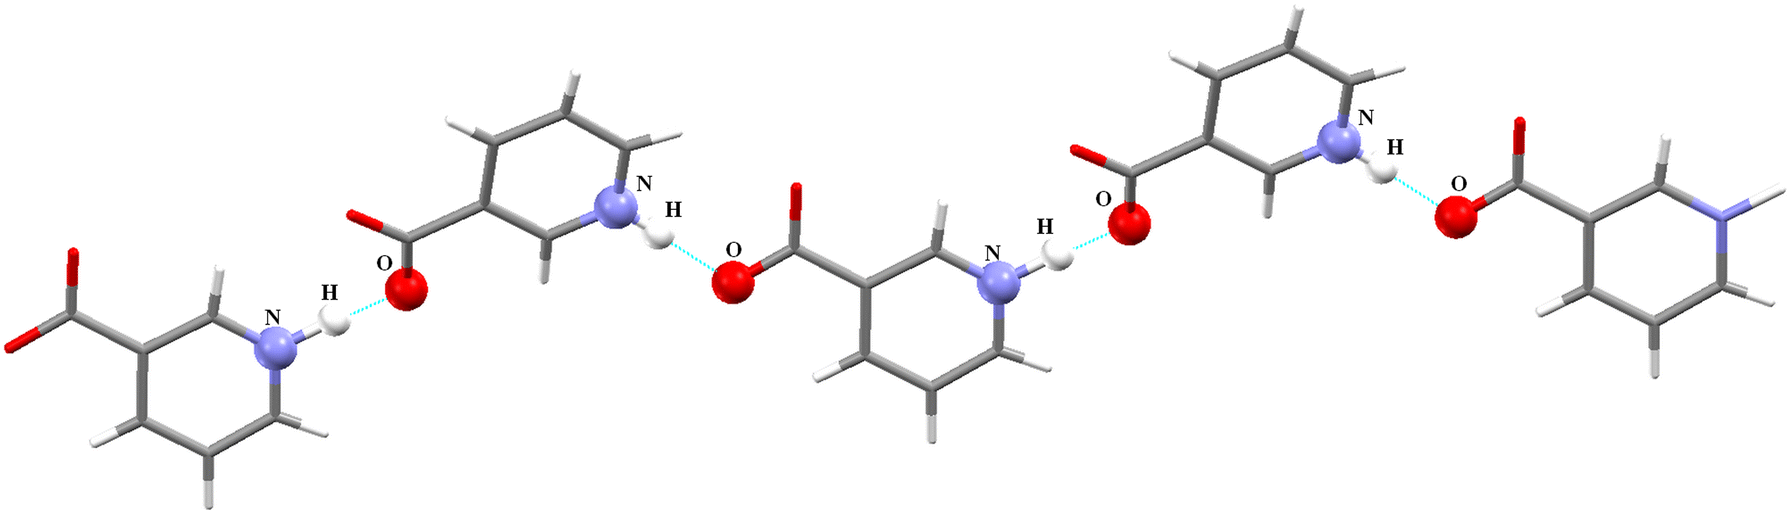
The polar character of both NA moieties is readily noticed and demonstrates a strong electropositive surface on one side and an electron-rich surface on the other side. A strong charge overlap is evident, which indicates charge transfer between the moieties. These complementary sites explain the formation of a polymeric zigzag chain of the NA sub-lattice in the co-crystal (Fig. 4).
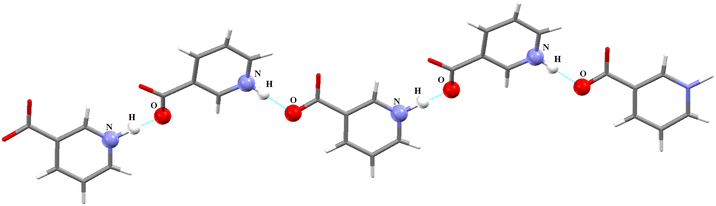 |
| | Fig. 4 Zigzag arrangement of the polymeric chain of zwitterionic nicotinic acid co-crystal, other molecules are eliminated for the sake of clarity. | |
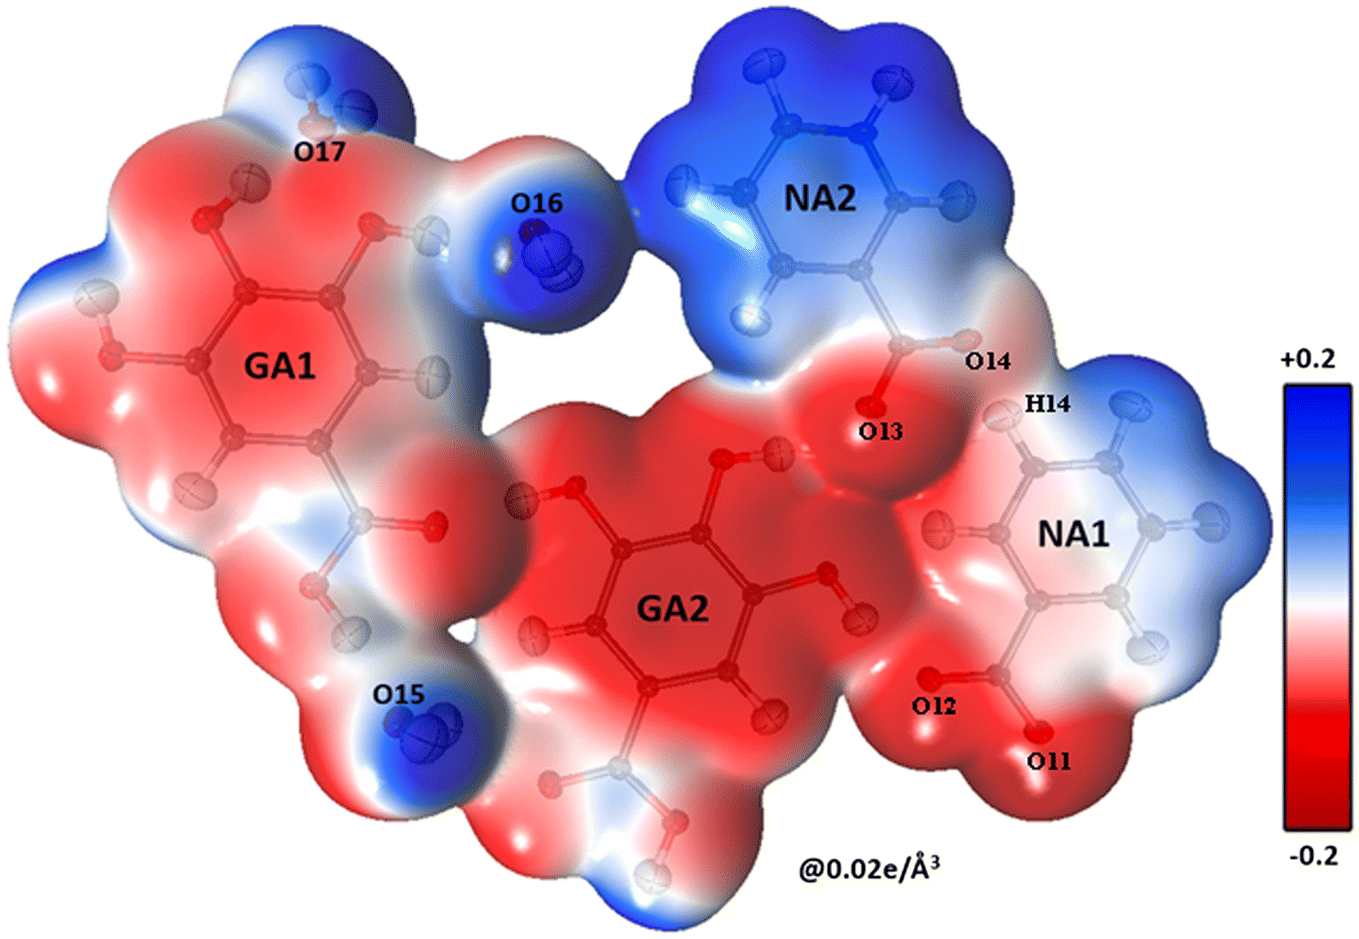
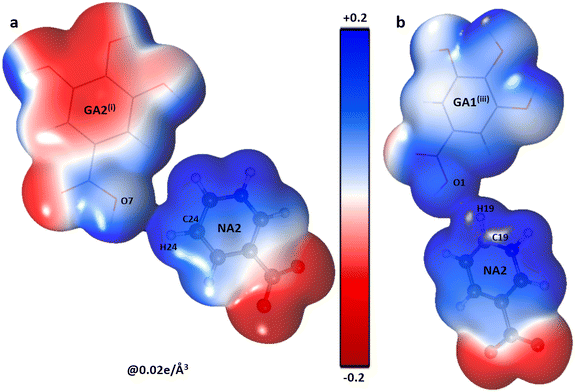
The shifting of the charges from NA1 and NA2 molecules toward the GA2 molecule results in a large negative charge accumulation as shown by the negative electrostatic potential on the GA2 molecule (represented by a dark red shade) (Fig. 5). The GA1 moiety also showed an overall electronegative surface. The highly polar surface of water molecules can be easily noticed and unambiguously cements the GA fragments with each other and with the NA substructure. The large negative charge on O14 makes oxygen a suitable hydrogen bond acceptor, while the electron-withdrawing effect of the N1 atom of the NA1 molecule makes H14 an electrophilic region, these two complementary sites facing each other result in a strong classical hydrogen bond O14⋯H14—N1between the two NA molecules.
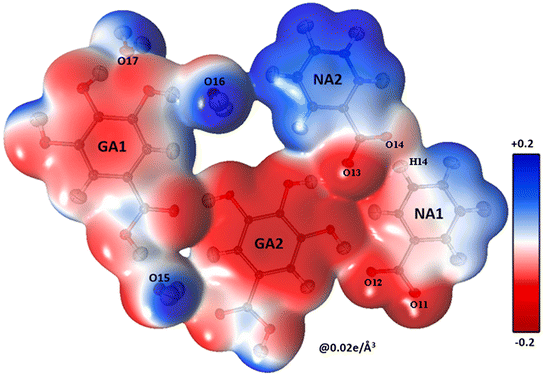 |
| | Fig. 5 A three-dimensional electron density surface of the whole asymmetric unit colored according to the electrostatic potential calculated from the experimental electron density, contour level 0.02 e Å−3. | |
The oxygen atoms of the water molecules O15, O16, and O17 surrounding the GA1 molecule show negative potential, and their respective complementary sites H1, H3, and H4 of the GA1 molecule with blue shade results in strong classical hydrogen bonds (Fig. 6) (as explained in the topology table and description). This complementarity of NA and GA molecules in co-crystal formation and stability is further supported by calculating the atomic charges and volumes in the given section.
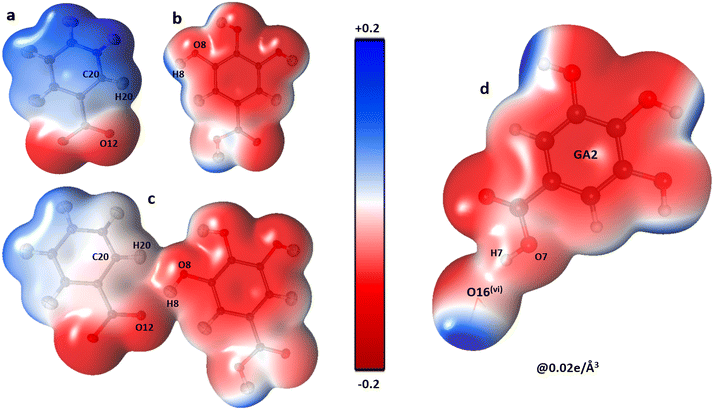 |
| | Fig. 6 The three-dimensional electron density of NA1 (a), GA2 (b), the co-crystal NA1–GA2 dimer (c) and GA2⋯O16watervi (d); symmetry code the same as mentioned in Table 2, generated at isosurface value of 0.02 e Å−3 coloured according to electrostatic potential using experimental data. | |
Atomic charges and volumes
The complementarity of molecules is also explained by calculating the total Bader charge of each molecule based on the experimental data using Moproviewer.57 The total charge (error estimate ±0.10 e)66 of NA1 is 0.17 e and NA2 is 0.03 e clearly supporting the ESP figure of blue-shaded NA molecules. While the total charge of the GA2 molecule is −0.20 e, as depicted in ESP. The total charges show the transfer of charges from NA molecules to GA2 molecules. The GA1 molecule is almost neutral with a total charge of 0.07 e, surrounded by three water molecules whose total net charge is −0.07 e.
Electrostatic interaction energies
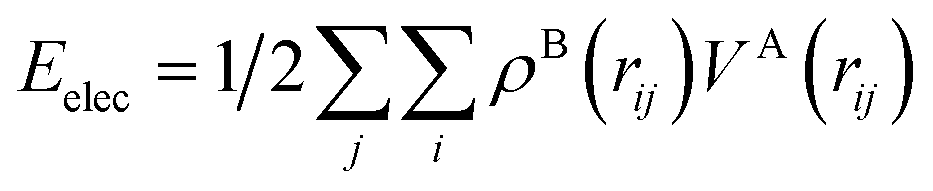
To quantify these interactions, electrostatic interaction energies between molecular dimers were calculated by Buckingham summation58 providing important insight into the initiation of the co-crystallization and subsequent packing stability of the co-crystal assembly. The literature contains several examples where the electrostatic interaction energy has been used to understand binding and host–guest interactions not only in molecular crystals but also between protein–ligand complexes59–65 or zeolites. Therefore, we have calculated the strongest NA—NA, NA—GA, and GA—GA electrostatic interaction energies using the following equation (with Moproviewer) to understand how the cocrystallization onsets and why the co-crystal remains stable (Table 4). We recall that the electrostatic energy is calculated according to| |  | (2) |
where VA(r) is the electrostatic potential generated by molecule A, which influences molecule B, and ρB(r) is the charge density of molecule B and vice versa.
(2) can also be calculated using numerical integration
| |  | (3) |
VA was calculated from the multipolar density using a Moproviewer.
Table 4 lists the electrostatic interaction energies for various molecular dimers, the analysis of which provides valuable insight into the growth mechanism and stability of the NAGA co-crystal. The electrostatic energies between the NA GA and H
2O entities are given in
Table 3.
Table 3 Dimeric electrostatic interaction energies between the asymmetric unit and the neighboring molecules, with symmetric codes as mentioned in Table 1. The contribution interactions between the dimers have been mentioned. The statistical errors in the experimental electrostatic interaction energies are estimated using the method of Fournier et al.66
|
|
Interactions |
Interacting molecules |
Electrostatic energy value |
| NA2 |
O13⋯H9—O9 |
NA2–GA2 |
−56(3) kJ mol−1 |
| C23—H23⋯O9 |
| O9—H9⋯O13 |
| O14⋯H14—N1 |
NA2–NA1 |
−221(5) kJ mol−1 |
| C20—H20⋯O13 |
| O13⋯H14—N1 |
| N2—H2⋯O11i |
NA2–NA1i |
−159(1) kJ mol−1 |
| C25—H25⋯O12i |
| C24—H24⋯O7i |
NA2–GA2i |
20(2) kJ mol−1 |
| C26—H26⋯O5iii |
NA2–GA1iii |
−2(1) kJ mol−1 |
| O16⋯H24—C24 |
NA2–O16water |
−15(2) kJ mol−1 |
| NA1 |
O12⋯H8—O8 |
NA1–GA2 |
−88(4) kJ mol−1 |
| C20—H20⋯O8 |
| C19—H19⋯O1iii |
NA1–GA1iii |
11(4) kJ mol−1 |
| C18—H18⋯O15iii |
NA1–O15wateriii |
−41(5) kJ mol−1 |
| C17—H17⋯O4v |
NA1–GA1v |
−29(3) kJ mol−1 |
| O11⋯H5—O5v |
| N2—H2⋯O11i |
NA1–NA2i |
−159(5) kJ mol−1 |
| GA2 |
O6⋯H15B—O15 |
GA2–O15water |
−33(3) kJ mol−1 |
| C14—H14A⋯O15 |
| O10—H10⋯O2 |
GA2–GA1 |
−59(3) kJ mol−1 |
| O7—H7⋯O16vi |
GA2–O16watervi |
−64(3) kJ mol−1 |
| O7⋯H24—C24i |
GA2–NA2i |
20(4) kJ mol−1 |
| H10A⋯H25i |
| O6—H17B⋯O17i |
GA2–O17wateri |
−33(3) kJ mol−1 |
| O10⋯H17B—O17iv |
GA2–O17wateriv |
−49(4) kJ mol−1 |
| GA1 |
O1—H1⋯O15 |
GA1–O15water |
−77(4) kJ mol−1 |
| H1⋯H15A |
| H1⋯H15B |
| O3—H3⋯O16 |
GA1–O16water |
−68(4) kJ mol−1 |
| H3⋯H16A |
| H3⋯H16B |
| O4—H4⋯O17 |
GA1–O17water |
−57(3) kJ mol−1 |
| H4⋯H17A |
| H4⋯H17B |
| C26—H26⋯O5iii |
GA1–NA2iii |
−2(1) kJ mol−1 |
| O5—H5⋯O11ii |
GA1–NA1ii |
−28(3) kJ mol−1 |
| O4⋯H17—C17ii |
NA–NA dimer.
NA zwitterions are dimerized (Fig. 3) through the N–H⋯O interaction, and their electrostatic interaction energy is very large −221(5) kJ mol−1. This is the strongest interaction in this co-crystal. This energy value is significantly greater than −180 kJ mol−1 found in NAPY.26 This large value of electrostatic energy proves the greater stability of this interaction and the onset of nucleation via the NA⋯NA backbone during the co-crystal formation. The second maximum energy also corresponds to the NA zwitterions, NA2–NA1(i) (Fig. 3) with a value of −159.1585 kJ mol−1. These two energy values clearly demonstrate that the polymeric NA chain in Fig. 4 is highly stable, forming a sub-lattice in this co-crystal.
NA–GA dimer.
The 3D electron density distribution of NA1–GA2 colored according to the experimentally calculated electrostatic potential is given in Fig. 6, confirming their electrostatic complementarity. The electrostatic energy of the NA1–GA2 dimer in the asymmetric unit is −88(4) kJ mol−1, which is slightly greater than that of the NA–PY dimer in the NAPY co-crystal (−78 kJ mol−1 (ref. 26)). The topological parameters also confirmed the strength of this interaction, the O8–H8⋯O12 interaction between NA1–GA2 with elevated electron density values ρcp ≈ 0.252(2)/0.269 e Å−3 (Table 4). The fragments of the dimer are interconnected via the O12–H8⋯O8 interaction with charge accumulation at the O12 pocket and depletion at H8, and then the GA2 fragment interacts with O16 water via the O7—H7⋯O16vi interaction according to the electrostatic potential.
Table 4 Topological properties of (3, −1) CPs on the intermolecular interactions: distances (Å), electron density (e Å−3), Laplacian (e Å−5), Hessian eigenvalues (e Å−5), Gcp = bond kinetic energy, Vcp = bond potential energy (Hartree per Å3). The upper line in each pair gives the experimental values and the lower one the theoretical values; the statistical errors are estimated based on ref. 66
|
|
Interactions |
Interacting species |
d
12
|
d
1cp
|
d
2cp
|
ρ(rb) |
∇2ρ(cp) |
G
cp
|
V
cp
|
| Symmetry codes: (i) x − 1, y, z − 1; (ii) x − 1, y + 1, z; (iii) x, y − 1, z − 1; (iv) −x, −y + 1, −z + 1; (v) x + 1, y − 1, z; (vi) x + 1, y, z + 1; (vii) –x + 1, −y + 1, −z + 1; (viii) –x + 1, −y + 1, −z + 2; (ix) –x + 2, −y + 1, −z + 2; (x) x, y + 1, z + 1. |
| 1 |
O14⋯H14—N1 |
NA2⋯NA1 |
1.489(1) |
1.033(2) |
0.456(2) |
0.545(4) |
5.234(2) |
0.533 |
−0.702 |
| 1.489 |
1.010 |
0.479 |
0.472 |
6.040 |
0.513 |
−0.601 |
| 2 |
N2—H2⋯O11i |
NA2⋯NA1 |
1.634(1) |
0.539(1) |
1.095(2) |
0.366(2) |
4.452(1) |
0.358 |
−0.405 |
| 1.634 |
0.556 |
1.079 |
0.319 |
5.127 |
0.358 |
−0.337 |
| 3 |
O15⋯H1—O1 |
O15water⋯GA1 |
1.628(1) |
1.122(2) |
0.507(2) |
0.282(2) |
5.505(1) |
0.351 |
−0.317 |
| 1.628 |
1.098 |
0.531 |
0.293 |
5.127 |
0.337 |
−0.324 |
| 4 |
O12⋯H8—O8 |
NA1⋯GA2 |
1.652(1) |
1.140(1) |
0.528(2) |
0.252(1) |
5.105(2) |
0.317 |
−0.277 |
| 1.652 |
1.107 |
0.549 |
0.269 |
4.703 |
0.310 |
−0.290 |
| 5 |
O2⋯H10—O10 |
GA1⋯GA2 |
1.642(1) |
1.122(2) |
0.524(1) |
0.230(2) |
5.466(1) |
0.324 |
−0.263 |
| 1.642 |
1.102 |
0.542 |
0.257 |
4.900 |
0.310 |
−0.277 |
| 6 |
O16⋯H3—O3 |
O16water⋯GA1 |
1.718(1) |
1.180(1) |
0.546(2) |
0.214(1) |
4.646(1) |
0.277 |
−0.229 |
| 1.718 |
1.134 |
0.585 |
0.252 |
4.116 |
0.270 |
−0.250 |
| 7 |
O7—H7⋯O16vi |
GA2⋯O16water |
1.782(1) |
0.586(2) |
1.205(1) |
0.195(2) |
3.805(2) |
0.229 |
−0.189 |
| 1.782 |
0.623 |
1.163 |
0.215 |
3.541 |
0.223 |
−0.202 |
| 8 |
O4—H4⋯O17 |
GA1⋯O17water |
1.763(1) |
0.569(1) |
1.203(2) |
0.180(2) |
4.179(1) |
0.236 |
−0.189 |
| 1.763 |
0.595 |
1.170 |
0.199 |
3.775 |
0.229 |
−0.196 |
| 9 |
O16—H16A⋯O17iv |
O16water⋯O17water |
1.790(1) |
0.575(2) |
1.215(1) |
0.177(2) |
3.996(1) |
0.229 |
−0.182 |
| 1.790 |
0.618 |
1.172 |
0.205 |
3.566 |
0.223 |
−0.189 |
| 10 |
O16—H16B⋯O13vii |
O16water⋯NA2 |
1.760(1) |
0.580(1) |
1.184(1) |
0.175(3) |
4.053(2) |
0.229 |
−0.182 |
| 1.760 |
0.603 |
1.159 |
0.205 |
3.680 |
0.229 |
−0.196 |
| 11 |
O13⋯H9—O9 |
NA2⋯GA2 |
1.794(1) |
1.204(2) |
0.620(2) |
0.174(2) |
3.409(1) |
0.202 |
−0.169 |
| 1.794 |
1.170 |
0.634 |
0.195 |
3.296 |
0.202 |
−0.175 |
| 12 |
O15—H15A⋯O11ix |
O15water⋯NA1 |
1.822(1) |
0.600(1) |
1.225(1) |
0.153(1) |
3.531(2) |
0.196 |
−0.155 |
| 1.822 |
0.630 |
1.193 |
0.175 |
3.260 |
0.196 |
−0.162 |
| 13 |
O17—H17A⋯O10 |
O17water⋯GA2 |
1.925(1) |
0.702(1) |
1.252(1) |
0.144(1) |
2.564(1) |
0.148 |
−0.121 |
| 1.925 |
0.719 |
1.220 |
0.160 |
2.532 |
0.148 |
−0.128 |
| 14 |
O3⋯O17 |
GA1⋯O17water |
2.741(1) |
1.348(1) |
1.423(2) |
0.097(1) |
1.569(1) |
0.089 |
−0.067 |
| 2.741 |
1.329 |
1.441 |
0.096 |
1.540 |
0.088 |
−0.067 |
| 15 |
O6⋯H15B—O15 |
GA2⋯O15water |
2.143(2) |
1.351(1) |
0.829(2) |
0.094(3) |
1.551(2) |
0.088 |
−0.067 |
| 2.143 |
1.307 |
0.856 |
0.102 |
1.588 |
0.088 |
−0.067 |
| 16 |
O8⋯H20—C20 |
GA2⋯NA1 |
2.145(1) |
1.335(1) |
0.845(1) |
0.091(1) |
1.661(1) |
0.094 |
−0.067 |
| 2.145 |
1.315 |
0.852 |
0.108 |
1.682 |
0.094 |
−0.074 |
| 17 |
O5—H5⋯O11ii |
GA1⋯NA1 |
2.171(1) |
0.865(1) |
1.334(1) |
0.084(2) |
1.505(2) |
0.081 |
−0.061 |
| 2.171 |
0.881 |
1.311 |
0.098 |
1.489 |
0.081 |
−0.067 |
| 18 |
C17—H17⋯O4v |
NA1⋯GA1 |
2.207(1) |
0.877(1) |
1.343(1) |
0.084(1) |
1.499(1) |
0.081 |
−0.054 |
| 2.207 |
0.898 |
1.318 |
0.094 |
1.530 |
0.081 |
−0.061 |
| 19 |
O17—H17B⋯O6i |
O17water⋯GA2 |
2.053(1) |
0.757(1) |
1.323(1) |
0.084(2) |
1.769(1) |
0.094 |
−0.061 |
| 2.053 |
0.774 |
1.289 |
0.105 |
1.768 |
0.101 |
−0.074 |
| 20 |
C18—H18⋯O15iii |
NA1⋯O15water |
2.229(1) |
0.842(1) |
1.396(1) |
0.082(2) |
1.459(1) |
0.074 |
−0.054 |
| 2.229 |
0.892 |
1.343 |
0.088 |
1.442 |
0.074 |
−0.054 |
| 21 |
C25—H25⋯O12i |
NA2⋯NA1 |
2.449(1) |
1.001(1) |
1.478(1) |
0.066(2) |
0.984(2) |
0.054 |
−0.034 |
| 2.449 |
1.053 |
1.411 |
0.064 |
0.966 |
0.054 |
−0.034 |
| 22 |
O15—H15B⋯O10 |
O15water⋯GA2 |
2.389(1) |
0.987(1) |
1.452(2) |
0.059(2) |
0.935(1) |
0.047 |
−0.034 |
| 2.389 |
0.993 |
1.418 |
0.065 |
0.981 |
0.047 |
−0.034 |
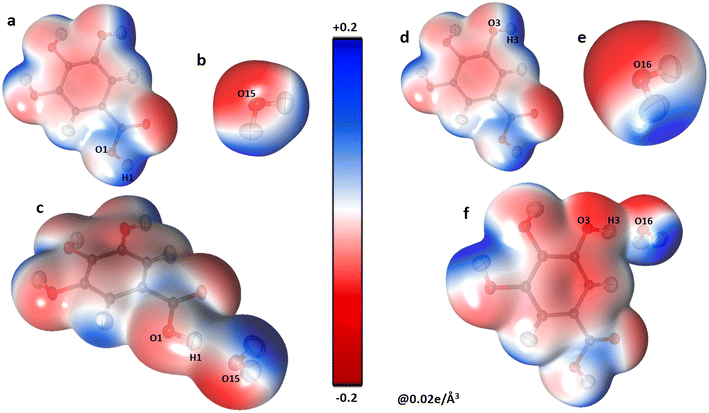
GA–water interactions.
The presence of a large negative potential on oxygen atoms of water molecules (O15, O16, and O17) provides interaction sites for the gallic acid molecules (Fig. 7). GA molecules form numerous O–H⋯O-type hydrogen bonds with water molecules. Though, both GA1 and GA2 forms dimers with three water molecules, it is, however, observed that the dimer energies between GA1 and water molecules are higher (between −81 to −54 kJ mol−1) than those between GA2 and water molecules which range between −64 to −33 kJ mol−1. It, therefore, hints at a superior role played by GA1 than GA2 in the co-crystal assembly. Further, these high electrostatic dimerization energies between GA and water molecules verify the significance and strength of water molecules in the co-crystal assembly.
 |
| | Fig. 7 The three-dimensional electron density of GA1 (a), O15water molecule (b), the co-crystal GA1–O15water dimer (c), GA1 (d), O16water (e) and GA1–O16water interaction (f), generated at isosurface value of 0.02 e Å−3 coloured according to the electrostatic potential using experimental data. | |
This is confirmed by topological details (Table 4). The electron density values at critical points range from 0.28 to 0.18 e Å−3 for O–H⋯O interactions involving O15 to O17 atoms (Table 4) of intermolecular interactions that water molecules are involved in prominent interactions.
Repulsive interactions.
Along with the attraction between complementary sites, two heterodimers NA2–GA2(i)via C24—H24⋯O7i interaction [symmetry code (i) x − 1, y, z − 1] and NA1–GA1(ii)via C19—H19⋯O1iii interaction [symmetry code (iii) x, y − 1, z − 1] have positive electrostatic energy values 20(2) kJ mol−1 and 11(4) kJ mol−1 respectively. These small positive values indicate some repulsive nature of interactions, which also becomes evident from the 3D electrostatic potential map (Fig. 8) where the positive blue shaded regions face each other in the molecular dimer. These positive interactions are a result of the strong negative NA–NA and NA–GA interactions.
 |
| | Fig. 8 The 3D electron density surface (contour = 0.02 e Å−3) coloured according to the electrostatic potential for molecular dimers. (a) NA2⋯GA2i (b) NA2⋯GA1iii using experimental data. | |
Topological analysis of covalent interactions
The topological analysis of the electron density of the NAGA co-crystal was performed using VMoPro57 to ascertain the strength and hierarchy of intermolecular interactions. The topological parameters of the covalent bonds are reported in Table S3.† The positive Laplacian value ∇2ρcp > 0, for all the interactions, confirmed their closed shell nature.67,68
Topological analysis of non-covalent intermolecular interactions
The availability of high-resolution data enables to perform the multipolar refinement, which is very helpful in calculating local properties such as intermolecular topological properties at the critical point,69 and non-local ones such as electrostatic potential generated by NA or GA, electric field, electrostatic energy between interacting molecules or ions. These complementary calculations are helpful in creating a hierarchy of intermolecular interactions and proposing a mechanism of co-crystals growth.26 Whereas the electrostatic analysis provides insight into the interacting moieties, a topological analysis of electron density using Bader's quantum theory of atoms in molecule (QTAIM) (ref. 69) is needed to quantify the interactions. The topological parameters of significant intermolecular interactions in the NAGA co-crystal from experimental and DFT multipolar models are listed in Table 4, while all other intermolecular interactions involved in the co-crystal assembly are given in Table S4.† The NAGA co-crystal assembly is rich in strong classical hydrogen bonds, which lend it robustness. A molecular cluster showing strong intermolecular interactions is shown in Fig. 9.
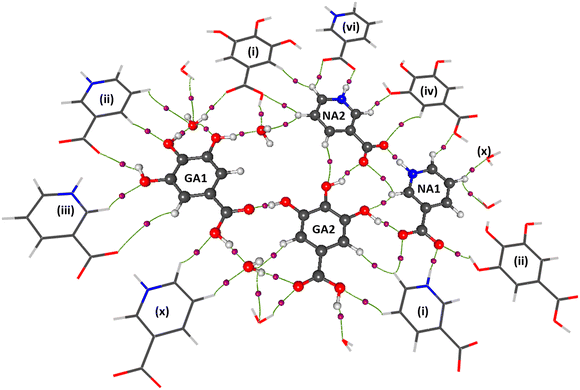 |
| | Fig. 9 A view of major interactions of GANA co-crystal with its symmetric mate; symmetric codes are the same as described in Table 2; symmetry codes: (i) x − 1, y, z − 1; (ii) x − 1, y + 1, z; (iii) x, y − 1, z − 1; (iv) −x, −y + 1, −z + 1; (vi) x + 1, y, z + 1; (x) x, y + 1, z + 1. | |
N–H⋯O interactions
In terms of QTAIM analysis, the strongest intermolecular interactions in the NAGA co-crystal are between the NA⋯NA zwitterions as expected from the electrostatic potential and electrostatic dimer energies. The charge-assisted N+–H⋯O− interactions are the most significant ones involved in the formation of a dimer. These two interactions, O14⋯H14—N1 [1.489(1) Å] and N2–H2⋯O11i [1.634(1) Å]; symmetry code [(i) x − 1, y, z − 1], respectively, connecting the NA zwitterions in a polymeric chain, as shown in Fig. 4, are the strongest in terms of electron density ρcp(r) at their respective critical points 0.545(2)/0.479 e Å−3 and 0.366(2)/0.319 e Å−3 (exp/theo), respectively. A similar pattern is present in the NAPY co-crystal.26 In the current study, one of the two interactions (O14⋯H14—N1) is significantly stronger than that reported previously in the NAPY co-crystal. It possesses a higher electron density at the critical points (0.545(2) vs. 0.436 e Å−3). Similarly, the values of the local energy densities are also remarkably higher with the kinetic energy density Gcp, being 208.850(2) kJ mol−1 (0.533 Hartree per Å3) versus 89.770(2) kJ mol−1 (0.231 Hartree per Å3) and the potential energy density Vcp, being −275.140(3) kJ mol−1 (−0.702 Hartree per Å3) versus −162.53 kJ mol−1(0.419 Hartree per Å3). A higher electron density at the critical points and shorter bond distances indicate a strong covalent character of these interactions.71 These charge-assisted O⋯H—N hydrogen bonds have significantly larger electron density at their critical points with values ranging from 0.047 to 0.146 e Å−3 as compared to those found in O⋯H—N hydrogen bonds in neutral molecules65,74,75 Similarly, the values of the electrostatic interaction energies of these O⋯H—N interactions are also higher compared to neutral molecules reported in the literature.65,70,71,74 Moreover, the electron density and derived parameters of the above-mentioned interactions satisfy the criteria of ∇2ρcp > 0, 1 < V/G < 2, and total energy less than zero, where V and G represent the potential energy and kinetic energy of the non-bonded interactions. Thus, this criterion confirms the ionic-covalent character of these interactions.
O–H⋯O interactions
Following the N–H⋯O interactions, the O–H⋯O interactions are next in the hierarchy in terms of topological parameters (Table 4). These interactions are abundant and exist between GA–GA, NA–GA, GA–water molecules, and NA–water molecules. The GA1 molecule is connected with the O15 water molecule via O15⋯H1—O1 with higher electron density (ρcp ≈ 0.282(2)/0.293 e Å−3). While O16–water molecule links GA1 and GA2 molecules through O3–H3⋯O16 and O7–H7⋯O16vi [(vi) x + 1, y, z + 1] interactions, respectively. Furthermore, GA1–GA2 molecules interact via O10–H10⋯O2 interactions (ρcp ≈ 0.230(2)/0.257 e Å−3). This GA2 molecule is connected to an O17–water molecule via O4–H4⋯O17 interaction. The higher electron density values at critical points of water connected O–H⋯O interactions exhibit the significance of these interactions in the stability of NAGA co-crystal. The O16–water molecule is poly-furcated, connected with NA2 moiety of adjacent layer and O17–water molecule with almost equally strong hydrogen bonds O16–H16B⋯O13vii (ρcp ≈ 0.175(3)/0.205 e Å−3) and O16–H16A⋯O17iv (ρcp ≈ 0.177(2)/0.205 e Å−3) [(iv) −x, −y + 1, −z + 1; (vii) −x + 1, −y + 1, −z + 1]. The electron density of O–H⋯O interactions in GANA co-crystal is comparable to the electron density of such interactions present in the literature,72e.g., in quercetin73 are approximately 0.228 (5) e Å−3. Although both the GA moieties form extensive O–H⋯O type hydrogen bonding with the water molecules, GA1 apparently forms stronger electrostatic interactions with water molecules than GA2 in terms of electrostatic interaction energies (Table 3) and topological parameters (Table 4).
Weak hydrogen bonds
In addition to these strong interactions, more than a dozen C–H⋯O weak interactions are involved in maintaining the assembly of the NAGA co-crystal, among all such interactions C20–H20⋯O8, connecting NA1 and GA2 moieties are the strongest interaction with electron density 0.09/0.10 e Å−3, greater than electron density of some O–H⋯O interactions. The electron density of the weak interactions C–H⋯O in the GANA co-crystal is comparable with that of all other C–H⋯O interactions reported in the literature in terms of electron density and electrostatic energies.71,72
Molecular recognition
In conclusion, in the light of the above electrostatic and topological analyses, which remarkably agree together, all interactions can be ranked as NA⋯NA > NA⋯GA ≈ water⋯GA > GA⋯GA. It, therefore, infers that the co-crystallization starts with the formation of NA⋯NA sub-structure, which is subsequently connected with GA and water molecules. The water molecules primarily connect the GA molecules with each other. They further bridge the NA–NA sub-structure with hydrated GA assembly, however, the dimer energies between NA and water molecules are very small and they interact with NA via only a weak C–H⋯O interaction. It is due to this reason that upon heating, the co-crystal assembly is modified as the water evaporates. The assembly is principally built on O–H⋯O-type hydrogen bonds between the NA–NA polymeric chain and the hydrated assembly of gallic acids. An analysis of the GA moieties after heating upto 362 K shows that the O–H⋯O synthon is conserved.
Conclusion
The co-crystal between nicotinic acid and gallic acid was systematically analyzed using TGA/DSC analysis, variable temperature diffraction analysis, and X-ray charge density analysis using high-resolution single crystal diffraction data collected at 100 K. The thermo-gravimetric analysis indicated that the co-crystal remained thermally robust until the water molecules stayed intact. Following the TGA profile, an in situ variable temperature single crystal analysis was conducted, which proved that the co-crystal assembly remained intact until dehydration occurred, thus confirming that the water molecules are indispensable for the NAGA co-crystal assembly. A careful analysis of the post-melting residual mass revealed the presence of pure nicotinic acid (NA) and a polymorph of gallic acid (GA). To gain further insight into the self-assembly and growth of the co-crystal, an experimental charge density analysis of the NAGA co-crystal was performed using a carefully grown highly diffracting crystal. The experimental results had an excellent agreement with the theoretical findings from a refined model using theoretical structure factors using density functional theory. The molecular electrostatic potential and total charge analysis of the fragments depict a strong electrostatic complementarity and significant charge transfer between the fragments. Results from the calculation of the electrostatic interaction energies revealed that the co-crystal grows via the formation of an NA–NA backbone onto which hydrated GA molecules are connected. This is consistent with our recently reported findings (Iqbal et al., 2021 (ref. 26)) from a co-crystal between nicotinic acid and pyrogallol (NAPY) in which a similar nicotinic acid backbone structure was observed. Furthermore, the topological analysis of interactions provided an in-depth quantitative analysis of the strength of the intermolecular interactions, which enabled a hierarchy of the interactions. These consistent results support the conclusion that any co-crystal design involving nicotinic acid proceeds with the formation of the NA⋯NA sub-structure, which provides the backbone for the co-crystal assembly. This study highlights the significance of combining thermal analysis, variable temperature diffraction analysis and charge density analysis in crystal engineering. The electrostatic and topological analysis using charge density data from a carefully grown highly diffracting crystal provides a significant value addition to the study of a crystal-engineering project.
Conflicts of interest
There are no conflicts to declare.
Acknowledgements
The authors gratefully acknowledge the Materials Chemistry Laboratory, Institute of Chemistry, The Islamia University of Bahawalpur, Pakistan for the provision of research facilities. The Laboratory was established with a funding from the Higher Education Commission (HEC) of Pakistan. The authors feel very thankful to Prof. Benoit Guillot and Dr. Christian Jelsch from CRM2, Universite de Lorraine, Nancy, France for their assistance regarding Mopro.
References
- C. B. Aakeröy and K. R. Seddon, Chem. Soc. Rev., 1993, 22, 397–407 RSC.
- G. R. Desiraju, Angew. Chem., Int. Ed. Engl., 1995, 34, 2311–2327 CrossRef CAS.
- M. J. Zaworotko, Cryst. Growth Des., 2007, 7, 4–9 CrossRef CAS.
- C. B. Aakeröy, S. Forbes and J. Desper, J. Am. Chem. Soc., 2009, 131, 17048–17049 CrossRef PubMed.
- N. J. Babu and A. Nangia, Cryst. Growth Des., 2011, 11, 2662–2679 CrossRef CAS.
- Ö. Almarsson and M. J. Zaworotko, Chem. Commun., 2004, 1889–1896 RSC.
- D. D. Bavishi and C. H. Borkhataria, Prog. Cryst. Growth Charact. Mater., 2016, 62, 1–8 CrossRef CAS.
- M. L. Cheney, N. Shan, E. R. Healey, M. Hanna, L. Wojtas, M. J. Zaworotko, V. Sava, S. Song and J. R. Sanchez-Ramos, Cryst. Growth Des., 2010, 10, 394–405 CrossRef CAS.
- D. J. Good and N. Rodriguez-Hornedo, Cryst. Growth Des., 2009, 9, 2252–2264 CrossRef CAS.
- D. P. McNamara, S. L. Childs, J. Giordano, A. Iarriccio, J. Cassidy, M. S. Shet, R. Mannion, E. O'Donnell and A. Park, Pharm. Res., 2006, 23, 1888–1897 CrossRef CAS.
- A. J. Smith, P. Kavuru, L. Wojtas, M. J. Zaworotko and R. D. Shytle, Mol. Pharmaceutics, 2011, 8, 1867–1876 CrossRef CAS PubMed.
- M. Karimi-Jafari, L. Padrela, G. M. Walker and D. M. Croker, Cryst. Growth Des., 2018, 18, 6370–6387 CrossRef CAS.
- N. Shan and M. J. Zaworotko, Drug Discovery Today, 2008, 13, 440–446 CrossRef CAS PubMed.
- M. C. Etter, Acc. Chem. Res., 1990, 23, 120–126 CrossRef CAS.
- E. Bodor and S. Offermanns, Br. J. Pharmacol., 2008, 153, S68–S75 CrossRef CAS.
- L. Carlson, J. Intern. Med., 2005, 258, 94–114 CrossRef CAS.
- J. Hegyi, R. A. Schwartz and V. Hegyi, Int. J. Dermatol., 2004, 43, 1–5 CrossRef.
- Z. Benyo, A. Gille, C. L. Bennett, B. E. Clausen and S. Offermanns, Mol. Pharmacol., 2006, 70, 1844–1849 CrossRef CAS.
- S. R. Jebas and T. Balasubramanian, Acta Crystallogr., Sect. E: Struct. Rep. Online, 2006, 62, o5621–o5622 CrossRef CAS.
- P. Kavuru, D. Aboarayes, K. K. Arora, H. D. Clarke, A. Kennedy, L. Marshall, T. T. Ong, J. Perman, T. Pujari and Ł. Wojtas, Cryst. Growth Des., 2010, 10, 3568–3584 CrossRef CAS.
- S. J. Ford, G. J. McIntyre, M. R. Johnson and I. R. Evans, CrystEngComm, 2013, 15, 7576–7582 RSC.
- M. M. Latha, L. M. Novena, S. Athimoolam and B. Sridhar, J. Mol. Struct., 2020, 1205, 127578 CrossRef CAS.
- B. Bankiewicz and S. Wojtulewski, Cryst. Growth Des., 2019, 19, 6860–6872 CrossRef CAS.
- T. Ghosh, T. Juturu, S. N. Nagar and S. Kamath, Proceedings, 2020, 62(1), 12 Search PubMed.
- E. A. J. Y. Prabha, S. S. Kumar, S. Athimoolam and B. Sridhar, J. Mol. Struct., 2017, 1129, 113–120 CrossRef CAS.
- A. Iqbal, A. Mehmood, S. Noureen, C. Lecomte and M. Ahmed, Acta Crystallogr., Sect. B: Struct. Sci., Cryst. Eng. Mater., 2021, 77, 1035–1047 CrossRef CAS.
- Y.-Y. Ow and I. Stupans, Curr. Drug Metab., 2003, 4, 241–248 CrossRef CAS.
- C. B. Aakery and D. J. Salmon, CrystEngComm, 2005, 7, 439–448 RSC.
- C. A. Gomes, T. Girão da Cruz, J. L. Andrade, N. Milhazes, F. Borges and M. P. M. Marques, J. Med. Chem., 2003, 46, 5395–5401 CrossRef CAS PubMed.
- D.-O. Kim, K. W. Lee, H. J. Lee and C. Y. Lee, J. Agric. Food Chem., 2002, 50, 3713–3717 CrossRef CAS.
- S. Verma, A. Singh and A. Mishra, Environ. Toxicol. Pharmacol., 2013, 35, 473–485 CrossRef CAS.
- I. Sarcevica, L. Orola, M. V. Veidis, A. Podjava and S. Belyakov, Cryst. Growth Des., 2013, 13, 1082–1090 CrossRef CAS.
- H. D. Clarke, K. K. Arora, Ł. Wojtas and M. J. Zaworotko, Cryst. Growth Des., 2011, 11, 964–966 CrossRef CAS.
- N. Okabe, H. Kyoyama and M. Suzuki, Acta Crystallogr., Sect. E: Struct. Rep. Online, 2001, 57, o764–o766 CrossRef CAS.
- A. Krawczuk and P. Macchi, Chem. Cent. J., 2014, 8, 1–15 CrossRef.
- V. R. Hathwar, R. Pal and T. Guru Row, Cryst. Growth Des., 2010, 10, 3306–3310 CrossRef CAS.
- M. Gryl, S. Cenedese and K. Stadnicka, J. Phys. Chem. C, 2015, 119, 590–598 CrossRef CAS.
- J. J. Du, L. Váradi, P. A. Williams, P. W. Groundwater, J. Overgaard, J. A. Platts and D. E. Hibbs, RSC Adv., 2016, 6, 81578–81590 RSC.
- J. J. Du, S. A. Stanton, S. Fakih, B. A. Hawkins, P. A. Williams, P. W. Groundwater, J. Overgaard, J. A. Platts and D. E. Hibbs, Cryst. Growth Des., 2021, 21(8), 4259–4275 CrossRef CAS.
- B. A. Nicolaï, B. Fournier, S. Dahaoui, J.-M. Gillet and N.-E. Ghermani, Cryst. Growth Des., 2018, 19, 1308–1321 CrossRef.
- A. Bilal, A. Mehmood, S. Noureen, C. Lecomte and M. Ahmed, CrystEngComm, 2022, 24, 7758–7770 RSC.
- D. E. Braun, R. M. Bhardwaj, A. J. Florence, D. A. Tocher and S. L. Price, Cryst. Growth Des., 2013, 13, 19–23 CrossRef CAS PubMed.
-
APEX3, SAINT and SADABS, Bruker AXS Inc., Madison, Wisconsin, USA, 2016 Search PubMed.
- L. Krause, R. Herbst-Irmer, G. M. Sheldrick and D. Stalke, J. Appl. Crystallogr., 2015, 48, 3–10 CrossRef CAS.
- O. V. Dolomanov, L. J. Bourhis, R. J. Gildea, J. A. Howard and H. Puschmann, J. Appl. Crystallogr., 2009, 42, 339–341 CrossRef CAS.
- C. Jelsch, B. Guillot, A. Lagoutte and C. Lecomte, J. Appl. Crystallogr., 2005, 38, 38–54 CrossRef.
- A. Ø. Madsen, J. Appl. Crystallogr., 2006, 39, 757–758 CrossRef CAS.
- N. K. Hansen and P. Coppens, Acta Crystallogr., Sect. A: Cryst. Phys., Diffr., Theor. Gen. Crystallogr., 1978, 34, 909–921 CrossRef.
- R. Dovesi, A. Erba, R. Orlando, C. M. Zicovich-Wilson, B. Civalleri, L. Maschio, M. Rérat, S. Casassa, J. Baima and S. Salustro, Wiley Interdiscip. Rev.: Comput. Mol. Sci., 2018, 8, e1360 Search PubMed.
- A. Becke, J. Chem. Phys., 1993, 98, 5648–5652 CrossRef CAS.
- C. Lee, W. Yang and R. G. Parr, Phys. Rev. B, 1988, 37, 785 CrossRef CAS.
- D. Vilela Oliveira, J. Laun, M. F. Peintinger and T. Bredow, J. Comput. Chem., 2019, 40, 2364–2376 CrossRef CAS.
- A. I. Stash and V. G. Tsirelson, J. Appl. Crystallogr., 2014, 47, 2086–2089 CrossRef CAS.
- N. Ghermani, C. Lecomte and Y. Dusausoy, Phys. Rev. B, 1996, 53, 5231 CrossRef CAS.
- X. Shi, N. El Hassan, A. Ikni, W. Li, N. Guiblin, A. S. De-Biré and N. Ghermani, CrystEngComm, 2016, 18, 3289–3299 RSC.
- Z. Su and P. Coppens, Acta Crystallogr., Sect. A: Found. Crystallogr., 1992, 48, 188–197 CrossRef.
- B. Guillot, Acta Crystallogr., Sect. A: Found. Crystallogr., 2012, 68, 204 Search PubMed.
- A. Buckingham, Adv. Chem. Phys., 1967, 12, 107–142 CAS.
- S. Swaminathan, B. Craven, M. Spackman and R. Stewart, Acta Crystallogr., Sect. B: Struct. Sci., 1984, 40, 398–404 CrossRef.
- M. Spackman, H. Weber and B. M. Craven, J. Am. Chem. Soc., 1988, 110, 775–782 CrossRef CAS.
- N. Bouhmaida, N.-E. Ghermani, C. Lecomte and A. Thalal, Acta Crystallogr., Sect. A: Found. Crystallogr., 1997, 53, 556–563 CrossRef.
- N. Muzet, B. Guillot, C. Jelsch, E. Howard and C. Lecomte, Proc. Natl. Acad. Sci. U. S. A., 2003, 100, 8742–8747 CrossRef CAS.
- A. Volkov and P. Coppens, J. Comput. Chem., 2004, 25, 921–934 CrossRef CAS.
- R. Soave, M. Barzaghi and R. Destro, Chem. – Eur. J., 2007, 13, 6942–6956 CrossRef CAS PubMed.
- B. Fournier, E.-E. Bendeif, B. Guillot, A. Podjarny, C. Lecomte and C. Jelsch, J. Am. Chem. Soc., 2009, 131, 10929–10941 CrossRef CAS PubMed.
- B. Fournier, B. Guillot, C. Lecomte, E. C. Escudero-Adán and C. Jelsch, Acta Crystallogr., Sect. A: Found. Adv., 2018, 74, 170–183 CrossRef CAS.
- C. Gatti, Z. Kristallogr. – Cryst. Mater., 2005, 220, 399–457 CrossRef CAS.
-
S. J. Grabowski, Hydrogen bonding: new insights, Springer, 2006 Search PubMed.
-
R. Bader, Atoms in Molecules: A Quantum Theory, Oxford University Press, 1990 Search PubMed.
- S. J. Grabowski, W. A. Sokalski, E. Dyguda and J. Leszczyński, J. Phys. Chem. B, 2006, 110, 6444–6446 CrossRef CAS.
- A. J. Mora, L. M. Belandria, G. E. Delgado, L. E. Seijas, A. Lunar and R. Almeida, Acta Crystallogr., Sect. B: Struct. Sci., Cryst. Eng. Mater., 2017, 73, 968–980 CrossRef CAS PubMed.
- R. Pal, C. Jelsch, K. Momma and S. Grabowsky, Acta Crystallogr., Sect. B: Struct. Sci., Cryst. Eng. Mater., 2022, 78, 231–246 CrossRef CAS.
- S. Domagała, P. Munshi, M. Ahmed, B. Guillot and C. Jelsch, Acta Crystallogr., Sect. B: Struct. Sci., 2011, 67, 63–78 CrossRef.
- M. Schmidtmann, L. J. Farrugia, D. S. Middlemiss, M. J. Gutmann, G. J. McIntyre and C. C. Wilson, J. Phys. Chem. A, 2009, 113, 13985–13997 CrossRef CAS PubMed.
- G. Rajalakshmi, V. R. Hathwar and P. Kumaradhas, Acta Crystallogr., Sect. B: Struct. Sci., Cryst. Eng. Mater., 2013, 70, 568–579 CrossRef PubMed.
Footnote |
| † Electronic supplementary information (ESI) available. CCDC 2169422–2169427 and 2169471–2169473. For ESI and crystallographic data in CIF or other electronic format see DOI: https://doi/org/10.1039/d2ce01149b |
|
| This journal is © The Royal Society of Chemistry 2023 |
Click here to see how this site uses Cookies. View our privacy policy here. 
 b,
Sajida
Noureen
*a,
Claude
Lecomte
cd and
Maqsood
Ahmed
b,
Sajida
Noureen
*a,
Claude
Lecomte
cd and
Maqsood
Ahmed