
 Open Access Article
 This Open Access Article is licensed under a Creative Commons Attribution-Non Commercial 3.0 Unported Licence
Near zero-strain silicon oxycarbide interphases for stable Li-ion batteries†
Su Jeong
Yeom‡
a,
Tae-Ung
Wi‡
ab,
Soon-Jae
Jung‡
a,
Myeong Seon
Kim
a,
Sang-Chae
Jeon
c and
Hyun-Wook
Lee
 *a
*a
aSchool of Energy and Chemical Engineering, Ulsan National Institute of Science and Technology (UNIST), Ulsan 44919, Republic of Korea. E-mail: hyunwooklee@unist.ac.kr
bDepartment of Chemical and Biomolecular Engineering, Rice University, Houston, Texas 77005, USA
cSchool of Materials Science and Engineering, Changwon National University, Gyeongsangnam-do 51140, Republic of Korea
First published on 19th September 2023
Abstract
We investigate silicon oxycarbide nanotubes that incorporate Si, SiC, and silicon oxycarbide phases, which exhibit near zero-strain volume expansion, leading to reduced electrolyte decomposition. The composite effectively accommodates the formation of c-Li15Si4, as validated by in situ TEM analyses and electrochemical tests, thereby proposing a promising solution for Li-ion battery anodes.
As demand for various electronic devices, including electric vehicles, rises, high-energy-density battery systems have become increasingly necessary.1,2 Silicon (Si)-based anodes are studied as potential replacements for commercialized graphite anodes due to their high specific capacity. However, the practical application of these materials is often hindered by severe capacity fading, caused by significant volumetric changes and the formation of undesirable solid electrolyte interphase (SEI) layers during battery cycling.3,4 Recently, complex structuring methods incorporating carbon components – which can enhance electrical conductivity and mitigate the volumetric changes of Si anodes – have emerged as one of the preferred options for the commercialization of Si/C anodes.5–8
The formation of Si carbide (SiC) is known to occur as a side reaction during the synthesis of Si/C-based anodes. Given that SiC is a prominent electrical insulator, its formation would result in high ohmic resistance of the anodes. Also, SiC is considered inactive when reacting with Li ions, thereby impeding the diffusion of Li ions into the Si phase. Because of this electrochemically inactive characteristic of SiC, studies have explored post-treatment methods for SiC removal and SiC-free synthesis methods to reduce SiC formation during Si/C synthesis.9,10 However, recent studies have indicated that a SiC layer can alleviate side reactions between the pristine Si surface and Li2SiF6 generated when using LiPF6 salt.11,12 With this perspective of SiC serving as a protective layer, research into active materials through the electrochemical reaction of SiC, such as intercalation or conversion reactions, has been proposed.13,14
In this study, we have delved into the emergence of SiC and Si oxycarbide (SiOC) phases when halloysite-derived silicon oxide (SiO2) nanotubes engage in high-temperature reactions with a carbon source such as acetylene gas. We have not only scrutinized different electrochemical behaviours when reacting with Li ions under different synthesis conditions but also put forward a novel characterization of the role of the SiC/SiOC matrix as a protective interphase on Si nanotubes (SiNTs). Our work further uncovers the electrochemical and mechanical contribution of this protective interphase within the complex structure, with a focus on how such a structure can significantly enhance the stability of Si anode materials.
In our previous study,15 we produced carbon-coated SiNTs using halloysites as raw materials (Fig. S1, ESI†). The final carbon-coating process for the external carbon layers could form two reaction pathways with residual SiO2 on SiNTs: (1) SiO2(s) + C(s) → SiO(s) + CO(g) and (2) SiO(s) + 2C(s) → SiC(s) + CO(g). In this work, we used these reactions of SiO2 and carbon at the two different temperatures of 880 °C and 1000 °C to investigate variations in phase transformation environments. After the different CVD reactions, magnesiothermic reduction is able to occur in both the bulk SiO2 phase and the interface between the SiO2/C regions, resulting in the creation of crystalline Si, SiC, amorphous SiOC, and SiO2 phases (Fig. 1).16 All residual SiO2 was completely removed in the final nanotube product using an HF solution. Nanotubes synthesized at 880 °C were labelled as SiOC-L and those treated at 1000 °C as SiOC-H, denoting their respective reaction temperatures. The final structural morphology of the synthesized SiOC-nanotubes presents bundled nanotubular shapes with bundles of interconnected nanoparticles (Fig. 2a and Fig. S2, ESI†). We found that the SiOC-coated Si nanotubes (SiNT@SiOC) maintained the same nanotubular morphology as pure SiNTs. However, clear crystalline SiC nanograins were observed in SiNT@SiOC as well as in pure SiOC nanotubes (Fig. 2a and Fig. S3, ESI†). It is obvious that crystalline Si and SiC were formed in the SiNT@SiOC, confirmed by the crystalline lattice spacings, 0.31 nm of Si (111), 0.25 nm of SiC (111) and 0.15 nm of SiC (022) planes, which were assigned from the FFT images (Fig. 2b). This area in the FFT is attributed to the presence of the SiOC phase and it is presented as an amorphous matrix, which contains both two crystalline Si and SiC grains. Fig. S4 (ESI†) shows a high-magnification transmission electron microscopy (TEM) image of SiNT@SiOC from surface to bulk by representing crystalline species embedded in an amorphous matrix. Areal distribution mapping analysis was conducted to precisely identify the distribution of crystalline Si and SiC grains within the amorphous SiOC matrix structure. Each corresponding phase is illustrated in Fig. 2c as yellow and green, representing Si and SiC, respectively, embedded within the dashed lines of the amorphous SiOC matrix. Thus, the SiNT@SiOC structure is defined by the presence of crystalline Si and Si grains, sized between 4–5 nm, uniformly embedded in the amorphous SiOC and carbon matrix, especially near the surface of the nanotubes.17 Additionally, TEM-energy dispersive spectroscopy (EDS) mapping results in Fig. S5 (ESI†) reveal the elemental distribution of Si, oxygen, and carbon in a single SiNT@SiOC. EDS mapping results further attest that the nanotube core is Si rich, and the SiOC phase gradually increases from the bulk to the surface. Therefore, the overall structure of the SiNT@SiOC is characterized as a crystalline Si core encased by an amorphous SiOC matrix, containing a homogeneous distribution of nano-sized crystalline Si and SiC grains (Fig. S6, ESI†).
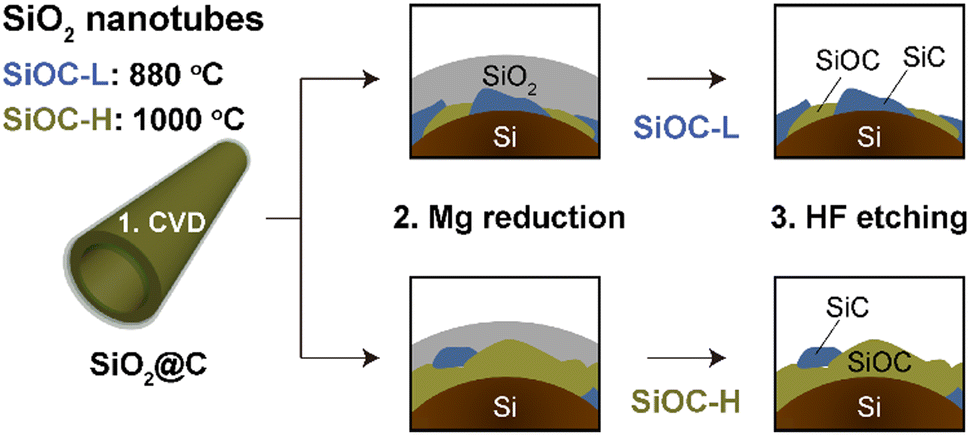 | ||
| Fig. 1 The synthesis method for halloysite-derived silicon nanotubes (SiNTs). Schematic of the synthesis process for SiOC-L and SiOC-H from carbon-coated silicon oxide nanotubes (SiO2@C). | ||
 | ||
| Fig. 2 (a)–(c) TEM images of SiNT@SiOC: (a) a single nanotube, (b) lattice fringe images and their fast Fourier transform (FFT) patterns of SiNT@SiOC, and (c) areal distribution mapping results highlighting yellow for crystalline Si and green for SiC embedded in the amorphous SiOC phase, marked by a dashed white line. (d)–(f) XPS spectra of SiOC-L and SiOC-H: (d) Si 2p, (e) C 1s, and (f) O 1s. | ||
The structural evolution of SiC was also confirmed by the X-ray diffraction (XRD) patterns (Fig. S7, ESI†). The atomic ratio for each SiNT@SiOC was defined through X-ray photoelectron spectroscopy (XPS; Fig. 2d–f), with the detailed ratio available in Table S1 (ESI†). The SiNTs exhibit only Si and O composition, while SiOC-L reveals a carbon-rich phase with 24% of C content. In contrast, SiOC-H shows an oxygen-rich composition with 40% oxygen in its composite mixture. The difference in phase transformation between the carbon-rich and oxygen-rich SiOC matrix is attributed to the different reaction temperatures since the redistribution of Si–O and Si–C bonds easily occurs at temperatures above 1000 °C.15 During the synthesis, SiC initially forms at the interface between SiO2 and the deposited carbon sources. For the SiOC-H synthesis at 1000 °C, a redistribution process between residual Si–O bonds and the newly generated Si–C bonds favours the formation of the SiOC phase.18 The removal of residual SiO2 after the Mg reduction ensures the formation of the SiOC phase in both cases, resulting in a chemically inactive SiOC matrix in the final product. Fig. S7 (ESI†) shows the crystalline structure of pristine SiNTs and both SiNT@SiOC, revealing the formation of a crystalline SiC peak. The peak at 28.4° observed in the three samples coincides with Si (111). The crystalline peak at 25.92° in the SiNT@SiOC is assigned to SiC (111) formed on the nanotube surface. The presence of distinct crystalline peaks in SiOC-L, which are assigned to the crystalline lattice of Mg2SiO4 (101), (031), (131), and (222), is due to the difference in the synthesis method of SiNT@SiOC. Lower temperatures may leave large amounts of SiO2 during the synthesis process. The amount of SiC and SiOC formation on the SiO2 surface differs according to the carbon coating temperature. At higher temperatures, most SiO2 transforms to the SiOC phase due to the bond redistribution. In the contrary for the SiOC-L, SiO2 does not fully participate at lower reaction temperatures, leaving most SiO2 phases intact. The XPS spectra of Si 2p, C 1s, and O 1s also describe the bonding state of the SiNT@SiOC in Fig. 2d–f. While both SiNT@SiOC show Si–Si (99.2 eV), Si–C (100.3 eV) and SiO3C (102.8 eV) in their Si 2p XPS spectra, SiOC-H exhibits a Si–O peak at 103.5 eV, which reflects that the presence of the SiOC matrix does not from SiO2. Similarly, there is a difference in the C 1s spectrum peak with respect to the oxygen-containing bond. Unlike the commonly observed C–Si bond (282 eV), SiOC-H forms an oxygen-rich phase, demonstrating a high intensity of C–O (286.2 eV) and O–C![[double bond, length as m-dash]](https://www.rsc.org/images/entities/char_e001.gif) O (288.6 eV) bonds. Correspondingly, the O 1s spectra of SiOC-H slightly broaden with the existence of OC (531.5 eV) and Si–OH (534.1 eV), while SiOC-L does not contain an oxygen-rich environment.
O (288.6 eV) bonds. Correspondingly, the O 1s spectra of SiOC-H slightly broaden with the existence of OC (531.5 eV) and Si–OH (534.1 eV), while SiOC-L does not contain an oxygen-rich environment.
Given the different compositions of SiC and SiOC in each SiOC-nanotube, we conduct an in situ TEM observation of their respective electrochemical reactions. Fig. S8 (also Movie S1, ESI†) provides snapshot images of pure SiC before and after lithiation, contingent on the lithiation behaviour. As shown in Fig. S8a–c (ESI†), the lithiation behaviour of pure SiC indicates no structural changes during Li charging. We employ an FFT image to examine the crystal structure change before and after lithiation, allowing us to understand the nanoscale view of pure SiC changes. Pure SiC presents a SiC (111) crystalline lattice of 0.25 nm, observed both before and after lithiation in Fig. S8d and e (ESI†). This phenomenon suggests that pure SiC remains an electrochemically inactive material. Fig. 3 (also Movie S2, ESI†) illustrates the lithiation behaviour in an environment with a SiOC-rich phase. SiOC-H includes a structure of pure SiC and Si, embedded in a SiOC matrix and appearing as nanosized crystalline grains. When the same bias for lithiation is applied, pure SiC exhibits electrochemically inactive lithiation behaviour, while SiOC-H exhibits an internal change in the bulk phase. As lithiation progresses in pristine SiOC-H, we notice simultaneous partial lithiation of SiC and alloying of internal crystalline Si, leading to the formation of crystalline dots. A detailed charging behaviour shown in the FFT image in Fig. 3e reveals the disappearance of the fringes of crystalline Si and SiC (111) in the fully charged state. The lattice of the newly formed 2–3 nm size dots is assigned to c-Li15Si4via the FFT image. The disappearance of SiC (111) suggests that SiC has reacted by forming another phase without any crystalline lattice structure. We conclude that crystalline SiC partially reacts with the Si phase, and the remaining carbon would integrate into the SiOC matrix as an amorphous phase. In addition, the partial lithiation reaction of SiC preferentially occurs through the SiC (111) plane, having a relatively wide lattice distance (0.25 nm), while the SiC (200) plane remained with its narrow d-spacing (0.15 nm), implying its minimal contribution to the partial intercalation or alloying reactions of Li ions.
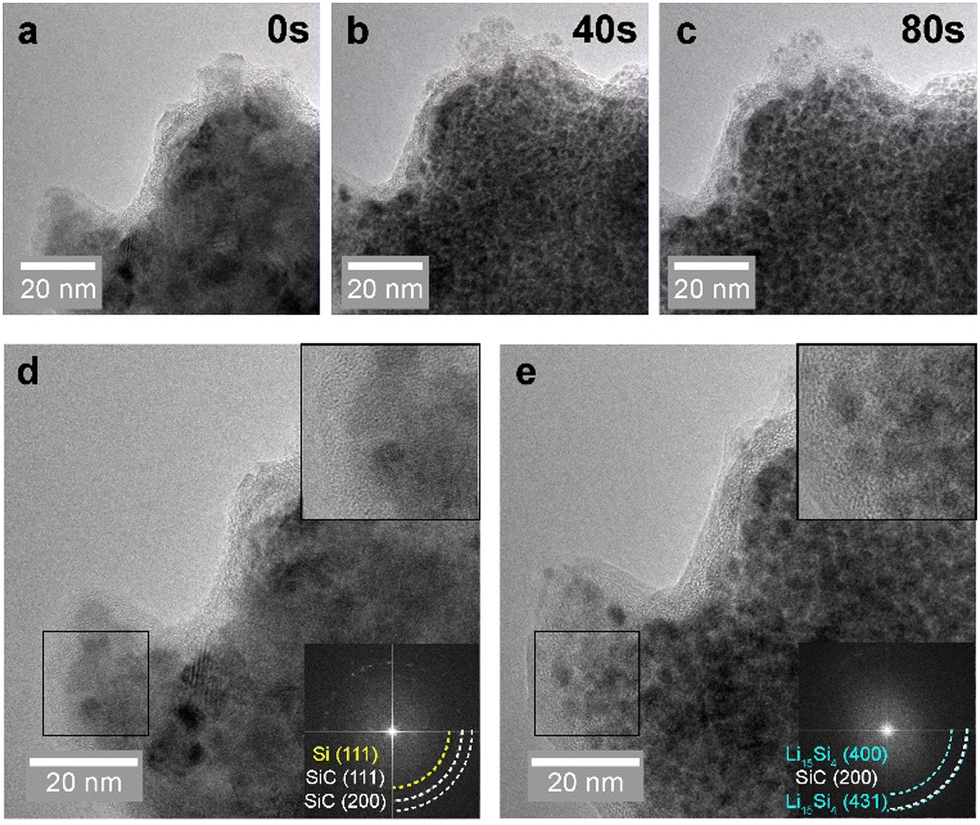 | ||
| Fig. 3 In situ TEM analysis observing the lithiation behaviour of SiOC-H, containing the SiOC phase. (a)–(c) Time series of SiOC-H lithiation from the initial state to at 80 s. High-magnification TEM images and corresponding FFT images (inset) of (d) the initial state of SiOC-H and (e) the lithiated state of SiOC-H, indicating a near zero-strain volume expansion after the in situ electrochemical reaction. | ||
After identifying the desirable near zero-strain volume expansion behaviour of SiNT@SiOC, we performed electrochemical tests of SiNTs, SiOC-L, and SiOC-H. These samples contain different quantities of crystalline Si, SiC, and amorphous SiOC, as shown in Fig. 4. Crystalline Si contributes significantly to the capacity, as confirmed by the lithiation and delithiation voltage plateaus in the voltage profiles in Fig. 4a. In the first cycle, SiOC-L and SiOC-H show capacities of 2642 and 1310 mA h g−1, respectively, with Coulombic efficiencies of 70.0% and 65.4%. According to previous studies on Si suboxide anode materials, the SiO2 phase forms an irreversible product such as lithium silicate (LixSiyO), resulting in a lower initial Coulombic efficiency than that of the pristine Si anode. However, SiOC-L shows a relatively high initial capacity due to its high pristine Si content.19,20Fig. 4b shows the cyclic voltammetry of SiNT@SiOC. In the anodic region (0.1 to 0.6 V vs. Li/Li+), a variance in peak intensities is noted. As evidenced in Fig. 4a, SiOC-L outperforms SiOC-H in terms of capacity. This trend remains evident in cyclic voltammetry tests, with a more pronounced anodic peak hinting at a greater Li+ extraction from Si.21 Meanwhile, the presence of residual SiO2 is generally indicated by the cathodic peaks in the cyclic voltammogram of the Si anodes at 0.45 V and 0.28 V. The peak current increases proportionally to the amount of SiO2. The 0.28 V cathodic peak is attributed to the reduction of native oxide, a primary cause of capacity loss. Post-etching with an HF solution, both SiNT@SiOC samples show a reduced peak current by SiO2. The 0.25 V cathodic peak corresponds to the formation of LixSiyO, which arises from the reaction between Si and the electrolyte during the formation cycles. Formation of LixSiyO irreversibly consumes the Li Source in the electrolyte, leading to battery performance degradation. However, this cathodic peak significantly decreases in SiOC-H. The oxygen-rich phase of SiOC-H suppresses the formation of LixSiyO due to the presence of Si–O and Si–C phases. Hence, SiOC can serve as a protective interphase to inhibit the formation of irreversible byproducts. This effect also becomes apparent in the capacity retention data in Fig. 4c. The capacity retention of pristine SiNTs ends before the 100th cycle, while that of SiOC-L is maintained up to 400 cycles due to the increase of SiC. SiOC-rich phases (SiOC-H) continue slow capacity degradation without further electrolyte depletion. Thus, we deduce that the SiOC phase can act as a protective layer to suppress such degradation processes, and improve the rate capability performance, as shown in Fig. 4d.22 As the SiC/SiOC grains form a protective layer, the nanotubes show minimal expansion during the lithiation process (Fig. S9, S10 and Movie S3–S6, ESI†). SiNT@SiOCs expand approximately 3.41% and 6.20% in the long and short axes, respectively. This expansion is significantly lower than that of the bare SiNTs, which exhibit 19.95% and 33.17% expansion in each axis, respectively.15
 | ||
| Fig. 4 Electrochemical characterization of SiOC-L and SiOC-H. (a) Specific capacity-voltage profiles and (b) cyclic voltammetry curves at a scan rate of 0.1 mV s−1 within a voltage range of 0–1.5 V versus Li/Li+, (c) capacity retention at a 0.5C rate and Coulombic efficiency (inset), and (d) rate performance of SiNT, SiOC-L, and SiOC-H. | ||
The formation of SiC and SiOC phases has been validated through high-temperature synthesis involving Si suboxide and carbon-based materials, resulting in a conversion-like near zero-strain volume expansion during electrochemical lithiation. Contrary to traditional research that describes SiC as an electrochemically inactive material, we demonstrate that SiC can be partially lithiated as the structure of nano-sized grains embedded in the amorphous SiOC matrix. Moreover, the electrochemical behaviour of the Si–SiC–SiOC composite observed by in situ TEM reveals the structural conversion of the bulk region, leading to the formation of c-Li15Si4. This recrystallization occurs when amorphous Si undergoes complete lithiation at 10 mV, potentially causing internal fractures during operation. However, within the amorphous SiOC matrix phase, the formation of c-Li15Si4 is effectively accommodated as homogeneously dispersed nano-crystallites. In addition, SiOC aids in preserving irreversible Li consumption as lithium silicate, a byproduct of electrolyte decomposition. Consequently, we can define SiNT@SiOC in this study as an electrochemically active protective interphase, maintaining structural integrity and mitigating Li depletion in the electrolyte.
S. J. Y., T.-U. W., and H.-W. L. designed this idea. S. J. Y., T.-U. W., and S.-J. J. carried out material synthesis, characterization, and electrochemical performance tests. M. S. K. and S.-C. J. assisted in sample preparation. All authors contributed to the writing of the manuscript under the supervision of H.-W. L.
This work was financially supported by the 2023 Research Fund (1.230040.01) of UNIST and the National Research Foundation of Korea (grant no. RS-2023-00208929, 2021RIS-003). This study contains the results obtained by using the equipment of UNIST Central Research Facilities (UCRF).
Conflicts of interest
There are no conflicts to declare.References
- F. Wu, J. Maier and Y. Yu, Chem. Soc. Rev., 2020, 49, 1569–1614 RSC.
- M.-H. Kim, T.-U. Wi, J. Seo, A. Choi, S. Ko, J. Kim, U. Jung, M. S. Kim, C. Park, S. Jin and H.-W. Lee, Nano Lett., 2023, 23, 3582–3591 CrossRef CAS PubMed.
- J. Ryu, D. Hong, H.-W. Lee and S. Park, Nano Res., 2017, 10, 3970–4002 CrossRef CAS.
- S. Ko, M.-J. Baek, T.-U. Wi, J. Kim, C. Park, D. Lim, S. J. Yeom, K. Bayramova, H. Y. Lim, S. K. Kwak, S. W. Lee, S. Jin, D. W. Lee and H.-W. Lee, ACS Mater. Lett., 2022, 4, 831–839 CrossRef CAS.
- J. Kim, M.-H. Kim, Y. Kim, M. S. Kim, A. Choi, K.-M. Jeong and H.-W. Lee, Energy Storage Mater., 2023, 57, 269–276 CrossRef.
- S. J. Yeom, T.-U. Wi, S. Ko, C. Park, K. Bayramova, S. Jin, S. W. Lee and H.-W. Lee, ACS Appl. Mater. Interfaces, 2022, 14, 5237–5246 CrossRef CAS PubMed.
- S.-H. Choi, G. Nam, S. Chae, D. Kim, N. Kim, W. S. Kim, J. Ma, J. Sung, S. M. Han, M. Ko, H.-W. Lee and J. Cho, Adv. Energy Mater., 2019, 9, 1803121 CrossRef.
- J. Sung, N. Kim, J. Ma, J. H. Lee, S. H. Joo, T. Lee, S. Chae, M. Yoon, Y. Lee, J. Hwang, S. K. Kwak and J. Cho, Nat. Energy, 2021, 6, 1164–1175 CrossRef.
- I. H. Son, J. H. Park, S. Kwon, S. Park, M. H. Rümmeli, A. Bachmatiuk, H. J. Song, J. Ku, J. W. Choi, J. M. Choi, S. G. Doo and H. Chang, Nat. Commun., 2015, 6, 1–8 Search PubMed.
- L. Zhao, J. C. Bennett, A. George and M. N. Obrovac, Chem. Mater., 2019, 31, 3883–3890 CrossRef CAS.
- C. Yu, X. Chen, Z. Xiao, C. Lei, C. Zhang, X. Lin, B. Shen, R. Zhang and F. Wei, Nano Lett., 2019, 19, 5124–5132 CrossRef CAS PubMed.
- S. Park, J. Sung, S. Chae, J. Hong, T. Lee, Y. Lee, H. Cha, S. Y. Kim and J. Cho, ACS Nano, 2020, 14, 11548–11557 CrossRef CAS PubMed.
- D. T. Ngo, H. T. T. Le, X. M. Pham, C. N. Park and C. J. Park, ACS Appl. Mater. Interfaces, 2017, 9, 32790–32800 CrossRef CAS PubMed.
- C. Chandra, W. Devina, H. S. Cahyadi, S. K. Kwak and J. Kim, Chem. Eng. J., 2022, 428, 131072 CrossRef CAS.
- S. J. Yeom, C. Lee, S. Kang, T. U. Wi, C. Lee, S. Chae, J. Cho, D. O. Shin, J. Ryu and H. W. Lee, Nano Lett., 2019, 19, 8793–8800 CrossRef CAS PubMed.
- J. Ahn, H. S. Kim, J. Pyo, J.-K. Lee and W. C. Yoo, Chem. Mater., 2016, 28, 1526–1536 CrossRef CAS.
- Y. Berro and M. Balat-Pichelin, Energy Convers. Manag., 2022, 251, 114951 CrossRef CAS.
- H. Inde, M. Kanezashi, H. Nagasawa, T. Nakaya and T. Tsuru, ACS Omega, 2018, 3, 6369–6377 CrossRef CAS PubMed.
- Z. Lu, N. Liu, H.-W. Lee, J. Zhao, W. Li, Y. Li and Y. Cui, ACS Nano, 2015, 9, 2540–2547 CrossRef CAS PubMed.
- M. Ko, S. Chae, J. Ma, N. Kim, H.-W. Lee, Y. Cui and J. Cho, Nat. Energy, 2016, 1, 16113 CrossRef CAS.
- A. R. Jiménez, R. Klöpsch, R. Wagner, U. C. Rodehorst, M. Kolek, R. Nölle, M. Winter and T. Placke, ACS Nano, 2017, 11, 4731–4744 CrossRef PubMed.
- J. Kim, O. B. Chae and B. L. Lucht, J. Electrochem. Soc., 2021, 168, 030521 CrossRef CAS.
Footnotes |
| † Electronic supplementary information (ESI) available. See DOI: https://doi.org/10.1039/d3cc03799a |
| ‡ These authors contributed equally to this work. |
| This journal is © The Royal Society of Chemistry 2023 |