 Open Access Article
Creative Commons Attribution 3.0 Unported Licence
Ion-modulated interfacial fluorescence in droplet microfluidics using an ionophore-doped oil†
Renjie
Wang
 ,
Nasrin
Ghanbari Ghalehjoughi
and
Xuewei
Wang
 *
*
Department of Chemistry, Virginia Commonwealth University, 1001 W. Main Street, Richmond, VA 23284, USA. E-mail: wangx11@vcu.edu
First published on 11th September 2023
Abstract
Fluorescence at the oil–water interface is used for chemical sensing in droplet microfluidics. Potassium ions in aqueous droplets are extracted into oil segments doped with an ionophore, a cation exchanger, and a cationic dye to expel the dye. When a low concentration of dye with a balanced solubility is used, it actively accumulates at the thin interface between oil and water instead of getting dissolved in the aqueous phase. The interfacial fluorescence is monitored distinct from the fluorescence in the oil sensor and the aqueous sample, allowing for highly sensitive and selective turn-on fluorescence sensing of ions.
Interfaces between water and water-immiscible media such as oils, lipids, air, and solids often provide physical and chemical environments different from the bulk water. The unique interactions and reactions at aqueous interfaces have been examined and utilized in numerous disciplines such as sensing, electrochemistry, catalysis, and synthesis.1–4 In recent years, interfaces of micrometer-sized water droplets in air or oil have attracted special attention because many chemical reactions are enabled or accelerated at the droplet surfaces.5 Aqueous microdroplets confined in oil represent an important platform to study the unique charge, electric field, and chemical concentration of interfaces to elucidate the mechanism of these interface-enhanced reactions.6–10 They also aid in understanding biochemical reactions in cells by mimicking the intracellular environment confined by the hydrophobic lipid bilayer.10
Droplet microfluidics is a technology to produce a large number of identical aqueous droplets in a carrier oil.11,12 The aqueous and oil phases driven by applied force meet in an intersection, where the aqueous phase is torn by shear stress into the oil phase to form microdroplets heading downstream. Compared to static droplets, droplet microfluidics continuously generates flowing water–oil interfaces with high throughput and superb consistency. These interfaces have found applications in the preparation of materials such as metal–organic framework capsules and Pickering emulsions.11,13,14 There are also fundamental studies on the adsorption of surfactants on these interfaces to understand and control the microfluidic droplet formation processes.15,16 However, interfacial properties are overall overlooked in droplet microfluidics as most systems focus on one phase, which is the aqueous droplet bulk, especially when biological molecules and units are involved.11,17–19 A typical droplet microfluidic system employs a fluorocarbon oil as a highly inert continuous phase to prevent crosstalk between aqueous droplets and a perfluorinated surfactant to stabilize the droplets.17,20 The surfactants occupy the oil–water interfaces and shield interfacial behaviors of other examined molecules.20,21
We recently reported droplet microfluidics using a surfactant-free plasticizer-based oil phase for biphasic chemical sensing.22–24 The oils contain sensing chemicals including an ion recognition element, a cation exchanger, and an optical reporter. The analyte cations in aqueous droplets such as blood droplets are selectively extracted into oil segments to displace cationic dyes or protons of lipophilic pH indicators, leading to a fluorescence change of the oil segments. We noticed slightly higher fluorescence intensities at some water–oil interfaces compared to the oil and water phases although the bulk phase fluorescence is dominant and used for sensing.23 In this communication, we explored this interfacial fluorescence phenomenon in droplet microfluidics and identified unique experimental conditions that favor fluorescence at interfaces. The interfacial fluorescence enables highly sensitive and selective turn-on ion sensing, which is advantageous over the turn-off response mode in previous reports using the fluorescence of the oil segments.22,23 To the best of our knowledge, this is the first time that interfacial fluorescence in droplet microfluidics is used for chemical sensing.
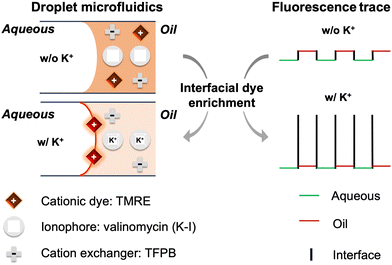
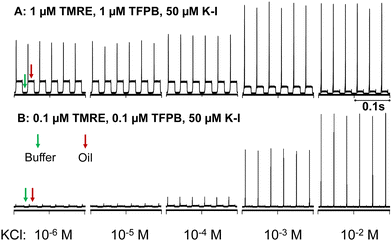
Scheme 1 illustrates the mechanism of the interfacial fluorescence-based K+ sensing using dioctyl sebacate (DOS) containing tetramethylrhodamine ethyl ester (TMRE) as the cationic dye, potassium ionophore I (K–I, valinomycin) as the ion recognition component, and tetrakis[3,5-bis(trifluoromethyl)phenyl]borate (TFPB) in its sodium salt form as the cation exchanger to maintain the charge balance. Fig. 1A and B show the fluorescence trace in the presence of varying concentrations of K+ in the sample. The interfacial fluorescence increases and the oil phase fluorescence decreases as K+ in the aqueous phase increases. This is because of the extraction of a portion of K+ from aqueous droplets into oil segments to form a complex with K–I. According to the electroneutrality condition, an equivalent number of cationic dyes are expelled from the oil as a result of the ion extraction.25–28 TMRE as a cell-permeable dye has a relatively low aqueous solubility of about 50 μM in Tris-HCl buffer according to our test. On the other hand, rhodamines and other ionic dyes strongly adsorb on both open and closed water–oil interfaces although the exact adsorption mechanism remains to be elucidated.6–10 For example, dye enrichment by approximately 10![[thin space (1/6-em)]](https://www.rsc.org/images/entities/char_2009.gif) 000-fold has been reported at a 10 nm thin layer of a water-hexadecane interface.8 As a result, the TMRE cations expelled from the oil accumulate at the interface instead of getting dissolved in the aqueous droplets. Rhodamine type dyes tend to undergo aggregation-induced fluorescence quenching at high concentrations. However, a high electric field across the interface between the aqueous microdroplet and the oil medium renders dyes aligned in a particularly rigid manner and they fluoresce similarly to non-aggregated monomers.8 Therefore, dyes are not only enriched but also highly fluorescent at the water–oil interfaces, as shown in Fig. 1. The distinct interfacial fluorescence is also evidenced by a fluorescence image of the flow (Fig. S3, ESI†). The interfacial fluorescence increases as the sample pH increases (Fig. S4, ESI†), suggesting that the dye enrichment may be related to the negative charge at the interface created by the adsorption of hydroxide ions.29
000-fold has been reported at a 10 nm thin layer of a water-hexadecane interface.8 As a result, the TMRE cations expelled from the oil accumulate at the interface instead of getting dissolved in the aqueous droplets. Rhodamine type dyes tend to undergo aggregation-induced fluorescence quenching at high concentrations. However, a high electric field across the interface between the aqueous microdroplet and the oil medium renders dyes aligned in a particularly rigid manner and they fluoresce similarly to non-aggregated monomers.8 Therefore, dyes are not only enriched but also highly fluorescent at the water–oil interfaces, as shown in Fig. 1. The distinct interfacial fluorescence is also evidenced by a fluorescence image of the flow (Fig. S3, ESI†). The interfacial fluorescence increases as the sample pH increases (Fig. S4, ESI†), suggesting that the dye enrichment may be related to the negative charge at the interface created by the adsorption of hydroxide ions.29
 | ||
| Scheme 1 Schematic illustration of the K+-induced dye accumulation at interfaces in droplet microfluidics. The structures of the sensing chemicals are shown in Fig. S1 (ESI†). | ||
 | ||
| Fig. 1 Fluorescence trace of the microfluidic flow. The y-axis is the intensity of laser-induced fluorescence (arbitrary unit) detected at the downstream end of the channel over time. Fluorescence spikes occur at the oil-to-water interfaces. The oil to form droplet microfluidics is DOS containing high (A) and low (B) concentrations of sensing chemicals. The aqueous phase is 0.1 M Tris-HCl buffer at pH 7.4 containing different concentrations of KCl. A PDMS chip with a T-junction design (Fig. S2, ESI†) is used to generate droplet microfluidics. The excitation light source is a 561 nm laser and the fluorescence emission is collected in the range of 565–665 nm using a Confocal Laser Scanning Microscope. | ||
Although dye displacement from the sensor phase to the interface zone has been reported in ion-selective optodes using solvatochromic dyes with long alkyl chains, their response is based on the different fluorescence of the dye in the aqueous and plasticizer phases instead of a distinct interface.26–28 In contrast, the unique properties of interfaces that enrich and align the dyes are the basis of the present sensing method in droplet microfluidics. TMRE dyes as opposed to highly hydrophobic dyes with long alky chains, in principle, can be readily dissolved in aqueous droplets since the used concentration (0.1 μM) is much lower than its aqueous solubility (∼50 μM). However, they accumulate at the interface in an active manner probably due to the negative charge of the interface.29 In another report, the Xie group speculated that the extraction of cations may expel monomeric cyanine dyes from the nanoparticle optode bulk to the optode surface to form dimers with higher fluorescence.30 They pointed out that it is difficult to differentiate the signal from the bulk phases and the surface probably because the fluorescence intensity of the nanooptode suspension includes all three phases. In contrast, droplet microfluidics is a unique platform that allows for unambiguous monitoring of the fluorescence of the sensor, the sample, and the interface in an independent and sequential fashion.
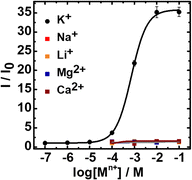
Fig. 1 also shows that oils containing different concentrations of sensing chemicals exhibit different sensitivity toward K+. When the initial TMRE concentration is 1 μM in DOS (Fig. 1A), both the interfacial and oil fluorescence are quite significant in the presence of a low concentration of K+. An increasing concentration of K+ expels more TMRE from the oil segments to the interfaces. However, each interface has a finite adsorption capacity,7,8 setting a limit on the maximum interfacial fluorescence. As a result, the interfacial fluorescence only has a total increase of ∼70% for 10−6 to 10−2 M K+. In contrast, when the oil contains only 0.1 μM TMRE, its initial interfacial concentration is far below the adsorption capacity and there is much larger room for its accumulation induced by the extraction of more K+. Fig. 2 shows the interfacial fluorescence-based response curve of the 0.1 μM TMRE sensing oil toward K+ and other cations. A 35-fold fluorescence increase is obtained, which is among the best responses of ion-selective optodes in a turn-on mode.30–33 This also represents an extraordinary selectivity since no response is observed for any other examined cations even at 0.1 M. As expected, the dynamic range of K+ response depends on the ionophore concentration in the sensing oil because the potassium ionophore determines the extraction equilibrium of K+ (Fig. S5, ESI†). The response time is estimated to be 11 s (Fig. S6, ESI†). Given the very low concentration of ion exchangers and dyes, this sensing process is not in an exhaustive mode.
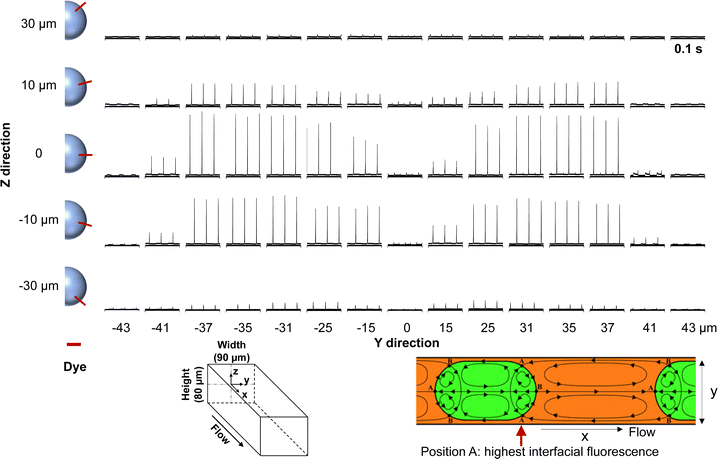
Interestingly, this interfacial fluorescence shows a strong variation when the laser beam is focused on different positions of the channel cross-section. As shown in Fig. 3, the highest fluorescence is obtained when z ≈ 0. It was found that dyes have their electric dipoles perpendicular to the interface of the aqueous droplets and oil.7 When z ≈ 0, the absorption transition moment of the dyes at the interface is most likely aligned parallel to the electric vector of the excitation light in the epifluorescence microscope, leading to the highest emission. For each specific channel depth (specific z), the fluorescence is highest when the detection point is ∼8–20 μm away from the wall (y = ± 25–37 μm). There are stagnation points including converging points A and diverging points B due to the special recirculation flow of droplet microfluidics (Fig. 3).34 It has been predicted that chemicals favorably adsorb on stagnation points due to the longer interaction time compared to other interface zones with a higher flow velocity and such interfacial adsorption first occurs at the interface near the converting points A labelled in Fig. 3. Our interfacial fluorescence exactly occurs at these converting points A preceding aqueous droplets (oil-to-water interfaces), which is attributed to the preferential adsorption of TMRE at these converting stagnation points. There are also converting points preceding the oil segments (A in the center of the channel), but we did not observe strong fluorescence at these water-to-oil interfaces. When TMRE is replaced by methylene blue, the interfacial fluorescence-based response toward K+ becomes much smaller probably because an extremely high solubility of the dye in water (136 mM) disfavors the interfacial accumulation (Fig. S7, ESI†).
 | ||
| Fig. 3 Fluorescence trace of the microfluidic flow when interrogated at different positions of the channel cross-section. X is fixed to be 4.5 cm distant from the junction along the flow. The center of the yz-plane is defined as the origin. The red bar denotes the TMRE dye that aligns perpendicularly to the water–oil interface curvature along the z direction. The schematic of the recirculation zones for the flow in droplet microfluidics is adapted from ref. 34. | ||
In a preliminary sensing application, we determined the concentration of K+ in cerebrospinal fluid as electrolyte abnormalities are associated with neurological disorders.35 Human cerebrospinal fluid is diluted by 100-fold using 0.1 M Tris-HCl buffer at pH 7.4 to control the sample pH. The K+ concentration in a cerebrospinal fluid sample is determined to be 9.2 mM based on the interfacial fluorescence, which has a 6% error relative to that determined by a standard technique (Table S1, ESI†). A recovery rate of 90% is obtained when the sample is spiked with extra K+. The microfluidic sensor may be used to analyze other low-volume samples such as tumor interstitial fluid and sweat, which contains a few mM to tens of mM K+.36 By using the corresponding ionophore, Na+ can also modulate the interfacial fluorescence and be detected (Fig. S8, ESI†).
In summary, K+ in the aqueous phase modulates the distribution of TMRE from the oil segment to the oil–water interface via its extraction to the ionophore-doped oil. The interfacial fluorescence is most significant at a low dye concentration and at converging stagnation positions of the flow. In future work, we will explore the interfacial enrichment behavior of more dyes under more experimental conditions such as different oils, oil compositions, and microfluidic designs. The interfacial fluorescence may find other applications such as droplet sorting and logical operation in addition to chemical and biochemical sensing.
This work is supported by Virginia Commonwealth University (Startup Grant for X. W.).
Conflicts of interest
There are no conflicts to declare.Notes and references
- O. M. Magnussen and A. Groß, J. Am. Chem. Soc., 2019, 141, 4777–4790 CrossRef CAS PubMed.
- J. K. Beattie, C. S. P. McErlean and C. B. W. Phippen, Chem. – Eur. J., 2010, 16, 8972–8974 CrossRef CAS PubMed.
- A. J. G. Zarbin, Mater. Horiz., 2021, 8, 1409–1432 RSC.
- L. Pirondini and E. Dalcanale, Chem. Soc. Rev., 2007, 36, 695–706 RSC.
- M. F. Ruiz-Lopez, J. S. Francisco, M. T. C. Martins-Costa and J. M. Anglada, Nat. Rev. Chem., 2020, 4, 459–475 CrossRef CAS PubMed.
- J. Kang, S. Lhee, J. K. Lee, R. N. Zare and H. G. Nam, Sci. Rep., 2020, 10, 16859 CrossRef CAS PubMed.
- Z. Zhou, X. Yan, Y. H. Lai and R. N. Zare, J. Phys. Chem. Lett., 2018, 9, 2928–2932 CrossRef CAS PubMed.
- H. Xiong, J. K. Lee, R. N. Zare and W. Min, J. Phys. Chem. B, 2020, 124, 9938–9944 CrossRef CAS PubMed.
- H. Xiong, J. K. Lee, R. N. Zare and W. Min, J. Phys. Chem. Lett., 2020, 11, 7423–7428 CrossRef CAS PubMed.
- S. Lhee, J. K. Lee, J. Kang, S. Kato, S. Kim, R. N. Zare and H. G. Nam, Sci. Adv., 2023, 6, eaba0181 CrossRef PubMed.
- S. Y. Teh, R. Lin, L. H. Hung and A. P. Lee, Lab Chip, 2008, 8, 198–220 RSC.
- L. Shang, Y. Cheng and Y. Zhao, Chem. Rev., 2017, 117, 7964–8040 CrossRef CAS PubMed.
- R. Ameloot, F. Vermoortele, W. Vanhove, M. B. J. Roeffaers, B. F. Sels and D. E. De Vos, Nat. Chem., 2011, 3, 382–387 CrossRef CAS PubMed.
- Z. Nie, J. Il Park, W. Li, S. A. F. Bon and E. Kumacheva, J. Am. Chem. Soc., 2008, 130, 16508–16509 CrossRef CAS PubMed.
- D. Ferraro, P. Sartori, N. Akhtar, A. Zaltron, M. Pierno and G. Mistura, Phys. Fluids, 2021, 33, 52121 CrossRef CAS.
- C. V. H.-H. Chen, Y. Liu, H. A. Stone and R. K. Prud’homme, Langmuir, 2018, 34, 10512–10522 CrossRef CAS PubMed.
- H. N. Joensson and H. Andersson Svahn, Angew. Chem., Int. Ed., 2012, 51, 12176–12192 CrossRef CAS PubMed.
- M. T. Guo, A. Rotem, J. A. Heyman and D. A. Weitz, Lab Chip, 2012, 12, 2146–2155 RSC.
- K. Matuła, F. Rivello and W. T. S. Huck, Adv. Biosyst., 2020, 4, 1900188 CrossRef PubMed.
- J. C. Baret, Lab Chip, 2012, 12, 422–433 RSC.
- L. S. Roach, H. Song and R. F. Ismagilov, Anal. Chem., 2005, 77, 785–796 CrossRef CAS PubMed.
- X. Wang, M. Sun, S. A. Ferguson, J. D. Hoff, Y. Qin, R. C. Bailey and M. E. Meyerhoff, Angew. Chem., Int. Ed., 2019, 58, 8092–8096 CrossRef CAS PubMed.
- R. Wang, Y. Zhou, N. Ghanbari Ghalehjoughi, Y. Mawaldi and X. Wang, Anal. Chem., 2021, 93, 13694–13702 CrossRef CAS PubMed.
- R. Wang and X. Wang, Sens. Actuators, B, 2021, 329, 129171 CrossRef CAS.
- X. Xie, A. Gutiérrez, V. Trofimov, I. Szilagyi, T. Soldati and E. Bakker, Anal. Chem., 2015, 87, 9954–9959 CrossRef CAS PubMed.
- X. Xie, I. Szilagyi, J. Zhai, L. Wang and E. Bakker, ACS Sens., 2016, 1, 516–520 CrossRef CAS PubMed.
- L. Wang and E. Bakker, Chem. Commun., 2019, 55, 12539–12542 RSC.
- L. Wang, S. Sadler, T. Cao, X. Xie, J. M. Von Filseck and E. Bakker, Anal. Chem., 2019, 91, 8973–8978 CrossRef CAS PubMed.
- P. Creux, J. Lachaise, A. Graciaa, J. K. Beattie and A. M. Djerdjev, J. Phys. Chem. B, 2009, 113, 14146–14150 CrossRef CAS PubMed.
- L. Deng, J. Zhai, X. Du and X. Xie, ACS Sens., 2021, 6, 1279–1285 CrossRef CAS PubMed.
- A. Konefał, P. Piątek, K. Maksymiuk and A. Michalska, Sens. Actuators, B, 2023, 391, 134022 CrossRef.
- J. M. Dubach, D. I. Harjes and H. A. Clark, J. Am. Chem. Soc., 2007, 129, 8418–8419 CrossRef CAS PubMed.
- R. Wang, X. Du, X. Ma, J. Zhai and X. Xie, Analyst, 2020, 145, 3846–3850 RSC.
- C. N. Baroud, F. Gallaire and R. Dangla, Lab Chip, 2010, 10, 2032–2045 RSC.
- S. Z. K. Sajib, M. B. Lee, H. J. Kim, E. J. Woo and O. I. Kwon, Sci. Rep., 2018, 8, 290 CrossRef PubMed.
- R. Eil, et al. , Nature, 2016, 537, 539–543 CrossRef CAS PubMed.
Footnote |
| † Electronic supplementary information (ESI) available. See DOI: https://doi.org/10.1039/d3cc02945j |
| This journal is © The Royal Society of Chemistry 2023 |

