
 Open Access Article
 This Open Access Article is licensed under a
 Creative Commons Attribution 3.0 Unported Licence
Visible light-driven highly-efficient hydrogen production by a naphthalene imide derivative-sensitized TiO2 photocatalyst†
Dan
Wei
a,
Kang
Yang
a,
Chunman
Jia
 *a and
Jianwei
Li
*b
*a and
Jianwei
Li
*b
aHainan Provincial Key Laboratory of Fine Chem, School of Chemical Engineering and Technology, Hainan University, Haikou 570228, China. E-mail: jiachunman@hainanu.edu.cn
bMediCity Research Laboratory, University of Turku, Tykistökatu 6, FI-20520 Turku, Finland. E-mail: jianwei.li@utu.fi
First published on 12th June 2023
Abstract
Sensitizing titanium dioxide (TiO2) with dye molecules offers a cost-effective and environmentally friendly strategy for creating powerful photocatalysts for hydrogen production by reducing the band gap and enhancing sunlight absorption. Despite the challenges of identifying a stable dye with high light harvesting efficiency and effective charge recombination, we present a 1,8-naphthalimide derivative-sensitized TiO2 that achieves ultra-efficient photocatalytic hydrogen production (10.615 mmol g−1 h−1) and maintains activity after 30 hours of cycling. Our research offers valuable insights for designing optimized organic dye-sensitized photocatalysts, advancing clean and sustainable energy solutions.
The growing global energy demand and the need to address environmental challenges have intensified the search for clean, renewable energy sources. Solar energy, being an abundant and sustainable resource, holds tremendous potential to tackle these issues. A significant area of research in the field of renewable energy is the conversion of solar energy into hydrogen. One promising approach to achieve this is the utilization of semiconductor materials to split water and produce hydrogen under sunlight exposure.1
Titanium dioxide (TiO2), an n-type semiconductor, has attracted considerable interest due to its favourable photoelectrochemical properties, stability, affordability, and non-toxicity.2–4 Nevertheless, its limited response to ultraviolet light and low photocatalytic water-splitting efficiency calls for enhancements in its performance.5 Researchers have investigated various strategies to improve TiO2's photocatalytic activity, with dye sensitization emerging as a promising technique owing to its cost-effectiveness, environmental friendliness, and efficient sunlight absorption capabilities.6
To address the challenges associated with dye sensitization, including stability concerns, light harvesting efficiency, and charge recombination, we designed and synthesized 1,8-naphthalimide derivatives (DT) with unique properties. The organic synthesis routes and characterization of chemical compounds are shown in Fig. S1–S6 (ESI†).6 These organic compounds exhibit bright colour and strong fluorescence due to their naphthalene ring and imide structure, and feature a large continuous π-conjugated system, coplanar rigid structure, and strong push–pull electronic characteristics, making them excellent organic semiconductor materials.
Leveraging the advantageous properties of DT, we developed an organic–inorganic composite by integrating 1,8-naphthalimide derivatives with TiO2 using a straightforward sol–gel method (DT-TiO2) (Fig. S7, ESI†).7 Pt was incorporated as a co-catalyst and triethanolamine was used as an electron donor. Due to the unique properties of DT, the composite demonstrated enhanced photocatalytic hydrogen production under visible light irradiation while overcoming the challenges associated with dye sensitization.
We first optimized the hydrogen production efficiency of DT-TiO2 photocatalysts under the various conditions by changing DT doping amounts (Fig. S8, ESI†), calcination temperatures (Fig. S9, ESI†), Pt loading amounts (Fig. S10 and Table S1, ESI†) and sacrificial agents (Fig. S11, ESI†), and tested different catalyst dosages (Fig. S12, ESI†). Remarkably, the optimized catalyst, Pt (0.6 wt%)/DT-TiO2 (5.0 wt%), exhibited excellent catalytic activity under visible light irradiation (λ > 400 nm) by a xenon lamp (300 W), with a hydrogen evolution rate of 10.615 mmol g−1 h−1, showing top-of-the-range catalysts for photocatalytic hydrogen production reported to date (Table S2, ESI†).8 This result underscores the potential of organic dye-sensitized photocatalysts in advancing the field of photocatalytic hydrogen production.
The morphology and microstructure of the optimized catalyst were then investigated using scanning electron microscope (SEM) and transmission electron microscopy (TEM) (Fig. 1 and Fig. S13, ESI†). From the SEM image of the DT-TiO2 (5.0 wt%) material, the nanoparticle size is about 7–10 nm. The high-angle annular dark-field scanning transmission electron microscopy (HAADF–STEM) and elemental mapping of Pt (0.6 wt%)/DT-TiO2 (5.0 wt%) revealed a uniform distribution of C, O, N, Ti, and Pt elements throughout the composite, consistent with the energy dispersive X-ray (EDX) analysis results, which also confirmed the presence of Pt nanoparticles. In addition, Pt should be clustered in the form of nanoparticles in the HAADF–STEM image of Pt (0.6 wt%)/DT-TiO2 (5.0 wt%) (Fig. S14, ESI†), as no Pt monatomic morphology was observed. The selected area electron diffraction (SAED) results verified the polycrystalline nature of TiO2 in the material. TEM images of Pt (0.6 wt%)/DT-TiO2 (5.0 wt%) demonstrated a platinum nanoparticle size distribution of around 3–5 nm. Analysis of high-resolution transmission electron microscopy (HRTEM) images indicated that the spacing between two adjacent lattice planes of platinum nanoparticles is approximately 0.197 nm, corresponding to the (200) plane of Pt. A lattice spacing of 0.351 nm was also observed, consistent with the spacing of anatase TiO2 (101) crystal planes.
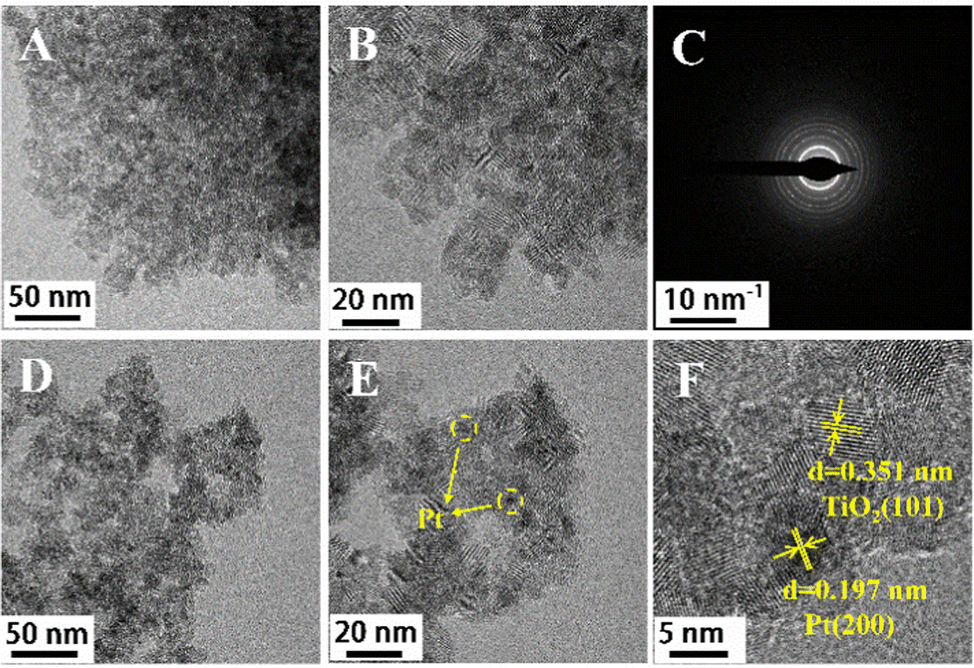 | ||
| Fig. 1 (A) and (B) TEM images of DT-TiO2 (5.0 wt%); (C) SEAD image of of DT-TiO2 (5.0 wt%); (D) and (E) TEM images of Pt (0.6 wt%)/DT-TiO2 (5.0 wt%); (F) HRTEM image of Pt (0.6 wt%)/DT-TiO2 (5.0 wt%). | ||
The impact of the catalyst's specific surface area on catalytic performance was evaluated by conducting physical adsorption–desorption tests on TiO2 and composites. The N2 adsorption–desorption isotherms and pore size distributions of DT and DT-TiO2 (2.5/5.0/7.5 wt%) materials at 77 K were shown in Fig. S15 (ESI†). The isotherms were of the typical type IV physisorption isotherm, featuring an H2 type hysteresis loop. As the content of dye DT increased from 0 to 7.5 wt%, the specific surface area in the hybrid materials gradually increased from 166 m2 g−1 to 238 m2 g−1 (Fig. S16, ESI†) and the average pore diameter gradually decreased from 7.1 nm to 3.8 nm (Table S3, ESI†). These results confirmed that the introduction of DT could indeed reduce the pore size, increase the specific surface area, and thus increase the porosity. Moreover, unlike TiO2 materials where only mesoporous structure (7.1 nm) was observed, DT-TiO2 (5.0 wt%) samples prepared by sol–gel method had micro/mesoporous pore size distribution, including micropores (1.3–1.8 nm) and mesoporous (2.2–5.7 nm). It has been known that the micro/mesoporous structure can effectively shorten the electron–hole transport length from the bulk to the surface, which was beneficial to improve the electron–hole separation efficiency.9
The crystal phase of DT-TiO2 (5.0 wt%) in pure TiO2, as well as various contents of DT-TiO2 and different calcination temperatures (200 °C, 250 °C, 300 °C, 350 °C), was analysed using X-ray powder diffraction (XRD) (Fig. S17, ESI†). The results revealed peaks at 25.30°, 37.79°, 48.04°, 53.88°, and 62.68°, corresponding to the (101), (004), (200), (105), and (204) crystal planes, respectively. These findings were consistent with the anatase form of TiO2, indicating the formation of anatase TiO2, which agreed with TEM results. These results were also consistent with the Raman spectra of DT-TiO2 (Fig. S18, ESI†) which showed the same peaks as anatase TiO2 at 144 cm−1 (Eg), 197 cm−1 (Eg), 399 cm−1 (B1g), 514 cm−1 (A1g/B1g) and 639 cm−1 (Eg).10 The anatase crystal phase of TiO2 remained unchanged with increasing calcination temperature and DT content, suggesting that the crystallinity was not significantly affected during the composite material preparation.
Subsequently, FT-IR spectra were obtained for DT, TiO2, and DT-TiO2 (5.0 wt%) composites to analyse their molecular-level formation (Fig. S19, ESI†). All titania samples exhibited strong absorption peaks at approximately 3405 cm−1 (stretching vibration of –OH) and 1624 cm−1 (bending vibration of –OH). The broad absorption band in the range of 500–800 cm−1 indicated the stretching vibration of Ti–O–Ti in anatase TiO2. In the DT-TiO2 (5.0 wt%) composite, the peak at 1527 cm−1 corresponded to the N–H bending vibration of the amide, confirming the presence of DT in the composite. Notably, the C![[double bond, length as m-dash]](https://www.rsc.org/images/entities/char_e001.gif) O stretching vibration of DT at 1726 cm−1 disappeared, and new absorption peaks emerged in DT-TiO2 (5.0 wt%), attributed to the asymmetric and symmetric stretching vibrations of COO−. These observations suggest that DT molecules were chemically bonded to the TiO2 surface through the OC–O–Ti ester bond.
O stretching vibration of DT at 1726 cm−1 disappeared, and new absorption peaks emerged in DT-TiO2 (5.0 wt%), attributed to the asymmetric and symmetric stretching vibrations of COO−. These observations suggest that DT molecules were chemically bonded to the TiO2 surface through the OC–O–Ti ester bond.
To investigate the structural composition of the composite material, we conducted X-ray photoelectron spectroscopy (XPS) scans on TiO2, DT-TiO2 (5.0 wt%), and Pt (0.6 wt%)/DT-TiO2 (5.0 wt%) (Fig. S20–S22, ESI†). First, charge calibration was performed using the binding energy of contaminating carbon C 1s at 284.8 eV as a standard reference, with binding energies of 286.3 eV and 288.7 eV corresponding to the C–O bond and the CO bond, respectively. The binding energies of O 1s at 529.9 eV and 531.5 eV indicated two chemical states of oxygen, corresponding to the Ti–O bond and –OH adsorbed on the material surface, respectively. The characteristic peaks with binding energies of 458.7 eV and 464.3 eV were attributed to Ti 2p3/2 and 2p1/2, consistent with TiO2. The 399.7 eV peak in the N 1s diagram belonged to the C–N bond. Additionally, the Pt 4f7/2 peak at 71.2 eV and the Pt 4f5/2 peak at 74.5 eV were assigned to Pt (0), while the weak peaks at 72.9 eV and 76.0 eV correspond to Pt2+, likely due to a small amount of residual K2PtCl4. As the characteristic peaks of Ptδ+ and Pt4+ belonging to the single-atom state of Pt were not found, the Pt photo-deposited on the DT-TiO2 surface may not present in a single-atom state, but aggregated in the form of clusters, which confirmed the HAADF-STEM results.11
TG analysis was performed on DT and DT-TiO2 (5.0 wt%) materials, heating from room temperature to 600 °C at 10 °C min−1 (Fig. S23, ESI†). DT exhibited weight decreases at around 95 °C (evaporation of absorbed water) and between 158 °C and 286 °C (loss of residual solvent, DMF). Decomposition of DT occurred above 323 °C, with the peak decomposition rate at approximately 382 °C. In DT-TiO2 (2.5 wt%), weight loss at around 87 °C indicated volatilization of free water, while a small amount of bound water evaporated above 180 °C. Sudden loss at around 389 °C was likely due to DT loss and removal of impurities. The calcination temperature of 300 °C during DT-TiO2 (2.5 wt%) preparation was lower than DT's decomposition temperature, ensuring stable DT presence.
The doping of the organic compound DT could reduce the band gap of TiO2, expand its absorption range to visible light, capture photogenerated electrons, decrease electron–hole recombination, and achieve improved photocatalysis. To verify these hypotheses, we examined the UV-Vis solid-state diffraction spectra of DT, TiO2, and DT-TiO2 (Fig. 2A). TiO2 exhibited a strong absorption peak at 330 nm, indicating no absorption in the visible range. In contrast, DT displayed strong absorption in the 400–500 nm range, attributed to the π → π* transition with charge-transfer properties.18 The light absorption range of DT-TiO2 extended from 400–700 nm into the visible region, likely due to the strong interaction between the –COOH group of DT and the –Ti–OH of TiO2. Thus, the incorporation of DT significantly enhanced the absorption range and intensity of TiO2 under visible light. Then, we proceed to investigate the band gap of the hybrid material. The UV-Vis spectrum and fluorescence spectrum of DT in DMF solutions were recorded (Fig. S24, ESI†). The E0–0 value of DT was determined as 2.52 eV. TiO2 had only one band gap of 3.2 eV, while DT-TiO2 (5.0 wt%) had two distinct band gaps of 2.4 eV and 3.0 eV (Fig. 2B), which should be attributed to DT and TiO2, respectively. Compared with the E0–0 value of pure DT (2.52 eV), the narrower bandgap width (2.4 eV) of DT in DT-TiO2 indicated that the formation of Ti–O bond in the material.9,12,13
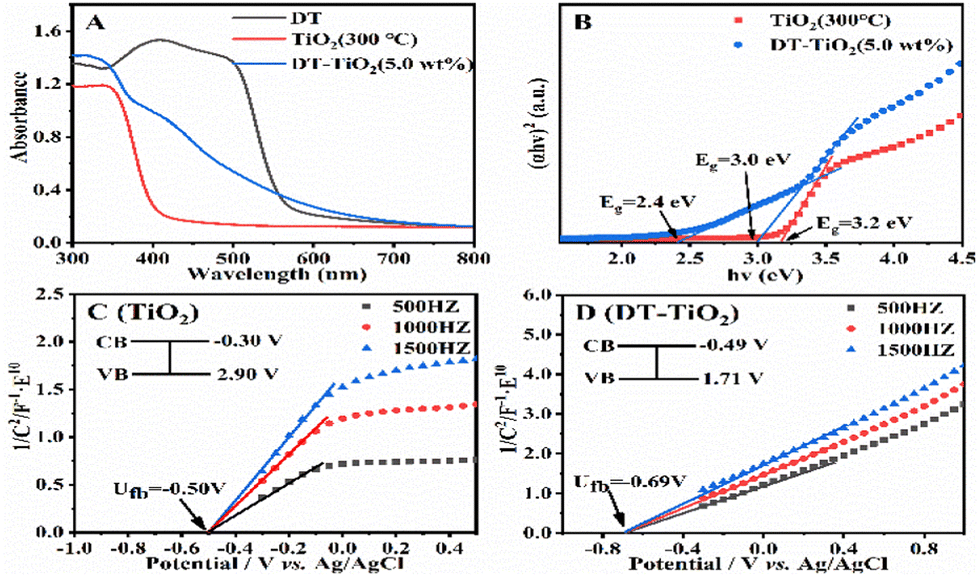 | ||
| Fig. 2 (A) UV-vis spectra of DT, TiO2 and DT-TiO2; (B) Tauc plots of TiO2 and DT-TiO2; Mott–Schottky diagrams of (C) TiO2 and (D) DT-TiO2. | ||
To confirm subsequent photocatalytic hydrogen production, Mott–Schottky tests were conducted at frequencies of 500, 1000, and 1500 Hz. The resulting potential diagram displayed a positive slope, indicating the characteristic behaviour of an N-type semiconductor (Fig. 2C and D). The flat band positions relative to the Ag/AgCl electrode were as follows: DT (−0.8 V), DT-TiO2 (−0.69 V), and TiO2 (−0.5 V). These flat band positions also represented their conduction bands since it is generally accepted that the conduction band potential of N-type semiconductors is approximately equal to the flat band potential. Moreover, all the conduction band potentials were more negative than the reduction potential of H+/H2. Notably, the conduction band potential of TiO2 was higher than that of DT, facilitating the migration of electrons from DT to TiO2. The valence bands were calculated as follows: DT-TiO2 (1.71 V) and TiO2 (2.9 V), based on the bandgap diagram. It is worth mentioning that the conduction band potential of the DT-TiO2 composite was more negative than that of TiO2, indicating a stronger photocatalytic reduction ability.
Subsequently, the stability of the composite was evaluated by testing the Pt (0.6 wt%)/DT-TiO2 (5.0 wt%) material for hydrogen production under a continuous irradiation of 30 h (Fig. 3A). The turnover number (TON) was 8964 determined by dividing the number of moles of produced hydrogen by the number of moles of platinum. The linear correlation coefficient of the hydrogen production with time was 0.99902, demonstrating that the photocatalyst was highly stable. This result was further supported by comparing the UV-vis diffuse reflectance spectra of irradiation before and after the photocatalysis (Fig. S25, ESI†). The shape of the absorption curve remained unchanged, indicating that the dye DT did not degrade. The slight decrease of absorption should be attributed to the desorption of a tiny number of dyes from the surface of TiO2, but this could not decrease the photocatalytic efficiency of the material.14
 | ||
Fig. 3 (A) Photocatalytic H2 production of Pt (0.6 wt%)/DT-TiO2 (5.0 wt%) in 20 mL H2O/TEOA (9![[thin space (1/6-em)]](https://www.rsc.org/images/entities/char_2009.gif) :1, v/v) under continuous visible light irradiation (λ > 400 nm). (B) The mechanism diagram of photocatalytic H2 production from Pt@DT-TiO2. :1, v/v) under continuous visible light irradiation (λ > 400 nm). (B) The mechanism diagram of photocatalytic H2 production from Pt@DT-TiO2. | ||
Using a Zolix MLED4-1 M450L light source with λ = 405 nm and 450 nm, we irradiated the photocatalytic material for 1 hour. We analysed the generated hydrogen using a gas chromatography-thermal conductivity detector (TCD) and calculated the apparent quantum yield (AQY).9,15 Under irradiation with different incident light wavelengths, the corresponding apparent quantum yield of a 10 mg Pt (0.6 wt%)/DT-TiO2 (5.0 wt%) sample was 1.94% (405 nm) > 1.44% (450 nm) (Table S4, ESI†). These results demonstrate that the shorter wavelength with the highest hydrogen generation activity aligns well with the main absorption wavelength of DT-TiO2 (5.0 wt%), indicating that the hydrogen generation reaction was indeed governed by the photocatalyst's light absorption properties.
To better understand carrier transfer resistance and photocatalytic activity in photocatalytic materials, we examined the efficient migration and separation of photoexcited electron–hole pairs using instantaneous photocurrent response (I–t) and electrochemical impedance spectroscopy (EIS) (Fig. S26, ESI†). The I–t curves of pure TiO2, DT, DT-TiO2 (5.0 wt%) and Pt (0.6 wt%)/DT-TiO2 (5.0 wt%) were measured by a 300 W xenon light source with a cut-off filter (λ > 400 nm) under multiple on/off lamp conditions. The photocurrent response of Pt (0.6 wt%)/DT-TiO2 (5.0 wt%) under visible light was higher than that of pure TiO2, indicating rapid charge transfer under visible light excitation.16 Additionally, the EIS Nyquist plots of pure TiO2, DT, DT-TiO2 (5.0 wt%) and Pt (0.6 wt%)/DT-TiO2 (5.0 wt%) were obtained using the same three-electrode battery system. Pt (0.6 wt%)/DT-TiO2 (5.0 wt%) exhibited a smaller arc radius than pure TiO2, indicating a reduced charge transfer resistance on the hybrid material's surface and faster carrier migration at the interface.
Finally, to explore the photocatalytic mechanism of DT-TiO2, we conducted a series of solid steady-state fluorescence emission spectra tests at excitation wavelengths of 300 nm and 400 nm, using control experimental materials. Steady-state photoluminescence spectroscopy in solids is known to effectively assess the transient separation ability of photogenerated charge carriers.17 The results showed that, except for TiO2, which exhibited a strong emission peak, the fluorescence intensities of the other three composites with different contents significantly decreased, which were DT-TiO2 (7.5 wt%) > DT-TiO2 (2.5 wt%) > DT-TiO2 (5.0 wt%), and the fluorescence intensity of Pt (0.6 wt%)/DT-TiO2 (5.0 wt%) is the weakest (Fig. S27, ESI†). Lower fluorescence intensity indicates reduced energy loss and enhanced photocatalytic performance.
Thus, we propose a mechanism for photocatalytic hydrogen production from water using Pt@DT-TiO2 material (Fig. 3B). The process involved three steps: (1) DT molecules absorbed visible light and was transitioned to an excited state (DT*); (2) electrons transferred from DT* to TiO2 and created electron–hole pairs due to TiO2's larger forbidden bandwidth. The photogenerated carriers separate and migrate to the surface without recombination; (3) surface-adsorbed Pt nanoparticles acted as co-catalysts, extracting electrons from TiO2 and providing active sites for reducing H+ in H2O to H2. Simultaneously, the DT* state transitioned to oxidized DT+ and subsequently reduced back to DT with the help of the sacrificial agent triethanolamine.
In conclusion, we have successfully showcased an extraordinary photocatalytic hydrogen production efficiency using a dye molecule-sensitized TiO2 hybrid material under visible light, reaching 10.615 mmol g−1 h−1. This impressive efficiency was attributed to the unique properties of the dye DT, which optimized TiO2's band gap, expanded its light absorption range, and reduced electron–hole recombination. Additionally, our naphthimide derivative, unlike most D–π–A dyes,18 was anchored to the semiconductor via a stable Ti–O bond using the sol–gel method. This immobilization enhanced stability, prevented dye degradation or desorption, and improved electron transfer efficiency. Our study highlights the potential of naphthalimide derivatives as organic semiconductors for advancing photocatalysts. The simple and cost-effective synthesis method underscores its wide applicability to various optoelectronic materials.
This work is financially supported by National Natural Science Foundation of China (No. 22161016 and 22161017), the Hainan Province Natural Science Foundation of China (220RC459) and project funding (No. 318524) and mobility funding (No. 355798) from the Academy of Finland.
Conflicts of interest
There are no conflicts to declare.Notes and references
- C. Acar, I. Dincer and G. F. Naterer, Int. J. Energy Res., 2016, 40, 1449–1473 CrossRef CAS.
- D. Li, Y. Zhao, Y. Miao, C. Zhou, L. P. Zhang, L. Z. Wu and T. Zhang, Adv. Mater., 2022, 34, e2207793 CrossRef PubMed.
- R. Shi, Z. Li, H. Yu, L. Shang, C. Zhou, G. I. N. Waterhouse, L. Z. Wu and T. Zhang, ChemSusChem, 2017, 10, 4650–4656 CrossRef CAS PubMed.
- H. Zhu, C. Zhen, X. Chen, S. Feng, B. Li, Y. Du, G. Liu and H. M. Cheng, Sci. Bull., 2022, 67, 2420–2427 CrossRef CAS PubMed.
- Z. Zhu, C.-T. Kao, B.-H. Tang, W.-C. Chang and R.-J. Wu, Ceram. Int., 2016, 42, 6749–6754 CrossRef CAS.
- M. Watanabe, S. Sun, T. Ishihara, T. Kamimura, M. Nishimura and F. Tani, ACS Appl. Energy Mater., 2018, 1, 6072–6081 CrossRef CAS.
- M. Polat, A. M. Soylu, D. A. Erdogan, H. Erguven, E. I. Vovk and E. Ozensoy, Catal. Today, 2015, 241, 25–32 CrossRef CAS.
- L. Zani, M. Melchionna, T. Montini and P. Fornasiero, J. Phys.: Energy, 2021, 3, e031001 Search PubMed.
- Y.-F. Chen, J.-F. Huang, M.-H. Shen, J.-M. Liu, L.-B. Huang, Y.-H. Zhong, S. Qin, J. Guo and C.-Y. Su, J. Mater. Chem. A, 2019, 7, 19852–19861 RSC.
- K. E. Lee, M. A. Gomez, S. Elouatik and G. P. Demopoulos, Langmuir, 2010, 26, 9575–9583 CrossRef CAS PubMed.
- S. Rej, S. M. H. Hejazi, Z. Badura, G. Zoppellaro, S. Kalytchuk, Š. Kment, P. Fornasiero and A. Naldoni, ACS Sustainable Chem. Eng., 2022, 10, 17286–17296 CrossRef CAS.
- J.-F. Huang, J.-M. Liu, L.-M. Xiao, Y.-H. Zhong, L. Liu, S. Qin, J. Guo and C.-Y. Su, J. Mater. Chem. A, 2019, 7, 2993–2999 RSC.
- Y.-H. Zhong, Y. Lei, J.-F. Huang, L.-M. Xiao, X.-L. Chen, T. Luo, S. Qin, J. Guo and J.-M. Liu, J. Mater. Chem. A, 2020, 8, 8883–8891 RSC.
- O. Bettucci, T. Skaltsas, M. Calamante, A. Dessì, M. Bartolini, A. Sinicropi, J. Filippi, G. Reginato, A. Mordini, P. Fornasiero and L. Zani, ACS Appl. Energy Mater., 2019, 2, 5600–5612 CrossRef CAS.
- Y.-F. Chen, L.-L. Tan, J.-M. Liu, S. Qin, Z.-Q. Xie, J.-F. Huang, Y.-W. Xu, L.-M. Xiao and C.-Y. Su, Appl. Catal., B, 2017, 206, 426–433 CrossRef CAS.
- J. D. Xiao, Q. Shang, Y. Xiong, Q. Zhang, Y. Luo, S. H. Yu and H. L. Jiang, Angew. Chem., Int. Ed., 2016, 55, 9389–9393 CrossRef CAS PubMed.
- M. Zhou, X. Zhong, D. Wei, K. Yang, Y. Chen, C. Jia and J. Li, Green Chem., 2022, 24, 2557–2566 RSC.
- S. Zhang, H. Ye, J. Hua Zhong and H. Tian, EnergyChem, 2019, 1, 100015 CrossRef.
Footnote |
| † Electronic supplementary information (ESI) available. See DOI: https://doi.org/10.1039/d3cc01696j |
| This journal is © The Royal Society of Chemistry 2023 |