
 Open Access Article
 This Open Access Article is licensed under a Creative Commons Attribution-Non Commercial 3.0 Unported Licence
Continuum vs. atomistic approaches to computational spectroscopy of solvated systems
Tommaso
Giovannini
 and
Chiara
Cappelli
*
and
Chiara
Cappelli
*
Scuola Normale Superiore, Piazza dei Cavalieri 7, 56126 Pisa, Italy. E-mail: chiara.cappelli@sns.it
First published on 19th April 2023
Abstract
Molecular spectral signals can be significantly altered by solvent effects. Among the many theoretical approaches to this problem, continuum and atomistic solvation models have emerged as the most effective for properly describing solvent effects on the spectroscopic signal. In this feature article, we review the continuum and atomistic descriptions as applied to the calculation of molecular spectra, by detailing the similarities and differences between the two approaches from the formal point of view and by analyzing their advantages and disadvantages from the computational point of view. Various spectral signals, of increasing complexity, are considered and illustrative examples, selected to exacerbate the differences between the two approaches, are discussed.
1. Introduction
The role of computational chemistry to assist experimental studies has grown substantially in the last decades. This is due to the increasing availability of user-friendly computational packages, which can be used also by non-specialists. Furthermore, the success of computational approaches follows the development of methods that can treat with considerable accuracy large, complex, and realistic chemical systems.1–5In parallel, computational spectroscopy, i.e. the calculation of spectral properties by means of computational methods, has become an invaluable tool in most fields of chemical research.6 In fact, thanks to the high level of accuracy that has been reached in the reproduction of experimental data in the condensed phase, it often provides a theoretical rationalization of many experimental findings, yielding truly synergistic investigations.7–9 In fact, although many algorithms of increasing accuracy have been proposed and tested for systems in the gas phase,10–12 the large majority of molecular spectra are routinely measured in the condensed phase, i.e. when chemical systems are dissolved in a solvent or other kinds of external environments (biological matrix, polymeric materials, crystal phase etc.). Indeed, molecular structure and response to external electromagnetic fields can be significantly altered by the environment, thus making the simulation for isolated systems mostly inappropriate for a reliable comparison with experimental findings.13–16
Effective theoretical modeling of spectroscopy in the condensed phase requires catching the physico-chemical features of the simultaneous interaction of a chemical system with the environment and the external radiation field.1,17–20 Since spectroscopy arises from the interaction between the molecule and the radiation, which is in general driven by the electronic component, reliable modeling needs to resort to Quantum-Mechanical (QM) descriptions. However, while such approaches may be feasible for small-to-medium molecules in the gas phase, for systems in the condensed phase a “brute-force” description, i.e. which treats all atoms at the QM level, is unfeasible due to the enormous number of degrees of freedom that would need to be taken into account. However, such a description would be useless in most cases; in fact, the electronic structure of the environment would be described, however it commonly does not drive the spectral signal of chemical systems in the condensed phase.21,22 In fact, it is universally recognized that molecular spectra are modified but not determined by the environment, and this is indeed an important concept, which lays the foundations for the spectroscopic identification of molecular structures.
Focused models1,13,19,23–25 are the most successful class of approaches to computational spectroscopy in the condensed phase. There, the focus is the target molecule (solute in case of solutions) and the key is the accurate modeling of molecule/environment interactions and their consequences on the molecular structure and properties.17,18,20,26 The intrinsic spectral properties of the environment are not modelled, which corresponds to assuming molecular properties to be local properties of the molecule, which can be modified but not determined by the presence of the environment.
The most renowned class of focused models belongs to the family of multiscale (multilayer) QM/classical approaches.23 The latter have had great success in modern chemical research because they can be effectively coupled with most QM descriptions, ranging from semi-empirical methods27,28 to Density Functional Theory (DFT) or Wavefunction Theory.29–32 Remarkably, there is no substantial increase in computational cost with respect to the corresponding QM calculation of the isolated molecule because the number of degrees of freedom to be treated at the QM level does not change. Also, the machinery of Quantum Chemistry can be exploited to obtain the desired spectral signals in the same way as they are calculated for isolated systems.17–19 In fact, additional environment-related terms are introduced in the molecular Hamiltonian, which results in extra terms appearing in the formulation of energy derivatives and response equations.19
The main difference among the various types of focused QM/classical models stays in the way the environment is modelled. Implicit (continuum) or explicit (atomistic) approaches have been proposed: the former is especially suited to treat solvents,13 whereas fully atomistic descriptions may treat all kinds of environments, pending suitable parametrizations.1,2,27,33,34 In continuum solvation approaches, the atomistic nature of the solvent is neglected and the solvent is modelled in terms of a continuum dielectric, featuring specific dielectric properties. The Polarizable Continuum Model (PCM),13 has been particularly successful in the context of the present paper, because it has been extended to a large variety of spectral signals and molecular properties.17,18 A clear bottleneck of the QM/PCM approach, and in general of all implicit approaches, is their severe limitation in describing specific and directional solute–solvent interactions, such as hydrogen bonding. To this end, explicit approaches have been developed, belonging to the family of QM/Molecular Mechanics (QM/MM) methods.1,19,23,35,36 There, the target molecule is still described at the QM level, but the environment (solvent) is treated by resorting to MM force fields. QM/MM fully atomistic descriptions are not gained for free: in fact, whereas continuum models include implicitly the statistical average of all possible solute–solvent configurations, QM/MM approaches require the explicit sampling of the solute–solvent phase space.1,37 However, they provide a dynamic description of the solvation phenomenon, which basic continuum formulations lack.
In this feature article, we discuss continuum and atomistic solvent descriptions as applied to the calculation of the molecular spectra. First, we detail similarities and differences between the two approaches from the formal point of view, followed by a discussion of the advantages and disadvantages of the two methods, also from the computational point of view. Then, we discuss how to specify the models to catch the physics of the solvated system and transfer it to the computation of various spectral signals, of increasing complexity. Finally, some specific examples are discussed, especially suited to illustrate the concepts highlighted in the theoretical discussion. Some conclusions end the manuscript.
2. Continuum vs. atomistic modeling of solvation
Historically, focused models derive from the approach first presented by Onsager in 1936.38 In this rather crude model, the solute is represented as a permanent point dipole with a given polarizability, and is placed at the center of a spherical cavity surrounded by the solvent, which is viewed as a continuum dielectric medium. In the absence of external fields, an electric field is originated, which directly depends on the polarization of the solvent as a response to the solute's permanent dipole. At the same time, the solvent back-polarizes the solute. This electric field is named “reaction field”, and it is a fundamental concept underneath all polarizable approaches, either explicit or implicit.13,39,40In modern implicit approaches, the solvent is still described in terms of a homogeneous polarizable continuum, featuring an electric permittivity constant ε.13,41,42 However, the simplistic approach proposed by Onsager is ameliorated in two directions. First, the solute is not approximated by a point-like dipole but is treated in terms of a quantum mechanical wavefunction/density. Second, the solute is accommodated in a molecular-shaped cavity, which is generally constructed in terms of interlocking spheres centered on each solute atom.43,44 The presence of the solute density polarizes the dielectric, yielding the formation of an apparent charge density on the cavity surface, which back-polarizes the solute, consistently with the concept of reaction field introduced by Onsager.13 The surface charge density is named apparent because it only exists in the presence of the solute; in the computational practice, it is discretized in a set of apparent surface charges (ASC), which are the solution of the Poisson equation with appropriate boundary conditions.45,46
The interaction between the solute and solvent is generally limited to electrostatics and mutual polarization terms; their inclusion into the QM/PCM Hamiltonian results in the remarkable feature that solvent-depend terms propagate to the calculation of molecular properties and spectroscopies through response equations/derivatives.17,18,47 Note that the limitation to electrostatic terms is a reasonably good approximation for polar solvents with large ε, however non-electrostatic (Pauli repulsion and dispersion) should also be considered, for instance by means of one of the methods which have been developed for this purpose.25,48–53
Clearly, in implicit models solvent molecules are not actually considered; thus, solute–solvent interactions, e.g. Hydrogen Bonding, are neglected. However, one of the most attractive aspects of continuum models is that their description can systematically be improved, for instance by including some (few) solvent molecules, in the so-called “cluster” or supermolecule models.54 Solvent molecules can be treated at the same QM level of the solute, or a lower level, for instance by resorting to ONIOM schemes.55 Clearly, in this way first-shell specific solute–solvent interactions can be described, however, it is not straightforward to define the number of solvent molecules to include, and especially their positions, i.e. how many configurations need to be considered to get reliable modeling.
A way to solve this problem, with additional advantages that will be discussed in the following presentation, consists of fully recovering the solvent atomistic nature and moving to explicit modeling, i.e. to QM/MM.35 There, the solute is described at the QM level, whereas the environment is described by resorting to MM force fields, therefore the problem shifts to the description of the interaction between the QM and MM portions. In this respect, different approximations have been proposed:35
• Mechanical embedding: the QM/MM coupling term is treated at the MM level only, therefore it is independent of the QM electronic density. The coupling is expressed in terms of dispersion–repulsion potentials (usually, the Lennard-Jones potential) and classical electrostatics. Thus, the contribution of the surrounding environment to the energy and properties of the QM portion is only indirect.
• Electrostatic embedding: MM atoms are endowed with fixed atomic charges, that produce an electric potential, which polarizes the QM electronic density. From the point of view of the QM solute, electrostatic embedding introduces a new term in the molecular Hamiltonian, that is the interaction between the potential generated by the MM fixed charges and the electron density. Dispersion – repulsion contributions are usually considered by resorting to classical potentials.
• Polarizable embedding: the mutual polarization between MM and QM portions is explicitly taken into account, thus recovering the concept of reaction field. Polarizable embedding work in such a way that the MM force field contains a response term, which modifies electrostatics due to the presence of the QM density. A polarization term is included in the QM Hamiltonian to represent the interaction between the electronic density and the MM portion. Also in this case, dispersion-repulsion contributions are treated in terms of classical potentials.
Among the several QM/Polarizable Embedding schemes that have been proposed in the literature,19,39,56–64 the most similar to the continuum approach, from the formal point of view, is the QM/Fluctuating Charge (QM/FQ) method,1,19,26 which was pioneered by Bryce et al.65 There, the environment is described by exploiting a set of charges, which vary as a response to the external potential due to both the other MM atoms and the QM portion. In parallel, FQs polarize the QM density, so that a mutual polarization is established. While the description of the environment in terms of electric charges directly recalls the continuum picture, in FQ the charge transfer between the atoms is governed by the electronegativity equalization principle,66 which states that, at the equilibrium, the electronegativity of all atoms needs to be the same. Therefore, while continuum approaches are entirely based on electrostatics, the FQ force field finds its theoretical foundations in conceptual density functional theory (CDFT).67 In fact, it is defined in terms of electronegativities and chemical hardnesses, i.e. energy first and second derivatives with respect to the number of particles, which are quantities well-defined in CDFT framework.
The formal similarity of the two approaches, and especially their formulation in terms of electric charges, make the way the energy and molecular properties are formulated very similar. For instance, by taking QM/PCM as an example of continuum solvation approaches, the interaction between the QM and classical portions is expressed as follows:
 | (1) |
 | (2) |
To end this section, it is worth highlighting that a three-layer approach, combining QM/FQ with an outer PCM (spherical) layer (QM/FQ/PCM), has been proposed and extended to the calculation of several spectral signals.15,70–72 In this case, extensive numerical testing has evidenced little effect of the PCM layer on computed properties/spectra.73,74 This is mainly due to the fact that in all applications a sufficiently large number of explicit solvent molecules around the solute have been considered. Thus the PCM layer simply results in a sort of confining potential, with only a scarce role in computed values.
Going beyond electrostatic approaches
As stated above, in QM/continuum and QM/atomistic approaches, solute–solvent interactions are generally limited to electrostatic (and polarization) forces. Although such an assumption may be justified for highly polar solvents, non-electrostatic terms (i.e. exchange–repulsion, or Pauli Repulsion and dispersion) should be considered to build up a physically consistent modeling.75,76 These terms, which are generally called van der Waals interactions, are particularly difficult for semi-classical descriptions. In fact, they originate from the quantum nature of the electrons (the Pauli principle, and density fluctuations), and thus have no correspondence in the classical world. A possible strategy is to resort to QM-based approaches, such as QM/Effective Fragment Potential (QM/EFP),77–79 which however does not belong to the family of QM/classical approaches because it relies on a preliminary full QM calculation on the different moieties constituting the external environment. Indeed, within the framework of QM/classical approaches, ad hoc models need to be defined. Some work in this direction has been done for both implicit and explicit modeling, especially for the description of the ground state.48,50,80–83 Extension of the models to computational spectroscopy has been only sporadic, although yielding very promising results (vide infra).84–873. How to translate the physics of the system into the modeling of spectral signals in solution
As explained in the previous paragraphs, continuum and atomistic solvation approaches conceptually differ in the way they describe solvent effects on solute's ground state and response properties. The most evident difference is that specific solute–solvent interactions are treated by atomistic descriptions, while they are substantially neglected in implicit models. However, the two modeling strategies have other diverse consequences on the way spectral signals are computed and on the peculiar physico-chemical features that are described.Conceptually, solvent effects can be categorized as follows:
• Direct effects: the introduction of a solvent-dependent term in the QM/classical Hamiltonian modifies the solute ground state and propagates to spectral properties because solvent contributions also appear in response equations, such as Coupled-Perturbed Hartree–Fock (CPHF) or Kohn–Sham (CPKS) equations, or in the formulation of analytical energy derivatives.19,26
• Indirect effects: the solvent modifies minimum geometry(ies). Also, it may change the population of conformers, or give rise to conformations that cannot be accessible in the gas-phase.
The specific formulation of direct effects, i.e. the resulting terms entering the equations to be solved, depends on the actual solvation model (either implicit or atomistic) and the QM level that is adopted to describe the solute. Generally, while highly correlated and/or multireference approaches can be fruitfully exploited to study electronic spectra, vibrational, vibronic, magnetic and mixed electric/magnetic spectroscopies are usually computed at the DFT level, which constitutes a good compromise between computational cost and accuracy.88
Indirect (geometrical/conformational) effects are instead treated by resorting to different strategies in the two families of methods. In implicit calculations, the minimum geometries are determined through geometry optimization on the solute's potential energy surface (PES) as redefined with the inclusion of solvent-depending terms in the Hamiltonian/energy. Also, the molecular cavity is re-adapted to the diverse geometries that correspond to minima, however the dynamics of the solvation phenomenon (i.e. the solvent geometrical rearrangement around the solute) is discarded, giving rise so a substantially “static” picture. Differently, atomistic descriptions require a full configurational sampling of the solute–solvent phase-space, which may be achieved by resorting to classical or ab initio molecular dynamics (MDs) simulations, Montecarlo sampling, and other advanced sampling techniques.89 In this way, the dynamics of the solvent around the solute and their mutual geometrical conformation are taken into account. Obviously, the description of indirect effects that results from implicit/explicit approaches might be drastically different. Generally, explicit models yield more realistic descriptions, especially in the case of strongly interacting solute–solvent couples, dominated for instance by hydrogen-bonding effects.
The account of indirect solvent effects on spectral properties has relevant consequences from the computational point of view. In fact, implicit approaches follow the same strategies as QM methods for gas phase systems: the calculation of the spectral property is performed on each minimum conformation and then averaged according to Boltzmann populations computed by including solvent effects in the evaluation of (free) energies. Therefore, the cost of the calculation basically stays the same as for isolated systems, if self-consistent-field (SCF) descriptions (HF or DFT) of the QM portion are exploited. A different approach is followed in atomistic simulations. First, limiting the evaluation of the spectral properties on a single structure for each solute conformer surrounded by the solvent placed at specific geometrical positions is unphysical, because realistically the solvent configurations around the solute need to be sampled. For this reason, the spectroscopic signal is calculated on a set of uncorrelated structures taken from the sampling, whose number is selected so as to ensure the convergence of the property. Therefore, while in implicit descriptions the number of calculations equals the number of conformers, atomistic treatments require to evaluate the property of a number of structures that may vary from a few tens to several thousand.7,15,40 As a consequence, the total computational cost of explicit modeling is roughly n times larger than the corresponding implicit description (where n is the number of snapshots). These two procedures also highlight an important conceptual difference between the two approaches: in atomistic modeling, the average over solute–solvent configurations is explicitly performed, whereas in implicit methods the average is intrinsically considered by the solvent permittivity constant, which is by itself an averaged quantity.
The measured spectrum is the result of the evolution in time of the solute density interacting with the external field, which oscillates within a specific frequency range (UV-Vis, IR, MHz ecc.). This range determines how the spectrum is actually computed at the various QM levels, i.e. the formalism and equations that need to be solved. However, the QM theoretical framework needs to be coupled with the solvent evolution in time under the effect of the probing field. In particular, the solvent may only partially follow the solute which evolves under the effect of the field, because some of the solvent degrees of freedom can follow or stay frozen depending on the timescale associated with the solute excitation.
Also, modifications in the external electromagnetic field caused by the presence of the solvent need to be considered. This concept dates back to the Onsager model,38 where the “local field” is first introduced. In that case, it can be analytically evaluated for both static and dynamic fields, in terms of permittivity constants. In modern implicit solvation schemes, the presence of a molecular-shaped cavity and the description of the solute at full QM level yield local field factors not only depending on the solvent dielectric properties but also on the solute, and the specific spectral bands.17,18,90–92 Local field effects have been specified to many response and spectral properties treated by means of implicit solvation models, notably improving the agreement between calculated and experimental values. Much less attention has been paid so far to the formulation of local field effects for atomistic solvation models.93,94
3.1 Electronic spectroscopy
The timescales associated with electronic phenomena are of the order of femtoseconds, thus it is reasonable to assume the solute's geometry stays frozen to the ground state – GS (i.e. the Frank–Condon approximation) and that the same holds for the solvent nuclear degrees of freedom. Therefore, only the solvent electronic degrees of freedom follow the solute excitation.13 This means that the system enters the so-called electronic nonequilibrium regime, which is a concept well grounded in implicit solvation, where it is assumed the solvent polarization separates into two parts: a “fast” term accounting for the electronic degrees of freedom of the solvent, which can instantaneously rearrange to the solute's time evolution, and a “slow” contribution, which accounts for the degrees of freedom which remain fixed to the GS, i.e. orientational and vibrational. The fast and slow components are represented by two distinct surface charge densities, which are computed using frequency-dependent (fast) or static (slow) dielectric constants.13,41,95–97Differently, in polarizable QM/MM approaches nonequilibrium is automatically described by readjusting the MM polarizable quantities (multiples) to the transition density (we specify here the discussion to TDHF/TDDFT).20,36,59,94,98 The other solvent degrees of freedom are kept frozen by fixing the geometry of the frames. Methods based on a combination of fixed multipoles and polarizable dipoles (such as Induced Dipoles and AMOEBA) have a clear correspondence with the implicit picture.56,62,63 In fact, the “fast” degrees of freedom are modeled in terms of polarizable dipoles, which are equilibrated to the transition density, whereas the fixed multipoles represent the “slow” degrees of freedom. These concepts are more subtle in the case of QM/FQ, where static and polarization contributions are calculated together. However, the static contribution can be seen as arising from differences in atomic electronegativities, while the polarization contribution is due to the chemical hardness, which enters the definition of the FQ matrix.20,99 It is also clear that since in electrostatic embedding the MM multipolar distribution is fixed and does not depend on the QM density, neither nonequilibrium nor direct contributions to response equations are described, thus yielding an unrealistic picture of the electronic excitation.20
As stated above, polarizable approaches introduce additional terms in the QM Hamiltonian. When extending the models to the treatment of absorption spectra, it comes out that state-specific and state-average pictures deriving from the linear response formalism in the SCF context, which in vacuo coincide, become different. Two complementary formalisms can be exploited,19,36,57,59,62,98,100–102 depending on which density the MM polarizable variables are adjusted to. In the linear response (LR) regime, they linearly respond to the transition density,98,103 while, in state-specific formulations,104–106 they are adjusted to the excited-state electronic density, for instance by resorting to a first-order correction (corrected linear response – cLR), which has been proposed for both implicit and explicit approaches.98,103
From the physical point of view, while in the LR regime dynamic solute–solvent interactions (similar to dispersion interactions) are described, cLR takes into account the relaxation of the solute density in a specific excited state. For this reason, the two formalisms can be seen as complementary and simultaneously considered, such as in the so-called cLR2 approach.34,107
The above discussion assumes the system to be in a nonequilibrium condition. However, once the solvent degrees of freedom fully relax to the solute's excited state electronic density, a novel equilibrium condition arises. This is only achievable if the excited state lifetime is long enough to allow solvent reorganization. Generally, the latter occurs on the order of picoseconds, i.e. it is slower than most excited state lifetimes. Solvent reorganization takes place in case of emission phenomena, such as fluorescence. In this case, the solute–solvent couple is at equilibrium in the excited state, and once vertical emission takes place a new nonequilibrium situation arises because the solvent slow degrees of freedom stay fixed to the excited state. In order to consistently describe this phenomenon, implicit approaches resort to geometry optimization (and cavity adjustment) in the excited state geometry.13 In discrete models, excited state equilibration is much more difficult to describe because the commonly exploited classical methods to sample the phase space are designed for the ground state. To solve this problem, excited state QM/MM MD simulations can be exploited, but their computational cost might become prohibitive. A pragmatical alternative implies the parametrization of classical force fields to properly describe the solute's excited state, however this topic has received so far only a little attention, so established protocols still need to be defined.108,109
3.2 Vibrational spectroscopy
Vibrational spectroscopic (i.e. Infrared Absorption and Raman scattering) are generally modelled by resorting to the double harmonic approximation, i.e. the PES is assumed to be harmonic and intensities are formulated in terms of first derivatives of the dipole moment with respect to normal mode coordinates. From the theoretical point of view, this means that first (gradients) and second energy derivatives (Hessian) with respect to nuclear coordinates need to be evaluated, by resorting to analytical or numerical algorithms. Analytical energy derivatives for implicit (PCM) approaches have been presented,110–112 by also considering a nonequilibrium response of the solvent to the molecular vibrations and the addition of local field effects in the calculation of IR or Raman intensities.113 Vibrational nonequilibrium effects are modelled similarly to electronic processes (see Section 3.1), however in this case the fast component of the solvent polarization adjusts to the electronic and vibrational solute's degrees of freedom. The molecular cavity is also kept fixed to the equilibrium geometry, so to further mimic a nonequilibrium solvation regime.113,114 Among polarizable QM/MM methods, QM/FQ is the most amply tested to calculate vibrational spectral signals, due to extensive work on the development of analytical derivative algorithms.69,70,73,74 Other polarizable approaches have been only recently extended to the evaluations of vibrational signals, however their performance has not been extensively tested yet.69,115Within the harmonic approximation, it is assumed that the molecule lies in the PES minimum, which within the focused approach is found by only optimizing the solute's geometry. This corresponds to assuming that the spectral signal is determined by the solute, and only modified by the environment. QM/MM geometries, which as already mentioned above, are obtained from a sampling of the solute–solvent phase-space, are not necessarily associated with energy minima. Consistently with the focused approach, QM/MM vibrational properties are computed by optimizing the solute geometry but keeping the structure of the environment fixed (i.e. the position of solvent molecules).73,74,116 From the theoretical point of view this procedure complies with the so-called Partial Hessian Vibrational Approach (PHVA),117 thus only the QM–QM portion of the Hessian matrix is retained, whereas the MM–QM, QM–MM, and MM–MM blocks are discarded.
From the computational point of view, simulating vibrational properties by using QM/MM approaches is more demanding as compared to implicit descriptions. This is mainly due to the fact that the geometries obtained from the sampling might be far from solute minima, and might require a large computational cost (in terms of the number of iterations) to converge. However, the QM/MM description of vibrational spectra that is achieved compares much better with experimental findings, especially in the case of aqueous solutions (vide infra).1 Notice also that attempts to reduce the computational cost associated with the calculation of the QM/MM Hessian have been recently proposed in different contexts (vibronic and Resonance Raman spectra),118,119 by projecting out the out-of-equilibrium normal modes, which are generally associated with the flexible dihedral angles. The selection of such modes is far from trivial, therefore it may strongly benefit from novel techniques to automatically select torsional modes.120
Finally, it is worth mentioning that specific spectral regions may be dominated by anharmonic effects.121 However, due to the large computational cost associated with anharmonic calculations, they are generally computed with implicit solvation approaches.122
3.3 Magnetic spectroscopy
The strategy that is followed to model magnetic spectroscopies in solution by means of implicit or explicit QM/MM approaches is similar to electronic spectroscopy.72,123 In fact, formally there is no need to compute spectra on energy minima, therefore while continuum calculations are performed on PES minima, QM/MM calculations may be performed on structures extracted from the GS sampling, and then averaged, without any further optimization. As for direct solvent effects, also in the case of magnetic perturbations, additional terms arising from the presence of the solvent, need to be considered. In this respect, the presence of a magnetic perturbation acting on a molecular system renders approximated method particularly difficult to be safely applied to the calculation of magnetic properties and spectra, for instance, NMR shieldings or Magnetic Circular Dichroism.72,123–125 This is not restricted to solvated systems, but of general occurrence, and is due to the fact that the magnetic field, and the associated magnetic vector potential, make the problem origin dependent.126 The Gauge Independent Atomic Orbitals (GIAOs) have been introduced to solve this problem.127 The extension of polarizable implicit or explicit models to magnetic perturbations requires introducing additional contributions as compared to electric perturbations, due to the use of GIAOs, as shown in ref. 72, 123 and 128. In addition, it is worth noting that the perturbed polarizable variables, in case of a magnetic perturbation, would be imaginary, similarly to the perturbed density. This is conceptually in contradiction with the semiclassical nature of QM/classical models, therefore such variables are not considered in theoretical formulations. Similarly, in the calculation of NMR shieldings explicit polarizable classical contributions are not included, thus their dependence on the nuclear magnetic moment is not considered. Also, the external magnetic field is formally static, then oscillations in the solvent electronic density (i.e. nonequilibrium effects) are not included in any description, whereas, as usual, solvent fluctuations are introduced in atomistic approaches.It is also worth remarking that in either QM/continuum or QM/atomistic descriptions, the interaction between the QM and the classical portion is retained as purely electrostatic (see also eqn (1) and (2)). Non-electrostatic interactions (exchange, repulsion, dispersion) are generally discarded. However, while this assumption is reasonable for electric perturbations, it is much less justified for magnetic perturbations, where density fluctuation and confinement may play a relevant role up to generate induced densities in the environment. To the best of our knowledge, such effects have only marginally been taken into account in QM/classical approaches. As for QM/FQ, it has recently been challenged to describe EPR hyperfine coupling constants with the inclusion of no-electrostatic solute–solvent interactions,83 however full extension to magnetic properties and extensive testing are still missing.
3.4 Mixed electronic/vibrational/magnetic spectroscopy
The last class of spectroscopies that we treat in this perspective arises from the combination of electronic/vibrational degrees of freedom and electric/or magnetic spectral responses. From the theoretical point of view, these are intrinsically more complex, because involve various degrees of freedom at the same time, each of them associated with a specific time-scale that needs to be coherently coupled to the solvent's time and spatial evolution. To further explain this concept, we take as an example Resonance Raman (RR) spectroscopy.129 There, differently from far-from-resonance Raman spectra, the external laser frequency coincides with a solute electronic excitation band, thus yielding a substantial enhancement of selected vibrational modes. The peculiar nature of RR, which is formally a mixed vibrational–electronic property, calls for care when coupled to solvent time evolution. Only a few works have attempted a systematic approach to describe this phenomenon at the QM/PCM level properly.130–133 Only recently, the polarizable QM/FQ approach has been extended to this property.8,134,135RR signals and the environment are so tightly connected that RR is often exploited to evaluate solvent reorganization energies following electronic transitions.136 The presence of the solvent influences the positions of the peaks, which are related to modifications in vibrational energies, which in turn follow from changes in the PES. Therefore, reliable computational protocols need to be able to model at the same time and with similar accuracy the effects of the solvent on electronic transition energies, geometries, frequencies, and vibrational wave functions. Clearly, this means that solvent terms enter the calculation of the molecular electronic wave function, and alter the solute PES, i.e. equilibrium geometries, vibrational frequencies, and normal modes. Also, solvent terms need to be included in the evaluation of the excited state properties which are required to evaluate RR spectral intensities, i.e., transition dipole moments, excited state forces, and possibly Hessian, depending on the theoretical level which is exploited to describe RR signals.131
Within the implicit solvation framework, the nature of RR as a mixed vibrational–electronic spectroscopy calls for care when considering the solvent time evolution, in order to correctly account for the dynamical aspects of the solute–solvent interaction. The RR polarizability, which rules spectral intensities, originates from the time evolution of a vibrational wave packet on the excited state PES. Depending on the time scale of such an evolution, some of the solvent's nuclear degrees of freedom may remain static. A possible way to simulate this regime with implicit modeling in an approximate way (see ref. 137 for more details) consists of keeping the molecular cavity fixed to the solute GS equilibrium geometry and model normal models and frequencies within the vibrational nonequilibrium regime. The (electronic) nonequilibrium excitation energy derivative is then computed by also keeping the cavity fixed. Generally speaking, univocal assessment of the correct (nuclear + electronic) solvation regime in modeling RR spectra is not straightforward. Different combinations have been tested in ref. 137 leading to considerable differences in computed spectra. In addition, the solute–solvent interaction term acting on the RR polarizability is modeled by considering a dephasing term that can no longer be attributed solely to the finite lifetime of the molecular excited electronic state but should take into account the experimental conditions.137 The above discussion should have highlighted the complexity of RR signals, and their consequences on the computational approach. Clearly, in order to properly simulate RR of solvated systems by means of an explicit (polarizable) QM/MM approach, the latter needs to be able to tackle at the same time and with the same level of accuracy, the GS electronic and vibrational degrees of freedom of the system, as well as its excited states. Remarkably, QM/FQ has such features, therefore it has recently been successfully applied to the calculation of RR.8,134,135 Due to the full atomistic nature of the model, nonequilibrium effects are automatically considered by the computational protocol, in line with what has been discussed in Section 3.1 for electronic spectra.
Chiroptical spectroscopies are another fascinating class of mixed electric, magnetic and/or vibrational responses.138 Examples are Electronic Circular Dichroism (ECD), Optical Rotation (OR), Vibrational Circular Dichroism (VCD) and Raman Optical Activity (ROA).138–140 These kinds of spectroscopies are generally exploited to assign the absolute configuration of chiral molecules, especially molecular drugs, and for this purpose need to be assisted by molecular simulations.26,141,142 The effect of the solvent on the measured signal can be drastic, i.e. the solvent can even change the sign of the measured properties or the sign of specific bands with respect to simulations for the isolated systems.26,72 Such complexity comes together with the complexity of the signals to be simulated, which require the simultaneous consideration of electronic and magnetic perturbations, further coupled to geometrical perturbations for VCD/ROA.139 Also, all perturbations need to be treated at the same level of accuracy, to avoid unphysical descriptions. While QM/PCM has been extended to the analytical evaluation of all aforementioned chiroptical properties and spectroscopies,143–145 to the best of our knowledge QM/FQ is the only polarizable QM/MM method able to treat all these signals, remarkably through analytical algorithms.19,73,74,116
The strategy to model chiral spectra derives from the nature of the spectral signal. In fact, in the case of ECD, the theoretical framework does not require the calculation of spectra on energy minima, therefore the same strategy followed for purely electronic or magnetic spectroscopies can be exploited.91,146 This again means that continuum calculations are generally performed on GS PES minima, whereas QM/MM ECD calculations may be performed on structures extracted from the GS sampling without any further optimization.147,148 As for direct solvent effects, additional terms arising from the presence of the solvent need to be considered in the calculation of the response tensors to the presence of the external circularly polarized light, by simultaneously taking into account the electric and magnetic components. Also, the description of solvent nonequilibrium is the same as electronic absorption spectroscopy, then follows the same strategies discussed in Section 3.1.91
Moving to VCD or ROA, the spectral signal arises from the interaction of the polarized light (electric and magnetic components) with the vibrational degrees of freedom of the molecule, which lies on the GS. Therefore, the same consideration as IR and Raman spectra hold. Then, to comply with the harmonic approximation, it is necessary for the calculations to be performed on PES minima. Reaction and local field effects need also to be included in the calculation of QM/PCM VCD and ROA tensors, as well as a proper description of solvent vibrational nonequilibrium effects, similar to what is discussed in Section 3.2.73,116,144,145
4. Illustrating the concepts
In the following, the performance of both implicit and explicit approaches is illustrated for the various spectral signals discussed above. We have selected specific cases in which the differences between the two approaches are particularly marked. Most reported values refer to aqueous solutions, which among the many characteristics that make them unique, feature strong solute–solvent interactions through hydrogen bonding.Before deepening the discussion of the selected examples, it is worth pointing out that continuum solvation models are nowadays available in most quantum chemistry software, both commercial and open-source, so that various kinds of spectra can be computed in a plethora of solvents. Open-source libraries, such as PCMSolver,149 are also freely available and interfaced with many codes. Unfortunately, the same does not hold for polarizable QM/MM approaches, which are only sporadically included in quantum chemistry codes or in open-source libraries.150 Most implementations, however, are limited to a single specific force field, thus limiting wide applicability. A remarkable exception is ADF151,152 which is part of the Amsterdam Modeling Suite (AMS),153 where three different polarizable force fields, either based on FQ or induced dipoles63 are available and extended to several kinds of spectra, thus allowing for a consistent comparison between the various approaches.40 Also, the current implementation in ADF, and the related graphical interface, guide the user along the whole computational protocol which needs to be followed to perform (polarizable) QM/MM spectral calculations.154
4.1 UV-Vis absorption and emission spectra
As the first example to illustrate the modeling of UV-Vis absorption spectra of solvated systems, we select betaine (BET, see Fig. 1a)), which features large solvatochromic shifts when dissolved in different solvents and has been used to develop the popular Reichardt's polarity scale based on ET(30).155 Thanks to its peculiar electronic properties, BET is an ideal playground to quantitatively and qualitatively appreciate the differences between explicit and implicit solvent descriptions. | ||
| Fig. 1 (a) Graphical depiction of BET HOMO and LUMO in aqueous solution. (b) Experimental and computed QM/PCM, QM/EE, QM/FQ absorption energies as a function of solvent polarity ϕ. (c) Experimental and computed QM/PCM, QM/EE, QM/FQ solvatochromic shifts with respect to the in vacuo absorption (experimental: 1.66 eV; computed: 1.18 eV). QM level: CAM-B3LYP/6-31+G*. Figure reproduced from ref. 34. | ||
In ref. 34, BET absorption spectrum has been computed at the QM/PCM, QM/EE and QM/FQ levels of theory, as dissolved in dioxane (DIO, polarity index ϕ = 0.164), acetonitrile (ACN, ϕ = 0.460), methanol (MET, ϕ = 0.762) and water (WTR, ϕ = 1.000). The solvent polarity scale ϕ is defined in terms of the solvatochromic shift exhibited by BET lowest π → π* electronic excitation, which has a charge-transfer character (see Fig. 1a). In Fig. 1b, computed and experimental156,157 absorption energies as a function of the solvent polarity are graphically depicted. Among the tested computational approaches, the polarizable atomistic QM/FQ is the only one that is able to reproduce the experimental behavior, while both the non-polarizable QM/EE and the implicit QM/PCM values flatten out as the solvent polarity increases. The differences between the tested methods can be further appreciated by comparing solvatochromic shifts, i.e. the differences between the absorption maxima in solution and in gas-phase (see Fig. 1c). First, we note that QM/PCM cannot correctly reproduce the experimental solvatochromic shifts for the most polar and protic solvents. The non-polarizable QM/EE, instead, gives values that are in very good agreement with the reference data, in particular for DIO, ACN and MET. The polarizable QM/FQ approach predicts solvatochromic shifts which are generally larger than experiments. However, it is worth noting that all approaches limit the QM-classical interaction to purely electrostatic forces. However, solute–solvent Pauli repulsion can play a relevant role, providing quantum confinement in the electronic density. For instance, if these effects are taken into account (for instance by using the approach developed by the authors in ref. 80), for aqueous BET the estimated error moves from 0.46 eV to 0.1 eV, overall reducing computed solvatochromic shifts. Therefore, the QM/EE good performance reported above is probably caused by error cancellation, due to the fact that both Pauli repulsion and solute–solvent polarization effects are neglected. Notice that very good agreement between computed and experimental values is also reported by the polarizable method exploited in ref. 62, which is based on a multipolar expansion of the QM/MM interaction.
Similar outcomes result from the study of the n → π* transition of pyrimidine (see Fig. 2a), which is a rather rigid molecule.98,158–161 In this case, the values are averaged over 200 snapshots that have been extracted from MD simulations where pyrimidine is kept fixed to the QM/PCM optimized geometry. In this case, we focus simply on vacuo-to-water solvatochromic shifts, as computed by using purely implicit QM/PCM or explicit polarizable QM/FQ and non-polarizable QM/EE approaches. From the inspection of Fig. 2b, it is clear that while QM/PCM cannot reproduce the experimental reference values, QM/EE apparently yields solvatochromic shifts in agreement with experiments. Similarly to the previous case, the polarizable QM/FQ, instead, overestimates, in absolute value, the experimental solvatochromic shift. However, an almost perfect agreement is obtained if Pauli repulsion effects are included. Indeed, quantum confinement has a drastic effect on calculated solvatochromic shifts, affecting the data by about 30/40% on average.
 | ||
| Fig. 2 Pyrimidine experimental and computed QM/PCM, QM/EE and QM/FQ vacuo-to-water solvatochromic shifts. For QM/MM, the results obtained by including solute–solvent Pauli repulsion are also given (+Rep). Reference gas-phase vertical excitation energies: 4.17 eV (calculated); 4.18 ± 0.01 eV (experimental). The red shadowed region indicates the experimental error bar. QM level: M06/6-311+G(2df,2p). | ||
It is worth remarking that a systematic study on the computational prediction of vacuo-to-water solvatochromic shifts by exploiting both non-polarizable QM/EE, and polarizable QM/FQ, QM/FQFμ, QM/DRF (fixed charges and induced dipoles in the MM portion) has recently been proposed.40 The results reveal that none of the approaches outperform the others and that errors strongly depend on the nature of the molecular transition to be described, thus highlighting that the description of solvatochromic shifts is indeed a delicate task.
To conclude the discussion on electronic spectra, we focus on the fluorescence spectrum of acetone in an aqueous solution, which is an illustrative example of the complexity associated with emission phenomena. Although acetone is a rather small molecule, in aqueous solution it undergoes a geometrical distortion in its first excited state geometry (see Fig. 3), which is associated with a n → π* transition. In fact, while in the ground state, the improper dihedral angle δ oscillates around 0 degrees, in the excited state, the geometry is distorted and δ oscillates between ±20 degrees. Therefore, to properly predict the fluorescence spectrum of aqueous acetone, the solute–solvent phase-space in the excited state needs to be accurately sampled. To this end, classical MD simulations can be exploited, however they need to be based on force fields that are suitably refined to reproduce ES energies, gradients, and Hessian, together with a correct accounting for changes in the solute electronic density.
 | ||
| Fig. 3 Experimental and computed QM/PCM, QM/FQ and QM/FQ + rep emission vacuo-to-water solvatochromic shifts for acetone in aqueous solution (see also ref. 108). QM level: CAM-B3LYP/aug-cc-pVDZ. | ||
The emission solvatochromic shifts associated with the π* → n transition of acetone in aqueous solution as calculated at the QM/PCM and QM/FQ levels are graphically reported in Fig. 3. QM/FQ values are obtained by averaging over a set of uncorrelated snapshots extracted from classical MD simulations. Effects of Pauli repulsion contributions are also considered for QM/FQ (+Rep) again by means of the method proposed by the authors in ref. 80. Indeed, repulsive interactions affect the averaged QM/FQ emission energy, thus yielding a final computed shift of about ∼−0.01 eV. This value is in almost perfect agreement with the experimental shift (see Fig. 3), showing that QM/FQ + rep is the only method that can model the experimental negative solvatochromic shift. Remarkably, a positive shift is reported instead by both QM/FQ and QM/PCM.
4.2 Infrared absorption and Raman spectra
To showcase the performance of polarizable implicit vs. explicit solvation modeling on vibrational spectroscopy, we focus on the IR spectrum of gallic acid in aqueous solution (see Fig. 4). In this case, the description provided by QM/FQ is further refined by including an additional polarization source defined in terms of fluctuating dipoles (Fμ). The resulting method is called QM/FQFμ.68 As discussed above, QM/FQ(Fμ) spectra are obtained by averaging the results over a set of uncorrelated snapshots extracted from classical MD simulations (in this case 200 snapshots).69 Raw data extracted from QM/PCM, QM/FQ and QM/FQFμ calculations on each snapshot are reported as sticks (grey lines) in Fig. 4. Final spectra are generated by convoluting each stick with a Lorentzian band shape (full with at half maximum – FWHM of 10 or 4 cm−1 for QM/PCM and QM/MM spectra, respectively). Both atomistic approaches can estimate band inhomogeneous broadening, which arises from the large variability in both stick frequencies and intensities. Remarkably, this results from the dynamic picture of the solvation phenomenon which is modelled by these methods when combined with the explicit sampling of the phase-space, achieved in this case by means of MD simulations. Differently, in the static QM/PCM approach band broadening is only artificially added, and it is homogeneous by definition. In fact, each peak visible in the final spectrum is due to a specific vibrational normal mode of the solute. | ||
| Fig. 4 Experimental162 and calculated QM/PCM, QM/FQ and QM/FQFμ IR spectra of gallic acid in aqueous solution (QM/PCM FWHM = 10 cm−1; QM/MM FWHM = 4 cm−1). QM/PCM, QM/FQ and QM/FQFμ stick spectra are also depicted as grey lines. QM level: B3LYP/6-311++G**. | ||
The quality of the reproduction of experimental data163 is also different for the two approaches. In fact, the experimental spectrum is characterized by three bands in the region 1200–1500 cm−1, which involve a combination of different normal modes, and by the presence of a well-separated peak at 1000 cm−1 (C–OH bending) and three low-in-intensity bands (1500–1800 cm−1), that are associated to composite C–OH bending modes of the hydroxyl groups and the acidic C![[double bond, length as m-dash]](https://www.rsc.org/images/entities/char_e001.gif) O stretching. While the general features of the experimental spectrum are generally reproduced by all solvation models, the intensity of the band at about 1350 cm−1 (the most intense in the experimental spectrum) is correctly predicted only by QM/FQFμ. Remarkably, it is interesting to note that as it is reported in ref. 162, the intensity of this peak is correctly reproduced by exploiting a supermolecule approach, where 8 water molecules are included in the QM region in QM/PCM calculations. Therefore, specific and non-electrostatic interactions probably play a substantial role in this spectral region, therefore purely electrostatic approaches, such as QM/PCM, QM/FQ and QM/FQFμ cannot perfectly reproduce the experimental findings. Finally, the inhomogeneous band broadening that is predicted by both atomistic approaches is in very good agreement with the experimental data, in particular for the patterns in the spectral region between 1200 and 1400 cm−1.
O stretching. While the general features of the experimental spectrum are generally reproduced by all solvation models, the intensity of the band at about 1350 cm−1 (the most intense in the experimental spectrum) is correctly predicted only by QM/FQFμ. Remarkably, it is interesting to note that as it is reported in ref. 162, the intensity of this peak is correctly reproduced by exploiting a supermolecule approach, where 8 water molecules are included in the QM region in QM/PCM calculations. Therefore, specific and non-electrostatic interactions probably play a substantial role in this spectral region, therefore purely electrostatic approaches, such as QM/PCM, QM/FQ and QM/FQFμ cannot perfectly reproduce the experimental findings. Finally, the inhomogeneous band broadening that is predicted by both atomistic approaches is in very good agreement with the experimental data, in particular for the patterns in the spectral region between 1200 and 1400 cm−1.
As an additional example, we move to the vibrational absorption spectrum of methyl-lactate (MLac) in aqueous solution.74 QM/PCM predict three main conformations (see red dots in Fig. 5b),74,164 as a consequence of the flexibility of the dihedral angles δ1 and δ2 (see Fig. 5a). A completely different conformational distribution arises from MD simulations (see Fig. 5b). In fact, MLac tends to cluster around a conformer, which is however absent in the QM/PCM conformational analysis. Such a difference is due to the formation of hydrogen bonding interactions between MLac and water in MD simulation, whereas QM/PCM structures are mainly characterized by intra-molecular hydrogen bonding, due to the absence of explicit solvent molecules in the PCM description. The resulting MLac IR and Raman spectra can be compared with the experiments. By first considering the IR spectrum (Fig. 5c, we note that QM/PCM and QM/FQ yield a completely different description of band relative intensities and broadening. The region between 1200–1300 cm−1, which involves OH group vibrational motions, is almost perfectly reproduced by QM/FQ. On the contrary, the QM/PCM spectrum is characterized by an intensity pattern that disagrees with the experimental spectrum. Similar findings also apply to the Raman spectrum (see Fig. 5d), for which QM/PCM and QM/FQ predict different relative intensity patterns, especially in the region between 1200–1300 cm−1. This confirms once more the benefit of atomistic descriptions of the environment.
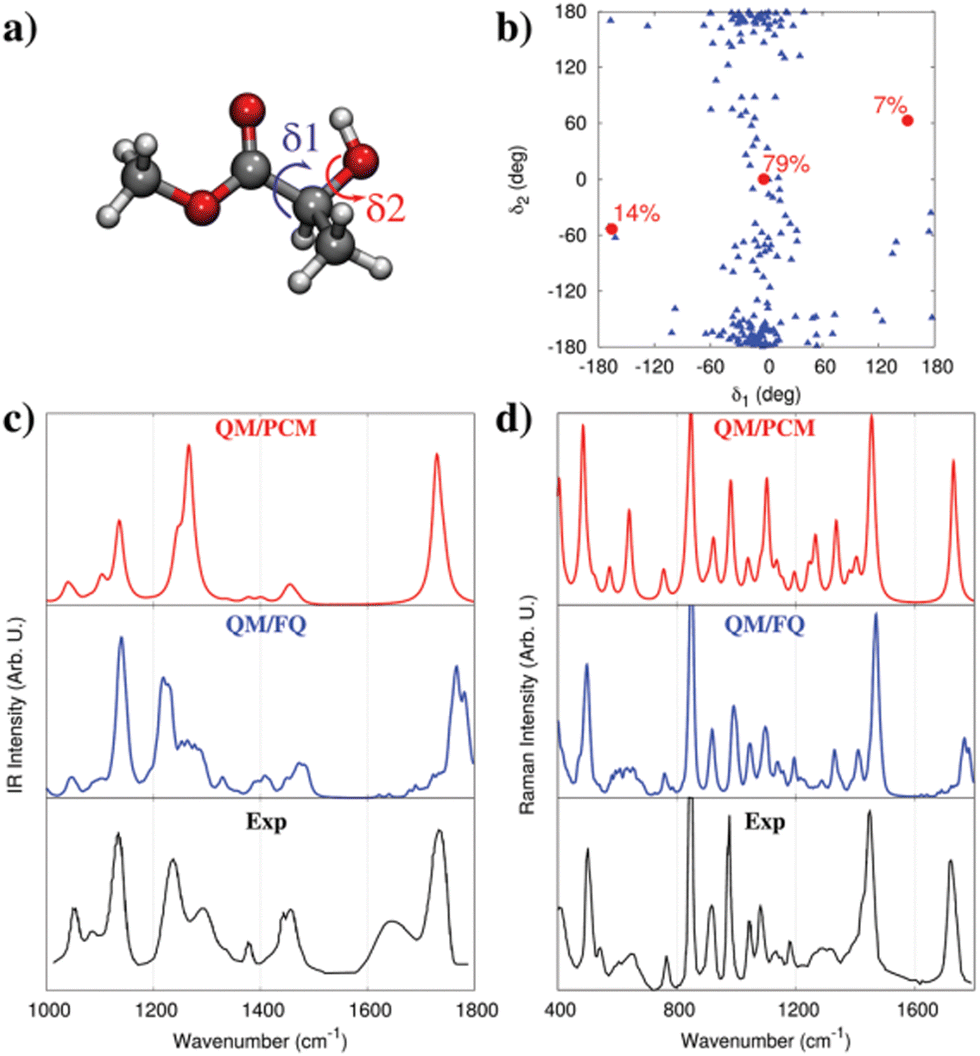 | ||
| Fig. 5 (a) MLac molecular structure. δ1 and δ2 dihedral angles are also highlighted. (b) MD population map as a function of δ1 and δ2 (blue triangles). The three QM/PCM conformations (red circles) and their populations are also given. (c and d) Experimental164,165 and computed QM/PCM and QM/FQ IR (c) and Raman (d, 488 nm) spectra of aqueous MLac (see also ref. 74). QM level: B3LYP/aug-cc-pVDZ. Figure is reproduced from ref. 1. | ||
4.3 NMR shieldings
To show the different descriptions of solvent effects on magnetic properties provided by implicit and explicit models, we select the NMR shieldings of pyrimidine as dissolved in aqueous solution.72,166 For this particular system, it has been shown that a minimal model of solvation, constituted by the molecule and two H-bonded water molecules, provides similar results to that obtained by using a dynamical sampling by means of a classical MD simulation.72 It is worth noting that this is not generally true, and indeed a static minimal picture provided by a cluster approach generally fails at reproducing solvent effects.1 The minimal structure, belonging to the C2v point group, exploited in ref. 72 is reported in Fig. 6a. NMR shieldings are calculated by describing the solvent at the PCM level (QM/PCM), or by treating the two H-bonded water molecules either at the full QM level (QM/QMw) or classically, by means of FQ (QM/FQ). In the resulting cluster model, long-range effects have also been considered by surrounding the minimal system with a third PCM layer (QM/QMw/PCM and QM/FQ/PCM). | ||
| Fig. 6 Computed QM/PCM, QM/FQ/PCM, and QM/QMw/PCM solvent-induced shifts on chemical shifts (ppm) for pyrimidine in aqueous solutions.72 Values for hydrogen (a) and heavy (b) atoms are shown (only non-equivalent atoms are considered). Chemical shifts are computed on the minimal cluster depicted in panel (a). QM level: B3LYP/6-311+ +G(2df,2pd) | ||
Among the different representations of solvent effects, QM/QMw/PCM can be considered the most accurate and can be taken as a reference, because all interactions between the solute and the two water molecules are retained at the QM level. To quantitatively evaluate solvent effects, solvent-induced shifts as compared to gas-phase results are analyzed and graphically depicted in Fig. 6a and b for hydrogen and heavy atoms, respectively. While solvent has a minor impact on both hydrogen and carbon atoms, it increases the shielding of the nitrogen atom by about 30%. This is not surprising considering that the two explicit water molecules are hydrogen bonded to pyrimidine through the nitrogen atom. Also, QM/FQ/PCM behaves particularly well as compared to the QM/QMw/PCM reference, reporting a root mean square error (RMS) of just 0.4 ppm. Differently, QM/PCM predicts an RMS of 15.2 ppm. Such an error primarily arises from the wrong prediction of the NMR shielding for nitrogen atoms (Fig. 6b), which are instead almost perfectly described by QM/FQ/PCM (the deviation is of just 0.3 ppm). Such findings confirm the benefit of atomistic descriptions to accurately describe hydrogen-bonded systems. To end the discussion, computed solvent shifts can be compared to experimental data. Notice that experimental reference data for calculating solvent shifts are reported for a cyclohexane solution (i.e. not for the isolated molecule), which can be reasonably described by means of QM/PCM,166 due to the absence of strong/specific solute–solvent interactions. The agreement with the experimental value reported in ref. 167 for nitrogen (16.84 ppm) is particularly good (12.73 ppm), especially considering that in our modeling solute–solvent interactions are limited to the electrostatic component, while, as explained in Section 3.3, non-electrostatic forces are expected to play a relevant role in magnetic properties.
4.4 Resonance Raman spectroscopy
As stated in Section 3.4, Resonance Raman (RR) spectroscopy is among the most sensitive to the solvent. As a representative case study, we select N-methyl acetamide (NMA), which is often exploited as a prototype model for the peptide bond (see Fig. 7). First, we focus our attention on the Raman spectrum in the far-from-resonance regime, i.e. the one which is measured by irradiating the sample at a wavelength that is far from the solute's electronic transitions (633 nm in this case). QM/PCM and QM/FQ spectra are reported in Fig. 7a, together with experimental data. The most significant patterns in the experimental spectrum are the amide I (1626–1646 cm−1), amide II (1566–1584 cm−1), and amide III (1313 cm−1)168 bands. Both QM/PCM and QM/FQ reproduce well the experimental trends, with QM/FQ slightly improving QM/PCM results, especially for the strong amide bands. Also, all QM/FQ bands are generally broader than QM/PCM ones, due to the dispersion in both vibrational energies and intensities, which is obtained as a result of the combination of QM/FQ with classical MD simulations to sample the phase-space. QM/PCM, QM/FQ, and experimental RR spectra of aqueous NMA are reported in Fig. 7b. It is worth noting that the experimental wavelength (226 nm) differs from that exploited in the calculations, because the latter needs to reproduce the experimental conditions in order to have the same resonance enhancement, i.e. needs to be close to a computed electronic transition. The comparison between RR and far-from-resonance Raman spectra (see Fig. 7a and b) shows significant differences. In fact, the Amide I (CO) stretching vibration (1626–1646 cm−1) is weaker, the signal involving the Amide II C–N stretching (1566–1584 cm−1) is enhanced, as also the CH3 umbrella bending (1380 cm−1) band. In addition, the Amide III band (1313 cm−1) gains intensity with respect to Amide I.169–171 All the aforementioned spectral features are correctly reproduced by QM/FQ, for which the computed spectrum almost perfectly resembles the experiment. A completely different situation results from QM/PCM calculations. In fact, the Amide I band is the strongest in the QM/PCM spectrum. Also, the methyl modes (peak erroneously emerging at 1440 cm−1) are enhanced. Such findings also reveal that QM/FQ is notably able to account for the almost threefold enhancement of Amide II with respect to Amide I band, which is experimentally measured. The discrepancies between QM/PCM and experimental spectra, together with the almost perfect agreement provided by QM/FQ, clearly demonstrate the importance of specific solute–solvent interactions, coupled with a physically consistent treatment of polarization effects.
 | ||
| Fig. 7 Experimental and computed QM/PCM, QM/FQ Raman (a) and Resonance Raman (b) spectra of NMA dissolved in aqueous solution. QM level: B3LYP/aug-cc-pVDZ. Figure is adapted from ref. 8. | ||
4.5 Chiroptical properties and spectroscopies
Chiroptical properties and spectroscopies are another class of signals which are particularly sensitive to the external environment.172 One of the most famous examples is the optical rotation (OR) of (R)-methyloxirane (MOXY), which changes sign by moving from the gas phase to the aqueous solution.173 This has a dramatic consequence: comparison between experimental values and theoretical models which cannot predict the correct sign would result in the wrong assignment of the absolute configuration. This is the case of QM/PCM, which indeed provides a computed sign for aqueous MOXY which is incorrect (see Fig. 8b). The correct sign is described by QM/FQ/PCM, in which an outer third PCM layer is included (at a distance 13.5 Å from MOXY). Indeed, the absolute value of the electronic contribution to OR is underestimated if compared to the experimental value. Due to the high computational cost associated with the calculation of vibrational contributions to OR within a QM/MM scheme, they can be approximated by taking the QM/PCM values (with vibrational nonequilibrium effects) as a ref. 15. When they are included in the average value, not only a qualitative but also a quantitative agreement with the experimental value is achieved.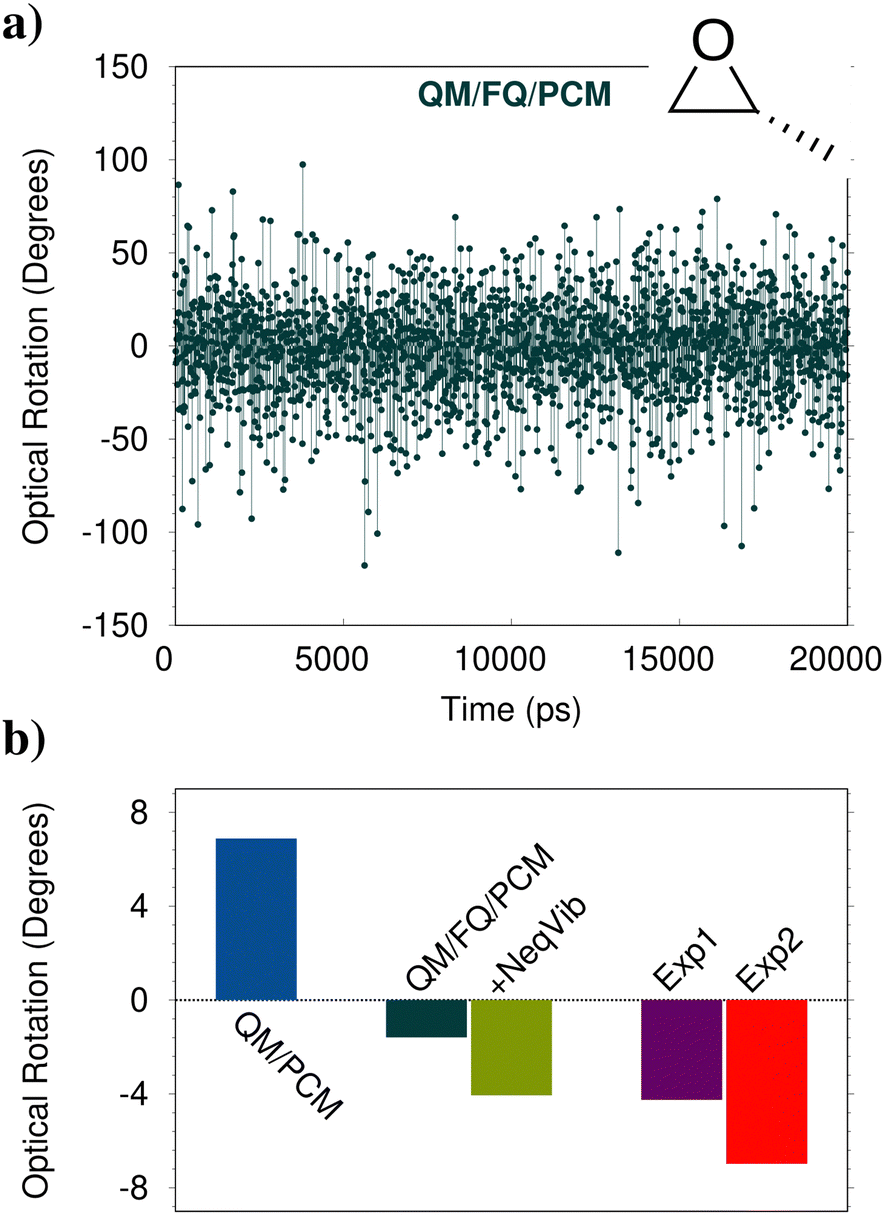 | ||
| Fig. 8 (a) Computed QM/FQ/PCM OR (589 nm) for aqueous (R)-MOXY as a function of time (MD snapshot). (b) Computed QM/PCM and average QM/FQ/PCM OR at 589 nm of aqueous (R)-MOXY. Vibrational corrections computed at the QM/PCM level with the inclusion of vibrational nonequilibrium effects are also added to QM/FQ/PCM results (+NeqVib). Experimental data reproduced from ref. 175 (Exp1) and ref. 173 (Exp2) are also reported. | ||
The final QM/FQ/PCM value is obtained by averaging computed values on a number of snapshots extracted from MD simulations. Differently from the spectral properties mentioned in the previous sections, where a few hundred snapshots guarantee the convergence of the average property, for OR 2000 frames are necessary, thus clearly increasing the computational cost as compared to the static QM/PCM calculation, which only requires a single calculation (R-MOXY features only a single minimum conformation in the PCM PES). The above discussion clearly highlights the complexity of modeling OR, especially when the solute is dissolved in strongly interacting environments, such as aqueous solutions. This can be further appreciated by observing the QM/FQ raw data associated with OR calculations on the single snapshots extracted from the MD simulation (see Fig. 8a). It is evident that not only does the magnitude of the computed OR vary as a function of the considered frame (oscillating between 100 and −100 degrees, while the average falls around −1.2 degrees), but also the sign. The success of the atomistic QM/FQ/PCM approach is the result of the accurate modeling of the physico-chemical features which dominate this property, which are in this case hydrogen bonding interactions and dynamic solvation effects. Similar findings have been reported in ref. 174, where the closest water molecules are included in the QM region, at a much larger computational cost.
To further demonstrate how sensitive chiroptical spectroscopies are to the external environment, we report the case of the Vibrational Circular Dichroism (VCD) spectrum of zwitterionic (L)-alanine (ALA) in aqueous solution.116,176 As stated above, VCD is the chiral analogous of the IR spectrum and is obtained by irradiating the sample with left and right circularly polarized light; the spectrum results from the difference between the absorption of the two radiations in the infrared region.140 Alanine experimental VCD spectrum is characterized by a significant (+, −, +) pattern in the region between 1250 and 1450 cm−1. The three bands are associated to normal modes which involve the symmetric stretching of the CO2− group and the orthogonal methine CH bending mode. QM/FQ/PCM rotational strengths calculated for each snapshot are reported in Fig. 9, middle panel: a very large variability, in both sign and magnitude, is clearly reported, in line with what has been commented above for MOXY OR. This highlights once more the difficulties related to the prediction of chiroptical spectra of systems embedded in aqueous solution. Similar to the gallic acid IR spectrum, also in this case QM/PCM features much poorer spectral details (see Fig. 9, top panel).
 | ||
| Fig. 9 QM/PCM (blue), QM/FQ/PCM (dark green) and experimental (red)176 VCD spectra of aqueous (L)-alanine. QM/PCM and QM/FQ/PCM raw spectra are also plotted as grey lines. QM level: B3LYP/6-311++G**. | ||
As a result, the static QM/PCM and the dynamic QM/FQ/PCM predict completely different spectra, also with regard to sign alternation patterns (see Fig. 9). In fact, QM/PCM fails at reproducing the experimental sign pattern, reporting a (−, −, +, +) sign alternation which is not compatible with the experimental spectrum of the L enantiomer. On the other hand, the agreement between QM/FQ/PCM and experimental data is almost perfect and indeed particularly impressive if compared to QM/PCM data. The only slight disagreement between QM/FQ/PCM and experimental spectra stays in the relative intensities of the bands in the region between 1300 and 1500 cm−1. However, the sign is correctly reproduced. It is finally worth pointing out that the dissimilarities between the implicit and explicit descriptions in the prediction of VCD spectra, not only arise from the diverse accounting of the solvent effects on the spectroscopic signal but are also the consequence of explicit solvent effects on the molecular geometry, which is in this case reoptimized to comply with the harmonic approximation.
5. Conclusions
In this feature article we have discussed, from the theoretical and computational points of view, continuum and atomistic solvation approaches to the calculation of molecular spectra. In particular, we have focused on how to translate the physico-chemical features of the molecule/solvent/radiation system into accurate models, which can provide reliable results that can be directly compared with experimental data, and assist their interpretation, in a truly synergistic way. From the chemical perspective, atomistic approaches are much more intuitive as compared to continuum descriptions, because all the atoms of the system are explicitly treated. However, fully atomistic modeling results in more complex (and expensive) computational protocols as compared to modern QM/continuum implementations. Generally speaking, the cost of a single polarizable QM/MM calculation is the same as a single QM/continuum calculation at the same QM level. However, while continuum approaches require a number of calculations equal to the number of conformers, explicit modeling involves as many calculations as those needed to reach convergence in the final spectrum. This number may vary from a few hundred to several thousand, depending on the spectral property and the nature of the interaction between the solute and the solvent. As a consequence, QM/continuum approaches are generally worth a try, by however keeping in mind their limitations, and especially that in presence of strong, specific solute–solvent interactions, e.g. intermolecular hydrogen bonding, they may fail, even dramatically. The illustrative examples that we have discussed in the previous section have been selected to exacerbate these issues. The same examples should have highlighted that both continuum and atomistic approaches are nowadays mature enough to be included within the set of tools exploited in daily chemical research. However, some aspects related to their formulations have not received the attention that should deserve. In fact, almost all formulations of QM/classical methods limit the interaction between the two layers to purely classical terms, i.e. electrostatics and polarization. However, as we have showcased for electronic spectroscopies, non-electrostatics may play a relevant role, which might be even more substantial for non-aqueous, low-polarity environments. While a few methods to account for non-electrostatic interactions in QM/continuum or QM/MM energy calculations have been proposed, their inclusion in computed molecular spectra has only been marginally addressed. Remarkably, Pauli repulsion and dispersion effects might be even dominant for magnetic and mixed electric/magnetic (and nuclear) spectra, however to the best of our knowledge, such field is still unexplored.Conflicts of interest
There are no conflicts to declare.Notes and references
- T. Giovannini, F. Egidi and C. Cappelli, Chem. Soc. Rev., 2020, 49, 5664–5677 RSC.
- M. Bondanza, M. Nottoli, L. Cupellini, F. Lipparini and B. Mennucci, Phys. Chem. Chem. Phys., 2020, 22, 14433–14448 RSC.
- M. Gaus, Q. Cui and M. Elstner, J. Chem. Theory Comput., 2011, 7, 931–948 CrossRef CAS PubMed.
- C. Bannwarth, S. Ehlert and S. Grimme, J. Chem. Theory Comput., 2019, 15, 1652–1671 CrossRef CAS PubMed.
- A. V. Titov, I. S. Ufimtsev, N. Luehr and T. J. Martinez, J. Chem. Theory Comput., 2013, 9, 213–221 CrossRef CAS PubMed.
- V. Barone, Computational strategies for spectroscopy: from small molecules to nano systems, John Wiley & Sons, 2011 Search PubMed.
- F. Egidi, T. Giovannini, G. Del Frate, P. M. Lemler, P. H. Vaccaro and C. Cappelli, Phys. Chem. Chem. Phys., 2019, 21, 3644–3655 RSC.
- S. Gómez, F. Egidi, A. Puglisi, T. Giovannini, B. Rossi and C. Cappelli, J. Mol. Liq., 2022, 346, 117841 CrossRef.
- G. Batignani, E. Mai, G. Fumero, S. Mukamel and T. Scopigno, Nat. Commun., 2022, 13, 7770 CrossRef CAS PubMed.
- D. A. Fedotov, A. C. Paul, P. Posocco, F. Santoro, M. Garavelli, H. Koch, S. Coriani and R. Improta, J. Chem. Theory Comput., 2021, 17, 1638–1652 CrossRef CAS PubMed.
- L. Halbert, M. L. Vidal, A. Shee, S. Coriani and A. Severo Pereira Gomes, J. Chem. Theory Comput., 2021, 17, 3583–3598 CrossRef CAS PubMed.
- A. C. Paul, R. H. Myhre and H. Koch, J. Chem. Theory Comput., 2020, 17, 117–126 CrossRef PubMed.
- J. Tomasi, B. Mennucci and R. Cammi, Chem. Rev., 2005, 105, 2999–3094 CrossRef CAS PubMed.
- F. Egidi, V. Barone, J. Bloino and C. Cappelli, J. Chem. Theory Comput., 2012, 8, 585–597 CrossRef CAS PubMed.
- F. Lipparini, F. Egidi, C. Cappelli and V. Barone, J. Chem. Theory Comput., 2013, 9, 1880–1884 CrossRef CAS PubMed.
- L. Goletto, S. Gómez, J. H. Andersen, H. Koch and T. Giovannini, Phys. Chem. Chem. Phys., 2022, 24, 27866–27878 RSC.
- R. Cammi, Molecular Response Functions for the Polarizable Continuum Model: Physical basis and quantum mechanical formalism, Springer Science & Business Media, 2013 Search PubMed.
- J. Tomasi, R. Cammi, B. Mennucci, C. Cappelli and S. Corni, Phys. Chem. Chem. Phys., 2002, 4, 5697–5712 RSC.
- C. Cappelli, Int. J. Quantum Chem., 2016, 116, 1532–1542 CrossRef CAS.
- S. Gomez, T. Giovannini and C. Cappelli, ACS Phys. Chem. Au, 2023, 3, 1–16 CrossRef CAS PubMed.
- A. M. Kelley, Condensed-phase molecular spectroscopy and photophysics, John Wiley & Sons, 2022 Search PubMed.
- C. Reichardt and T. Welton, Solvents and solvent effects in organic chemistry, John Wiley & Sons, 2011 Search PubMed.
- A. Warshel and M. Levitt, J. Mol. Biol., 1976, 103, 227–249 CrossRef CAS PubMed.
- A. Klamt, WIREs Comput. Mol. Sci., 2011, 1, 699–709 CrossRef CAS.
- C. J. Cramer and D. G. Truhlar, Acc. Chem. Res., 2008, 41, 760–768 CrossRef CAS PubMed.
- T. Giovannini, F. Egidi and C. Cappelli, Phys. Chem. Chem. Phys., 2020, 22, 22864–22879 RSC.
- P. Lafiosca, S. Gómez, T. Giovannini and C. Cappelli, J. Chem. Theory Comput., 2022, 18, 1765–1779 CrossRef CAS PubMed.
- S. Ehlert, M. Stahn, S. Spicher and S. Grimme, J. Chem. Theory Comput., 2021, 17, 4250–4261 CrossRef CAS PubMed.
- S. Ren, F. Lipparini, B. Mennucci and M. Caricato, J. Chem. Theory Comput., 2019, 15, 4485–4496 CrossRef CAS PubMed.
- M. Caricato, F. Lipparini, G. Scalmani, C. Cappelli and V. Barone, J. Chem. Theory Comput., 2013, 9, 3035–3042 CrossRef CAS PubMed.
- M. Caricato, Int. J. Quantum Chem., 2019, 119, e25710 CrossRef.
- S. Karbalaei Khani, A. Marefat Khah and C. Hattig, J. Chem. Theory Comput., 2020, 16, 4554–4564 CrossRef CAS PubMed.
- B. Mennucci and S. Corni, Nat. Rev. Chem., 2019, 3, 315–330 CrossRef.
- M. Ambrosetti, S. Skoko, T. Giovannini and C. Cappelli, J. Chem. Theory Comput., 2021, 17, 7146–7156 CrossRef CAS PubMed.
- H. M. Senn and W. Thiel, Angew. Chem., Int. Ed., 2009, 48, 1198–1229 CrossRef CAS PubMed.
- J. M. H. Olsen and J. Kongsted, Adv. Quantum Chem., 2011, 61, 107–143 CrossRef CAS.
- E. R. Kjellgren, J. M. Haugaard Olsen and J. Kongsted, J. Chem. Theory Comput., 2018, 14, 4309–4319 CrossRef CAS PubMed.
- L. Onsager, J. Am. Chem. Soc., 1936, 58, 1486–1493 CrossRef CAS.
- L. Jensen, P. T. van Duijnen and J. G. Snijders, J. Chem. Phys., 2003, 119, 12998–13006 CrossRef CAS.
- L. Nicoli, T. Giovannini and C. Cappelli, J. Chem. Phys., 2022, 157, 214101 CrossRef CAS PubMed.
- J. M. Herbert, WIREs Comput. Mol. Sci., 2021, 11, e1519 CAS.
- O. Andreussi and G. Fisicaro, Int. J. Quantum Chem., 2019, 119, e25725 CrossRef.
- C. Amovilli, V. Barone, R. Cammi, E. Cancès, M. Cossi, B. Mennucci, C. S. Pomelli and J. Tomasi, Adv. Quantum Chem., 1998, 32, 227–261 CrossRef.
- C. S. Pomelli, Continuum Solvation Models in Chemical Physics: From Theory to Applications, 2008, 49 Search PubMed.
- R. Cammi and J. Tomasi, J. Comput. Chem., 1995, 16, 1449–1458 CrossRef CAS.
- E. Cances, B. Mennucci and J. Tomasi, J. Chem. Phys., 1997, 107, 3032–3041 CrossRef CAS.
- R. Di Remigio, M. T. Beerepoot, Y. Cornaton, M. Ringholm, A. H. Steindal, K. Ruud and L. Frediani, Phys. Chem. Chem. Phys., 2017, 19, 366–379 RSC.
- C. Amovilli and B. Mennucci, J. Phys. Chem. B, 1997, 101, 1051–1057 CrossRef CAS.
- F. Floris, J. Tomasi and J. P. Ahuir, J. Comput. Chem., 1991, 12, 784–791 CrossRef CAS.
- C. Hille, S. Ringe, M. Deimel, C. Kunkel, W. E. Acree, K. Reuter and H. Oberhofer, J. Chem. Phys., 2019, 150, 041710 CrossRef PubMed.
- A. Pomogaeva and D. M. Chipman, J. Phys. Chem. A, 2013, 117, 5812–5820 CrossRef CAS PubMed.
- A. Pomogaeva and D. M. Chipman, J. Chem. Theory Comput., 2014, 10, 211–219 CrossRef CAS PubMed.
- Z.-Q. You and J. M. Herbert, J. Chem. Theory Comput., 2016, 12, 4338–4346 CrossRef CAS PubMed.
- A. S. Perera, J. Thomas, M. R. Poopari and Y. Xu, Front. Chem., 2016, 4, 9 Search PubMed.
- T. Vreven, B. Mennucci, C. da Silva, K. Morokuma and J. Tomasi, J. Chem. Phys., 2001, 115, 62–72 CrossRef CAS.
- C. Curutchet, A. Muñoz-Losa, S. Monti, J. Kongsted, G. D. Scholes and B. Mennucci, J. Chem. Theory Comput., 2009, 5, 1838–1848 CrossRef CAS PubMed.
- J. M. Olsen, K. Aidas and J. Kongsted, J. Chem. Theory Comput., 2010, 6, 3721–3734 CrossRef CAS.
- J. M. H. Olsen, C. Steinmann, K. Ruud and J. Kongsted, J. Phys. Chem. A, 2015, 119, 5344–5355 CrossRef CAS PubMed.
- A. H. Steindal, K. Ruud, L. Frediani, K. Aidas and J. Kongsted, J. Phys. Chem. B, 2011, 115, 3027–3037 CrossRef CAS PubMed.
- P. Reinholdt, J. Kongsted and J. M. H. Olsen, J. Phys. Chem. Lett., 2017, 8, 5949–5958 CrossRef CAS PubMed.
- T. Schwabe, J. M. H. Olsen, K. Sneskov, J. Kongsted and O. Christiansen, J. Chem. Theory Comput., 2011, 7, 2209–2217 CrossRef CAS PubMed.
- D. Loco, É. Polack, S. Caprasecca, L. Lagardere, F. Lipparini, J.-P. Piquemal and B. Mennucci, J. Chem. Theory Comput., 2016, 12, 3654–3661 CrossRef CAS PubMed.
- L. Jensen, P. T. Van Duijnen and J. G. Snijders, J. Chem. Phys., 2003, 119, 3800–3809 CrossRef CAS.
- L. Jensen, P. T. Van Duijnen and J. G. Snijders, J. Chem. Phys., 2003, 118, 514–521 CrossRef CAS.
- R. A. Bryce, R. Buesnel, I. H. Hillier and N. A. Burton, Chem. Phys. Lett., 1997, 279, 367–371 CrossRef CAS.
- R. Sanderson, Science, 1951, 114, 670–672 CrossRef CAS PubMed.
- P. Geerlings, S. Fias, Z. Boisdenghien and F. De Proft, Chem. Soc. Rev., 2014, 43, 4989–5008 RSC.
- T. Giovannini, A. Puglisi, M. Ambrosetti and C. Cappelli, J. Chem. Theory Comput., 2019, 15, 2233–2245 CrossRef CAS PubMed.
- T. Giovannini, L. Grazioli, M. Ambrosetti and C. Cappelli, J. Chem. Theory Comput., 2019, 15, 5495–5507 CrossRef CAS PubMed.
- F. Lipparini, C. Cappelli, G. Scalmani, N. De Mitri and V. Barone, J. Chem. Theory Comput., 2012, 8, 4270–4278 CrossRef CAS PubMed.
- F. Lipparini, C. Cappelli and V. Barone, J. Chem. Theory Comput., 2012, 8, 4153–4165 CrossRef CAS PubMed.
- F. Lipparini, C. Cappelli and V. Barone, J. Chem. Phys., 2013, 138, 234108 CrossRef PubMed.
- T. Giovannini, M. Olszòwka, F. Egidi, J. R. Cheeseman, G. Scalmani and C. Cappelli, J. Chem. Theory Comput., 2017, 13, 4421–4435 CrossRef CAS PubMed.
- T. Giovannini, G. Del Frate, P. Lafiosca and C. Cappelli, Phys. Chem. Chem. Phys., 2018, 20, 9181–9197 RSC.
- A. Stone, The theory of intermolecular forces, OUP Oxford, 2013 Search PubMed.
- R. McWeeny, Methods of molecular quantum mechanics, Academic press, London, 1992 Search PubMed.
- M. S. Gordon, L. Slipchenko, H. Li and J. H. Jensen, Annu. Rep. Comput. Chem., 2007, 3, 177–193 CAS.
- A. DeFusco, N. Minezawa, L. V. Slipchenko, F. Zahariev and M. S. Gordon, J. Phys. Chem. Lett., 2011, 2, 2184–2192 CrossRef CAS.
- D. Kosenkov and L. V. Slipchenko, J. Phys. Chem. A, 2011, 115, 392–401 CrossRef CAS PubMed.
- T. Giovannini, P. Lafiosca and C. Cappelli, J. Chem. Theory Comput., 2017, 13, 4854–4870 CrossRef CAS PubMed.
- C. Amovilli and F. M. Floris, Phys. Chem. Liq., 2020, 58, 281–289 CrossRef CAS.
- F. M. Floris and C. Amovilli, Mol. Phys., 2020, 118, e1752401 CrossRef.
- T. Giovannini, P. Lafiosca, B. Chandramouli, V. Barone and C. Cappelli, J. Chem. Phys., 2019, 150, 124102 CrossRef PubMed.
- T. Giovannini, M. Ambrosetti and C. Cappelli, J. Phys. Chem. Lett., 2019, 10, 5823–5829 CrossRef CAS PubMed.
- G. Marrazzini, T. Giovannini, F. Egidi and C. Cappelli, J. Chem. Theory Comput., 2020, 16, 6993–7004 CrossRef CAS PubMed.
- C. Amovilli and F. M. Floris, J. Chem. Theory Comput., 2022, 18, 6816–6825 CrossRef CAS PubMed.
- L. Cupellini, C. Amovilli and B. Mennucci, J. Phys. Chem. B, 2014, 119, 8984–8991 CrossRef PubMed.
- K. Burke, J. Chem. Phys., 2012, 136, 150901 CrossRef PubMed.
- A. Laio and M. Parrinello, Proc. Natl. Acad. Sci. U. S. A., 2002, 99, 12562–12566 CrossRef CAS PubMed.
- R. Cammi, B. Mennucci and J. Tomasi, J. Phys. Chem. A, 1998, 102, 870–875 CrossRef CAS.
- B. Mennucci, C. Cappelli, R. Cammi and J. Tomasi, Chirality, 2011, 23, 717–729 CrossRef CAS PubMed.
- F. Egidi, T. Giovannini, M. Piccardo, J. Bloino, C. Cappelli and V. Barone, J. Chem. Theory Comput., 2014, 10, 2456–2464 CrossRef CAS PubMed.
- N. H. List, H. J. A. Jensen and J. Kongsted, Phys. Chem. Chem. Phys., 2016, 18, 10070–10080 RSC.
- N. H. List, J. M. H. Olsen and J. Kongsted, Phys. Chem. Chem. Phys., 2016, 18, 20234–20250 RSC.
- Z.-Q. You, J.-M. Mewes, A. Dreuw and J. M. Herbert, J. Chem. Phys., 2015, 143, 204104 CrossRef PubMed.
- S. K. Paul, M. P. Coons and J. M. Herbert, J. Chem. Phys., 2019, 151, 189901 CrossRef PubMed.
- S. K. Paul and J. M. Herbert, J. Am. Chem. Soc., 2021, 143, 10189–10202 CrossRef CAS PubMed.
- T. Giovannini, R. R. Riso, M. Ambrosetti, A. Puglisi and C. Cappelli, J. Chem. Phys., 2019, 151, 174104 CrossRef PubMed.
- T. Giovannini, M. Macchiagodena, M. Ambrosetti, A. Puglisi, P. Lafiosca, G. Lo Gerfo, F. Egidi and C. Cappelli, Int. J. Quantum Chem., 2019, 119, e25684 CrossRef.
- Z. Rinkevicius, X. Li, J. A. Sandberg, K. V. Mikkelsen and H. Ågren, J. Chem. Theory Comput., 2014, 10, 989–1003 CrossRef CAS PubMed.
- T. Schwabe, J. Chem. Phys., 2016, 145, 154105 CrossRef PubMed.
- H. Schroder and T. Schwabe, J. Chem. Theory Comput., 2018, 14, 833–842 CrossRef PubMed.
- M. Caricato, B. Mennucci, J. Tomasi, F. Ingrosso, R. Cammi, S. Corni and G. Scalmani, J. Chem. Phys., 2006, 124, 124520 CrossRef PubMed.
- A. V. Marenich, C. J. Cramer, D. G. Truhlar, C. A. Guido, B. Mennucci, G. Scalmani and M. J. Frisch, Chem. Sci., 2011, 2, 2143–2161 RSC.
- J.-M. Mewes, Z.-Q. You, M. Wormit, T. Kriesche, J. M. Herbert and A. Dreuw, J. Phys. Chem. A, 2015, 119, 5446–5464 CrossRef CAS PubMed.
- J.-M. Mewes, J. M. Herbert and A. Dreuw, Phys. Chem. Chem. Phys., 2017, 19, 1644–1654 RSC.
- C. A. Guido, A. Chrayteh, G. Scalmani, B. Mennucci and D. Jacquemin, J. Chem. Theory Comput., 2021, 17, 5155–5164 CrossRef CAS PubMed.
- S. Skoko, C. Micheletti, E. Grifoni, F. Egidi, T. Giovannini, A. Pucci and C. Cappelli, Dyes Pigm., 2023 DOI:10.1016/j.dyepig.2023.111227.
- V. Barone, J. Bloino, S. Monti, A. Pedone and G. Prampolini, Phys. Chem. Chem. Phys., 2011, 13, 2160–2166 RSC.
- M. Cossi and V. Barone, J. Chem. Phys., 1998, 109, 6246–6254 CrossRef CAS.
- R. Cammi, C. Cappelli, S. Corni and J. Tomasi, J. Phys. Chem. A, 2000, 104, 9874–9879 CrossRef CAS.
- S. Corni, C. Cappelli, R. Cammi and J. Tomasi, J. Phys. Chem. A, 2001, 105, 8310–8316 CrossRef CAS.
- C. Cappelli, S. Corni, R. Cammi, B. Mennucci and J. Tomasi, J. Chem. Phys., 2000, 113, 11270–11279 CrossRef CAS.
- C. Cappelli, S. Corni and J. Tomasi, J. Chem. Phys., 2001, 115, 5531–5535 CrossRef CAS.
- K. O. H. M. Dundas, M. T. Beerepoot, M. Ringholm, S. Reine, R. Bast, N. H. List, J. Kongsted, K. Ruud and J. M. H. Olsen, J. Chem. Theory Comput., 2021, 17, 3599–3617 CrossRef CAS PubMed.
- T. Giovannini, M. Olszowka and C. Cappelli, J. Chem. Theory Comput., 2016, 12, 5483–5492 CrossRef CAS PubMed.
- N. A. Besley and J. A. Bryan, J. Phys. Chem. C, 2008, 112, 4308–4314 CrossRef CAS.
- A. Segalina, J. Cerezo, G. Prampolini, F. Santoro and M. Pastore, J. Chem. Theory Comput., 2020, 16, 7061–7077 CrossRef CAS PubMed.
- Q. Xu, D. Aranda, M. Yaghoubi Jouybari, Y. Liu, M. Wang, J. Cerezo, R. Improta and F. Santoro, J. Phys. Chem. A, 2022, 126, 7468–7479 CrossRef CAS PubMed.
- W. Chen, P. Zhang, D. G. Truhlar, J. Zheng and X. Xu, J. Chem. Theory Comput., 2022, 18, 7671–7682 CrossRef CAS PubMed.
- I. Carnimeo, C. Puzzarini, N. Tasinato, P. Stoppa, A. P. Charmet, M. Biczysko, C. Cappelli and V. Barone, J. Chem. Phys., 2013, 139, 074310 CrossRef PubMed.
- C. Cappelli, F. Lipparini, J. Bloino and V. Barone, J. Chem. Phys., 2011, 135, 104505 CrossRef PubMed.
- R. Cammi, B. Mennucci and J. Tomasi, J. Chem. Phys., 1999, 110, 7627–7638 CrossRef CAS.
- H. Solheim, L. Frediani, K. Ruud and S. Coriani, Theor. Chem. Acc., 2008, 119, 231–244 Search PubMed.
- P. Reinholdt, M. S. Nørby and J. Kongsted, J. Chem. Theory Comput., 2018, 14, 6391–6404 CrossRef CAS PubMed.
- P. Norman, K. Ruud and T. Saue, Principles and practices of molecular properties: Theory, modeling, and simulations, John Wiley & Sons, 2018 Search PubMed.
- T. Helgaker, M. Jaszunski and K. Ruud, Chem. Rev., 1999, 99, 293–352 CrossRef CAS PubMed.
- R. Cammi, J. Chem. Phys., 1998, 109, 3185–3196 CrossRef CAS.
- P. Carey, Biochemical applications of Raman and resonance Raman spectroscopes, Elsevier, 2012 Search PubMed.
- F. Santoro, C. Cappelli and V. Barone, J. Chem. Theory Comput., 2011, 7, 1824–1839 CrossRef CAS PubMed.
- F. F. Avila, V. Barone, C. Cappelli and F. Santoro, J. Chem. Theory Comput., 2013, 9, 3597–3611 CrossRef PubMed.
- F. Egidi, J. Bloino, C. Cappelli and V. Barone, J. Chem. Theory Comput., 2014, 10, 346–363 CrossRef CAS PubMed.
- B. Mennucci, C. Cappelli, R. Cammi and J. Tomasi, Theor. Chem. Acc., 2007, 117, 1029–1039 Search PubMed.
- S. Gómez, C. Bottari, F. Egidi, T. Giovannini, B. Rossi and C. Cappelli, J. Phys. Chem. Lett., 2022, 13, 6200–6207 Search PubMed.
- S. Gómez, N. Rojas-Valencia, T. Giovannini, A. Restrepo and C. Cappelli, Molecules, 2022, 27, 442 Search PubMed.
- A. M. Kelley, J. Phys. Chem. A, 1999, 103, 6891–6903 CrossRef CAS.
- F. Egidi, J. Bloino, C. Cappelli and V. Barone, J. Chem. Theory Comput., 2013, 10, 346–363 CrossRef PubMed.
- P. L. Polavarapu, Chiroptical spectroscopy: fundamentals and applications, Crc Press, 2016 Search PubMed.
- L. A. Nafie, Vibrational optical activity: principles and applications, John Wiley & Sons, Chichester, 2011 Search PubMed.
- P. J. Stephens, F. J. Devlin and J. R. Cheeseman, VCD spectroscopy for organic chemists, CRC Press, 2012 Search PubMed.
- P. L. Polavarapu, Chem. Rec., 2007, 7, 125–136 CrossRef CAS PubMed.
- M. Krupová, J. Kessler and P. Bouř, ChemPlusChem, 2020, 85, 561–575 CrossRef PubMed.
- C. Cappelli, J. Bloino, F. Lipparini and V. Barone, J. Phys. Chem. Lett., 2012, 3, 1766–1773 CrossRef CAS PubMed.
- C. Cappelli, S. Corni, B. Mennucci, R. Cammi and J. Tomasi, J. Phys. Chem. A, 2002, 106, 12331–12339 CrossRef CAS.
- M. Pecul, E. Lamparska, C. Cappelli, L. Frediani and K. Ruud, J. Phys. Chem. A, 2006, 110, 2807–2815 CrossRef CAS PubMed.
- S. Pipolo, R. Cammi, A. Rizzo, C. Cappelli, B. Mennucci and J. Tomasi, Int. J. Quantum Chem., 2011, 111, 826–838 CrossRef CAS.
- F. Egidi, R. Russo, I. Carnimeo, A. D’Urso, G. Mancini and C. Cappelli, J. Phys. Chem. A, 2015, 119, 5396–5404 CrossRef CAS PubMed.
- S. Jurinovich, G. Pescitelli, L. Di Bari and B. Mennucci, Phys. Chem. Chem. Phys., 2014, 16, 16407–16418 RSC.
- R. Di Remigio, A. H. Steindal, K. Mozgawa, V. Weijo, H. Cao and L. Frediani, Int. J. Quantum Chem., 2019, 119, e25685 CrossRef.
- M. Scheurer, P. Reinholdt, E. R. Kjellgren, J. M. Haugaard Olsen, A. Dreuw and J. Kongsted, J. Chem. Theory Comput., 2019, 15, 6154–6163 CrossRef CAS PubMed.
- ADF 2021.1, SCM, Theoretical Chemistry, Vrije Universiteit, Amsterdam, The Netherlands, http://www.scm.com Search PubMed.
- G. te Velde, F. M. Bickelhaupt, E. J. Baerends, C. Fonseca Guerra, S. J. A. van Gisbergen, J. G. Snijders and T. Ziegler, J. Comput. Chem., 2001, 22, 931–967 CrossRef CAS.
- AMS 2021.1, SCM, Theoretical Chemistry, Vrije Universiteit, Amsterdam, The Netherlands, http://www.scm.com Search PubMed.
- QM/FQ coupled to MD sampling, last access 29/12/2022, https://www.scm.com/doc/Tutorials/OpticalPropertiesElectronicExcitations/QMFQ_MD.html.
- C. Reichardt, Chem. Rev., 1994, 94, 2319–2358 CrossRef CAS.
- J. O. Morley, R. M. Morley and A. L. Fitton, J. Am. Chem. Soc., 1998, 120, 11479–11488 CrossRef CAS.
- V. Cavalli, D. C. da Silva, C. Machado, V. G. Machado and V. Soldi, J. Fluoresc., 2006, 16, 77–86 CrossRef CAS PubMed.
- A. V. Marenich, C. J. Cramer and D. G. Truhlar, J. Phys. Chem. B, 2015, 119, 958–967 CrossRef CAS PubMed.
- M. Biczysko, J. Bloino, G. Brancato, I. Cacelli, C. Cappelli, A. Ferretti, A. Lami, S. Monti, A. Pedone, G. Prampolini, C. Puzzarini, F. Santoro, F. Trani and G. Villani, Theor. Chem. Acc., 2012, 131, 1201 Search PubMed.
- Z.-L. Cai and J. R. Reimers, J. Phys. Chem. A, 2000, 104, 8389–8408 CrossRef CAS.
- K. J. de Almeida, K. Coutinho, W. B. De Almeida, W. R. Rocha and S. Canuto, Phys. Chem. Chem. Phys., 2001, 3, 1583–1587 RSC.
- C. Cappelli, B. Mennucci and S. Monti, J. Phys. Chem. A, 2005, 109, 1933–1943 CrossRef CAS PubMed.
- A. Edelmann and B. Lendl, J. Am. Chem. Soc., 2002, 124, 14741–14747 CrossRef CAS PubMed.
- M. Losada and Y. Xu, Phys. Chem. Chem. Phys., 2007, 9, 3127–3135 RSC.
- G. Cassanas, M. Morssli, E. Fabregue and L. Bardet, J. Raman Spectrosc., 1991, 22, 409–413 CrossRef CAS.
- B. Mennucci, J. Am. Chem. Soc., 2002, 124, 1506–1515 CrossRef CAS PubMed.
- M. Witanowski, W. Sicinska, S. Biernat and G. Webb, J. Magn. Res., 1991, 91, 289–300 CAS.
- X. G. Chen, S. A. Asher, R. Schweitzer-Stenner, N. G. Mirkin and S. Krimm, J. Am. Chem. Soc., 1995, 117, 2884–2895 CrossRef CAS.
- L. C. Mayne and B. Hudson, J. Phys. Chem., 1991, 95, 2962–2967 CrossRef CAS.
- N. E. Triggs and J. J. Valentini, J. Phys. Chem., 1992, 96, 6922–6931 CrossRef CAS.
- N. S. Myshakina, Z. Ahmed and S. A. Asher, J. Phys. Chem. B, 2008, 112, 11873–11877 CrossRef CAS PubMed.
- P. Mukhopadhyay, G. Zuber, P. Wipf and D. N. Beratan, Angew. Chem., Int. Ed., 2007, 46, 6450–6452 CrossRef CAS PubMed.
- Y. Kumata, J. Furukawa and T. Fueno, Bull. Chem. Soc. Jpn., 1970, 43, 3920–3921 CrossRef CAS.
- R. D’Cunha and T. D. Crawford, J. Phys. Chem. A, 2021, 125, 3095–3108 CrossRef PubMed.
- P. Mukhopadhyay, G. Zuber, M.-R. Goldsmith, P. Wipf and D. N. Beratan, Chem. Phys. Chem., 2006, 7, 2483–2486 CrossRef CAS PubMed.
- M. Diem, J. Am. Chem. Soc., 1988, 110, 6967–6970 CrossRef CAS.
| This journal is © The Royal Society of Chemistry 2023 |