
 Open Access Article
 This Open Access Article is licensed under a
 Creative Commons Attribution 3.0 Unported Licence
White emission in 3D-printed phosphor microstructures†
Jędrzej
Winczewski
 *a,
Manuel
Herrera
b,
Han
Gardeniers
a and
Arturo
Susarrey-Arce
*a
*a,
Manuel
Herrera
b,
Han
Gardeniers
a and
Arturo
Susarrey-Arce
*a
aMesoscale Chemical Systems, MESA+ Institute, University of Twente, P.O. Box 217, Enschede 7500 AE, The Netherlands. E-mail: j.p.winczewski@utwente.nl; a.susarreyarce@utwente.nl
bCentro de Nanociencias y Nanotecnología, Universidad Nacional Autónoma de México, Km 107 Carretera Tijuana-Ensenada, Ensenada, Baja California C.P. 22800, Mexico
First published on 15th February 2023
Abstract
Microscale functional materials permit advanced applications in optics and photonics. This work presents the additive manufacturing of three-dimensional structured phosphors emitting red, green, blue, and white. The development is a step forward to realizing additive colour synthesis within complex architectures of relevance in integrated optics or light-emitting sources.
Two-photon lithography (TPL) has unfolded as a buoyant methodology permitting the fabrication of complex three-dimensional (3D) structures with sub-micrometer resolution.1 In standard microscope-based TPL systems, femtosecond laser radiation is utilized to initiate the photopolymerization within the focal point, which position is scanned to solidify the negative-tone photoresin into the desired 3D shapes (Fig. 1).1 TPL is often used with other fabrication approaches to exploit the full potential, as the intrinsic properties of the standard organic photoresins offer a limited range of applications. Recently, alternatives to standard organic photoresins based on simple monomeric species have been developed. Besides the polymers of modified functionalities, the materials manufactured using the tailor-made photoresins include, e.g., metals, ceramics, or nanocomposites.2–4 The pre-ceramic photoresins have reached increasing recognition attributed to their technological importance and the versatile characteristics of the resulting materials, e.g., piezoelectricity, and high mechanical strength.3,5,6 Examples of 3D-structured ceramic microstructures include, i.e. ZnO, TiO2, and ZrO2.3,5,6 Due to their high chemical and physical stability, resistance to continuous excitation, and high lattice-binding energies, ceramics are often the host matrices of choice for rare-earth ions (RE3+).7 Upon excitation, phosphorous materials are highly-efficient emitters of narrowly defined radiation that find a broad range of applications, such as microoptics.8 Low phonon energy ceramics are typically preferred, as they promote higher RE3+ optical transitions quantum efficiencies by reducing non-radiative decay rates.9 Sufficient RE3+ solubility is required to prevent dopant clustering.9 ZrO2 fulfils the above considerations and has frequently been applied as a RE3+ host. The rationale is that the microscale 3D structuring of phosphors may grant measures for mitigating thermal quenching via optimized heat dissipation or restraining the optical crosstalk.10 Various forms of structured ZrO2 phosphors have been manufactured, i.e., nanotube arrays, nanofibers, or macro-mesoporous structures.11–13 Recently, we presented an alternative methodology for fabricating compound 3D ZrO2:Eu3+ microstructures emitting in orange-red.10 The development of 3D phosphors emitting in other primary colours and white is a step forward to realizing additive colour synthesis within complex architectures of relevance in integrated optics or light-emitting sources.8 Further, the biocompatibility of ZrO2 could also prospectively permit their use in biomedical imaging or sensing.14,15
 | ||
| Fig. 1 Schematic simplified presentation of the AM of 3D pre-ceramic microstructures using tailor-made photoresists doped with RE3+ species and formation of ceramic replicas upon annealing at 600 °C for 1 h. | ||
In this study, we present the additive manufacturing (AM) of ZrO2 doped structures emitting in red (Eu3+), green (Tb3+), blue (Tm3+), and white (Eu3+, Tb3+, and Tm3+). The method involves the preparation of tailor-made photoresins suitable for TPL, containing the Zr-rich acrylate monomer and acetate (Ac) salts of the lanthanides (Ln3+). TPL is utilized to fabricate 3D architectures of arbitrary shapes from the custom-made photoresin. TPL has a miniaturization advantage, which is also a bottleneck regarding large-scale production. During the printing, the photoresin photopolymerizes, and both organic and metal–organic acrylates participate in the reaction, forming a metal–organic (pre-ceramic) polymer. In the photopolymer, and thus within the printed 3D structure, Ln3+ acetates are trapped, similar to the concept presented by Yee et al.3 During the annealing, the organic constituents of the photopolymer (and the Ac groups of Ln3+ acetates) are combusted in the air. As a result, the metal–organic photopolymer is decomposed, the metallic part is oxidized, and the corresponding metal oxide (ZrO2) is formed. Trivalent ions (e.g., Ln3+) can substitute Zr4+ ions in the ceramic matrix and act as dopants. The pre-ceramic architectures (in shape inspired by a C60 buckyball) printed on Si substrates are annealed at 600 °C for 1 h. After combustion, the doped ZrO2 ceramics (ZrO2:Ln3+) is obtained, where Ln3+ is Eu3+, Tb3+, or Tm3+. Additionally, triply-doped ZrO2 is prepared with Eu3+, Tb3+, and Tm3+. The doping is adjusted to 3 wt. % for the RE3+ species in ZrO2:Ln3+, and to 1 wt. % of each RE3+ species in the triply-doped material. The methodology is schematically depicted in Fig. 1. and described in the ESI† (S1.2).
The annealing promotes the formation of miniaturized ceramic replicas isotropically reduced in size by ≈ 60%. The result is shown in Fig. 2(a). Complimentary images of ZrO2:Tb3+ and ZrO2:Tm3+ gyroids and a ZrO2:Eu3+, Tb3+, Tm3+ octet-truss lattice can be found in ESI† (Fig. S1). In Fig. 2(b–g), elemental mapping is conducted using Scanning Electron Microscopy-Energy Dispersive X-ray Spectroscopy (SEM-EDX), which confirms the uniform distribution of co-dopants throughout the ZrO2 architecture. The O and Si signals are absent within the structural beams, and surface oxide on the Si substrate is observed. The EDX spectrum (Fig. 2(i) features sharp O Kα1, Si Kα1 (substrate), and Zr Lα peaks centred at 0.52 eV, 1.74 eV, and 2.12 eV.16 The insets present the signals originating from the RE3+ species. The Eu contributions are found at 1.14 eV (Mα1), 5.85 eV (Lα1), and 6.46 eV (Lβ1).16 Characteristic Tb peaks at 1.24 eV (Mα1), 6.27 eV (Lα1), and 6.98 eV (Lβ1), and Tm signals at 1.46 eV (Mα1), 7.18 eV (Lα1), and 8.10 eV (Lβ1) are also detected.16 The analysis confirms the incorporation of Eu, Tb, and Tm within the ZrO2 structure. The site symmetry and structure influence the radiative transitions of the hosted RE3+ ions.17 The crystallographic phase of the undoped and doped ZrO2 is assessed with X-ray diffraction (XRD) (Fig. S3, ESI†) and cross-checked with confocal Raman spectroscopy (Raman) (Fig. S4, ESI†). In short, for XRD and Raman, tetragonal zirconia (t-ZrO2) is observed for the doped ZrO2. The estimated crystallite sizes are approximately 7 nm (S.4.1., ESI†). Four intense Raman modes are detected at 145 cm−1 (B1g), 267 cm−1 (Eg), 462 cm−1 (Eg), and 646 cm−1 (Eg) with weaker shoulders at 316 cm−1 (B1g), and 606 cm−1 (B1g) for the undoped t-ZrO2 microstructure.18–20 All these vibrational modes are also observed for ZrO2 doped with Eu3+, Tb3+, and Tm3+, and ZrO2 co-doped with Eu3+, Tb3+, and Tm3+. The results agree with the literature on ZrO2 doped with ≈ 3 wt% of Ln3+ species and with our previous work.10,21 In a previous study employing X-ray photoelectron spectroscopy, we confirmed the predominant oxidation state of Eu species introduced into the ZrO2 microstructures.10 In the triply-doped ZrO2, the Ln3+ loadings are low (≈ 1%), making it challenging to determine the species. Thus, we rely on the optical properties of the 3D structured ZrO2, ZrO2:Ln3+, and ZrO2:Eu3+, Tb3+, Tm3+ phosphors.
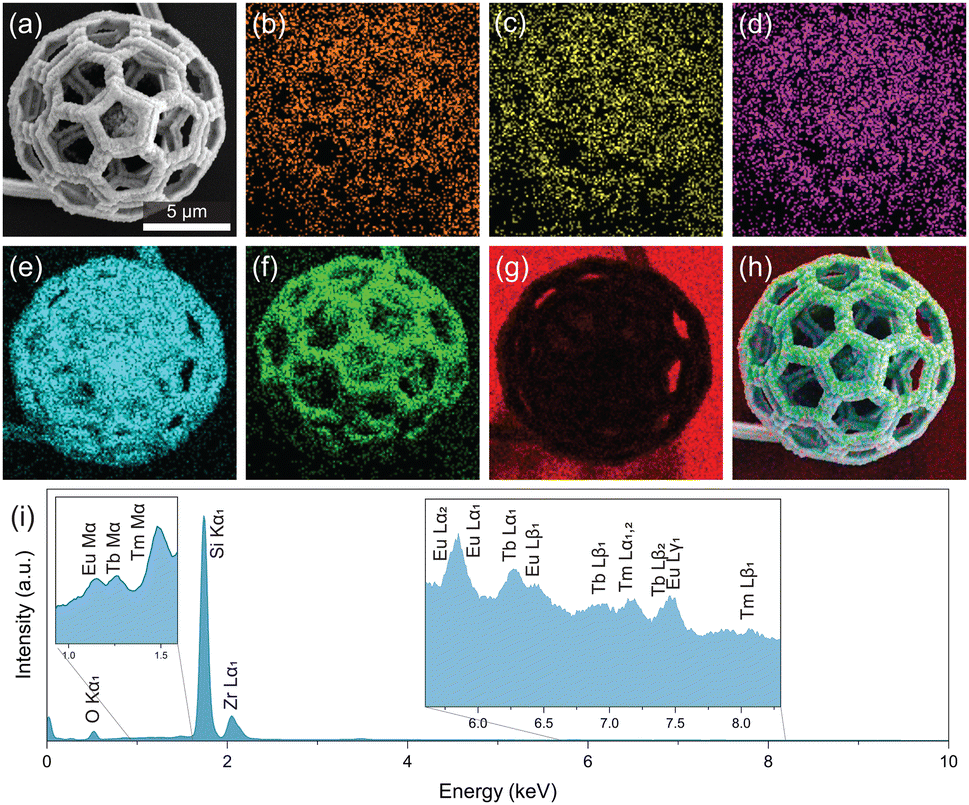 | ||
| Fig. 2 (a) SEM image of the triply-doped ZrO2 buckyball; (b–g) SEM-EDX elemental maps of (b) Eu, (c) Tb, (d) Tm, (e) Zr, (f) O, (g) Si, and (h) overlayed (a–g) images. (i) EDX spectrum collected from the ZrO2:Ln3+ buckyball. | ||
The optical properties of the 3D phosphor structures are investigated with cathodoluminescence (CL). Although differences in photoluminescence (PL) and CL spectra may occur, the microscale feature size of the architectures is the main reason for selecting the CL in this study.22 The CL spectrum collected from the undoped t-ZrO2 buckyball is a sum of Gaussian components at approximately 3.5 eV (356 nm), 3.2 eV (393 nm), 2.9 eV (434 nm), 2.6 eV (485 nm), and 2.3 eV (546 nm) (Fig. 3(a)), previously assigned to the F+ centers, oxygen vacancies (VO) and interstitial carbon (Ci) point-defects.10 The spectra of ZrO2 with a single RE3+ ion type reveal their characteristic transitions, significantly more intense than the negligible t-ZrO2 CL components.10 The CL spectrum of ZrO2:Eu3+ is dominated by the sharp 5D0 → 7F1 and 5D0 → 7F2 (594 nm and 609 nm) and weak 5D0 → 7F2 (≈628 nm) and 5D0 → 7F3 (≈651 nm) transitions (Fig. 3(b)) are registered. The CL spectrum of ZrO2:Tb3+ features the sharp 5D4 → 7F5 (546 nm) line, medium-intensity 5D4 → 7F6 (491 nm) emission, and weak 5D4 → 7FJ (J = 4, 3) peaks (590 nm, 622 nm) (Fig. 3(c)).23
 | ||
| Fig. 3 CL spectra registered for the buckyballs: (a) ZrO2, (b) ZrO2:Eu3+, (c) ZrO2:Tb3+, (d) ZrO2:Tm3+, and (e) ZrO2 triply-doped with Eu3+, Tb3+, and Tm3+, and (f) 1931 CIE chromaticity diagram with labels corresponding to the RE3+ dopants in ZrO2. | ||
In the violet-blue spectral region, very weak emissions corresponding with 5D3 → 7FJ transitions are detected (≈ 378 nm, 414 nm, and 436 nm).23 The CL spectrum of ZrO2:Tm3+ exhibits intense 1D2 → 3F4 (459 nm), a medium intensity 1D2 → 3H6 line (359 nm), and a very weak 1G4 → 3F4 (≈ 648 nm) transition (Fig. 3(d)).21,24 The co-doping of ZrO2 with Eu3+, Tb3+, and Tm3+ results in distinctive individual contributions and signals related to energy transfer (ET) interactions (Fig. 3(e)). The sharp Eu3+ 5D0 → 7F1 (≈590 nm) and 5D0 → 7F2 (≈ 606 nm) emission lines, and weaker 5D0 → 7F2 (≈ 626 nm) and 5D0 → 7F3 (≈ 651 nm) transitions. The distinct Tb3+ 5D4 → 7F5 and 5D4 → 7F6 transitions are also observed. Several contributions can be assigned within the 360–460 nm region, including the overlapped Tm3+ 1D2 → 3F4 (459 nm) transition. The sharp Tm3+ emissions cannot unambiguously be distinguished.21 The suppression of the Tm3+ 1D2 → 3H6 transition (observed around 359 nm in the ZrO2:Tm3+ spectrum) and accompanying appeareance of Tb3+ 5D3 → 7FJ emissions may imply the ET from the Tm3+ 1D2 level to Tb3+ 5D3 level, likely involving a relaxation.21,22,25 Consistently, several intense Tb3+ transitions (5D3 → 7F6,5,4,3) are observed (≈ 380 nm, 410 nm, 440 nm, and 460 nm), which have previously been reported at low Tb3+ (≈ 2 at%) concentrations in LiLuF4 under 353 nm excitation.22 At lower Tb3+ concentrations, the probability of cross-relaxation decreases, promoting the 5D3 → 7FJ transitions.26 The effect is significant at low concentrations in the case of CL spectra but not observed in the case of PL.26,27 The blue emission has been proposed to be correlated with the presence of Tb4+ ions, which can substitute the Zr4+ ion positions. Upon the impact of electrons from the beam during CL measurements, Tb4+ ions can transiently be excited to the (Tb3+) state and act as emissive centers.27 Also, some of the excited electrons from the Tb3+ 5D4 level may cross-relax to the Eu3+ 5D0 level and contribute to the 5D0 → 7F0, 1, 2 transitions.21 We observe that the intensity of the 5D0 → 7F1 transition is higher than the 5D0 → 7F2 in the triply-doped sample. In principle, such an ET is very efficient due to the overlap of the Tm3+ 5D4 → 7F6,5,4,3 emissions and the Eu3+ 7F0,1 → 5D0, 1, 2 absorptions.21 The PL from the RE3+ is indirectly confirmed by exciting it at 532 nm, using Raman system and Eu3+ as an example. A similar concept has previously been presented by Tiseanu et al. (Fig. S5, ESI†).28
The CL spectra are converted into the Commission Internationale de l’éclairage (CIE) 1931 color space chromaticity diagram (Fig. 3(f)). The CIE coordinates might slightly differ from their respective PL emissions, as the ET may be less apparent in the case of the electron beam excitation when compared with the ultraviolet pump.22 The CIE coordinates of single-doped ZrO2 fall into the orange-red (Eu3+), green (Tb3+), and blue (Tm3+) regions. The triple doping (Eu3+, Tb3+, and Tm3+) promotes white emission (Fig. 3(f)). Although the main goal of this study is to present the white emission in triply-doped microstructures, additional insights into the effect of high-temperature annealing (1200 °C for 1 and 3 h) on the optical properties of ZrO2:Eu3+, ZrO2:Tb3+, ZrO2:Tm3+, and ZrO2:Eu3+, Tb3+, Tm3+ architectures are provided (Fig. S6, ESI†). Complimentary SEM images of the buckyballs annealed at 1200 for 3 h are also presented (Fig. S2, ESI†). The panchromatic CL image (Fig. 4(b)) presents the homogenous emission from the buckyball. The monochromatic CL images (Fig. 4(c–h)) are obtained at 3.24 eV, 2.99 eV, 2.55 eV, 2.28 eV, 2.10 eV, 2.05 eV to match the most intense transitions registered in the triply-doped sample, corresponding to the 383 nm, 415 nm, 486 nm, 544 nm, 594 nm, and 605 nm in the visible range. Interestingly, CL images obtained at 3.24 eV, 2.99 eV, and 2.55 eV correspond to the transitions occurring mainly due to the ET, e.g., 5D3 → 7F6, or 5D3 → 7F5, in which more uniform emission throughout the architecture is observed. Brighter regions are observed mainly at the edges of the architecture in the CL images obtained at 2.28 eV, 2.10 eV, and 2.05 eV, indicating possible Ln3+ segregation. Nevertheless, these regions can be associated with the most intense 5D4 → 7F5 transition of ZrO2:Tb3+ and 5D0 → 7F1 and 5D0 → 7F2 transitions of ZrO2:Eu3+.
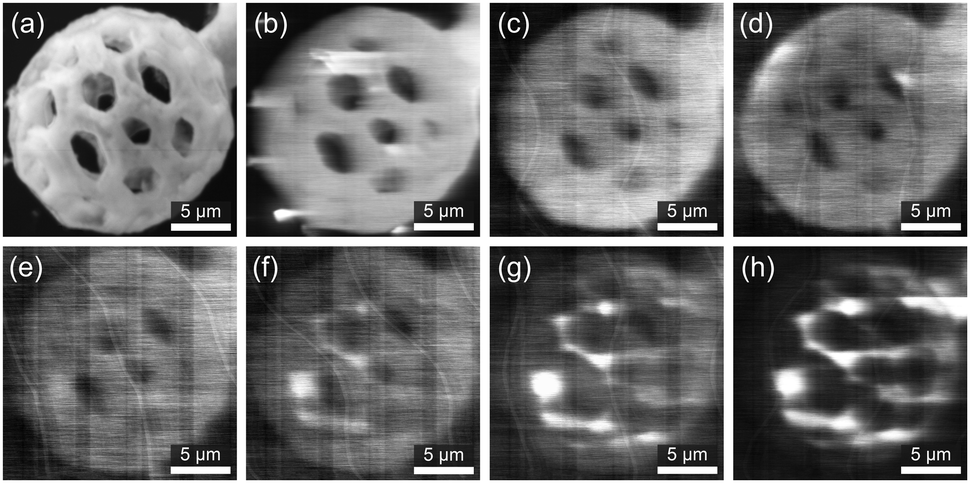 | ||
| Fig. 4 Micrographs of the ZrO2 buckyball doped with Eu3+, Tb3+, and Tm3+; (a) SEM secondary electron image, (b) SEM panchromatic CL image, (c–h) monochromatic CL images at (c) 3.24 eV, (d) 2.99 eV, (e) 2.55 eV, (f) 2.28 eV, (g) 2.10 eV, and (h) 2.05 eV. Scale bars represent 5 μm. | ||
In summary, we present tailor-made photoresins permitting the AM of microstructures doped with RE3+ species (Eu3+, Tb3+, Tm3+) via TPL and subsequent annealing in the air. The thermal treatment of the 3D pre-ceramic structures results in forming ceramic replicas that are isometrically reduced in size by ≈60%. The incorporation of the RE3+ species within the ZrO2 host is confirmed via SEM-EDX imaging. The t-ZrO2 crystallographic phase of the fabricated ZrO2:Ln3+ microstructures is confirmed using Raman spectroscopy. The coherent results are backed by XRD analysis of the reference ceramic powders obtained from the UV-cured photoresins annealed in bulk. The transitions of the ZrO2:Ln3+ 3D structures are evaluated using CL, and according to the 1931 CIE colour space chromaticity diagram, the green (ZrO2:Tb3+), and blue (ZrO2:Tm3+) emissions are confirmed. The triple-doping promotes the ET from the Tm3+ to Tb3+ and from the Tb3+ to Eu3+, and consequently, the white emission. The results show that the presented approach is suitable for the realization of complex 3D microarchitectures emitting close to all primary colours, and white.
J.P.W., A.S.-A., and H.G. are recipients of the Horizon 2020 ERC research and innovation programme of the European Union funding under Grant Agreement No. 742004. M.H. acknowledges support from the University of California Institute for Mexico and The United States (UCMEXUS) (No. CN19137) and CONACYT (Grant No. 284667).
Conflicts of interest
There are no conflicts to declare.References
- J. T. Fourkas, Three-Dimensional Microfabrication Using Two-Photon Polymerization, Elsevier Inc., Oxford, United Kingdom, 1st edn, 2016, ch. 1.3, pp. 57–76 Search PubMed.
- M. Carlotti and V. Mattoli, Small, 2019, 15, 1902687 CrossRef PubMed.
- D. W. Yee, M. L. Lifson, B. W. Edwards and J. R. Greer, Adv. Mater., 2019, 31, 1901345 CrossRef PubMed.
- A. Vyatskikh, S. Delalande, A. Kudo, X. Zhang, C. M. Portela and J. R. Greer, Nat. Commun., 2018, 9, 593 CrossRef PubMed.
- A. Vyatskikh, R. C. Ng, B. Edwards, R. M. Briggs and J. R. Greer, Nano Lett., 2020, 20, 3513–3520 CrossRef CAS PubMed.
- A. Desponds, A. Banyasz, D. Chateau, A. Tellal, A. Venier, S. Meille, G. Montagnac, J. Chevalier, C. Andraud, P. L. Baldeck and S. Parola, Small, 2021, 17, 2102486 CrossRef CAS PubMed.
- J.-C. G. Bünzli, Trends Chem., 2019, 1, 751–762 CrossRef.
- D. Gonzalez-Hernandez, S. Varapnickas, A. Bertoncini, C. Liberale and M. Malinauskas, Adv. Opt. Mater., 2023, 11, 2201701 CrossRef CAS.
- X. Chen, T. Sun and F. Wang, Chem. – Asian J., 2020, 15, 21–33 CrossRef CAS PubMed.
- J. Winczewski, M. Herrera, C. Cabriel, I. Izeddin, S. Gabel, B. Merle, A. Susarrey Arce and H. Gardeniers, Adv. Opt. Mater., 2022, 10, 2102758 CrossRef CAS.
- N. Fu, X. Wang, L. Guo, J. Zhao, X. Zhang, J. Lin, L. Gong, M. Wang and Y. Yang, J. Mater. Sci.: Mater. Electron., 2017, 28, 7253–7258 CrossRef CAS.
- A. B. Suryamas, M. M. Munir, T. Ogi, C. J. Hogan and K. Okuyama, Jpn. J. Appl. Phys., 2010, 49, 115003 CrossRef.
- X. Qu, H. Song, X. Bai, G. Pan, B. Dong, H. Zhao, F. Wang and R. Qin, Inorg. Chem., 2008, 47, 9654–9659 CrossRef CAS PubMed.
- K. Soga, K. Tokuzen, K. Tsuji, T. Yamano, N. Venkatachalam, H. Hyodo and H. Kishimoto, Opt. Compon. Mater. VII, 2010, 7598, 759807 Search PubMed.
- J. Wang, W. Yin, X. He, Q. Wang, M. Guo and S. Chen, Sci. Rep., 2016, 6, 35020 CrossRef CAS PubMed.
- J. B. Kortright and A. C. Thompson, in X-ray Data Booklet, ed. A. C. Thompson, LawrenceBerkeley National Laboratory, University of California, Berkeley, CA, USA, 3rd edn., 2009, pp. 8–27 Search PubMed.
- X. Chen, Lanthanide-Doped Luminescent Nanomaterials, Springer-Verlag, Heidelberg, Germany, 2014, ch. 5, pp. 75–123 Search PubMed.
- G. Pezzotti and A. A. Porporati, J. Biomed. Opt., 2004, 9, 372 CrossRef CAS PubMed.
- X. Zhao and D. Vanderbilt, Phys. Rev. B: Condens. Matter Mater. Phys., 2002, 65, 075105 CrossRef.
- A. P. Naumenko, N. I. Berezovska, M. M. Biliy and O. V. Shevchenko, Phys. Chem. Solid State, 2008, 9, 121–125 CAS.
- L. X. Lovisa, J. Andrés, L. Gracia, M. S. Li, C. A. Paskocimas, M. R. Bomio, V. D. Araujo, E. Longo and F. V. Motta, J. Alloys Compd., 2017, 695, 3094–3103 CrossRef CAS.
- S. Kalusniak, E. Castellano-Hernández, H. Yalçinoğlu, H. Tanaka and C. Kränkel, Appl. Phys. B, 2022, 128, 33 CrossRef CAS.
- A. J. Silversmith, D. M. Boye, K. S. Brewer, C. E. Gillespie, Y. Lu and D. L. Campbell, J. Lumin., 2006, 121, 14–20 CrossRef CAS.
- A. A. El-Maaref, E. A. Wahab, K. S. Shaaban, M. Abdelawwad, M. S. Koubisy, J. Börcsök and E. S. Yousef, Spectrochim. Acta, Part A, 2020, 242, 118774 CrossRef CAS PubMed.
- X. Xue, M. Thitsa, T. Cheng, W. Gao, D. Deng, T. Suzuki and Y. Ohishi, Opt. Express, 2016, 24, 26307 CrossRef CAS PubMed.
- H. Seed Ahmed, O. Ntwaeaborwa, M. Gusowski, J. Botha and R. Kroon, Phys. B: Condensed Matter, 2012, 407, 1653–1655 CrossRef CAS.
- M. Zawadzki, D. Hreniak, J. Wrzyszcz, W. Miśta, H. Grabowska, O. Malta and W. Strȩk, Chem. Phys., 2003, 291, 275–285 CrossRef CAS.
- C. Tiseanu, B. Cojocaru, V. I. Parvulescu, M. Sanchez-Dominguez, P. A. Primus and M. Boutonnet, Phys. Chem. Chem. Phys., 2012, 14, 12970–12981 RSC.
Footnote |
| † Electronic supplementary information (ESI) available: Experimental details, supplementary figures. See DOI: https://doi.org/10.1039/d2cc06953a |
| This journal is © The Royal Society of Chemistry 2023 |