
 Open Access Article
 This Open Access Article is licensed under a
 Creative Commons Attribution 3.0 Unported Licence
Determining the oxidation states of dissolved transition metals in battery electrolytes from solution NMR spectra†
Jennifer P.
Allen
 ab and
Clare P.
Grey
*ab
ab and
Clare P.
Grey
*ab
aYusuf Hamied Department of Chemistry, University of Cambridge, Cambridge, Lensfield Road, CB2 1EW, Cambridge, UK. E-mail: cpg27@cam.ac.uk
bThe Faraday Institution, Quad One, Harwell Science and Innovation Campus, Didcot OX11 0RA, UK
First published on 17th January 2023
Abstract
Dissolved transition metal ions can induce peak shifts in the NMR spectra of degraded battery electrolytes. Here, we exploit this staightforward, accessible method to calculate magnetic moments for dissolved Ni2+, Mn2+, Co2+, and Cu2+; subsequent analysis of dissolution from LiMn2O4, LiNiO2, and LiNi0.5Mn1.5O4 shows that the dissolved metals are exclusively divalent.
Transition metal dissolution and deposition is a significant contributor to capacity fade in lithium-ion cells.1–4 There are limited direct measurements of the oxidation states of dissolved transition metals, but such measurements are typically performed via XANES of the electrolyte solution and/or separator.5–10 This yields only an average oxidation state,7,8 and XANES measurements often require synchrotron access. EPR spectroscopy has been used to distinguish Mn2+ from Mn3+,7,11,12 although this assumes all Mn2+ is EPR-observable and all inconsistency between EPR and ICP-OES results is due to the presence of EPR-silent Mn3+—an approach which has been questioned due to the potential EPR silence of some Mn2+ complexes.13 More generally, EPR of metals with either rapid electronic relaxation or with integer spins, S, including Co2+ (S = 3/2) and Ni2+ complexes (S = 1),14 can be challenging.15 Capillary electrophoresis is a promising method that has been used to determine oxidation states of dissolved Mn,16 Fe,17 and Cu.18 Electrochemical methods may also be used to infer metal oxidation states.19–21
It is thought that most 3d metals dissolve from cathodes as M2+;10,22–25 however, this is of increasing debate. While EPR, XANES, and electrochemical studies7,8,11,12,21 of LiMn2O4 and/or LiNi0.5Mn1.5O4 have observed some fraction of dissolved Mn3+, other XANES, XPS, and capillary electrophoresis/UV-visible studies have shown only Mn2+.5,9,16 XANES of LiNi0.5Mn0.3Co0.2O2 found dissolved Ni2+ and Mn2+ but Co3+;6 XANES of LiNi0.33Mn0.33Co0.33O2 found dissolved Mn2+ (and deposited Mn2+, Ni2+, and Co2+).10 Dissolved Cu+ and Cu2+ (from current collectors) and Fe2+ and Fe3+ (from LiFePO4) have all been observed.17,18
Most of the dissolved metal ions are paramagnetic and in the NMR spectra of electrolytes containing these metals, the paramagnetic species cause bulk magnetic fields and changes in all NMR chemical shifts away from their positions in diamagnetic solutions, known as bulk magnetic susceptibility (BMS) shifts. These BMS shifts are not observed with an internal reference, as the reference is also affected, but it may be observed if the reference is not in contact with the paramagnetic solution, e.g., by using a sufficiently thick-walled solvent capillary.14,26,27 For a cylindrical sample in a superconducting magnet, neglecting the diamagnetic contribution, the molar magnetic susceptibility of a paramagnetic solute (χM, mL·mol−1) depends on the BMS shift it induces (Δν, Hz), the spectrometer frequency (ν0, Hz), and the metal concentration (c, mol·mL−1) viaeqn (1).
 | (1) |
If the temperature T is known, then the effective magnetic moment μeff can be calculated (eqn (2)) and compared to the theoretical spin-only magnetic moment μs, which is dependent on the number of unpaired electrons n (eqn (3)).14,28 Hence, μeff may permit identification of the oxidation state and spin state of paramagnetic compounds.
 | (2) |
 | (3) |
Notably, μs does not account for spin–orbit coupling or orbital contributions to the magnetic moment, and μeff deviates from μs when such contributions occur.28,29 The magnetic moment accounting for orbital contribution is shown in eqn (4), which simplifies to μs when L = 0 (eqn (3), as S = n/2). The μeff of a sample can also be interpreted via comparison to μeff of known compounds.29,30
 | (4) |
This work uses 1H BMS shifts of solvent peaks to characterise dissolved transition metals in a typical electrolyte solution, 1 M LiPF6 in 3![[thin space (1/6-em)]](https://www.rsc.org/images/entities/char_2009.gif) :7 ethylene carbonate:ethyl methyl carbonate (EC:EMC, v/v). Trifluoromethanesulfonimide (TFSI) salts were used to model dissolved Mn2+, Co2+, Ni2+, and Cu2+. NMR spectra of diamagnetic and paramagnetic electrolyte solutions were measured separately (referenced to C6D6 capillaries) and the BMS shift was extracted by comparison. Metal dissolution from LiMn2O4, LiNiO2, and LiNi0.5Mn1.5O4 was characterised by storing cathode powders with electrolyte, after which isolated solutions were analysed with NMR and ICP-OES. Additional experimental details are provided in the ESI,† including a diagram of the NMR tube with solvent capillary (Fig. S1, ESI†).
:7 ethylene carbonate:ethyl methyl carbonate (EC:EMC, v/v). Trifluoromethanesulfonimide (TFSI) salts were used to model dissolved Mn2+, Co2+, Ni2+, and Cu2+. NMR spectra of diamagnetic and paramagnetic electrolyte solutions were measured separately (referenced to C6D6 capillaries) and the BMS shift was extracted by comparison. Metal dissolution from LiMn2O4, LiNiO2, and LiNi0.5Mn1.5O4 was characterised by storing cathode powders with electrolyte, after which isolated solutions were analysed with NMR and ICP-OES. Additional experimental details are provided in the ESI,† including a diagram of the NMR tube with solvent capillary (Fig. S1, ESI†).
To evaluate the method's sensitivity, magnetic susceptibility calibration curves were constructed from electrolyte samples containing different concentrations (0.01, 0.05, 0.1, 0.5, 1, 3, and 5 mM) of Mn(TFSI)2 or Ni(TFSI)2 (Fig. 1).
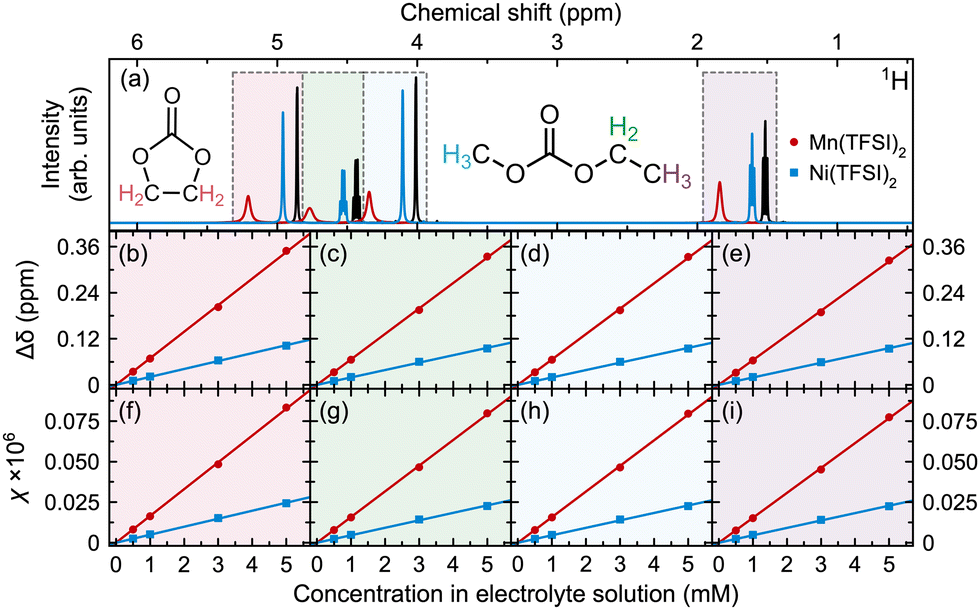 | ||
| Fig. 1 (a) 1H NMR spectra, (b)–(e) peak shifts, and (f)–(i) magnetic susceptibilities (χ, calculated as in eqn (1) but without dividing by concentration, c), for electrolyte solutions containing Mn(TFSI)2 or Ni(TFSI)2. Spectra are shown for the electrolyte without (black) and with 5 mM Mn2+ (red) or Ni2+ (blue). Panels correspond to (b) and (f) EC CH2, (c) and (g) EMC ethyl CH2, (d) and (h) EMC methyl, and (e) and (i) EMC ethyl CH3 resonances, shaded with the same colours as used for the protons in the EC and EMC molecules shown in (a). | ||
Only the 0.5, 1, 3, and 5 mM measurements are shown in Fig. 1, as the 1H BMS shift upon addition of 0.1 mM of Mn(TFSI)2 or Ni(TFSI)2 is below the limit of detection (LoD) of our experiments; peak shifts at smaller concentrations are negligible. Total magnetic susceptibility χ is presented rather than molar magnetic susceptibility χM (i.e., eqn (1) is applied but without dividing by c). Values increase linearly with metal concentration, with good fits from all four peaks (data for fits in (f)–(i) are shown in ESI,† Table S1), indicating that the measurement is reliable for metal concentrations ≥0.5 mM.
The LoD was estimated by calculating μeff for each sample. At concentrations ≥0.5 mM, μeff = 3.3–3.4 μB for Ni2+ and 6.0–6.1 μB for Mn2+, but this differed by 14–18% at 0.1 mM (3.8 μB for Ni2+ and 4.9 μB for Mn2+); hence, the LoD is in the 0.1–0.5 mM range. We note that small differences in peak positions may arise from small variations in the magnetic field (e.g., from different shimming or placement of samples in NMR tubes) as the diamagnetic and paramagnetic spectra were measured in separate samples and referenced to each other via C6D6 capillaries. This variation may be reduced by incorporating the diamagnetic and paramagnetic electrolytes into one sample, by using a reference capillary of deuterated diamagnetic electrolyte, which may increase the sensitivity of the method.
To evaluate the method's ability to measure samples containing more than one dissolved metal, solutions were prepared containing both Mn(TFSI)2 and Ni(TFSI)2. Fig. 2 shows the total predicted and observed magnetic susceptibilities of these samples, where predicted magnetic susceptibilities are calculated using the correlations determined in Fig. 1(f)–(i).
 | ||
| Fig. 2 (a)–(f) Magnetic susceptibilities of solutions containing different amounts of Mn(TFSI)2 and Ni(TFSI)2 added to electrolyte solutions. Percentages give the average error of the four predicted values from the four 1H resonances, as compared to the four measured values for each sample. | ||
The susceptibilities for samples containing both Ni2+ and Mn2+ in Fig. 2 are consistent with the calibrations generated from single metals, showing the BMS method is additive. While the error is 9.3% in a solution containing 1 mM paramagnetic ions total, this drops to 2.1% in a solution containing 2 mM paramagnetic ions; all other samples, with 3–9 mM metal ions, have <1% error. Hence, it is important to have a sufficient concentration of metal ions for accurate measurement.
Magnetic susceptibilities were then used to determine magnetic moments (eqn (1) and (2)) for a series of paramagnetic ions often found in battery electrolytes. Fig. 3 shows μeff for dissolved Mn(TFSI)2, Ni(TFSI)2, Co(TFSI)2, and Cu(TFSI)2 (values listed in ESI,† Table S2), calculated from the EMC ethyl CH3 shift of 5 mM solutions; μs is also shown for comparison.
 | ||
| Fig. 3 Effective magnetic moments (dashed lines) for dissolved Mn(TFSI)2, Co(TFSI)2, Ni(TFSI)2, and Cu(TFSI)2, calculated from the BMS shift of the 1H EMC ethyl CH3 peak. Black points show the theoretical values of the spin-only magnetic moment for different numbers of unpaired electrons. Electrolyte solutions contained 5 mM M(TFSI)2. | ||
For d5 Mn(TFSI)2, μeff = 6.07 μB, which is close to the n = 5 (S = 5/2) value of μs, 5.92 μB. For Cu(TFSI)2, Ni(TFSI)2, and Co(TFSI)2, μeff > μs by 0.38, 0.45, and 1.27 μB, respectively. These larger values arise because μs does not account for spin–orbit coupling or orbital contributions,28,29 but for Mn2+, L = 0 and μS+L = μs (eqn (3)–(4)). If Co2+ (d7, S = 3/2, L = 3), Ni2+ (d8, S = 1, L = 3), and Cu2+ (d9, S = 1/2, L = 2) were free ions with degenerate d orbitals, all would show orbital contributions to μeff. If a tetrahedral field splitting occurred, only Ni2+ and Cu2+ would have an orbital contribution. Instead, the large deviation from μs for Co2+ only is consistent with an octahedral splitting, where orbital contribution to the magnetic moment is quenched to first order for Ni2+ (t62ge2g) and Cu2+ (t62ge3g), but not Co2+ (t52ge2g).28 The smaller deviation from μs for Ni2+ and Cu2+ is then due to mixing in of excited states via spin–orbit coupling. Although tetrahedral and octahedral splitting are simplifications due to the complex solvation environment, the splitting suggests paramagnetic ions are approximately six-coordinate. The μeff values in Fig. 3 are also consistent with literature values for these ions.30 The BMS shift is therefore viable for measuring oxidation states of transition metals in battery electrolyte solutions.
Beyond the BMS shift, additional shifting of select peaks can be induced by coordination to paramagnetic metals via the hyperfine shift, which has both contact and pseudocontact (dipolar) components. To compare the reliability of susceptibilities obtained from EC and EMC peak shifts, NEt4BF4 was added to the electrolyte solution, since NEt4+ is not expected to coordinate to transition metal cations, and χM was measured for dissolved Mn(TFSI)2. Table 1 shows magnetic data obtained from comparing diamagnetic and Mn2+-containing electrolyte solutions, both with 0.1 M NEt4BF4.
| EC | EMC ethyl CH2 | EMC methyl | EMC ethyl CH3 | NEt4BF4 CH2 | |
|---|---|---|---|---|---|
| Δδ (ppm) | 0.339 | 0.326 | 0.325 | 0.316 | 0.315 |
| χ M (mL mol−1) | 0.0162 | 0.0155 | 0.0155 | 0.0151 | 0.0150 |
Peak shifts in Table 1 follow EC > EMC ethyl CH2 ∼ EMC methyl > EMC ethyl CH3 ∼ NEt4BF4 CH2. The shifts are similar, suggesting all resonances can be used to extract χM. However, the EMC ethyl CH3 resonance shows the smallest Δδ on addition of Mn2+ (presumably because it is furthest from the O atoms involved in metal coordination): this shift therefore provides the most accurate χM among the solvent peaks. Notably, because the EMC ethyl CH3 shift is similar to the NEt4BF4 CH2 shift, this shows NEt4BF4 addition permits measurement of the BMS shift. The addition of a non-coordinating agent may be beneficial in solutions where solvent peaks are affected by significant hyperfine shifts.
The major contribution to the Mn2+ hyperfine shifts likely arises from a contact shift, as high-spin d5 Mn2+ is isotropic28 so pseudocontact shifts are not possible.14 This is in contrast to Ni2+, Cu2+, and high-spin Co2+, which may have anisotropic magnetic susceptibilities and may undergo pseudocontact and contact shifts. Peak shifts may also occur due to differences in metal coordination and binding environments within the electrolytes, as observed for Li+ coordination in carbonate electrolyte solutions, where C and O sites (probed by 13C and 17O NMR) nearer to coordinated Li+ undergo larger changes in chemical shift on addition of LiPF6.31,32 Whether arising from a contact or deshielding effect, the larger shift for EC in Table 1 may indicate that Mn2+ preferentially coordinates to EC, consistent with previous computational work.33
The EMC ethyl CH3 peak shift was then used to characterise Mn and Ni dissolved from LiMn2O4, LiNiO2, and LiNi0.5Mn1.5O4 (Fig. 4). Cathode powders were stored with electrolyte and 0.1 vol% water (to generate HF) at 60 °C. (Mn2+ dissolution was also observed from LiMn2O4 stored without added water, ESI,† Fig. S2.) Concentrations from ICP-OES (see below/ESI†) were used to predict the total χ using the calibration in Fig. 1(i).
 | ||
| Fig. 4 χ and μeff for ions dissolved from (a) LiMn2O4, (b) LiNiO2, and (c) LiNi0.5Mn1.5O4. Predicted arises from Mn(TFSI)2 and Ni(TFSI)2χM values multiplied by ICP-OES concentrations; predicted μeff values are those reported in Fig. 3 for Mn(TFSI)2 and Ni(TFSI)2. | ||
In all cases, measurements of samples with dissolved Mn and Ni from cathode materials match measurements of samples with dissolved Mn(TFSI)2 and Ni(TFSI)2. The predictions would be inaccurate if the solutions contained dissolved metals with different oxidation states; e.g., Mn2+ has μs = 5.92 μB and μeff ≈ 5.65–6.10 μB;30 while Mn3+ has μs = 4.90 μB and μeff ≈ 4.90–5.00 μB.30 The BMS shift therefore shows that the metals dissolved from LiMn2O4, LiNiO2, and LiNi0.5Mn1.5O4 are exclusively Mn2+ and Ni2+. We note, however, that results may differ depending on the dissolution mechanism (for instance, in a full cell, a high-voltage mechanism may cause dissolution of different species).
If one species is dissolved and χM is known, concentration may also be determined (eqn (1)). For LiMn2O4 and LiNiO2, the peak shift predicts 6.11 mM Mn2+ and 20.31 mM Ni2+. ICP-OES of the NMR samples showed 6.03 ± 0.04 mM Mn and 19.98 ± 0.07 mM Ni, respectively. (For LiNi0.5Mn1.5O4 ICP-OES, see ESI†).
In short, we show the oxidation states of dissolved transition metals in battery electrolyte solutions can be determined from simple solution NMR spectra. Even in cases where one metal oxidation state is diamagnetic (e.g., Cu+, Co3+), the fraction of paramagnetic dissolution can be determined by using the susceptibility of the paramagnetic ion (e.g., Cu2+, Co2+) and solving for its concentration; any remaining metal concentration is then diamagnetic. This accessible method may be applied to any paramagnetic species, making it suitable for lithium-ion and beyond-lithium systems using any liquid electrolyte chemistry. Knowledge of dissolved oxidation states may clarify dissolution mechanisms and dictate strategies adopted to mitigate battery degradation.
This work was funded by the Faraday Institution (grant number FIRG001), the Natural Sciences and Engineering Research Council of Canada, and the Royal Society. JA thanks Evan Zhao for helpful discussions.
Conflicts of interest
There are no conflicts to declare.References
- O. C. Harris, S. E. Lee, C. Lees and M. Tang, J. Phys. Energy, 2020, 2(3), 032002 CrossRef CAS.
- C. Zhan, T. Wu, J. Lu and K. Amine, Energy Environ. Sci., 2018, 11(2), 243 RSC.
- J. A. Gilbert, I. A. Shkrob and D. P. Abraham, J. Electrochem. Soc., 2017, 164(2), A389 CrossRef CAS.
- W. Choi and A. Manthiram, J. Electrochem. Soc., 2006, 153(9), A1760 CrossRef CAS.
- Y. Terada, Y. Nishiwaki, I. Nakai and F. Nishikawa, J. Power Sources, 2001, 97–98, 420 CrossRef CAS.
- R. Sahore, D. C. O’Hanlon, A. Tornheim, C.-W. Lee, J. C. Garcia, H. Iddir, M. Balasubramanian and I. Bloom, J. Electrochem. Soc., 2020, 167(2), 020513 CrossRef CAS.
- A. Banerjee, Y. Shilina, B. Ziv, J. M. Ziegelbauer, S. Luski, D. Aurbach and I. C. Halalay, J. Am. Chem. Soc., 2017, 139(5), 1738 CrossRef CAS PubMed.
- Z. Li, A. D. Pauric, G. R. Goward, T. J. Fuller, J. M. Ziegelbauer, M. P. Balogh and I. C. Halalay, J. Power Sources, 2014, 272, 1134 CrossRef CAS.
- G. Zhou, X. Sun, Q.-H. Li, X. Wang, J.-N. Zhang, W. Yang, X. Yu, R. Xiao and H. Li, J. Phys. Chem. Lett., 2020, 11(8), 3051 CrossRef CAS PubMed.
- J. Wandt, A. Freiberg, R. Thomas, Y. Gorlin, A. Siebel, R. Jung, H. A. Gasteiger and M. Tromp, J. Mater. Chem. A, 2016, 4(47), 18300 RSC.
- D. Huang, C. Engtrakul, S. Nanayakkara, D. W. Mulder, S.-D. Han, M. Zhou, H. Luo and R. C. Tenent, ACS Appl. Mater. Interfaces, 2021, 13(10), 11930 CrossRef CAS PubMed.
- Y. Shilina, B. Ziv, A. Meir, A. Banerjee, S. Ruthstein, S. Luski, D. Aurbach and I. C. Halalay, Anal. Chem., 2016, 88(8), 4440 CrossRef CAS PubMed.
- R. Benedek, J. Phys. Chem. C, 2017, 121(40), 22049 CrossRef CAS.
- I. Bertini; C. Luchinat; G. Parigi and E. RaveraNMR of Paramagnetic Molecules: Applications to Metallobiomolecules and Models, Elsevier, 2016 Search PubMed.
- EPR Spectroscopy: Fundamentals and Methods, ed. Goldfarb, D., Stoll, S., John Wiley & Sons, Chichester, UK, 2018 Search PubMed.
- L. Hanf, J. Henschel, M. Diehl, M. Winter and S. Nowak, Electrophoresis, 2020, 41(9), 697–704 CrossRef CAS PubMed.
- L. Hanf, M. Diehl, L.-S. Kemper, M. Winter and S. Nowak, Electrophoresis, 2020, 41(18–19), 1549–1556 CrossRef CAS PubMed.
- L. Hanf, M. Diehl, L.-S. Kemper, M. Winter and S. Nowak, Electrophoresis, 2020, 41(18–19), 1568–1575 CrossRef CAS PubMed.
- D. H. Jang, Y. J. Shin and S. M. Oh, Dissolution of Spinel Oxides and Capacity Losses in 4 V Li/LixMn2O4 Cells, J. Electrochem. Soc., 1996, 143(7), 2204–2211 CrossRef CAS.
- L.-F. Wang, C.-C. Ou, K. A. Striebel and J.-S. Chen, J. Electrochem. Soc., 2003, 150(7), A905–A911 CrossRef CAS.
- J. Wang, M. M. Islam and S. W. Donne, Electrochim. Acta, 2021, 386, 138366 CrossRef CAS.
- R. Jung, F. Linsenmann, R. Thomas, J. Wandt, S. Solchenbach, F. Maglia, C. Stinner, M. Tromp and H. A. Gasteiger, J. Electrochem. Soc., 2019, 166(2), A378–A389 CrossRef CAS.
- S. Komaba, N. Kumagai and Y. Kataoka, Electrochim. Acta, 2002, 47(8), 1229–1239 CrossRef CAS.
- T. Joshi, K. Eom, G. Yushin and T. F. Fuller, J. Electrochem. Soc., 2014, 161(12), A1915–A1921 CrossRef.
- M. Koltypin, D. Aurbach, L. Nazar and B. Ellis, Electrochem. Solid-State Lett., 2006, 10(2), A40 CrossRef.
- D. F. Evans, J. Chem. Soc., 1959, 2003 RSC.
- C. Piguet, J. Chem. Educ., 1997, 74(7), 815 CrossRef CAS.
- S. F. A. Kettle, Coordination Compounds, Thomas Nelson and Sons, London, 1969 Search PubMed.
- K. Burger, Coordination Chemistry: Experimental Methods, The Butterworth Group, London, 1973 Search PubMed.
- B. N. Figgis and J. Lewis. The Magnetochemistry of Complex Compounds, In Modern Coordination Chemistry: Principles and Methods, Interscience Publishers, New York, 1960 Search PubMed.
- X. Bogle, R. Vazquez, S. Greenbaum, A. W. von Cresce and K. Xu, J. Phys. Chem. Lett., 2013, 4(10), 1664 CrossRef CAS PubMed.
- L. Yang, A. Xiao and B. L. Lucht, J. Mol. Liq., 2010, 154(2), 131 CrossRef CAS.
- C. Wang, L. Xing, J. Vatamanu, Z. Chen, G. Lan, W. Li and K. Xu, Nat. Commun., 2019, 10(1), 1 CrossRef PubMed.
Footnote |
| † Electronic supplementary information (ESI) available: Methods, Fig. 1 fits, μeff values, LiMn2O4 storage, LiNi0.5Mn1.5O4 ICP-OES. See DOI: https://doi.org/10.1039/d2cc06655f |
| This journal is © The Royal Society of Chemistry 2023 |