
Single-cell thermometry with a nanothermocouple probe†
Li-Qiu
Huang
,
Xin-Lei
Ding
,
Xiao-Tong
Pan
,
Zhong-Qiu
Li
*,
Kang
Wang
 and
Xing-Hua
Xia
*
and
Xing-Hua
Xia
*
State Key Laboratory of Analytical Chemistry for Life Science, School of Chemistry and Chemical Engineering, Nanjing University, Nanjing 210023, China. E-mail: zhongqiuli@nju.edu.cn; xhxia@nju.edu.cn
First published on 20th December 2022
Abstract
Herein, a nanopipette-based thermocouple probe that possesses high temperature resolution, rapid response, good reversibility and stability was constructed and successfully applied for single-cell temperature sensing. Different intracellular temperatures were observed in diverse types of cells, which reveals differences in their metabolism levels. Temperature responses of cancer and normal cells against various exogenous drugs were also demonstrated. The spatially resolved temperature sensing of three-dimensional cell culture models unveils the existence of their inner temperature gradients. This work would facilitate drug screening and disease diagnosis.
Temperature variation is an important indicator of various cellular activities,1–3 including cell division, enzymatic reactions, and gene expression. For example, the temperatures of cancer cells and inflammatory cells are reported to be higher than those of normal cells owing to the accelerated energy metabolism.4,5 Drugs and cold/hot exposure would also cause acute variations of intracellular temperature due to their impacts on inner biochemical reactions.6–8 Therefore, precise sensing of intracellular temperature is of great significance for the mechanistic understanding of cellular processes, which might promote the development of disease diagnosis and drug screening technologies.9
Luminescence thermometry has been widely adopted to determine the intracellular temperature.10–12 However, due to the requirement of introducing luminescent labels and the disturbance caused by the chemical and optical properties of the surrounding media, luminescence methods suffer from drawbacks such as limited temperature resolution, potential cytotoxicity, and poor anti-interference ability.13,14 Invasive electric thermometers based on thermocouple probes15,16 offer a good choice for solving these problems. A thermocouple probe can be formed by constructing an electrical junction at the tip using two different electrical conductors. Owing to the thermoelectric effect in this electrical junction, a temperature-dependent voltage is generated, which can be used for temperature sensing. The thermocouple probe shows rapid response and high sensitivity, and it is also label-free and unsusceptible to chemical interference. With a sensing tip down to sub-micrometer or even nanometer scale, the thermocouple probe can be inserted into the cell to detect the intracellular temperature. However, due to the difficulty of processing at this scale, most of the reported works are highly dependent on advanced microfabrication technology like nanolithography and microelectromechanical systems, which makes the fabricating process complex, time-consuming and costly, thus limiting this technique to be further applied in the field of single-cell temperature sensing.
Quartz/glass nanopipettes fabricated by pulling capillaries under laser irradiation have become solid candidates for intracellular analysis,17–20 which mainly benefits from their low fabrication costs, adjustable nanosized tips, and modifiable surfaces. The opening diameter of the tip can be tuned to a lowest value of 6 nm,21 which ensures minimal invasiveness and damage to the cells. In addition, the macro-sized end of the pipette can be connected with a 3D microcontroller to realize various operations including cell insertion and scanning. Through depositing different electrical materials on the inner and outer surfaces of the nanopipette, a nanosized heterojunction separated by the natural insulated quartz/glass wall can be formed at the tip region. This endows nanopipettes with a great potential in constructing nanothermocouple probes for single-cell temperature sensing.
Here, we construct a nanopipette-based thermocouple probe by separately depositing carbon and platinum on the inner and outer surfaces of a quartz nanopipette. These two thermoelectric materials are chosen for thier good thermoelectric property, stability, electric conductivity and biocompatibility. This nanothermocouple probe shows high temperature resolution, rapid response, good reversibility and stability. With these unique properties, this nanothermocouple probe has been further applied to study the intracellular temperature and its fluctuation under drug stimuli, as well as the temperature gradients inside three-dimensional cell culture models (3D-CCMs). The proposed strategy enables us to acquire temperature information at the single-cell level and offers a great potential prospect in drug screening, disease diagnosis and treatment.
The nanothermocouple probe was constructed by separately depositing carbon and platinum on the inner and outer surfaces of a quartz nanopipette (Fig. 1a and Fig. S1, ESI†). The inner carbon layer was prepared by butane pyrolysis with argon gas protection22,23 (Fig. S2, ESI†), while the outer platinum layer was prepared by a combination of electrodeposition24 and magnetron sputtering. Benefiting from the insulating nature of the quartz interlayer, a carbon-platinum (C/Pt) junction was formed at the tip of the nanopipette. Owing to the differentiated thermoelectric properties of carbon and platinum, a thermopotential can be generated when there is a temperature difference between the C/Pt junction located at the tip (i.e., the hot end) and the wiring point located at the tail end (i.e., the cold end). The hot end serves as the temperature sensing region and the cold end as the temperature reference region. The thermoelectric potential (ET) across a thermocouple can be calculated as:
| ET = ΔS·(Th − Tc) = ΔS·ΔT | (1) |
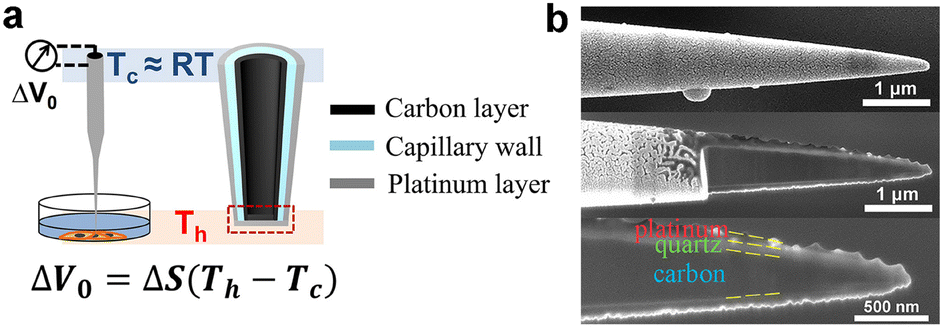 | ||
| Fig. 1 (a) Schematic diagram of a nanothermocouple probe for intracellular temperature sensing. (b) Side-view SEM images of the nanothermocouple probe (i) before and (ii) after FIB cutting; (iii) an enlarged view of the tip region in (ii). | ||
Fig. S4 (ESI†) shows the top-view scanning electron microscopy (SEM) images of the nanopipette at each fabrication stage. The inner diameter of a pristine nanopipette is about 145 nm (Fig. S4a, ESI†). The orifice of the nanopipette is blocked after internal carbon deposition (Fig. S4b, ESI†). A slightly enlarged tip end of approximately 180 nm in diameter was formed after the subsequent deposition of platinum (Fig. S4c, ESI†). In addition to SEM characterization, the size of the exposed carbon at the tip after butane pyrolysis deposition can also be characterized nondestructively according to the steady-state current by cyclic voltammetry (CV) (Fig. S5, ESI†). The side-view SEM image of the nanothermocouple probe is shown in Fig. 1b(i). Focused ion beam (FIB) was used to investigate its internal structure by cutting it apart in an axial direction. Three layers of carbon, quartz and platinum are clearly shown in the cross-sectional SEM image (Fig. 1b (ii) and (iii)), which is also verified by the energy dispersive spectroscopy (EDS) mapping results (Fig. S6, ESI†).
A calibration curve of the nanothermocouple probe in 10 mM phosphate buffered solution (PBS) has been constructed. As shown in Fig. 2a, ET linearly increases with ΔT, and ΔS of the nanothermocouple probe is calculated to be 1.99 μV K−1 according to the slope of the linear fitting curve. As shown in Fig. 2b, there is a good consistency between ΔS of five individually prepared nanothermocouple probes, showing an average value of 1.98 ± 0.07 μV K−1. This experimental value is slightly lower than the theoretical value (2.71 μV K−1) calculated by the difference between the Seebeck coefficients of carbon (−1.85 μV K−1) and platinum (−4.56 μV K−1).25,26 This is mainly attributed to the nanosized effect on the transport of electrons in the tip region27,28 and the thermal exchange between the hot and cold ends. Furthermore, the temperature resolution (δT) based on the calibration curve in Fig. 2a is calculated to be 0.08–0.24 °C (Fig. S7, ESI†).
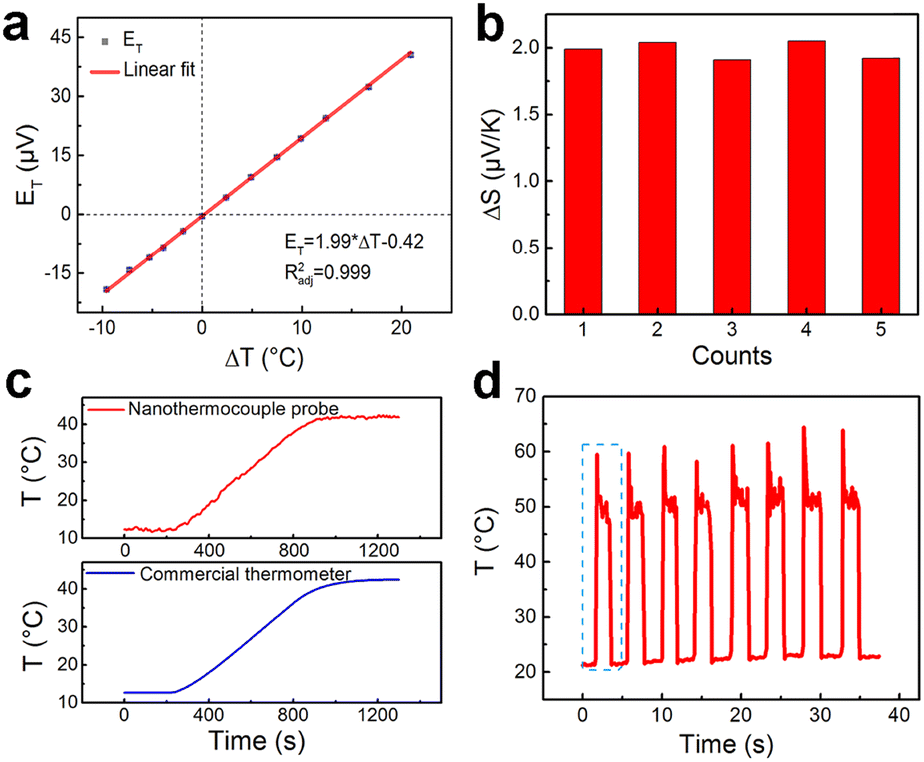 | ||
| Fig. 2 (a) Linear dependence of ET on ΔT for the nanothermocouple probe in 10 mM PBS. Each point was obtained by averaging fifty original data points. (b) Thermoelectric coefficients of five individually prepared nanothermocouple probes. (c) Synchronous temperature evolution curves of PBS as a function of time measured by the nanothermocouple probe and a commercial thermometer. (d) Temperature variation of the nanothermocouple probe caused by periodical laser heating of the tip. | ||
This nanothermocouple probe was then used to measure the temperature variations of PBS. It can be derived from eqn (1) that with the known ET, ΔS, and Tc, the temperature of the solution can be easily calculated as:
| Th = ET/ΔS + Tc | (2) |
As shown in Fig. 2c, the nanothermocouple probe responds synchronously with a commercial thermometer, which further confirms its temperature sensing ability. The readouts of the nanothermocouple probe at temperatures of 12 °C and 42 °C keep almost the same, respectively, while switching the temperature for seven cycles, showing a good reversibility (Fig. S8, ESI†). There is also no significant performance degradation during a continuous test of 9000 s (Fig. S9, ESI†), and the thermoelectric coefficient of the C/Pt nanothermocouple probe remains almost the same in six months (Fig. S10, ESI†), indicating the superior stability of the nanothermocouple probe.
In order to evaluate the response performance of the nanothermocouple probe, we monitored the temperature fluctuations caused by periodical laser heating of the tip. As shown in Fig. 2d, a highly reversible temperature response is observed. Moreover, as revealed by the magnified plot of the first cycle (Fig. S11, ESI†), the temperature change reaches 37.3 °C in 0.2 s, demonstrating the fast response of the nanothermocouple probe.
We also investigated the anti-interference capability of the nanothermocouple probe. As shown in Fig. S12 (ESI†), the calibration curves of the nanothermocouple probe hardly exhibit any difference between PBS containing various cellular ingredients. The corresponding thermoelectric coefficients also show good consistency (Fig. S12, inset, ESI†).
The nanothermocouple probe was then applied to single-cell temperature sensing. It was steered by a 3D micromanipulator to approach and penetrate a breast cancer cell (MCF7) (Fig. 3a), while the thermoelectric potential was recorded at the same time. As revealed in Fig. 3b (blue curve), a prompt increase of thermoelectric potential was observed when the nanothermocouple probe was inserted into a living MCF7 cell, indicating that the intracellular temperature is slightly higher than the extracellular temperature. While for a fixed MCF7 cell that shares almost the same morphology and ultrastructure with the living one, no obvious temperature change was observed (Fig. 3b, black curve), suggesting that the thermogenesis helps to maintain the intracellular temperature of living cells. Normal human liver cells (LO2) were also tested as a counterpart to the cancer cells (Fig. S13 and S14, ESI†). The average inside–outside temperature differences (ΔTcell) for living/fixed MCF7 cells and living LO2 cells are calculated to be 0.37 ± 0.13 °C, 0.00 ± 0.09 °C and 0.24 ± 0.07 °C, respectively, indicating different levels of metabolism in these cells (Fig. 3c). Furthermore, the well-maintained morphology of the MCF7 cell (Fig. S15, ESI†) and the characteristic fluorescent results of double staining experiment demonstrate the cellular viability and integrity during the test (Fig. S16, ESI†).
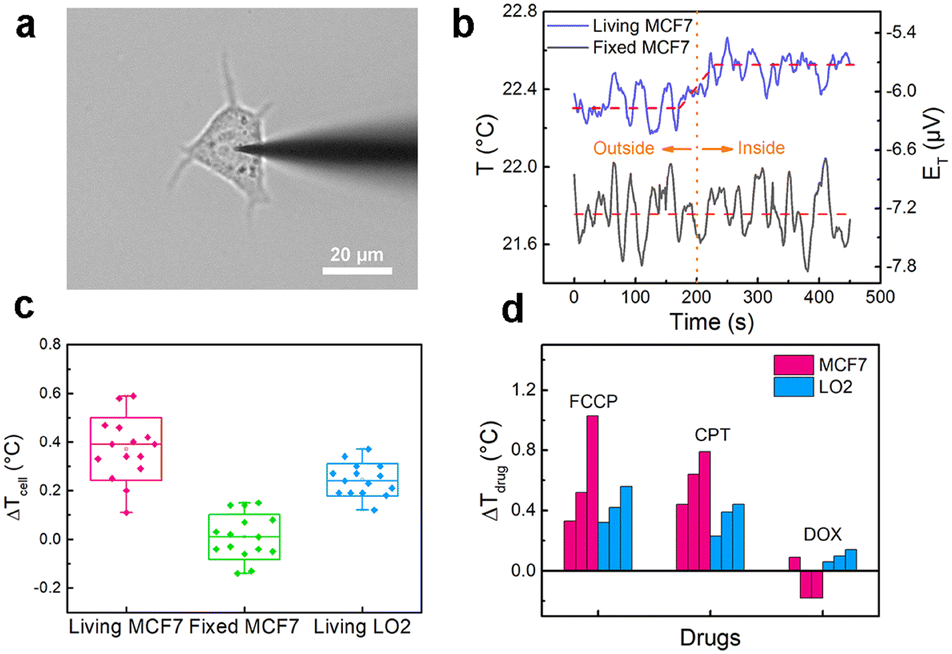 | ||
| Fig. 3 (a) Bright-field image of a MCF7 cell after the penetration of a nanothermocouple probe. (b) Temperature variations during the probe penetration into a living/fixed MCF7 cell. (c) Distribution of ΔTcell for MCF7 and LO2 cells from fifteen individual cells per group. (d) Distribution of ΔTdrug from three individual cells per group with the addition of FCCP, CPT and DOX for MCF7 and LO2 cells. | ||
The fluctuations of intracellular temperature induced by drug stimuli can partially reflect the treatment mechanisms.6,29 To gain insight into this aspect, we first treated the MCF7 cells with three kinds of drugs: carbonyl cyanide 4-(trifluoromethoxy) phenylhydrazone (FCCP), camptothecin (CPT) and doxorubicin (DOX). As shown in Fig. 3d and Fig. S17 (ESI†), the average temperature variations of MCF7 cells reach 0.63 ± 0.36 °C with the addition of FCCP. Since FCCP is an uncoupler of the oxidative phosphorylation process and can eliminate the gradient of proton concentration inside the mitochondria,30 an increased heat production is observed. Meanwhile, for CPT and DOX, two typical anti-cancer drugs, the average temperature variations are 0.62 ± 0.18 °C and −0.09 ± 0.16 °C, respectively (Fig. 3d and Fig. S18, S19, ESI†). These results are in accordance with the previous reports.6,7,15 The reason is that CPT and DOX respectively target DNA topoisomerase I and II that have different requirements for ATP.31,32 For comparison, the temperature responses of LO2 cells were also investigated. The average temperature variations of LO2 cells against FCCP, CPT and DOX are 0.43 ± 0.12 °C, 0.35 ± 0.11 °C and 0.10 ± 0.04 °C, respectively (Fig. 3d and Fig. S20–S22, ESI†). The intracellular temperature also shows an increase in the presence of FCCP and CPT, for these two drugs are non-targeted. In addition, the temperature variations of LO2 cells are smaller than those of cancer cells, which can be attributed to the weaker metabolism and proliferation vitalities of normal cells.
3D-CCMs with tumor-like structures and micro-environment have been proposed to bridge the gap between traditional two dimensional cell culture models (2D-CCMs) and in vivo systems, which is of great importance for simulating relevant physiology and disease states.33,34 It is widely accepted that the radial gradients of nutrient, gas, and pH existing in 3D-CCMs play key roles in determining their growth and physiological behaviors.35,36 However, temperature gradients in 3D-CCMs have seldom been studied.
Therefore, we performed nondestructive and in situ analysis of the temperature gradients in MCF7 3D-CCMs with the nanothermocouple probe. As shown in Fig. 4a, the temperatures at four different positions with various depths in a 3D-CCM were measured. Fig. 4b shows a typical temperature variation curve observed in the process of moving the probe tip from position 1 to position 4. It is revealed that the local temperature increases gradually from 23.27 °C at position 1 to 23.73 °C at position 4. The results of five different MCF7 3D-CCMs exhibit the similar temperature increase tendencies (Fig. 4c). The average temperature difference between position 1 and position 4 is 0.35 ± 0.07 °C. These experimental observations prove the existence of temperature gradients inside MCF7 3D-CCMs. This might be attributed to the unbalanced cellular metabolic pathways induced by the existence of inner oxygen gradients37,38 and the unevenly distributed thermal conductivities inside the hierarchically structured 3D-CCMs.
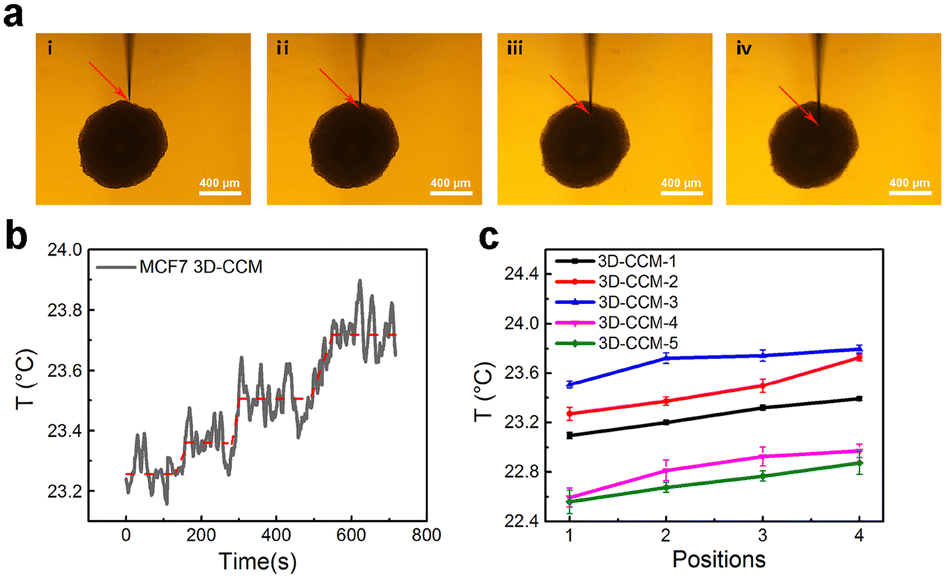 | ||
| Fig. 4 (a) Microscopy images of a nanothermocouple probe penetrated in four different positions of a MCF7 3D-CCM. (b) Temperature variation curve during the process of moving the probe tip from position 1 to position 4. (c) Local temperature at four different positions of five different MCF7 3D-CCMs (depth: 1 < 2 < 3 < 4). | ||
In summary, we have provided a facile method to construct a high-performance nanopipette-based thermocouple probe. The successful measurements of steady-state temperatures and temperature fluctuations of single MCF7 and LO2 cells demonstrate the capability of this probe for single-cell analysis. The detection of the localized temperature inside a MCF7 3D-CCM further reveals the spatially resolved temperature sensing ability of this nanothermocouple probe. This work unveils the feasibility of fabricating nanothermocouple probes with nanopipettes, which broadens the application of electric thermometers in the field of single-cell temperature sensing. Through further integrating with advanced manipulation techniques, this nanothermocouple probe can be utilized to study the cellular activities at subcellular scale, offering valuable information for the understanding of fundamentals of biological processes and action mechanisms of drugs.
We acknowledge the financial support from the National Key R&D Program of China (2017YFA0700500), the National Natural Science Foundation of China (22074061, 22204071), the Excellent Research Program of Nanjing University (ZYJH004), and the Natural Science Foundation of the Jiangsu Province (BK20220770).
Conflicts of interest
There are no conflicts to declare.Notes and references
- B. B. Lowell and B. M. Spiegelman, Nature, 2000, 404, 652–660 CrossRef CAS PubMed.
- V. M. Lauschke, C. D. Tsiairis, P. Francois and A. Aulehla, Nature, 2013, 493, 101–105 CrossRef PubMed.
- M. Elias, G. Wieczorek, S. Rosenne and D. S. Tawfik, Trends Biochem. Sci., 2014, 39, 1–7 CrossRef CAS PubMed.
- D. Lemos, T. Oliveira, L. Martins, V. R. de Azevedo, M. F. Rodrigues, L. A. Ketzer and F. D. Rumjanek, Front. Oncol., 2019, 9, 1–12 CrossRef PubMed.
- C. Li, S. Yan, W. N. He, S. Yang, J. F. Sun and N. Gu, IEEE Trans. Biomed. Eng., 2019, 66, 1898–1904 Search PubMed.
- C. Gota, K. Okabe, T. Funatsu, Y. Harada and S. Uchiyama, J. Am. Chem. Soc., 2009, 131, 2766–2767 CrossRef CAS PubMed.
- T. Sugimura, S. Kajimoto and T. Nakabayashi, Angew. Chem., Int. Ed., 2020, 59, 7755–7760 CrossRef CAS PubMed.
- I. Tasaki and T. Nakaye, Science, 1985, 227, 654–655 CrossRef CAS PubMed.
- J. Hou, X. Liu and S. B. Zhou, VIEW, 2021, 2, 20200023 CrossRef CAS.
- K. Okabe, N. Inada, C. Gota, Y. Harada, T. Funatsu and S. Uchiyama, Nat. Commun., 2012, 3, 1–9 Search PubMed.
- G. Kucsko, P. C. Maurer, N. Y. Yao, M. Kubo, H. J. Noh, P. K. Lo, H. Park and M. D. Lukin, Nature, 2013, 500, 54–58 CrossRef CAS PubMed.
- J. S. Donner, S. A. Thompson, M. P. Kreuzer, G. Baffou and R. Quidant, Nano Lett., 2012, 12, 2107–2111 CrossRef CAS PubMed.
- J. J. Zhou, B. del Rosal, D. Jaque, S. Uchiyama and D. Y. Jin, Nat. Methods, 2020, 17, 967–980 CrossRef CAS PubMed.
- Y. N. Wang, B. Li, T. T. Tian, Y. J. Liu, J. X. Zhang and K. Qian, Trends Anal. Chem., 2022, 149, 116565 CrossRef CAS.
- C. L. Wang, R. Z. Xu, W. J. Tian, X. L. Jiang, Z. Y. Cui, M. Wang, H. M. Sun, K. Fang and N. Gu, Cell Res., 2011, 21, 1517–1519 CrossRef PubMed.
- M. C. Rajagopal, J. W. Brown, D. Gelda, K. V. Valavala, H. Wang, D. A. Llano, R. Gillette and S. Sinha, Commun. Biol., 2019, 2, 1–6 CrossRef CAS PubMed.
- H. L. Liu, Q. C. Jiang, J. Pang, Z. Y. Jiang, J. Cao, L. N. Ji, X. H. Xia and K. Wang, Adv. Funct. Mater., 2018, 28, 7 Search PubMed.
- B. P. Nadappuram, P. Cadinu, A. Barik, A. Ainscough, M. J. Devine, M. Kang, J. Gonzalez-Garcia, J. T. Kittler, K. R. Willison, R. Vilar, P. Actis, B. Wojciak-Stothard, S. H. Oh, A. P. Ivanov and J. B. Edel, Nat. Nanotechnol., 2019, 14, 80–88 CrossRef CAS PubMed.
- R. R. Pan, K. K. Hu, R. Jia, S. A. Rotenberg, D. C. Jiang and M. V. Mirkin, J. Am. Chem. Soc., 2020, 142, 5778–5784 CrossRef CAS PubMed.
- T. N. Gao, X. Y. Gao, C. Xu, M. L. Wang, M. L. Chen, J. H. Wang, F. R. Ma, P. Yu and L. Q. Mao, Anal. Chem., 2021, 93, 2942–2949 CrossRef CAS PubMed.
- M. Holub, M. Adobes-Vidal, A. Frutiger, P. M. Gschwend, S. E. Pratsinis and D. Momotenko, ACS Nano, 2020, 14, 7358–7369 CrossRef CAS PubMed.
- M. H. Wang, J. J. Liu, X. Liang, R. Y. Gao, Y. M. Zhou, X. Nie, Y. Shao, Y. Guan, L. M. Fu, J. P. Zhang and Y. H. Shao, Anal. Chem., 2021, 93, 4528–4535 CrossRef CAS PubMed.
- G. J. Lan, J. Yang, R. P. Ye, Y. Boyjoo, J. Liang, X. Y. Liu, Y. Li, J. Liu and K. Qian, Small Methods, 2021, 5, 2001250 CrossRef CAS PubMed.
- M. Nebel, S. Grützke, N. Diab, A. Schulte and W. Schuhmann, Angew. Chem., Int. Ed., 2013, 52, 6335–6338 CrossRef CAS PubMed.
- C. Offenzeller, M. Knoll, B. Jakoby and W. Hilber, Sensors, 2019, 19(2), 403 CrossRef PubMed.
- J. W. Dally, W. F. Riley and K. G. McConnell, Instrumentation for Engineering Measurements, Wiley, New York, 1984 Search PubMed.
- X. Zhang, H. Q. Xie, M. Fujii, H. Ago, K. Takahashi, T. Ikuta, H. Abe and T. Shimizu, Int. J. Thermophys., 2007, 28, 33–43 CrossRef.
- M. C. Salvadori, A. R. Vaz, F. S. Teixeira, M. Cattani and I. G. Brown, Appl. Phys. Lett., 2006, 88, 3 CrossRef.
- J. X. Ding, J. Li, F. Yang and N. Gu, Anal. Chem., 2020, 92(4), 3270–3275 CrossRef CAS PubMed.
- P. G. Heytler and W. W. Prichard, Biophys. Res. Commun., 1962, 7, 272–275 CrossRef CAS PubMed.
- A. Mordente, E. Meucci, G. E. Martorana, D. Tavian and A. Silvestrini, Curr. Med. Chem., 2017, 24, 1607–1626 CrossRef CAS PubMed.
- J. Yan, M. O. Magnasco and J. F. Marko, Nature, 1999, 401, 932–935 CrossRef CAS PubMed.
- F. Pampaloni, E. G. Reynaud and E. H. K. Stelzer, Nat. Rev. Mol. Cell Biol., 2007, 8, 839–845 CrossRef CAS PubMed.
- M. A. G. Barbosa, C. P. R. Xavier, R. F. Pereira, V. Petrikaite and M. H. Vasconcelos, Cancers, 2022, 14, 30 Search PubMed.
- E. Curcio, S. Salerno, G. Barbieri, L. De Bartolo, E. Drioli and A. Bader, Biomaterials, 2007, 28, 5487–5497 CrossRef CAS PubMed.
- L. E. Jamieson, V. L. Camus, P. O. Bagnaninchi, K. M. Fisher, G. D. Stewart, W. H. Nailon, D. B. McLaren, D. J. Harrison and C. J. Campbell, Nanoscale, 2016, 8, 16710–16718 RSC.
- R. I. Dmitriev, A. V. Zhdanov, Y. M. Nolan and D. B. Papkovsky, Biomaterials, 2013, 34, 9307–9317 CrossRef CAS PubMed.
- J. Jenkins, S. M. Borisov, D. B. Papkovsky and R. I. Dmitriev, Anal. Chem., 2016, 88, 10566–10572 CrossRef CAS PubMed.
Footnote |
| † Electronic supplementary information (ESI) available. See DOI: https://doi.org/10.1039/d2cc06110d |
| This journal is © The Royal Society of Chemistry 2023 |