Detection of interaction between an RNA aptamer and its target compound in living human cells using 2D in-cell NMR†
Omar
Eladl‡
 abc,
Yudai
Yamaoki‡
 ab,
Keiko
Kondo
 a,
Takashi
Nagata
 *ab and
Masato
Katahira
 *ab
*ab
aInstitute of Advanced Energy, Kyoto University, Gokasho, Uji, Kyoto 611-0011, Japan. E-mail: katahira.masato.6u@kyoto-u.ac.jp; nagata.takashi.6w@kyoto-u.ac.jp
bGraduate School of Energy Science, Kyoto University, Yoshida-hommachi, Sakyo-ku, Kyoto 606-8501, Japan
cFaculty of Pharmacy, Zagazig University, Zagazig 44519, Egypt
First published on 29th November 2022
Abstract
We introduced an isotopically labeled RNA aptamer for HIV-1 Tat prepared by E. coli transcription into HeLa cells. We successfully recorded the first heteronuclear 2D in-cell NMR spectra, which makes it possible to study the interaction of the RNA aptamer with argininamide in living human cells with higher resolution.
RNA aptamers are oligonucleotides that tightly bind to a target molecule such as a metabolite,1 peptide,2 protein,3 or live cell4 with high affinity. Systematic Evolution of Ligands by Exponential enrichment (SELEX) is commonly used to obtain RNA aptamers,5 which are reportedly applied for nucleic acid drugs,6 drug delivery systems,7 biosensors,8 artificial riboswitches,9 and intracellular molecular imaging probes.10 Many of these RNA aptamers function in the living cells, targeting endogenous molecules.
Compared to in vitro conditions, intracellular conditions are highly crowded with macromolecules. This crowdedness may cause differences in the structures and interactions of RNA aptamers between intracellular and in vitro conditions. The characterization of the structures and interactions of RNA aptamers under intracellular conditions at atomic resolution is important for developing novel drugs and molecular tools against intracellular molecules.
To investigate the structures and interactions of RNA in living cells, in-cell NMR is a powerful tool. In previous studies, in-cell NMR provided direct evidence for the formation of various nucleic acid structures,11 such as hairpin,12 i-motif,13,14 G-quadruplex,15,16 Z-DNA,17 and triplex structures,18 in living human cells. The intermolecular interactions of nucleic acids with DNA minor-groove binder,19 small compounds targeting G-quadruplexes,20,21 small compounds targeting T-T mismatches,19 and ligand of riboswitch22 were detected by in-cell NMR in living Xenopus laevis (X. laevis) oocytes and human cells. The interaction of mRNA with antisense DNA was also detected.23
2D NMR spectra, such as 1H–13C and 1H–15N heteronuclear multiple quantum correlation (HMQC) ones, of 13C- or 15N-labeled RNA are very useful because of their higher resolution compared to 1D NMR spectra. However, so far, 2D HMQC spectra under in-cell conditions have only been reported for X. laevis oocytes i.e., not for living human cells. The reasons are as follows. The efficiency of incorporation of nucleic acids into human cells is generally much lower than that into X. laevis oocytes, therefore a larger amount of nucleic acids is needed to incorporate them into human cells. Additionally, preparation of isotopically labeled nucleic acids is more expensive than that of non-labeled ones.
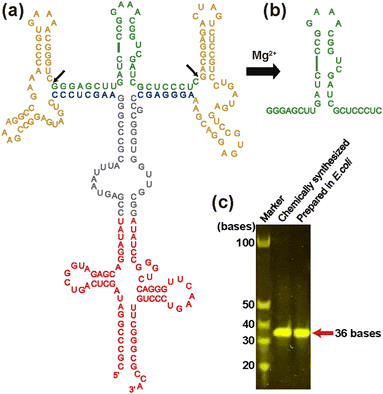
To obtain milligram quantities of isotopically labeled RNA for in-cell NMR experiments cost-effectively, here, we adopted a previously reported tRNA-scaffold system24 (Fig. 1). In this system, the RNA of interest is transcribed in E. coli as a chimeric transcript, in which the RNA of interest being inserted into tRNA via two hammerhead (HH) ribozymes. tRNA protects entire RNA from degradation by RNases, while HH ribozymes, which are activated by magnesium ions, enable the RNA of interest to be cleaved from the tRNA-scaffold during the purification procedure.
Previously, we obtained an RNA aptamer that strongly binds to the trans-activator of transcription (Tat) protein of human immunodeficiency virus-1 (HIV-1), and elucidated the binding mechanism.2,25,26 The RNA aptamer for Tat exhibits about 100 times higher affinity to Tat than the native trans-activation response element (TAR) located in the long terminal repeat of HIV-1 genome RNA. The interaction between Tat protein and TAR RNA plays a crucial role in HIV-1 replication.27 Therefore, an RNA aptamer for Tat that can interfere with the Tat-TAR interaction could have therapeutic potential. As a step toward an application, we performed in this study, the first 2D 1H–13C and 1H–15N HMQC in-cell NMR measurements of the RNA aptamer-ligand complex in living human cells using isotopically labeled RNA aptamer for Tat and investigated the RNA aptamer-ligand interaction.
In this study, we used TA_36 of 36 nt in length i.e., an RNA aptamer for Tat that has extra UC bases at the 3′-end of the aforementioned original RNA aptamer sequence for the adjustment of the cleavage by HH ribozymes in the tRNA-scaffold system. Our construct contains the tRNA portion (Fig. 1a, red), two HH ribozymes (Fig. 1a, yellow), and TA_36 (Fig. 1a, green). The cleaved TA_36 (Fig. 1b) was purified by anion exchange chromatography. The purified 13C, 15N-labeled TA_36 is shown in Fig. 1c.
RNA aptamers for Tat reportedly bind to the arginine-rich region of Tat (amino acid residues 49 to 61; RKKRRQRRRPPQG). As a minimal model compound, argininamide is known to emulate the arginine-rich region of Tat.2,26 Therefore, for our investigation of the intermolecular interaction by in-cell NMR, we used 13C, 15N-labeled TA_36 and non-labeled argininamide.
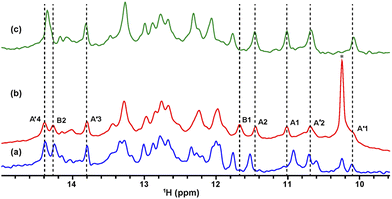
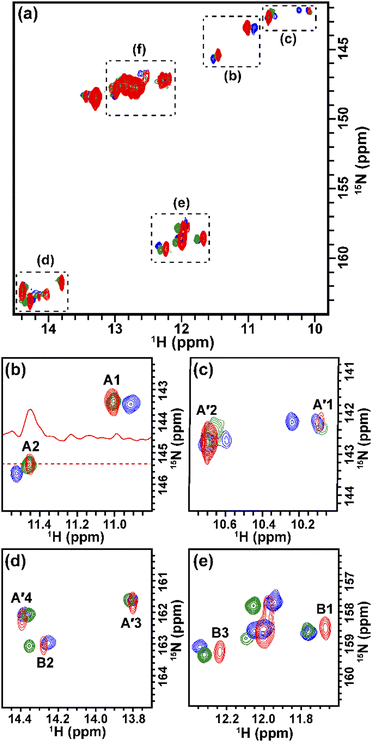
Under in vitro conditions, titration of argininamide against TA_36 caused gradual chemical shift changes of the imino proton signals of TA_36 (Fig. 2a, c and 3, blue and green and Fig. S1, ESI†), which indicate the binding process to be fast exchange on the NMR chemical shift time scale. The chemical shift changes saturated at a plateau around at a ratio of TA_36![[thin space (1/6-em)]](https://www.rsc.org/images/entities/char_2009.gif) :
:![[thin space (1/6-em)]](https://www.rsc.org/images/entities/char_2009.gif) argininamide = 1
argininamide = 1![[thin space (1/6-em)]](https://www.rsc.org/images/entities/char_2009.gif) :
:![[thin space (1/6-em)]](https://www.rsc.org/images/entities/char_2009.gif) 40, suggesting the chemical shifts to be those for the complex form. Knowing the chemical shifts for the free and complex forms of TA_36, we used them as references to evaluate the signals obtained through in-cell NMR measurements.
40, suggesting the chemical shifts to be those for the complex form. Knowing the chemical shifts for the free and complex forms of TA_36, we used them as references to evaluate the signals obtained through in-cell NMR measurements.
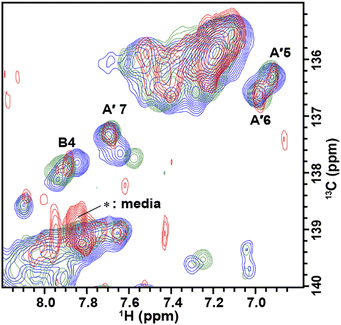
The solution containing 1 mM 13C, 15N-labeled TA_36 and 4 mM non-labeled argininamide was mixed with living HeLa cells, followed by electroporation for introduction. Then 1D 1H, 2D 1H–15N HMQC, and 2D 1H–13C HMQC in-cell NMR spectra were acquired. These spectra obtained under in-cell and in vitro conditions are compared in Fig. 2–4 and Fig. S2 (ESI†). In Fig. 2 and 3, the chemical shift regions of the imino groups of guanine H1/N1 and uracil H3/N3 are shown. In Fig. 4, the chemical shift regions of H8/C8 for purine bases, and H6/C6 for pyrimidine bases are shown.
We divided the signals of the in-cell spectra into three categories, A, A′, and B. The peaks of categories A, A′, and B are given the numbers A1 and A2, A′1 – A′7, and B1 – B4, respectively (Fig. 2, 3 and 4).
The A1 and A2 signals (Fig. 2b and 3b) in the in-cell spectra were present with the same chemical shifts in in vitro spectra of the TA_36: argininamide complex, suggesting that the TA_36 is in the bound state in living cells.
The A′1 – A′7 signals (Fig. 2b, 3c, d and 4) in the in-cell spectra were present with the same chemical shifts in in vitro spectra of both the free and complex form of TA_36: argininamide. The chemical shifts of these signals were the same for both the free and complex forms. These results are consistent with the observation of the A1 and A2 signals, which indicates that the TA_36 was in the bound state in living cells.
The corresponding signals of B1 to B4 in the in-cell NMR spectra seemed to be present in the in vitro spectra of either the free or complex form. However, the chemical shifts for in-cell NMR spectra do not coincide with those for in vitro spectra of either the free or complex form. These results suggest that the structure of TA_36 in the complex form under in-cell conditions is slightly different from that under in vitro conditions. A similar observation was reported for the structures of a protein under in vitro and in-cell conditions, which were slightly different.28 The concentrations of various ions such as magnesium ion may differ between in-cell and in vitro conditions. These differences could cause slight changes in structure of TA_36 in the complex form with argininamide.
For the in-cell NMR spectroscopy of the nucleic acids introduced into living cells, we used to record the 1D 1H NMR spectra and looked at the chemical shift region for imino protons (10–15 ppm) because almost all the signals observed in that region originated from the introduced nucleic acids.11,12 It is also well known that an imino proton spectrum is useful for deducing a scheme of base pairing.29 In this study, however, we prepared and introduced the isotopically labeled TA_36, and measured 2D 1H–15N HMQC and 2D 1H–13C HMQC in-cell NMR spectra. This has the following advantages. Firstly, the signals of the introduced nucleic acids can be clearly distinguished from those of the intracellular endogenous molecules and/or of the molecules in the medium. For example, in the 1D 1H in-cell NMR spectrum, the A′1 signal of the introduced nucleic acids was buried under the signal of tryptophan in the system (cells and medium) (Fig. 2b). On the other hand, the A′1 signal was distinguishable from the tryptophan signal and unambiguously identified in the 2D 1H–15N HMQC in-cell NMR spectrum (Fig. 3c), because the non-labeled tryptophan did not give a signal in this 2D spectrum. Similarly, the 6.8–8.2 ppm region of the 1D 1H in-cell NMR spectrum generally contains a vast number of signals of the molecules in the system, thereby, it was impossible to identify the signals of the introduced nucleic acids. On the other hand, the corresponding 2D 1H–13C HMQC in-cell NMR spectrum (Fig. 4) mostly exhibited the signals originating from the introduced nucleic acids. Thus, the signals of the introduced nucleic acids can be distinguished from those of the system and easily identified (Fig. 4). Secondly, in the 2D 1H–15N HMQC and 2D 1H–13C HMQC in-cell NMR spectra, the resolution of the signals of the introduced nucleic acids were improved as compared in the 1D 1H in-cell NMR spectrum. For example, the B3 signal (1H: ca. 12.25 ppm, 15N: ca.159.2 ppm) in Fig. 3e and the two signals (1H: ca. 12.20–12.28 ppm, 15N: ca.147.2 ppm) in Fig. 3a, box f of the 2D 1H–15N HMQC in-cell NMR spectrum are separately observed and thus distinguishable from each other due to the difference in the 15N chemical shift value, while such a distinction had been impossible in the 1D 1H in-cell NMR spectrum because these signals share the same 1H chemical shift values, ca.12.20–12.28 ppm. Likewise, in the 2D 1H–13C HMQC in-cell NMR spectrum, the A′7 signal (1H: ca. 7.70 ppm, 13C: ca.137.4 ppm) was separated and distinguishable from the two signals (1H: ca. 7.65–7.74 ppm, 13C: ca.139.0 ppm) (Fig. 4 and Fig. S2, ESI†) due to the difference in the 13C chemical shift value, while such a distinction had been impossible in the 1D 1H in-cell NMR spectrum as these signals share the same 1H chemical shift values, 7.65–7.74 ppm. Thirdly, the 15N and 13C chemical shift values of the introduced nucleic acids could be used as new sources to monitor the state of the nucleic acids, in addition to the 1H chemical shift values.
Although interaction between RNA aptamer and its target molecule in living human cells can be detected also by using the fluorescence-labeled RNAs, the in-cell NMR technique provides further insights on the RNA aptamer in complex with its target molecule such as the binding site and the mode of interaction. In the present study, we obtained milligram quantities of isotopically labeled RNA from E. coli utilizing a tRNA-scaffold system, which enabled us to acquire the first 2D in-cell NMR spectra of RNA in living human cells. We detected in living human cells a complex of the RNA aptamer for Tat with argininamide that is the simplest model compound of HIV-1 Tat protein. Heteronuclear 2D in-cell NMR experiments were applied for the first time in interaction studies involving nucleic acids in living human cells. The heteronuclear 2D in-cell NMR spectra clearly distinguished the signals of the introduced nucleic acids from those of the intracellular endogenous molecules and/or those of the molecules in the medium. They also improved the signals resolution of the introduced nucleic acids. The high resolution 2D in-cell NMR spectra of RNA in the complex form with its target molecule enables direct evaluation of the behavior of functional RNAs in the living human cells.
This work was supported by grants JSPS KAKENHI, Japan (20H03192, 20K21477, 21H05519, and 22H05596 to M. K., 17H05878 and 20K06524 to T. N., and 19K16054 and 22K05314 to Y. Y.), AMED Japan (20fk0410027 and JP22fk0410048 to M. K., and JP22ak0101097 to T. N.), the Collaborative Research Program of the Institute for Protein Research, Osaka University (NMRCR-22-05 to T. N.), and the Collaboration Program of the Laboratory for Complex Energy Processes, Institute of Advanced Energy, Kyoto University to Y. Y.
Conflicts of interest
There are no conflicts to declare.Notes and references
- F. Jiang, R. Kumar and R. Jones, Nature, 1996, 382, 183–186 CrossRef CAS PubMed
.
- A. Matsugami, S. Kobayashi, K. Ouhashi, S. Uesugi, R. Yamamoto, K. Taira, S. Nishikawa, P. K. Kumar and M. Katahira, Structure, 2003, 11, 533–545 CrossRef CAS PubMed
.
- P.-T. Urvil, N. Kakiuchi, D. M. Zhou, K. Shimotohno, P. K. Kumar and S. Nishikawa, Eur. J. Biochem., 1997, 248, 130–138 CrossRef CAS PubMed
.
- D. Shangguan, L. Meng, Z. Charles Cao, Z. Xiao, X. Fang, Y. Li, D. Cardona, R. P. Witek, C. Liu and W. Tan, Anal. Chem., 2008, 80, 721–728 CrossRef CAS PubMed
.
- C. Tuerk and L. Gold, Science, 1990, 249, 505–510 CrossRef CAS
.
- E. Dausse, S. Da Rocha Gomes and J. J. Toulmé, Curr. Opin. Pharmacol., 2009, 9, 602–607 CrossRef CAS
.
- K. Paunovska, D. Loughrey and J.-E. Dahlman, Nat. Rev. Genet., 2022, 23, 265–280 CrossRef CAS
.
- S. Findeiß, M. Etzel, S. Will, M. Mörl and P. E. Stadler, Sensors, 2017, 17, 1990 CrossRef
.
- C. Schneider and B. Suess, Methods, 2016, 97, 44–50 CrossRef CAS PubMed
.
- X. Liu, T. Wang, Y. Wu, Y. Tan, T. Jiang, K. Li, B. Lou, L. Chen, Y. Liu and Z. Liu, Biosens. Bioelectron., 2022, 208, 114231 CrossRef CAS PubMed
.
- Y. Yamaoki, T. Nagata, T. Sakamoto and M. Katahira, Biophys. Rev., 2020, 12, 411–417 CrossRef CAS
.
- Y. Yamaoki, A. Kiyoishi, M. Miyake, F. Kano, M. Murata, T. Nagata and M. Katahira, Phys. Chem. Chem. Phys., 2018, 20, 2982–2985 RSC
.
- S. Dzatko, M. Krafcikova, R. Hänsel-Hertsch, T. Fessl, R. Fiala, T. Loja, D. Krafcik, J.-L. Mergny, S. Foldynova-Trantirkova and L. Trantirek, Angew. Chem., Int. Ed., 2018, 57, 2165–2169 CrossRef CAS
.
- M. Cheng, D. Qiu, L. Tamon, E. Ištvánková, P. Víšková, S. Amrane, A. Guédin, J. Chen, L. Lacroix, H. Ju, L. Trantírek, A.-B. Sahakyan, J. Zhou and J.-L. Mergny, Angew. Chem., Int. Ed., 2021, 60, 10286–10294 CrossRef CAS PubMed
.
- H.-L. Bao, H.-S. Liu and Y. Xu, Nucleic Acids Res., 2019, 47, 4940–4947 CrossRef CAS
.
- H.-L. Bao and Y. Xu, Chem. Commun., 2020, 56, 6547–6550 RSC
.
- H.-L. Bao, T. Masuzawa, T. Oyoshi and Y. Xu, Nucleic Acids Res., 2020, 48, 7041–7051 CAS
.
- T. Sakamoto, Y. Yamaoki, T. Nagata and M. Katahira, Chem. Commun., 2021, 57, 6364–6367 RSC
.
- M. Krafcikova, S. Dzatko, C. Caron, A. Granzhan, R. Fiala, T. Loja, M.-P. Teulade-Fichou, T. Fessl, R. Hänsel-Hertsch, J.-L. Mergny, S. Foldynova-Trantirkova and L. Trantirek, J. Am. Chem. Soc., 2019, 141, 13281–13285 CrossRef CAS
.
- G. F. Salgado, C. Cazenave, A. Kerkour and J.-L. Mergny, Chem. Sci., 2015, 6, 3314–3320 RSC
.
- D. Krafčík, E. Ištvánková, S. Džatko, P. Víšková, S. Foldynová-Trantírková and L. Trantírek, Int. J. Mol. Sci., 2021, 22, 6042 CrossRef PubMed
.
- P. Broft, S. Dzatko, M. Krafcikova, A. Wacker, R. Hänsel-Hertsch, V. Dçtsch, L. Trantirek and H. Schwalbe, Angew. Chem., Int. Ed., 2021, 60, 865–872 CrossRef CAS
.
- J. Schlagnitweit, S. F. Sandoz, A. Jaworski, I. Guzzetti, F. Aussenac, R. J. Carbajo and E. Chiarparin, ChemBioChem, 2019, 20, 2474–2478 CrossRef CAS
.
- F. H. T. Nelissen, E. H. P. Leunissen, L. Van de Laar, M. Tessari, H. A. Heus and S. S. Wijmenga, Nucleic Acids Res., 2012, 13, e102 CrossRef PubMed
.
- R. Yamamoto, M. Katahira, S. Nishikawa, T. Baba, K. Taira and P. K. Kumar, Genes Cells, 2000, 5, 371–388 CrossRef CAS
.
- K. Harada, S. Aoyama, A. Matsugami, P. K. Kumar, M. Katahira, N. Kato and J. Ohkanda, ChemBioChem, 2014, 15, 794–798 CrossRef CAS PubMed
.
- A. G. Fisher, M. B. Feinberg, S. F. Harper, L. M. Marselle, G. Reyes, M. A. Gonda, A. Aldovini, C. Debouk and R. C. Gallo, Nature, 1986, 320, 367–371 CrossRef CAS
.
- T. Tanaka, T. Ikeya, H. Kamoshida, Y. Suemoto, M. Mishima, M. Shirakawa, P. Guntert and Y. Ito, Angew. Chem., Int. Ed., 2019, 58, 7284–7288 CrossRef CAS
.
-
T. Sakamoto, M. Otsu and G. Kawai, Experimental Approaches of NMR Spectroscopy, NMR Studies on RNA, The Nuclear Magnetic Resonance Society of Japan, Springer, Singapore, 2018, pp. 439–459 Search PubMed
.
Footnotes |
| † Electronic supplementary information (ESI) available: (Fig. S1) Imino proton spectrum of an RNA aptamer for HIV-1 Tat (TA_36) at each molar ratio of [(TA_36]:[argininamide] acquired in transport buffer (TB). (Fig. S2) 2D in-cell 1H-13C HMQC full spectra of TA_36. Materials and methods. See DOI: https://doi.org/10.1039/d2cc05576g |
| ‡ Omar Eladl and Yudai Yamaoki contributed equally to this work. |
| This journal is © The Royal Society of Chemistry 2023 |


