 Open Access Article
Quantitative mass spectrometric analysis of hepatocellular carcinoma biomarker alpha-fetoprotein†
Chen-Chun
Chen‡
ab,
Han-Wen
Huang‡
b,
Bo-Rui
Chen
b and
Chi-Huey
Wong
 *bc
*bc
aDepartment of Chemistry, National Taiwan University, Taipei, Taiwan
bGenomic Research Center, Academia Sinica, Taipei, Taiwan
cDepartment of Chemistry, The Scripps Research Institute, 10550 N. Torrey Pines Rd., La Jolla, CA 92037, USA. E-mail: wong@scripps.edu
First published on 9th October 2023
Abstract
Serum alpha-fetoprotein (AFP) has been used as a marker for the diagnosis of hepatocellular carcinoma (HCC) and its core fucosylation is associated with the early stage of HCC. However, current methods for the detection of AFP with core fucose are not highly accurate for early diagnosis. In this study, we established an enzyme-assisted mass spectrometric method for the quantitative analysis of AFP/core fucose with high specificity and sensitivity. We employed endoglycosidase treatment of AFP to improve the biomarker analysis. The accuracy and precision are within the US FDA-suggested value, and a good linearity (r2 = 0.9930) and a detection limit of 15.6 ng mL−1 can be achieved.
Introduction
Hepatocellular carcinoma (HCC) is the most common type of primary liver cancer and the third most common cause of cancer death worldwide.1 Its incidence is geographically varied, with the highest in Asia and South Africa, but it is also gradually rising in the US, Europe and other regions.2,3 Patients with underlying liver diseases, such as liver fibrosis and liver cirrhosis, are at high risk for development of HCC.4 With the advanced technologies of liver transplantation and surgical resection, a favourable outcome could be expected if HCC diagnosis is carried out at its early stage.5,6 Screening of serum biomarkers has been used for the early detection of diseases; however, it requires the development of a robust analytical method with high throughput capability and high sensitivity for the quantification and verification of protein biomarker candidates. Serum alpha-fetoprotein (AFP) has been widely used as a diagnostic and prognostic marker for HCC, and monoclonal antibodies against AFP have been commonly used for the detection of AFP. However, up to 40% false-negative rate occurred for the diagnosis of HCC in the early stage.7 In addition, increased core fucosylation has been reported to be associated with various cancers, including pancreatic cancer, lung cancer and liver cancer.8–10 Thus, Lens culinaris agglutinin (LCA)-reactive alpha-fetoprotein (AFP-L3), where LCA binds to the core-fucose, has been proposed as an alternative marker with higher specificity for HCC diagnosis.11,12 In the 1990s, the assay for AFP-L3 was based on lectin affinity electrophoresis and Western blotting, which was tedious with long turnaround times.13 Later, an automated assay with LCA and two specific monoclonal antibodies for simultaneously measuring the concentration of AFP-L3 and total AFP was developed for clinical use in Japan.14–16 A new generation device was developed by the same group based on an on-chip electrokinetic reaction and separation by affinity electrophoresis.17 It showed higher sensitivity than conventional methods, which made low concentration detection possible.17 Several groups adopted this method and analyzed the correlation between AFP and HCC for early detection or prognosis purpose.18–20 However, since the core fucose is very close to the protein backbone and is shielded by the rest of the glycans in the sugar chain, the interaction of LCA and core-fucose may be hindered, thereby affecting the detection specificity and sensitivity. Mass spectrometry has been used routinely in measuring protein markers, with a rapid, cost-effective process.21,22 However, quantification of intact glycopeptides is still technically challenging.23 Since AFP in HCC patients is core-fucosylated, we have developed an enzyme-assisted targeted quantification method to further differentiate patients from normal persons with direct glycopeptide monitoring. From the method development perspective, we evaluated the merits of the proposed analytical method based on the guideline from US Food and Drugs Administration (US FDA) for bioanalytical method validation. The targeted glycopeptide quantification has a good linearity (r2 = 0.9930 for interday experiments) and a detection limit of 15.6 ng mL−1. Unlike the most existing studies on AFP-L3 for early diagnosis, i.e., comparing the AFP-L3% between the HCC patients and the patients with chronic liver diseases, we analyzed the AFP/Core fucose marker from HCC patients and non-HCC controls, to develop an analytical method for the early detection of HCC with high specificity and sensitivity and to understand the correlation between aberrant glycosylation and early-stage liver diseases.Results and discussion
Experimental design and workflow
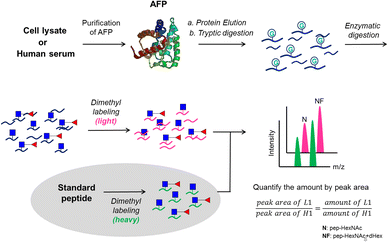
The proposed analytical workflow of this study is shown in Fig. 1. In this workflow, purified AFP from intact Expi293 cells was used as the standard protein to optimize each step under the method development for targeted glycopeptide quantification. Proteolytic digestion was followed by dithiothreitol (DTT) and iodoacetamide (IAM) treatment for reduction and alkylation, respectively. Subsequent treatment of endoglycosidase was adopted to release the outer glycans to reduce the glycan microheterogeneity on the peptide backbone. Dimethyl labeling24 of tryptic peptides was employed on both analytes and internal standards. The analytes carried the light label, whereas the internal standards carried the heavy label. Finally, LC-MS/MS experiments were performed by preselecting the targeted m/z for the targeted protein and the quantities of the selected m/z were calculated by peak areas.Performance evaluation of EndoS treatment
Since quantification of intact glycopeptide is still in its infancy, we sought an alternative to resolve this long existing problem. Although PNGase F has been widely used in N-linked glycoproteomic analysis, ambiguous site assignment and possible loss of a glycan moiety occur with altered glycosylation. Alternatively, several endoglycosidases which can trim off the various glycan moieties attached to the first N-acetylglucosamine (GlcNAc) residue at N-linked glycosite(s) have been discovered. Since the major glycan structure of AFP in HCC patients is the biantennary complex-type,25 EndoS was adopted to trim the outer glycans in this study. EndoS allows the processing of complex-type N-linked glycans with and without core fucosylation but cannot process oligomannose- or hybrid-type glycans which are rarely found in human glycoproteins.26,27To confirm whether EndoS is the appropriate enzyme for removal of the AFP glycan, we first profiled the glycosylation of AFP using the glycoproteomics approach.28 The results revealed that the major glycoform of AFP is consistent with the reported studies.25,29,30 Next, we optimized the EndoS reaction condition. We first evaluated whether EndoS should be added before or after proteolytic digestion. Following the supplier's protocol for EndoS treatment, we found that the percentage of truncated glycopeptides is higher when EndoS was added after tryptic digestion (Fig. 2(A)). EndoS has been known as the IgG-specific enzyme, especially for the release of glycans from the N-glycosite in the Fc region.31 Since the molecular weight of AFP (∼70 kDa) is higher than the Fc region of IgG, the lysis of AFP into smaller fragments is necessary to ensure EndoS efficacy. Thus, we tried to enrich the glycopeptides prior to the addition of enzyme to improve the efficiency. However, as shown in Fig. 2(B), hydrophilic interaction liquid chromatography (HILIC) did not enhance the percentage of the truncated peptides.
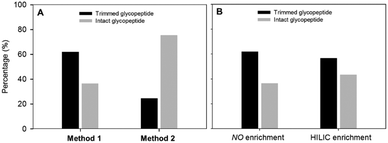 | ||
| Fig. 2 Evaluation of EndoS performance. (A) Comparison of the enzyme digestion methods at peptide and protein levels. (B) Comparison of the enzyme efficiency with and without HILIC enrichment. | ||
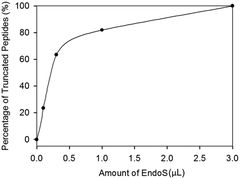
Since enrichment by HILIC did not improve the enzyme efficiency, we examined the amount of EndoS for hydrolysis (Fig. 3) based on our previous studies and found that the percentage of the truncated peptides sharply increased from 0 (control) to around 0.5 of EndoS and then the curve started to reach saturation. A complete cleavage was achieved with 3.0 μL of the enzyme.
Efficiency of stable isotope labeling with dimethylation
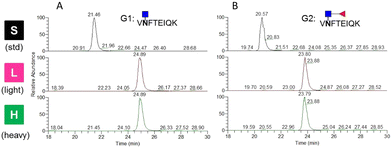
For LC-MS/MS experiments, isotopically labeled internal standards are added to reduce the fluctuations in signal intensity for relative quantification and to determine the amount of targeted peptides for absolute quantification. In this study, two standard glycopeptides with conserved peptides at the single glycosite were synthesized using chemoenzymatic approaches. Dimethyl labeling was employed to derivatize the glycopeptides with stable isotopes because of its speed and low cost.24 To test the labeling method and demonstrate its efficiency, the targeted glycopeptides were labeled with C2H6 and 13C2H2D4 by formaldehyde and deuterated 13C-formaldehyde (13CD2O) and directly analyzed by LC-MS/MS. The precursor m/z of the unlabeled, light-labeled and heavy-labeled core-afucosylated glycopeptides and the precursor m/z of their corresponding core-fucosylated glycopeptides were simultaneously monitored (Fig. 4). The average retention time shifted between labeled and unlabeled targets was about 3.3 min. Labeling efficiencies were calculated by comparing the peak areas of each labeled extracted ion chromatogram (XIC) to their counterparts. Approximately 100% labeling was obtained, indicating that this approach is an alternative to other expensive labeling methods.Determination of detection sensitivity
We prepared different amounts of the two glycopeptide targets over the range from 1 to 1000 fmol to see whether the extracted peak areas could readily reflect the real amount of the analyates. In order to establish a robust and reliable method for routine use, method validation must be carried out. According to the US FDA released guidance, determination of accuracy, precision, dynamic range and lower limit of detection (LLOD) should be included in a typical method validation. The accuracy and precision in the proposed analytical pipeline should be within 15%, except at a lower limit of detection where it should not exceed 20%. As low as 3.9 fmol of each analyte was detected with the peak area at least 10 folds higher than that of the blank sample. The calibration curves were constructed by plotting the log peak area versus the log injection amount, at a weighting of 1/y2 (Fig. 5). Nine concentrations were chosen, ranging from 1 to 1000 fmol. Both glycopeptides have good linearity with r2 higher than 0.99. At a lower limit of quantitation (LLOD), the accuracy was 8.15% and 11.54%, while the precision was 14.68% and 24.68% for standard glycopeptides with and without core fucose, respectively.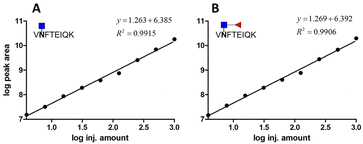 | ||
| Fig. 5 Calibration curve of two standard glycopeptides. (A) Glycopeptide of AFP without core fucose. (B) Glycopeptide of AFP with core fucose. | ||
The results of the standard glycopeptide analyses are summarized in Table 1. Accuracy was obtained by comparing the calculated concentration from each of the determinations with the nominal concentration of the analyte. Accuracy is expressed as %relative error (%RE). Precision was evaluated by performing interday and intraday experiments and calculating the coefficient of variance of the measurement (CV). On the other hand, precision could only be obtained when adding a known protein amount because we never know the exact percentage of glycopeptides after proteolysis. Across the wide dynamic range of analytes, the accuracy of standard glycopeptides without core fucose ranges from 1.06 to 36.62%, with an average accuracy of 8.76%, whereas the accuracy of standard glycopeptides with core fucose ranges from 1.57 to 33.02%, with an average accuracy of 7.86%. The precision of the method of standard glycopeptide analysis without core fucose ranges from 9.06 to 22.51%, with an average of 15.46%, while for standard glycopeptide analysis with core fucose, the precision ranges from 3.59 to 26.08%, with an average accuracy of 16.61%. Importantly, at least four points in the experiment have accuracy and precision within 15%, meeting the requirements set by US FDA. In this experiment, at least five points meet the requirement for both glycopeptides.
| Nominated amount (fmole) | ||||||
|---|---|---|---|---|---|---|
| Calculated amount (fmole) | Accuracy (RE%) | Precision (CV%) | Calculated amount (fmole) | Accuracy (RE%) | Precision (CV%) | |
| 1000 | 1366.22 | 36.62 | 9.06 | 1330.25 | 33.02 | 3.59 |
| 500 | 545.74 | 9.15 | 16.12 | 543.28 | 8.66 | 13.23 |
| 250 | 252.65 | 1.06 | 10.27 | 245.86 | 1.73 | 16.94 |
| 125 | 122.13 | 2.30 | 22.51 | 123.04 | 1.57 | 14.45 |
| 62.5 | 56.96 | 8.87 | 13.42 | 58.67 | 6.13 | 12.61 |
| 32.15 | 30.12 | 3.62 | 20.92 | 30.45 | 2.55 | 19.65 |
| 15.63 | 13.72 | 12.17 | 15.64 | 13.83 | 11.49 | 14.61 |
| 7.81 | 7.63 | 2.30 | 17.22 | 7.52 | 3.73 | 24.94 |
| 3.91 | 4.01 | 2.72 | 14.68 | 3.98 | 1.85 | 26.08 |
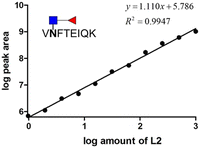
To know whether the sensitivity of the method is affected by other interfering peptides, eight amounts of two standard glycopeptides over the range from 1 to 1000 fmol were spiked into the deglycosylated AFP peptide pool. The PNGase-F treatment was employed prior to spiking standard glycopeptides in order to reduce the endogenous inference. The calibration curve was constructed by plotting the log peak area versus the log amount of different analyates (Fig. 6). As low as 3.9 fmol of AFP were detected with their XIC peak areas higher than those of blank samples which is consistent with the standard glycopeptide analysis. The results of this experiment are summarized in Table 2. Across the wide dynamic range of analytes, the accuracy of standard glycopeptides without core fucose ranges from 1.11 to 20.30%, with an average accuracy of 8.12%, whereas the accuracy of standard glycopeptides with core fucose ranges from 1.90 to 29.88%, with an average accuracy of 13.04%. The precision of the method of standard glycopeptide analysis without core fucose ranges from 6.90 to 28.66%, with an average of 6.09%, while for standard glycopeptide analysis with core fucose, the precision ranges from 6.29 to 22.73%, with an average accuracy of 13.51%. In this experiment, at least four points meet the FDA requirements.
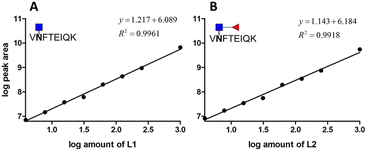 | ||
| Fig. 6 Calibration curve of two standard glycopeptides in the AFP peptide pool. (A) Glycopeptide of AFP without core fucose. (B) Glycopeptide of AFP with core fucose. | ||
| Nominated amount (fmole) | ||||||
|---|---|---|---|---|---|---|
| Calculated amount (fmole) | Accuracy (RE%) | Precision (CV%) | Calculated amount (fmole) | Accuracy (RE%) | Precision (CV%) | |
| 1000 | 1162.21 | 16.22 | 13.13 | 1298.82 | 29.88 | 11.07 |
| 250 | 233.85 | 6.46 | 7.20 | 255.54 | 9.79 | 22.73 |
| 125 | 123.14 | 1.49 | 23.52 | 114.48 | 8.42 | 6.29 |
| 62.5 | 65.66 | 5.05 | 6.90 | 69.26 | 10.82 | 16.45 |
| 32.15 | 24.91 | 20.30 | 11.57 | 23.30 | 25.44 | 16.38 |
| 15.63 | 16.59 | 6.17 | 12.42 | 15.33 | 1.90 | 10.05 |
| 7.81 | 7.73 | 1.11 | 25.34 | 8.32 | 6.53 | 22.70 |
| 3.91 | 4.22 | 8.15 | 28.66 | 4.36 | 11.54 | 2.41 |
Proof of concept for a model study
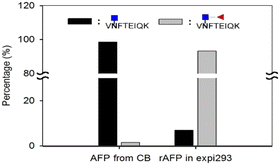
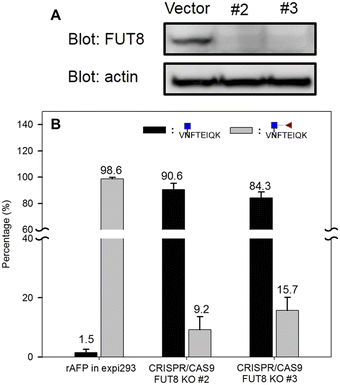
Next, we investigated the amount of AFP needed for a reliable detection using the aforementioned workflow. AFP purified from intact expi293 cell lines was used as the model analyte. Decreasing amounts of AFP were subjected to tryptic and EndoS tandem digestion, followed by dimethyl labeling. Because the AFP from intact expi293 has approximately 100% core fucosylation, in this study, only this glycopeptide was monitored in MS levels. The calibration curve in Fig. 7 was also established according to the previous process. The concentration dynamic range is from 1 to 1000 ng mL−1. However, we could not obtain the accuracy in this experiment because we did not know the percentage of the target peptide after tryptic digestion. Thus, this experiment only provided a rough idea about the minimal amount of protein needed for MS analysis. Because the degree of core fucosylation in the primary human sample is unpredictable, we established a model to validate the proposed quantitative method by proportionally mixing non-core-fucosylated and core-fucosylated AFP. To determine the appropriate biological sample for our model study, we compared AFP from human cord blood and cell culture medium. We found that the percentage of core-fucosylation in the human cord blood is less than 10%, while AFP from transfected expi293 cells is consistently core-fucosylated (>95%) (Fig. 8) Thus, we concluded that AFP purified from intact expi293 cells is a homogenous core-fucosylated protein and may be a good biological model to quantify core-fucosylation.Next, we prepared homogenous AFP without core fucose. As Yanagidani et al. reported in 1997, fucosyltransferase 8 (FUT8), the enzyme responsible for the core α1,6-fucosylation of asparagine-linked oligosaccharides of glycoproteins, is a vital enzyme in cancer development and progression.32 We used the CRISPR/Cas9 system to disrupt the gene expression of FUT8 in the cells to obtain the glycoprotein without core fucose. Expi293 cells were transfected with indicated FUT8-targeted plasmids individually followed by the addition of puromycin in the cell culture medium for selection. After a period, cells were collected and the protein expression of FUT8 was examined by Western blot. In Fig. 9, the FUT8 protein was almost absent in expi293#2 and #3. These selected cells or intact cells were then transfected with an AFP-expressing plasmid and AFP secreted into culture medium was purified for mass spectrometric analysis. AFP purified from intact expi293 cells still contains a high degree of core-fucosylation, whereas core-fucosylation of AFP purified from CRISPR/Cas9-manipulated cells is significantly reduced. In addition, the reduction of core-fucosylation in #2 is higher than that in #3 which is consistent with the Western blot results (Fig. 9).
To mimic the heterogenous core-fucosylation on hAFP from the primary human sample, we mixed AFP from intact expi293 and expi293#2 cells, with different ratios as shown in Table 3 and examined whether the degree of core fucosylation can be precisely measured by mass spectrometry. Comparing the theoretical ratio with the experimental ratio, we found that the error is approximately 10% in all combinations (Table 3). The errors are also reasonable considering the incomplete knockout of the FUT8 gene in cell culture medium.
| HexNAc + fucose | HexNAc | Peak area | % (CoreFuc) | Theoretical ratio (%) | Error (%) | |||
|---|---|---|---|---|---|---|---|---|
| P1-HexNAc (m/z 591.31) | P1-HexNAc + fucose (m/z 664.34) | P2-HexNAc (m/z 779.41) | P2-HexNAc + fucose (m/z 852.44) | |||||
| P1: VNFTEIQK; P2: FTKVNFTEIQKN: HexNAc; NF: HexNAc + dHex | ||||||||
| 1 | 1 | 1544521052 | 1057856001 | 175890130 | 371511791 | 45.08 | 50.00 | −9.84 |
| 1 | 3 | 3053795147 | 757013938 | 382759193 | 240322336 | 22.62 | 25.00 | −9.52 |
| 1 | 5 | 3099037307 | 596459017 | 490196324 | 187937496 | 18.03 | 16.67 | 8.18 |
| 3 | 1 | 815044330 | 1380245033 | 134628007 | 493375411 | 66.26 | 75.00 | −11.66 |
| 5 | 1 | 560041626 | 1701098375 | 79271732 | 5941922454 | 92.23 | 83.33 | 10.67 |
Validation of the proposed analytical method in human plasma
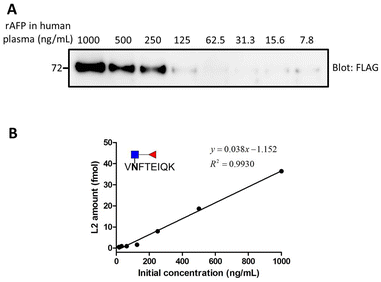
Once optimization of each step was completed, we evaluated the detection limit of the overall workflow. Different amounts of AFP were spiked into 100 μL human plasma, ranging from 7.8 to 1000 ng mL−1 (the concentration is shown Fig. 10(A)). A partial sample was subjected to Western blot for the preliminary test and the remaining sample was used for MS analysis. From the gel image in Fig. 10, AFP was observed until the concentration of 125 ng mL−1. In order to establish a robust and reliable method for routine use, method validation must be carried out. According to the US FDA released guidance, the determination of accuracy, precision, dynamic range and lower limit of detection (LLOD) should be included in a typical method validation. The accuracy cannot be calculated for the same reason mentioned before. The precision in the proposed analytical method should be within 15%, except at a lower limit of detection where it should not exceed 20%. In this validation process, 4 points meet the requirement although 7.8 ng mL−1 is slightly greater than 20 at LLOQ. A good linearity (r2 = 0.9930) was obtained from 15.6 to 1000 ng mL−1 (Fig. 11).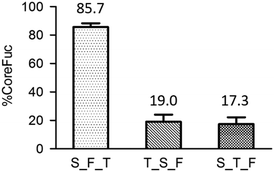 | ||
| Fig. 11 The order of enzyme addition. It is noted that trypsin is in short of T, endo s is S and fucosidase is F. | ||
Limitations of using mass spectrometry in clinics
Since using mass spectrometry for diagnosis is inconvenient in the clinical setting, we proposed a slightly modified workflow. Compared to the original workflow (Fig. 1), one more enzyme, fucosidase, is added to trim the core fucose after Endo S treatment, followed by a simple absorbance detection instead of mass spectrometry. The released L-fucose is oxidized by the enzyme L-fucose dehydrogenase in the presence of nicotinamide-adenine dinucleotide phosphate (NADP+) to L-fucono-1,5-lactone with the formation of reduced nicotinamide-adenine dinucleotide phosphate (NADPH). The amount of NADPH, measured by the increase in absorbance at 340 nm, formed in this reaction is stoichiometric with the amount of L-fucose. Because the workflow has been modified, we re-evaluated the entire system from the very beginning. First, to achieve better enzyme efficiency, we tested the order of the enzyme addition. In Fig. 11, it is noticed that the fucosidase works better after protease digestion. This experiment had been repeated in triplicate and the result reveals that both trypsin_Endo-S_fucosidase (T_S_F) and S_T_F treatments have low percentage of core fucose. Because we aim to detect the ions with or without core fucosylation, the latter two sequences of enzyme treatments are appropriate for further experiments.After the determination of the addition order of the enzymes, we examined the detection limits by absorbance, using standard L-fucose to mimic the released fucose. Triplicate repeats were performed for each method. A good linearity was achieved, ranging from 31.25 to 1000 ng, but it is much less sensitive than using mass spectrometry. To further evaluate the modified workflow, fluorescence is used to see whether it could be a potential tool for detection. Although a good linearity like absorbance was achieved, the sensitivity is still far behind the one by mass spectrometry.
Conclusions
AFP-L3, a fucosylated isoform of AFP, has gained its approval from US Food and Drug Administration (US FDA) as a diagnostic marker for HCC in 2005. Although AFP-L3 is superior to AFP itself due to its high specificity for HCC surveillance, the lack of a sensitive and robust analytical approach limits its utilities in clinics. To address this issue and facilitate its practical applications, we developed an enzyme-assisted targeted quantification method for the quantification of core-fucosylated glycopeptides of AFP in human sera. The accuracy and precision are within the US FDA suggested value, which is 15%. In addition to the accuracy and precision, a good linearity (r2 = 0.9930 for interday experiments) and a detection limit of 15.6 ng mL−1 were achieved. Since AFP is not 100% glycosylated, the limit of detection of the proposed workflow for direct core-fucose analysis may not be identical to its protein amount. To confidently confirm the disease, the values, including the protein amount and core-fucose, should be simultaneously evaluated. This approach may become an alternative to the existing method based on AFP-L3 determination to diagnose liver diseases because the AFP-L3 method could be affected by the total concentration of AFP. However, to apply the method developed in this study to real serum samples, the method should be validated with clinical samples.In summary, we have developed a quantitative analytical method using mass spectrometry and enzymatic reactions for the detection of alpha-fetoprotein on hepatocellular carcinoma. This method has been validated with standards and complex samples and could be applicable to clinical samples directly or used to confirm and validate the results obtained using other methods. Since disease-associated glycoproteins are usually present at a low level especially at an early stage of the disease, it is important to develop a non-invasive method with high specificity and sensitivity.
Materials and methods
Materials
ACS grade anti-FLAG antibody-conjugated agarose (Sigma-Aldrich), Pierce direct IP kit (Thermo Scientific), dithiothreitol (DTT, Sigma-Aldrich), formaldehyde (36.5–38%) (Sigma-Aldrich), C13-formaldehyde (Sigma-Aldrich), formic acid (FA, Riedel-de Haen, Seelze, Germany), iodoacetamide (IAM, Sigma-Aldrich), NH4OH (28–30%) (Sigma-Aldrich), puromycin (Sigma-Aldrich), sodium cyanoborohydride (95%) (Alfa Aesar), trifluoroacetic Acid (TFA, Sigma-Aldrich), triethylammonium bicarbonate (TEABC, Sigma-Aldrich), and sequencing grade trypsin (Trypsin, Promega, WI, US) were used as received. Analytical grade methanol (Merck) and HPLC-grade acetonitrile (ACN, Merck) were used without redistillation. Deionized water (Direct-QTM, Millipore SAS, Molsheim, France) was used as the solvent for the analyte and matrix. C18 ZipTip® Pipette Tips (Millipore) were used to desalt samples before the MS analysis.Methods
Serum samples were added to the antibody-coupled resin in a spin column and the column was incubated with gentle end-over-end mixing for overnight at 4 °C to form the antibody–antigen complex. The complex was washed with 1× conditioning buffer (neutral pH) followed by washing three times in tris-buffered saline (TBS) to remove unbound materials. The elution was carried out with 100 μL of 50% ACN in 0.1% (v/v) TFA for 30 min to dissociate the bound antigen from the antibody. The eluate was collected and dried using a SpeedVac.
![[thin space (1/6-em)]](https://www.rsc.org/images/entities/char_2009.gif) :
:![[thin space (1/6-em)]](https://www.rsc.org/images/entities/char_2009.gif) 50 (trypsin/protein, w/w) and incubated overnight at 37 °C. Tryptic digested samples were deactivated at 95 °C for 5 min and then concentrated using a SpeedVac. The resulting samples were reconstituted with 20 μL of EndoS buffer (50 mM sodium phosphate, pH 5.5). To partially release the glycan structure of N-linked glycopeptides, EndoS (2 μL, P0741L; New England Biolabs, UK) was added at 37 °C for 2 h. After enzymatic digestion, the sample was evaporated using a SpeedVac and ready for isotope labelling.
50 (trypsin/protein, w/w) and incubated overnight at 37 °C. Tryptic digested samples were deactivated at 95 °C for 5 min and then concentrated using a SpeedVac. The resulting samples were reconstituted with 20 μL of EndoS buffer (50 mM sodium phosphate, pH 5.5). To partially release the glycan structure of N-linked glycopeptides, EndoS (2 μL, P0741L; New England Biolabs, UK) was added at 37 °C for 2 h. After enzymatic digestion, the sample was evaporated using a SpeedVac and ready for isotope labelling.
High-resolution LC-MS/MS analysis was carried out using an Orbitrap Fusion Tribrid mass spectrometer (Thermo Fisher Scientific, CA, USA) equipped with the Ultimate 3000 RSLC system from Dionex (Dionex Corporation, Sunnyvale, CA) through a PicoView nanoelectrospray interface (PV550, New Objective, Woburn, MA, USA). Peptide mixtures were injected onto a precolumn (150 μm I.D. × 30 mm, 5 μm, 200 Å) followed by a reversed phase C18 nano-column (75 μm I.D. × 200 mm, 2.5 μm, 100 Å). The separation was performed in a linear gradient of 5% to 40% solvent B (80% acetonitrile with 0.1% formic acid) in 39 minutes, followed by a sharp increase to 98% B in one minute and held at 98% B for another 3 minutes, with a total run length of 60 minutes at a split flow rate of 300 nL min−1. Solvent A was 0.1% formic acid in water. Full MS survey scans from m/z 200 to 1400 were recorded using the orbitrap analyzer at 120![[thin space (1/6-em)]](https://www.rsc.org/images/entities/char_2009.gif) 000 resolutions with a maximum injection time of 200 ms, followed by data dependent MS2 acquisition in a top speed mode with 3 s cycles with a maximum injection time of 250 ms. The dynamic exclusion duration was set to 60 s with a 25 ppm tolerance around the selected precursor and its isotopes. Monoisotopic precursor ion selection was enabled and 1+ charge states were ejected from MS/MS. The automatic gain control (AGC) targets for orbitrap full MS and the ion trap were set at 2 × 10⁵ and 1 × 10⁴, respectively. The electrospray voltage was maintained at 1.8 kV and the capillary temperature was set at 275 °C.
000 resolutions with a maximum injection time of 200 ms, followed by data dependent MS2 acquisition in a top speed mode with 3 s cycles with a maximum injection time of 250 ms. The dynamic exclusion duration was set to 60 s with a 25 ppm tolerance around the selected precursor and its isotopes. Monoisotopic precursor ion selection was enabled and 1+ charge states were ejected from MS/MS. The automatic gain control (AGC) targets for orbitrap full MS and the ion trap were set at 2 × 10⁵ and 1 × 10⁴, respectively. The electrospray voltage was maintained at 1.8 kV and the capillary temperature was set at 275 °C.
All MS/MS spectra were first converted into *.msm format by Raw2msm (version 1.1) and searched using the Mascot server (Matrix Science, London, UK; version 2.4.241) against the Swiss-Prot database (version 2014_07) with all Homo Sapiens entries. Carbamidomethylation on cysteine was a fixed modification; while oxidation on methionine, GlcNAc, or GlcNAc + fucose on asparagine and deamidated on asparagine and glutamine as well as light dimethylation on lysine and peptide N termini were variable modifications. Trypsin was the specific proteolytic enzyme with up to two missed cleavages allowed. The mass tolerance for the precursor ion was set to 10 ppm and that for the fragment ion was set to 0.6 Da. A decoy database (with reversed protein sequences) created by Mascot was searched to evaluate the peptide level FDR for each data set. The reported peptides with ion scores higher than the Mascot identity threshold (p < 0.05) were regarded as confident identifications.
Targeted peptides were manually quantified with Xcalibur Qual Browser 2.1 (Thermo Fisher Scientific, San Jose, CA) using the peak area from the extracted ion chromatogram (XIC) at a full scan stage with the following settings: (1) precursor peaks were extracted with a tolerance of 10 ppm mass window, (2) Gaussian-type of smoothing with 5 points was enabled, and (3) Genesis peak detection algorithm was used.
The proposed workflow was evaluated in a stepwise fashion by varying sample complexity, from synthetic glycopeptides to standard glycopeptides in the protein pool and finally to standard protein spiked in human plasma. Calibration curves were constructed, and accuracy and precision were determined to assess the analytical validity of the proposed workflow.
Decreasing amounts of standard glycopeptides were directly analyzed or spiked into the protein pool before LC-MS/MS analysis to construct calibration curves for synthetic glycopeptides or standard glycopeptides in the protein pool, respectively. For synthetic glycopeptide analysis, solutions of two targeted standard glycopeptides (VNFTEIQK + GlcNAc; VNFTEIQK + GlcNAc + coreFuc) were prepared over the range from 1 to 1000 fmol. For protein pool analysis, varying amounts of the two glycopeptides were individually spiked into the PNGaseF-treated protein pool using the same concentration range for analysis in a relatively complicated environment. In addition, solutions containing the decreasing amount of AFP spiked into human plasma were also prepared to mimic the clinical sample. After high-resolution LC-MS/MS analysis, the calibration curve was constructed by plotting the log peak area versus the log amount of analyte, at a weighting of 1/y2. Since the analyte amount is known, accuracy and precision could be calculated to ensure the capability of the quantitative method in the former two experiments. Accuracy was obtained by comparing the calculated concentration from each of the determinations with the nominal concentration of the analyte.
Accuracy is expressed as %relative error (%RE). Precision was evaluated by performing interday and intraday experiments and calculated the coefficient of variance of the measurement (CV). On the other hand, only precision could be obtained when adding the known protein amount because we never know the exact percentage of glycopeptides after proteolysis.
Author contributions
Chen-Chun and Chi-Huey conceived the project and planned all experiments. Chen-Chun and Han-Wen performed the experiments. Bo-Rui constructed the plasmid for CRISPR. The manuscript was written by Chen-Chun and Chi-Huey with contributions from all the authors.Conflicts of interest
There are no conflicts to declare.Acknowledgements
This work was supported by Academia Sinica.References
- D. M. Parkin, F. Bray, J. Ferlay and P. Pisani, Ca-Cancer J. Clin., 2005, 55, 74–108 CrossRef PubMed.
- T. D. Boyer, T. L. Wright and M. P. Manns, Zakim and Boyer's hepatology: a textbook of liver disease, Elsevier Health Sciences, 2011 Search PubMed.
- C. Bosetti, F. Levi, P. Boffetta, F. Lucchini, E. Negri and C. La Vecchia, Hepatology, 2008, 48, 137–145 CrossRef PubMed.
- T. M. Block, A. S. Mehta, C. J. Fimmel and R. Jordan, Oncogene, 2003, 22, 5093–5107 CrossRef CAS PubMed.
- D. Y. Kim, Y. H. Paik, S. H. Ahn, Y. J. Youn, J. W. Choi, J. K. Kim, K. S. Lee, C. Y. Chon and K. H. Han, Oncology, 2007, 72, 52–57 CrossRef CAS PubMed.
- K. Okuda, Hepatology, 1986, 6, 729–738 CrossRef CAS PubMed.
- L. Wang, M. Yao, Z. Dong, Y. Zhang and D. Yao, Tumor Biol., 2014, 35, 9–20 CrossRef CAS PubMed.
- Z. Lin, H. Yin, A. Lo, M. T. Ruffin, M. A. Anderson, D. M. Simeone and D. M. Lubman, Electrophoresis, 2014, 35, 2108–2115 CrossRef CAS PubMed.
- J.-M. Ahn, H.-J. Sung, Y.-H. Yoon, B.-G. Kim, W. S. Yang, C. Lee, H.-M. Park, B.-J. Kim, B.-G. Kim and S.-Y. Lee, Mol. Cell. Proteomics, 2014, 13, 30–48 CrossRef CAS PubMed.
- Y. Sato, K. Nakata, Y. Kato, M. Shima, N. Ishii, T. Koji, K. Taketa, Y. Endo and S. Nagataki, N. Engl. J. Med., 1993, 328, 1802–1806 CrossRef CAS PubMed.
- S.-S. Wang, R.-H. Lu, F.-Y. Lee, Y. Chao, Y.-S. Huang, C.-C. Chen and S.-D. Lee, J. Hepatol., 1996, 25, 166–171 CrossRef CAS PubMed.
- T. Nakagawa, E. Miyoshi, T. Yakushijin, N. Hiramatsu, T. Igura, N. Hayashi, N. Taniguchi and A. Kondo, J. Proteome Res., 2008, 7, 2222–2233 CrossRef CAS PubMed.
- K. Shimizu, T. Taniichi, S. Satomura, S. Matsuura, H. Taga and K. Taketa, Clin. Chim. Acta, 1993, 214, 3–12 CrossRef CAS PubMed.
- K. Nakamura, N. Imajo, Y. Yamagata, H. Katoh, K. Fujio, T. Tanaka, S. Satomura and S. Matsuura, Anal. Chem., 1998, 70, 954–957 CrossRef CAS PubMed.
- H. Katoh, K. Nakamura, T. Tanaka, S. Satomura and S. Matsuura, Anal. Chem., 1998, 70, 2110–2114 CrossRef CAS PubMed.
- D. Li, T. Mallory and S. Satomura, Clin. Chim. Acta, 2001, 313, 15–19 CrossRef CAS PubMed.
- C. Kagebayashi, I. Yamaguchi, A. Akinaga, H. Kitano, K. Yokoyama, M. Satomura, T. Kurosawa, M. Watanabe, T. Kawabata and W. Chang, Anal. Biochem., 2009, 388, 306–311 CrossRef CAS PubMed.
- E. Hadziyannis, K. Sialevris, A. Georgiou and J. Koskinas, Oncol. Rep., 2013, 29, 835–839 CrossRef CAS PubMed.
- M. Ueno, S. Hayami, Y. Shigekawa, M. Kawai, S. Hirono, K.-I. Okada, H. Tamai, N. Shingaki, Y. Mori and M. Ichinose, J. Hepatol., 2015, 63, 1352–1359 CrossRef PubMed.
- G. P. Caviglia, M. L. Abate, E. Petrini, S. Gaia, M. Rizzetto and A. Smedile, Hepatol. Res., 2015, 46, E130–E135 Search PubMed.
- L. Anderson and C. L. Hunter, Mol. Cell. Proteomics, 2006, 5, 573–588 CrossRef CAS PubMed.
- T. A. Addona, S. E. Abbatiello, B. Schilling, S. J. Skates, D. Mani, D. M. Bunk, C. H. Spiegelman, L. J. Zimmerman, A.-J. L. Ham and H. Keshishian, Nat. Biotechnol., 2009, 27, 633–641 CrossRef CAS PubMed.
- J. Cao, C. Shen, H. Wang, H. Shen, Y. Chen, A. Nie, G. Yan, H. Lu, Y. Liu and P. Yang, J. Proteome Res., 2009, 8, 662–672 CrossRef CAS PubMed.
- P. J. Boersema, R. Raijmakers, S. Lemeer, S. Mohammed and A. J. Heck, Nat. Protoc., 2009, 4, 484 CrossRef CAS PubMed.
- P. Johnson, T. Poon, N. Hjelm, C. Ho, S. Ho, C. Welby, D. Stevenson, T. Patel, R. Parekh and R. R. Townsend, Br. J. Cancer, 1999, 81, 1188–1195 CrossRef CAS PubMed.
- M. Collin and A. Olsén, EMBO J., 2001, 20, 3046–3055 CrossRef CAS PubMed.
- M. Allhorn, J. G. Briceño, L. Baudino, C. Lood, M. L. Olsson, S. Izui and M. Collin, Blood, 2010, 115, 5080–5088 CrossRef CAS PubMed.
- K.-S. Lynn, C.-C. Chen, T. M. Lih, C.-W. Cheng, W.-C. Su, C.-H. Chang, C.-Y. Cheng, W.-L. Hsu, Y.-J. Chen and T.-Y. Sung, Anal. Chem., 2015, 87, 2466–2473 CrossRef CAS PubMed.
- K. Taketa, Electrophoresis, 1998, 19, 2595–2602 CrossRef CAS PubMed.
- K. Yamashita, K. Taketa, S. Nishi, K. Fukushima and T. Ohkura, Cancer Res., 1993, 53, 2970–2975 CAS.
- J. Sjögren, E. F. Cosgrave, M. Allhorn, M. Nordgren, S. Björk, F. Olsson, S. Fredriksson and M. Collin, Glycobiology, 2015, 25, 1053–1063 CrossRef PubMed.
- S. Yanagidani, N. Uozumi, Y. Ihara, E. Miyoshi, N. Yamaguchi and N. Taniguchi, J. Biochem., 1997, 121, 626–632 CrossRef CAS PubMed.
Footnotes |
| † Electronic supplementary information (ESI) available. See DOI: https://doi.org/10.1039/d3cb00069a |
| ‡ Current affiliation: Chen-Chun Chen – Eli Lilly and Company, Indianapolis, Indiana 46285, United States; Han-Wen Huang – The Scripps Research Institute, La Jolla, California 92037, USA |
| This journal is © The Royal Society of Chemistry 2023 |

