
 Open Access Article
 This Open Access Article is licensed under a Creative Commons Attribution-Non Commercial 3.0 Unported Licence
Protein–protein interfaces in molecular glue-induced ternary complexes: classification, characterization, and prediction
Huan
Rui
 a,
Kate S.
Ashton
b,
Jaeki
Min
c,
Connie
Wang
d and
Patrick Ryan
Potts
*c
a,
Kate S.
Ashton
b,
Jaeki
Min
c,
Connie
Wang
d and
Patrick Ryan
Potts
*c
aCenter for Research Acceleration by Digital Innovation, Amgen Research, Thousand Oaks, CA 91320, USA
bMedicinal Chemistry, Amgen Research, Thousand Oaks, CA 91320, USA
cInduced Proximity Platform, Amgen Research, Thousand Oaks, CA 91320, USA. E-mail: ryan.potts@amgen.com
dDigital, Technology & Innovation, Amgen, Thousand Oaks, CA 91320, USA
First published on 3rd January 2023
Abstract
Molecular glues are a class of small molecules that stabilize the interactions between proteins. Naturally occurring molecular glues are present in many areas of biology where they serve as central regulators of signaling pathways. Importantly, several clinical compounds act as molecular glue degraders that stabilize interactions between E3 ubiquitin ligases and target proteins, leading to their degradation. Molecular glues hold promise as a new generation of therapeutic agents, including those molecular glue degraders that can redirect the protein degradation machinery in a precise way. However, rational discovery of molecular glues is difficult in part due to the lack of understanding of the protein–protein interactions they stabilize. In this review, we summarize the structures of known molecular glue-induced ternary complexes and the interface properties. Detailed analysis shows different mechanisms of ternary structure formation. Additionally, we also review computational approaches for predicting protein–protein interfaces and highlight the promises and challenges. This information will ultimately help inform future approaches for rational molecular glue discovery.
 Huan Rui | Huan Rui is a computational chemist at Amgen. She obtained her PhD in computational chemistry from University of Kansas and conducted her postdoctoral research at University of Chicago studying conformational transitions of membrane proteins using molecular dynamics and free energy calculations. Her current research interest is on combining physics and machine learning based methods to predict molecular glue induced protein–protein interfaces. |
 Kate S. Ashton | Kate Ashton graduated from the University of Cambridge in 2005 with a PhD in organic chemistry before moving to conduct postdoctoral studies at Caltech and Princeton. Since starting at Amgen, she has worked on multiple programs spanning all therapeutic areas and was part of the sotorasib team. She is focused on induced proximity and the challenges it brings to small molecule chemistry. |
 Jaeki Min | Jaeki Min received his PhD in organic chemistry from Seoul National University in 2004 and then went on to undertake postdoctoral research in chemical genomics at New York University. Afterwards, he joined Emory University's Emory Chemical Biology Discovery to work on the NIH Molecular Library Screening Center Network project. He then moved to St. Jude Children's Research Hospital, where he became the center leader of the Chemical Biology Center in the department of chemical biology and therapeutics. Currently he is a group leader of Induced Proximity Platform at Amgen, and his primary research area is targeted protein degradation. |
 Connie Wang | Connie Wang is a data scientist at Amgen. She obtained her PhD in computational chemistry from Caltech where her research focused on coarse-grained modeling of membrane protein synthesis. Her current work has focused on applying machine learning and data science methods to discover novel therapies and accelerate their delivery to market. |
 Patrick Ryan Potts | Ryan Potts obtained his PhD in Cell and Molecular Biology from UT Southwestern in 2007. In 2008 he was awarded the Sara and Frank McKnight junior faculty position at UT Southwestern Medical Center and appointed as Assistant Professor in the Departments of Physiology, Pharmacology, and Biochemistry in 2011. In 2016 his lab moved to St. Jude Children's Research Hospital where he was an Associate Member in the Department of Cell and Molecular Biology. In 2020 he moved to Amgen, Inc. as Executive Director of Research and Head of the Induced Proximity Platform that is focused on drugging the “undruggable”. |
Introduction
For the past decade, molecular glue degrader discovery has relied on serendipity, post hoc rationalization, and phenotypic screening. The most well-known molecular glue degraders are thalidomide and its analogues, lenalidomide and pomalidomide known collectively as immunomodulatory imide drugs (IMiDs). Their discovery as molecular glues was retrospective following FDA approval and subsequent detection of immunomodulatory and anti-inflammatory activity. The E3 ubiquitin ligase cereblon (CRBN) was identified as the effector protein of thalidomide.1 Binding of thalidomide to CRBN recruits and degrades neosubstrates, providing an early example of molecular glue-induced targeted protein degradation (TPD).1–7 IMiDs are not the only known molecular glue degraders whose mechanisms of action was uncovered retrospectively. Indisulam and its derivatives were also first discovered through a phenotypic screen for small molecules with anticancer activity.8 Their mechanism of action was uncovered almost 20 years later using mutagenesis and mass spectrometry, identifying RBM39 as their degradation target and DCAF15 as the effector E3 ligase.9–11 Even though molecular glue molecules are often discussed in the context of E3 ligases and TPD, they exist in other areas of biology as well. For instance, rapamycin inhibits the mTOR kinase by stabilizing a protein–protein interface between FKBP12 and the FRB domain in the kinase.12 Another example is the nuclear receptors. Their specificity is largely modulated by the binding of different ligands, leading to preferential recruitment of either co-repressors or co-activators.13,14 There are many other examples of this class of molecules, including FK506,15 inositol tetraphosphate,16 and cotylenin A.17 The discovery of these molecules, which act as protein–protein interaction stabilizers, faces similar challenges as the rest of the molecular glues.Recently, more systematic screening approaches have been used to identify molecular glue degraders. CR8, a CDK12/CyclinK molecular glue degrader, was identified by a bioinformatics screen, where the cytotoxicity of clinical and preclinical small molecules in different cancer cell lines are correlated with their E3 ligase components mRNA levels.18 Extensive follow-up testing and a crystal structure revealed that CR8 induces the formation of a complex between CDK12/CyclinK and the E3 ligase DDB1 leading to the degradation of CDK12/CyclinK. Along the same vein, other screening approaches have shown success at discovering novel CyclinK molecular glue degraders as well.19,20 These works also highlight the tremendous effort required to perform current screening paradigms, not only due to the nature of the screen itself – typically a cellular assay – but also the follow-up work needed to validate and understand the mechanism of action for any hits. Furthermore, since the hit rates of such screening efforts are usually low, testing a large number of compounds is necessary. Although new technologies such as cellular screens using DNA encoded library technology21–24 offer the opportunity to screen millions of compounds at once, hits still need to be remade off DNA and tested again in assays to confirm activity, making the lead generation process slow and resource intensive. Because of this, screening for molecular glues currently falls squarely within the high risk, high reward zone of drug discovery.
Despite these challenges, molecular glue degraders are still highly sought after as a promising new therapeutic modality. Compared to its bi-specific counterpart proteolysis targeting chimeras (PROTACs), molecular glue degraders have the advantage of being small with low molecular weight and the potential for drug-like physiochemical properties, making the late-stage optimization relatively simpler. Many research labs and pharmaceutical companies have started programs aimed at discovering new molecular glues for protein degradation, but without a more efficient way to discover novel degraders and protein targets, the field will face an uphill battle.
Structure-based rational design methods offer a strategy to increase the chance of success if the target and the E3 ubiquitin ligase of the molecular glue are known. In a recent example, the crystal structure of ternary complex between β-TrCP, β-catenin, and a small molecule NRX-1933 led to the discovery of new molecular glues with enhanced mutant selectivity.25 The discovery of the mutant-specific Ikaros degrader, ALV2, was also guided by known crystal structures.26,27 However, structural information on the ternary complex is often difficult to obtain and does not always aid in the prediction and discovery of neosubstrates. The crux of this issue lies within the interactions formed by the two proteins and their stabilization by the ligand. Many molecular glues take advantage of weak, fortuitous, pre-existing protein–protein interfaces (PPIs) that can be further strengthened by their binding. To fully understand what drives ternary structure formation and leverage this in the discovery of new molecular glue molecules, a few questions still need to be addressed, including (1) what is the major driving force behind the protein–protein interactions in the ternary complexes, (2) what is the influence of the ligand on the PPI, (3) what are the stability, kinetics, and geometry of the ternary complexes formed, and (4) which of these parameters are most crucial.
A plethora of excellent review articles on molecular glues and the complexes they stabilize have been published in the recent years, each focusing on a slightly different aspect of the topic, with the majority of them focusing on the discovery history, mechanism of action, and design strategy.28–37 This review seeks to compile and analyze the current, published molecular glue ternary complex structures with the aim of identifying and quantifying any structural requirements for PPIs that are induced by molecular glues, as well as surveying the best computational methods to predict potential ‘gluable’ interfaces. To gain a general understanding of the molecular glue-induced PPI (MG-PPI), all molecular glue-induced complexes are considered, regardless of whether the molecular glue is a degrader. The review is organized into four sections: (1) a summary of all known MG-PPI and two set of native PPI that do not require molecular glues to form, (2) a comparison of the PPI properties between the sets of interfaces highlighting similarity and differences, (3) an analysis of the ligand–protein interactions occurring in the MG-PPI, showing different mechanisms of MG-PPI formation, and (4) a survey of current computational tools for PPI discovery and their potential utility in the identification of gluable PPI.
Summary of protein–protein interfaces
Molecular glue-induced protein–protein interfaces
To establish a baseline, an analysis of currently documented MG-PPI was performed with an emphasis on protein–protein and protein–ligand interfaces, taking into account both their size and nature. Table 1 provides a summary of publicly available molecular glue-induced heterodimeric complex structures from the protein data bank (PDB). The corresponding small molecule structures are shown in Scheme 1. The structures in Table 1 are chosen based on our best knowledge of literature discussing molecular glues and stabilizers. All types of molecular glues are included, including degraders and non-degraders. There are homo-oligomer complex structures available but often times they involve multiple protein–protein interfaces and are excluded from the current review. One exception is BCL6 due to the recent discovery of its degrader BI-3802,38 which causes homo-oligomerization of the BTB domain,39 and the rising interest in its degrader design. Bispecific degrader induced ternary structures are also not included in Table 1 as the ternary structure formation in this case is largely driven by the binding of the warheads to their respective protein targets. The complex structures in Table 1 are organized into two groups based on the interacting mode between the two protein binding partners: Group 1 (domain–domain) features interactions between proteins with well-folded domains, and in Group 2 (sequence motif-domain) one of the binding partners is a stretch of residues that contains a specific pattern for binding (Fig. 1A and B). In all the complexes in Table 1, 45 of them belong to Group 1 and 54 belong to Group 2. Fig. 1B shows two complex structures, DCAF15-indisulam-RBM39 and TIR1-1NAA-IAA7, exemplifying the two groups of interactions respectively. There is a myriad of ways to categorize these ternary complexes, the reason for the current choice is rooted in the nature of these interfaces and the computational discovery strategies that may follow.| P1 | P2 | PDB | Glue | Resolution | Binding affinity | Assay type | ||
|---|---|---|---|---|---|---|---|---|
| P1-glue | P1–P2 | Ternary | ||||||
| Group 1 | ||||||||
| RCAR12 (PYL1) | ABI1 | 3JRQ | Abscisic acid | 2.1 Å | K D = 52 μM (ITC) | ITC, SPR156 | ||
| K D = 340 μM (SPR) | ||||||||
| RCAR12 (PYL1) | ABI1 | 3KB3 | Abscisic acid | 2.0 Å | K D = 52 μM (ITC) | |||
| K D = 340 μM (SPR) | ||||||||
| RCAR12 (PYL1) | ABI1 | 3KDJ | Abscisic acid | 1.9 Å | K D = 52 μM (ITC) | |||
| K D = 340 μM (SPR) | ||||||||
| CSPYL1 | HAB1 | 5MN0 | Abscisic acid | 2.0 Å | N/A | |||
| RCAR11 (PYR1) | HAB1 | 3QN1 | Abscisic acid | 1.8 Å | K D = 97 μM | NMR 157 | ||
| RCAR11 (PYR1, H60P) | HAB1 | 3ZVU | Abscisic acid | 2.1 Å | K D = 3 μM | NMR157 | ||
| 2RCAR14 (PYL2) | ABI2 | 3UJL | Abscisic acid | 2.5 Å | K D = 59.1 μM | ITC158 | ||
| RCAR9 (PYL2) | ABIL1 | 4OIC | Abscisic acid | 2.0 Å | ||||
| RCAR13 (PYL3) | HAB1 | 4DS8 | Abscisic acid | 2.2 Å | ||||
| RCAR13 (PYL3) | HAB1 | 5JO2 | Abscisic acid | 2.4 Å | ||||
| RCAR3 | ABIL3 (S265F/I267M) | 5GWO | Abscisic acid | 2.8 Å | K D = 30 nM (at 0.1 mM of ABA) | ITC159 | ||
| RCAR3 | ABIL3 | 5GWP | Abscisic acid | 2.6 Å | K D = 2.1 nM (at 0.1 mM of ABA) | ITC159 | ||
| RCAR3 | ABL3 (S265L/I267V) | 5ZCG | Abscisic acid | 2.1 Å | N/A | |||
| RCAR3 | ABL3 (I267W) | 5ZCH | Abscisic acid | 2.5 Å | K D = 29 nM (at 0.1 mM of ABA) | Biolayer interferometry (BLI)160 | ||
| RCAR3 | ABL3 (I267L) | 5ZCL | Abscisic acid | 2.7 Å | K D = 1.5 nM (at 0.1 mM of ABA) | |||
| FKBP12 | FRAP | 1FAP | Rapamycin | 2.7 Å | K D = 0.2 nM (P1-Glue) | ND | K D = 12 nM | FP assays and SPR 53 |
| K D = 26 μM (P2-Glue) | ||||||||
| FKBP12 | FRAP | 1NSG | Rapamycin | 2.2 Å | ND | |||
| FKBP12 | FRAP (T2098L) | 6M4U | Rapamycin | 2.2 Å | ND | |||
| FKBP12 | FRAP | 2FAP | C49-methyl Rapamycin | 2.2 Å | K i = 3.5 nM | ND | FKBP12 enzyme inhibition assay161 | |
| FKBP12 | FRAP | 3FAP | C15-(R)-methylthienyl Rapamycin | 1.9 Å | ND | |||
| FKBP12 | FRAP | 4FAP | C15-(R)-methylthienyl Rapamycin | 2.8 Å | ND | |||
| FKBP12 | PPP3CA-PPP3R1 | 1TCO | FK506 | 2.5 Å | K D = 0.4 nM | ND | Tritium labeled competitive binding assay 162 | |
| FKBP12 | CEP250 | 6OQA | WDB002 | 2.2 Å | ND | |||
| DCAF15 | RBM39 | 6Q0W | Indisulam | 2.9 Å | K D = 17 μM | K D = 4.6 μM | K D = 120 nM | BLI,56 ITC,163 TR-FRET164 |
| Ki > 50 μM | ||||||||
| DCAF15 | RBM39 | 6UD7 | Indisulam | 2.3 Å | K D = 4.6 μM | |||
| DCAF15 | RBM39 | 6SJ7 | Indisulam | 3.5 Å (Cryo-EM) | K D = 4.6 μM | |||
| DCAF15 | RBM39 | 6Q0V | Tasisulam | 2.9 Å | K i = 2.9 μM | K D = 4.6 μM | ||
| DCAF15 | RBM39 | 6PAI | E7820 | 2.9 Å | K i = 2.9 μM | K D = 4.6 μM | K D = 160 nM | |
| DCAF15 | RBM39 | 6Q0R | E7820 | 2.9 Å | K D = 4.6 μM | |||
| DCAF15 | RBM39 | 6UE5 | Compound 7 | 2.6 Å | K D = 4.6 μM | |||
| ARF1 | ARNO | 1R8Q | Brefeldin A | 1.9 Å | ND | K i = 15 μM | Fluorescence anisotropy165,166 | |
| ARF1 | ARNO | 1S9D | Brefeldin A | 1.8 Å | ND | K i = 15 μM | ||
| ARF1 | GEA | 1RE0 | Brefeldin A | 2.4 Å | ND | K i = 15 μM | ||
| Cam | Kcnn2 | 4G27 | Phenylurea | 1.7 Å | EC50 = 1.61 mM | Electrophysiology167 | ||
| Cam | Kcnn2 | 4G28 | 1-EBIO | 1.6 Å | EC50 = 396 μM | |||
| Cam | Kcnn2 | 4J9Z | NS309 | 1.7 Å | EC50 = 0.44 μM | |||
| BRI1 | SERK1 | 4LSX | Brassinolide | 3.3 Å | IC 50 = 80 nM | Binding competition assay 168 | ||
| BRI1 | SERK3 | 4M7E | Brassinolide | 3.6 Å | IC50 = 80 nM | Binding competition assay168 | ||
| CDC34 | UBC | 4MDK | CC-0651 | 2.6 Å | EC 50 = 267 μM | EC 50 = 19 μM | NMR 169 | |
| EC 50 = 14 μM | TR-FRET 169,170 | |||||||
| EC 50 = 36 μM | ||||||||
| CDC34 | UBC | 7M2K | Compound 2ab | 2.5 Å | EC50 = 3.6 μM | TR-FRET170 | ||
| CA14 | DB21 | 7TE8 | Cannabidiol | 2.0 Å | K D = 2 μM | K D = 19 μM | K D = 43 nM | ITC 55 |
| BLI 55 | ||||||||
| DDB1 | CDK12/CyclinK | 6TD3 | CR-8 | 3.5 Å | K D > 400 μM | K D ≈ 50 μM | K D < 100 nM | ITC 18 |
| GluN2B | GluN1b | 3QEL | Ifenprodil | 2.6 Å | ND | K D = 0.7 – 1 μM | K D = 50 nM | ITC 54 |
| Analytical ultracentrifugation 54 | ||||||||
| HDAC3 | NCOR2 | 4A69 | Inositol tetraphosphate | 2.1 Å | ||||
| PDE3A | SLFN12 | 7LRD | DNMDP | 3.2 Å (Cryo-EM) | K D = 320 nM | K D = 65 nM | BLI 171 | |
| BCL6 | BCL6 | 6XMX | BI-3802 | 3.7 Å (Cryo-EM) | IC 50 < 3 nM | TR-FRET 38 | ||
| Group 2 | ||||||||
| 14-3-3 | PMA2 | 2O98 | Fusicoccin | 2.7 Å | K D = 66 μM | K D = 2.5 μM (truncated PMA2) | K D = 0.7 μM | SPR,172,173 ITC174 |
| K D = 88 nM (SPR) | K D = 14 nM (SPR) | |||||||
| 14-3-3 | PMA2 | 3M50 | Epibestatin | 2.6 Å | ND | K D = 1.8 μM | SPR175 | |
| 14-3-3 | PMA2 | 3M51 | Pyrrolidone1 | 3.3 Å | ND | K D = 80 μM | SPR 175 | |
| 14-3-3 | H + -ATPase phosphopeptide | 3E6Y | Cotylenin A | 2.5 Å | K D = 2.5 μM | ITC176 | ||
| 14-3-3 | RAF1 | 4IHL | Cotylenin A | 2.2 Å | EC50 = 60 μM | EC50 = 350 nM | EC50 = 20 nM | Anisotropy measurement177 |
| 14-3-3 | RAF1 | 3IQV | Fusicoccin | 1.2 Å | K D = 17 μM | K D = 6 μM | ITC178 | |
| 14-3-3 | RAF1 | 3O8I | 6,6-Dihydroxy-1-methoxyhexan-2-one | 2.0 Å | K D = 1–2 mM | SPR178 | ||
| 14-3-3 | P53 | 5MXO | Fusicoccin | 1.2 Å | K D = 14 μM (FP) | K D = 1.7 μM (FP) | FP, ITC179 | |
| K D = 23 μM (ITC) | K D = 5.4 μM (ITC) | |||||||
| 14-3-3 | PAK6 | 6QDS | FC-NCPC | 1.7 Å | K D = 0.4 μM | K D = 0.1 μM | FP180 | |
| 14-3-3 | ERα | 4JDD | Fusicoccin | 2.1 Å | K D = 1 μM | K D = 0.1 μM | Competitive fluorescence anisotropy 181 | |
| 14-3-3 | ERα | 6TJM | Pyrrolidone1 | 1.9 Å | K D = 230 nM (SPR) | K D = 0.1 μM (FP) | FP and SPR182 | |
| 14-3-3 | ERα | 6TL3 | Pyrrolidone1-derivative | 2.5 Å | ND | FP and SPR182 | ||
| 14-3-3 | CDC25C | 5M36 | CLR01 | 2.5 Å | K D = 5 μM (ITC) | K D = 2.75 μM (at 250 μM CLR01, ITC) | FP and ITC183 | |
| 14-3-3 | CDC25C | 5M37 | CLR01 | 2.4 Å | ||||
| 14-3-3 | Gab2 | 5EXA | Fusicoccin A-THF | 2.0 Å | IC 50 = 0.5 μM | IC 50 = 0.19 μM | FP 184 | |
| 14-3-3 | TASK-3 | 3P1O | Fusicoccin | 1.9 Å | K D = 1.46 μM | K D,app = 0.05 μM | FP185 | |
| 14-3-3 | TASK-3 | 3SMK | Cotylenin A | 2.1 Å | FP185 | |||
| 14-3-3 | TASK-3 | 3SML | Fusicoccin A aglycone | 1.9 Å | K D = 1.46 μM | K D,app = 0.48 μM | FP185 | |
| 14-3-3 | TASK-3 | 3SMM | Fusicoccin J aglycone | 2.0 Å | K D = 1.46 μM | K D,app = 0.56 μM | FP185 | |
| 14-3-3 | TASK-3 | 3SMO | Fusicoccin J aglycone | 1.8 Å | K D = 1.46 μM | K D,app = 0.56 μM | FP185 | |
| 14-3-3 | TASK-3 | 3SMN | Fusicoccin A-THF | 2.0 Å | ND | K D = 1.46 μM (FP) | K D,app = 0.08 μM (FP) | FP, ITC185 |
| K D = 4.1 μM (ITC) | K D,app = 0.27 μM (ITC) | |||||||
| 14-3-3 | TASK-3 | 3SP5 | Cotylenol | 1.8 Å | ||||
| 14-3-3 | TASK-3 | 3SPR | Fusicoccin A-THF | 2.0 Å | ND | K D = 1.46 μM (FP) | K D,app = 0.08 μM (FP) | FP, ITC185 |
| K D = 4.1 μM (ITC) | K D,app = 0.27 μM (ITC) | |||||||
| 14-3-3 | TASK-3 | 3UX0 | Fusicoccin H | 1.8 Å | K D = 1.46 μM | K D,app = 0.55 μM | FP185 | |
| 14-3-3 | TASK-3 | 4FR3 | 16-O-Me-FC-H | 1.9 Å | K D = 1.46 μM | K D,app = 0.07 μM | FP185 | |
| 14-3-3 | TASK-3 | 6GHP | FC-NAc | 2.0 Å | K D = 0.45 μM | K D,app = 0.014 μM | FP186 | |
| CRBN | IKZF1(ZF2) | 6H0F | Pomalidomide | 3.3 Å | K D = 157 nM | N/A (CRBN-ZF2) | K i = 2314 nM | FP assay6 |
| K D = 250 nM (CRBN-ZF2-3) | (CRBN-ZF2) | TR-FRET assay187 | ||||||
| K D = 53 nM | BLI55 | |||||||
| (CRBN-ZF2-3) | Alphascreen55 | |||||||
| CRBN | ZNF692(ZF4) | 6H0G | Pomalidomide | 4.3 Å | K D = 157 nM | N/A | K i = 2314 nM | TR-FRET187 |
| CRBN | SALL4 | 6UML | Pomalidomide | 3.6 Å | K D = 157 nM | TR-FRET187 | ||
| CRBN | SALL4 | 7BQU | S-Thalidomide | 1.9 Å | K D = 4 μM | ITC188 | ||
| CRBN | SALL4 | 7BQV | 5-Hydroxythalidomide | 1.8 Å | K D = 0.76 μM | ITC 188 | ||
| CRBN | GSPT1 | 5HXB | CC-885 | 3.6 Å | K D = 71 nM | K D = 1.8 nM | MST189 | |
| IC50 = 18 nM | FP assay190 | |||||||
| CRBN | GSPT1 | 6XK9 | CC-90009 | 3.6 Å | IC 50 = 824 nM | FP assay 190 | ||
| CRBN | CK1α | 5FQD | S-Lenalidomide | 2.5 Å | K D = 180 nM | K D = 2 μM | K D = 75 nM | FP assay 6 |
| BLI 55 | ||||||||
| β-TRCP | β-catenin (pS33/S37) | 6M90 | NRX-2776 | 2.1 Å | K D = 689 nM | TR-FRET 25 | ||
| β-TRCP | β-catenin (pS33/S37A) | 6M91 | NRX-103094 | 2.4 Å | K D = 272 nM | K D = 0.6 nM (at 40 μM NRX-103094) | TR-FRET25 | |
| β-TRCP | β-catenin (pS33/S37) | 6M92 | NRX-2663 | 2.4 Å | K D = 689 nM | K D = 54.8 nM (at 250 μM NRX-2663) | TR-FRET25 | |
| β-TRCP | β-catenin (pS33/S37) | 6M93 | NRX-1933 | 2.5 Å | K D = 689 nM | TR-FRET25 | ||
| COI1 | JAZ1 | 3OGK | Coronatine | 2.8 Å | K D = 68 nM | Radio-ligand binding assay47 | ||
| COI1 | JAZ1 | 3OGM | Coronatine | 3.3 Å | K D = 68 nM | Radio-ligand binding assay47 | ||
| COI1 | JAZ1 | 3OGL | JA-isoleucine (JA-Ile) | 3.2 Å | K i = 1.8 μM | Competitive binding47 | ||
| TIR1 | IAA7 | 2P1N | (2,4-Dichlorophenoxy) acetic acid | 2.5 Å | K D = 1.4 μM | Competitive binding191 | ||
| TIR1 | IAA7 | 2P1O | Naphthalen-1-yl-acetic acid | 1.9 Å | K D = 1.3 μM | K D = 18.5 μM | Competitive binding 191 | |
| BLI 55 | ||||||||
| TIR1 | IAA7 | 2P1Q | Auxin | 1.9 Å | IC50 = 84nM | Exists but not quantified | Exists but not quantified | Competitive binding, SPR, NMR191,192 |
| Aldolase | TRAP | 4TR9 | Compound 24 | 2.1 Å | ||||
| PPARα | SMRT | 1KKQ | GW6471 | 3.0 Å | K D = 0.5 μM | IC 50 = 8 μM | K D = 1.6 μM | Fluorescence energy transfer assays and FP 50 |
| PR | NCoR | 2OVM | Asoprisnil | 2.6 Å | K D,app = 2.4 μM | FP 193 | ||
| RAR | N-CoRNR1 | 3KMZ | BMS-493 | 2.1 Å | K D = 1.8 μM | K D = 0.2 μM | Fluorescence anisotropy 14 | |
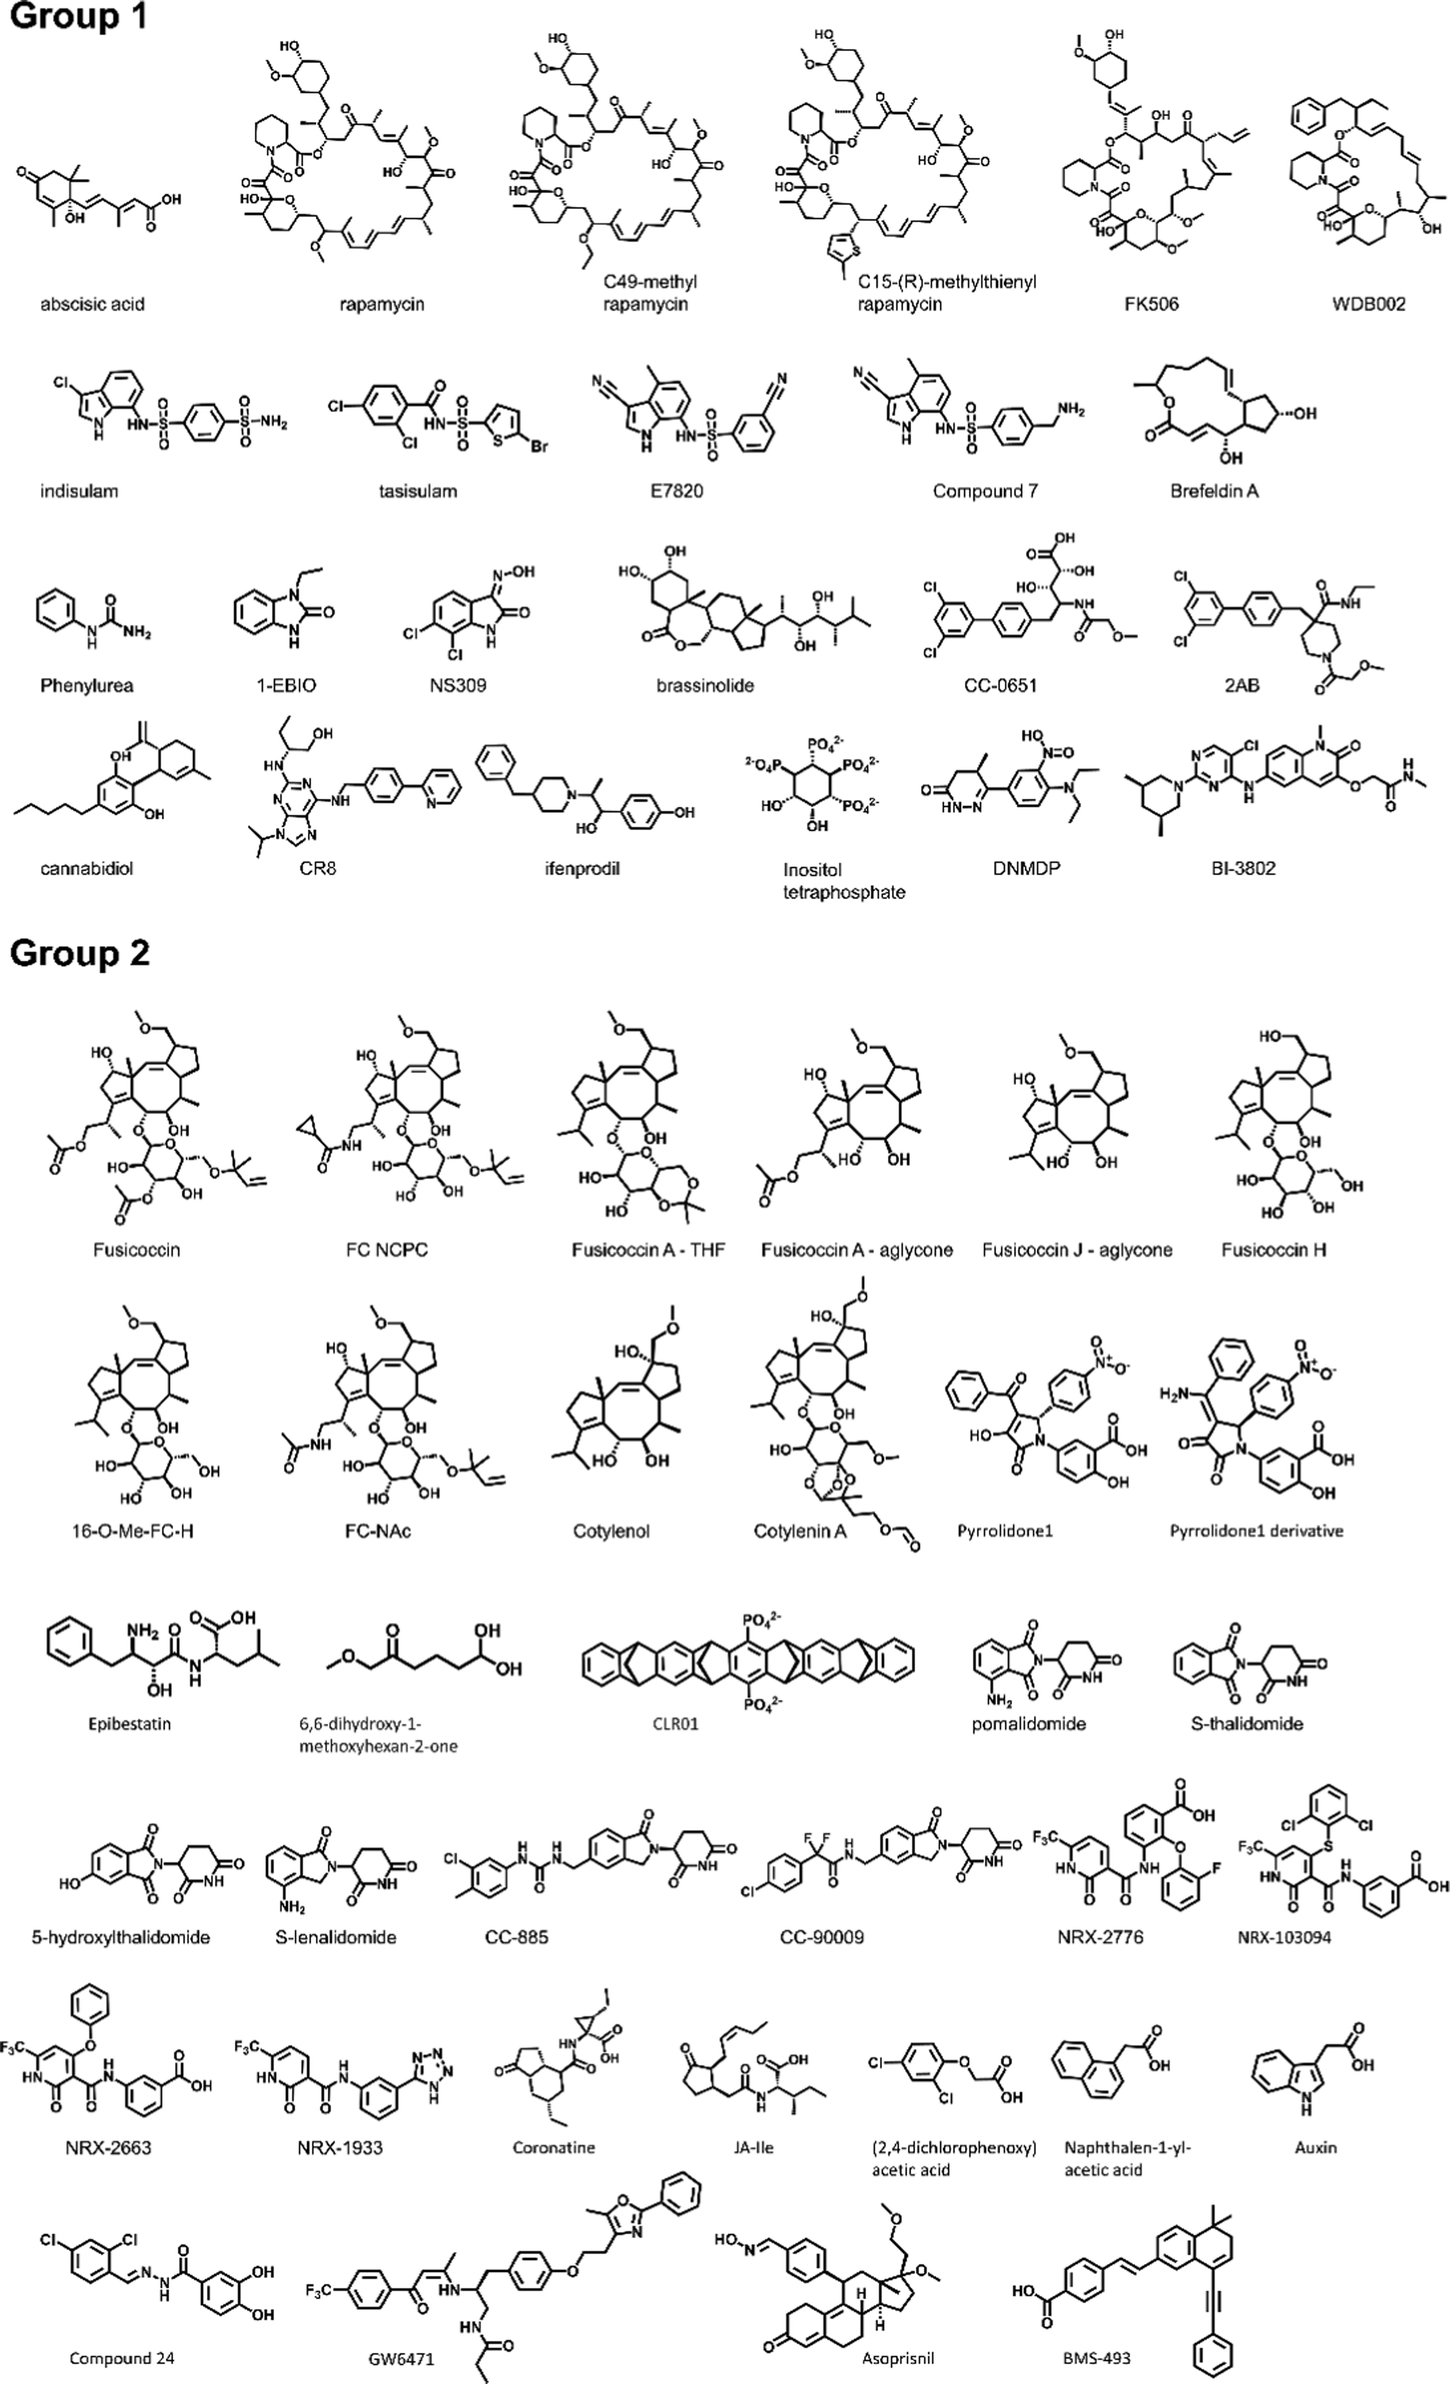 | ||
| Scheme 1 All molecular glues in Table 1. | ||
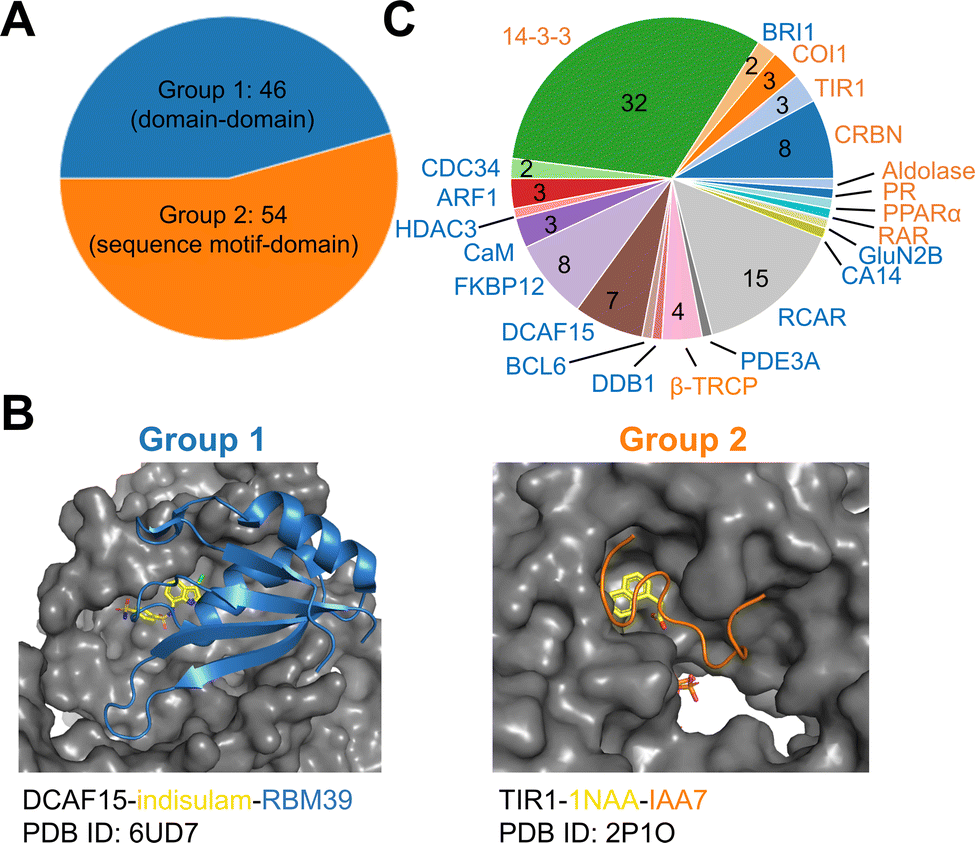 | ||
| Fig. 1 Summary of all molecular glue-induced ternary complexes. (A) Breakdown of complexes in Table 1 into two groups based on the interaction mode. (B) Two example structures showing Group 1 (left, DCAF15-indisulam-RBM39, PDB ID: 6UD7) and Group 2 (right, TIR1-1NAA-IAA7, PDB ID: 2P1O) interaction modes. The effector proteins are shown in surface presentation and the binding partner proteins are shown in cartoon representation. The bound molecular glue molecules are shown in yellow. The graphics are generated using PyMOL.40 (C) Breakdown of complexes by effector proteins. The names of the effector proteins are shown in the outer perimeter of the pie chart with blue (Group 1) and orange (Group 2) indicating the mode of interactions. | ||
Many of the complex structures in Table 1 share the same effector proteins and are clustered together in the table. Fig. 1C shows the breakdown of all the structures into their respective effector proteins. There are a total of 21 effector proteins, 13 of which are from Group 1, the rest belong to Group 2 with a sequence motif from the binding partner protein interacting with the effector protein. A representative structure from each effector protein cluster is used in the following quantitative analyses to show structural characteristics of the MG-PPI. This includes 15 complexes from Group 1 and 14 complexes from Group 2. They are highlighted in bold in Table 1. The selection is based on structure completeness and resolution.
Protein–protein interfaces that are not induced by molecular glues
Two protein–protein docking datasets, Docking Benchmark 5.5 (DB5.5)41–45 and Database of Interacting Protein Structures (DIPS),46 are used here to represent interfaces that form without the help of molecular glues. DB5.541–45 is a manually curated dataset containing 253 protein–protein complexes spanning eight categories based on protein functions. The binding affinities of these interfaces span a range between picomolar as seen in some of the antibody-antigen complexes to single digit micromolar. It is commonly used to benchmark protein–protein docking algorithms. DIPS is a much larger nonredundant protein–protein complex dataset assembled by Townshend and coworkers.46 It is constructed by filtering all protein–protein interfaces in the PDB based on structure resolution, PPI size, and sequence homology to the DB5 complexes. It contains more than 42![[thin space (1/6-em)]](https://www.rsc.org/images/entities/char_2009.gif) 000 interfaces. The DIPS dataset was further trimmed down by removing complexes in Table 1 to exclude MG-PPI. Interface properties are computed for complexes from both datasets and compared with those extracted from representative MG-PPI in Table 1.
000 interfaces. The DIPS dataset was further trimmed down by removing complexes in Table 1 to exclude MG-PPI. Interface properties are computed for complexes from both datasets and compared with those extracted from representative MG-PPI in Table 1.
Comparison between different types of ppis
Protein–protein buried surface area
The average buried surface area (BSA) of the PPI of the representative complexes in Group 1 and 2, as well as in the DB5.5 and DIPS datasets, are shown in Fig. 2A. The average BSA of Group 1 MG-PPI and the DB5.5 dataset are similar, but smaller than that seen in the DIPS dataset (Fig. 2A). Complexes in Group 2 in general have smaller BSA than those in all three other groups (i.e., Group 1, DB5.5, and DIPS), which is unsurprising due to the significantly shorter amino acid sequence of one protein partner in complexes from this dataset. The PPI in the other three datasets (Group1, DB5.5, and DIPS) are largely biased towards complexes formed between folded protein partners. Intrinsically disordered proteins are not included when building DB5.5 dataset.41–45 The DIPS dataset contains complexes with large PPIs such as the membrane protein complex phosphatidylcholine flippase Dnf2-Lem3 (PDB ID: 7KY8) with a PPI BSA at 4995 Å2 and the Myosin II complete coiled–coil domain (PDB ID: 7KOG) with an extensive PPI BSA at 25746 Å2. Furthermore, the DIPS dataset contains a filter to remove complexes with buried surface area smaller than 500 Å2.46 This shifts the PPI BSA distribution to the higher end and as a result the average PPI BSA is much larger in the DIPS dataset than any of the others.
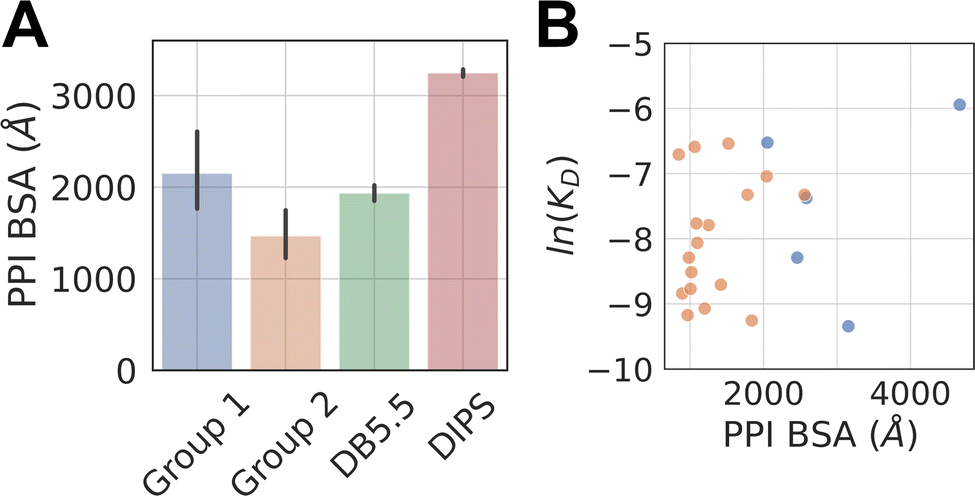 | ||
| Fig. 2 PPI BSA of complexes in different datasets and their relationship with experimentally measured intrinsic protein–protein interaction KD. (A) Average PPI BSA in four datasets. The PPI BSA for each complex is computed by taking the difference between two solvent accessible surface areas (SASA). One of them is the sum of the SASA of the two proteins as monomers. The other is the SASA of the two proteins as a complex. The difference is the reported PPI BSA. Molecular glues are excluded when computing the PPI BSA for Group 1 and 2 complexes. Standard deviation is reported for Group1, 2, and DB5.5. A two-tailed student t-test is performed on the BSA from Group 1 and Group 2. A p-value of 0.019 is achieved, indicating the observed difference is statistically significant. DIPS dataset is randomly sampled 20 times and each time with 500 samples to produce a standard error, which is reported. All properties reported below for DIPS are sampled using this scheme. (B) Shows the scatter plots of natural log of KD against the PPI BSA for Group 1 (blue) and 2 (orange) complexes with known protein–protein binding affinities (KD). | ||
The PPI BSA values of Group 1 complexes span a wide range from the smallest value of 423 Å2 seen in the FKBP12-rapamycin-FRAP complex to the largest value of 2336 Å2 seen in the DDB1-CR8-CDK12 complex. Five of these complexes have reported protein–protein binding affinity data in the absence of the molecular glue (Table 1). Fig. 2B plots the log values of the protein–protein dissociation constants without the molecular glue, ln(KD), against the PPI BSA for these five complexes. There is a rough correlation between the two, with interfaces that have larger PPI BSA also registering better protein–protein binding, even though the data is extremely limited. There is also one outlier, namely the DDB1-CR8-CDK12 complex (PDB ID: 6TD3). It has a large BSA PPI at 2,336 Å2, but the binding affinity between DDB1 and CDK12 without CR8 is low (KD ≈ 50 μM).18 This is because when CR8 is not present, the energy cost for CDK12 to adopt the bound conformation is likely high, leading to the observed low affinity.
The protein–protein binding affinities of Group 2 complexes in the absence of their corresponding molecular glues span a similar range compared to those in Group 1 (Table 1). The weakest of them is the TIR-IAA7 complex with a KD at 18.5 μM and the strongest is the complex formed between 14-3-3 and the Gab2 peptide with a KD of 0.5 μM. Additionally, as many interacting sequence motifs in Group 2 have key, specific interactions with the effector protein, such as buried hydrogen bonds and salt bridge interactions, these interfaces are perhaps more efficient than those largely non-specific interactions present in complexes from the other datasets. For the eight complexes where protein–protein dissociation KD exist, plotting the ln(KD) against PPI BSA shows little correlation and almost the opposite trend as that seen in Group 1 complexes (Fig. 2B). The complex formed between β-TrCP and its substrate pSer33 β-catenin peptide (PDB ID: 6M90) only has a BSA PPI of 509 Å2 but has one of the highest affinities in all the complexes with known protein–protein binding KD (KD = 530 nM).25 The efficiency of this interface with such a small PPI BSA likely stems from the partially buried charge–charge interactions between the phosphorylated Ser33 and the surrounding residues on the effector protein. On the other hand, the complex formed between the plant hormone receptor COI1 and its JAZ1 degron (PDB ID: 3OGM) has the largest PPI BSA at 1279 Å2 in this set but only a moderate protein–protein KD of 5 μM is observed.47 This shows that the nature of the interactions formed in complexes belonging to Group 2 is likely different than those formed between folded domains.
Amino acid preference at the interface
Amino acid preference profiles show which residues are more likely to be observed in a class of PPI. Fig. 3 plots these for all 20 amino acids at the PPI from complexes in four datasets described above. While Group 1 complexes exhibit similar residue preference profiles as those in datasets DB5.5 and DIPS, complexes in Group 2 show some differences for a few amino acids: Gln, Thr, His, Met, Trp, Phe, and Pro. Based on two-tail student t-tests, some of these differences are statistically significant, including those for Gln, His, Phe, and Pro. Although the sample size is still quite small, some of these trends may be meaningful. For example, Thr and Pro only exist in some sequence motifs but not others likely because phosphorylated Thr serves as a chemical signal for protein recognition and Pro is known to introduce kinks in protein structures that may provide the basis for shape recognition. A similar analysis done by Hou and coworkers found that by clustering and analyzing sequences of eukaryotic linear motifs,48 which form reversible interactions with protein partners to illicit downstream effects, they could identify residue preferences in different types of sequence motifs.49 Such preferences should be harnessed to discover neo-substrates and potential glues for E3 ubiquitin ligases. The implication of the notable differences between the interfaces formed in Groups 1 and 2 is that different computational schemes may need to be applied for their prediction.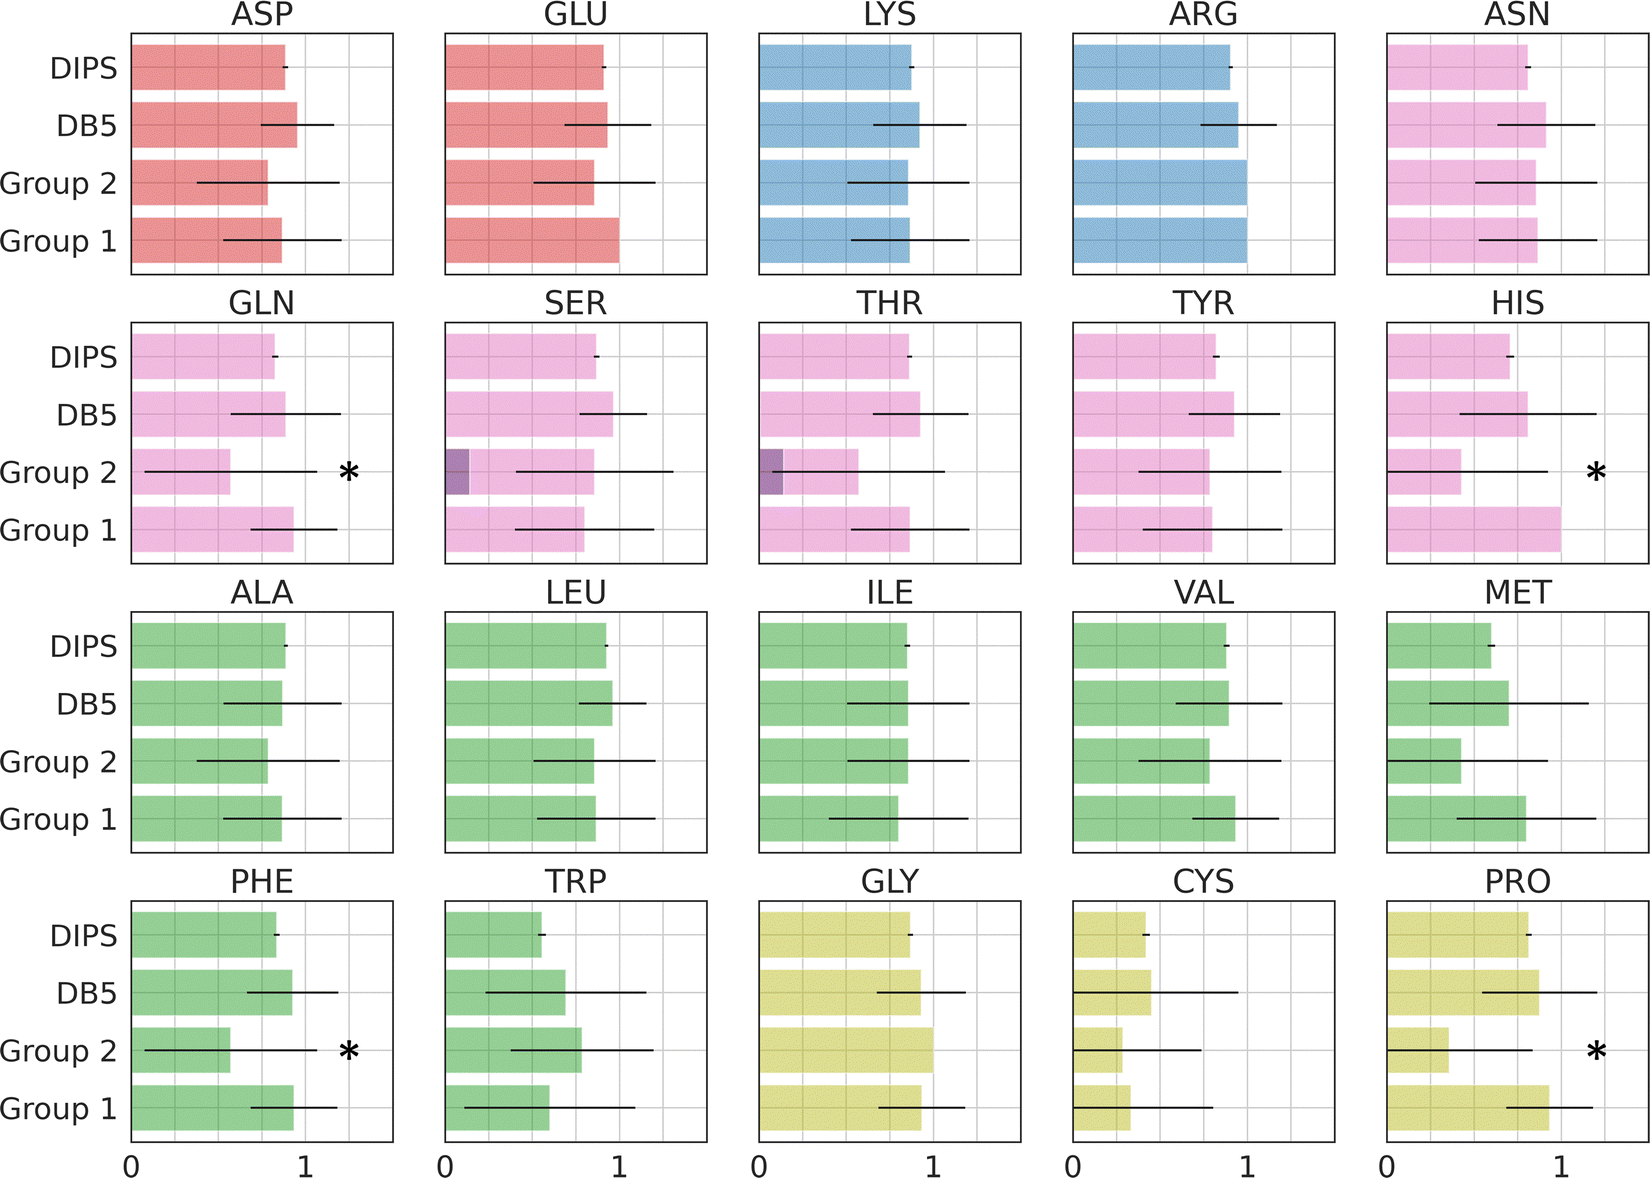 | ||
| Fig. 3 Interface amino acid preference profiles. The protocol below describes how the preference profile is computed. First, an interface residue list is generated for a complex. Each residue is counted once even if there are multiple occurrences at an interface. The lists of all complexes in a dataset are added up based on residue types and normalized by the total number of complexes in the dataset. The value of the preference is between zero and one. With a zero indicating a residue that is missing from all PPI in the dataset and one indicating that this residue is ubiquitous in all PPI in the dataset at hand. Interface residues are defined as residues that are within 4.5 Å of any non-hydrogen atoms from the interacting protein. Residues with modifications like phosphorylation and protonation are counted as their original form. The 20 residues are color by their properties: negatively charged (red), positively charged (blue), polar (magenta), hydrophobic (green), and others (yellow). Phosphorylated residues (Ser, Thr, and Tyr) are represented with a darker shade of color. The residues with statistically significant difference in residue preference between Group 1 and 2 are marked with a star. These include Gln, His, Phe, and Pro with p-values at 0.0292, 0.0003, 0.0292, and 0.0008, respectively. | ||
Residue-residue pair preference at the interface
To understand whether the specific interacting residues in the PPI of the four different types of complexes show similarity or differences, we analyzed the frequency of interacting residue pairs. Fig. 4 plots the residue–residue pair frequencies seen at the PPI. As expected, interactions between hydrophobic residues are seen ubiquitously in all four groups of interfaces, especially between Leu, Phe, and the other hydrophobic residues. Another residue that is seen often in all PPIs is Arg. The salt bridge interactions between Arg and the negatively charged residues are observed in nearly all interfaces. This highlights the seminal role of hydrophobic and electrostatic interactions in the formations of PPIs, and this is common in all PPI including those induced by molecular glues. Interactions between polar residues (Asn, Gln, Ser, Thr, Tyr, His) are slightly less frequent in PPI from Group 1 and 2 than those in the DB5.5 and DIPS datasets but given the small sample size in the MG-PPI, the significance of such difference is unclear. Nevertheless, this analysis illustrates that the main driving force of all PPI formation, regardless of whether a small molecule is needed to stabilize the interface, is hydrophobic and electrostatic. This implies that prediction algorithms that rely on physics- or statistics-based modeling to predict PPIs without molecular glues may still be valuable.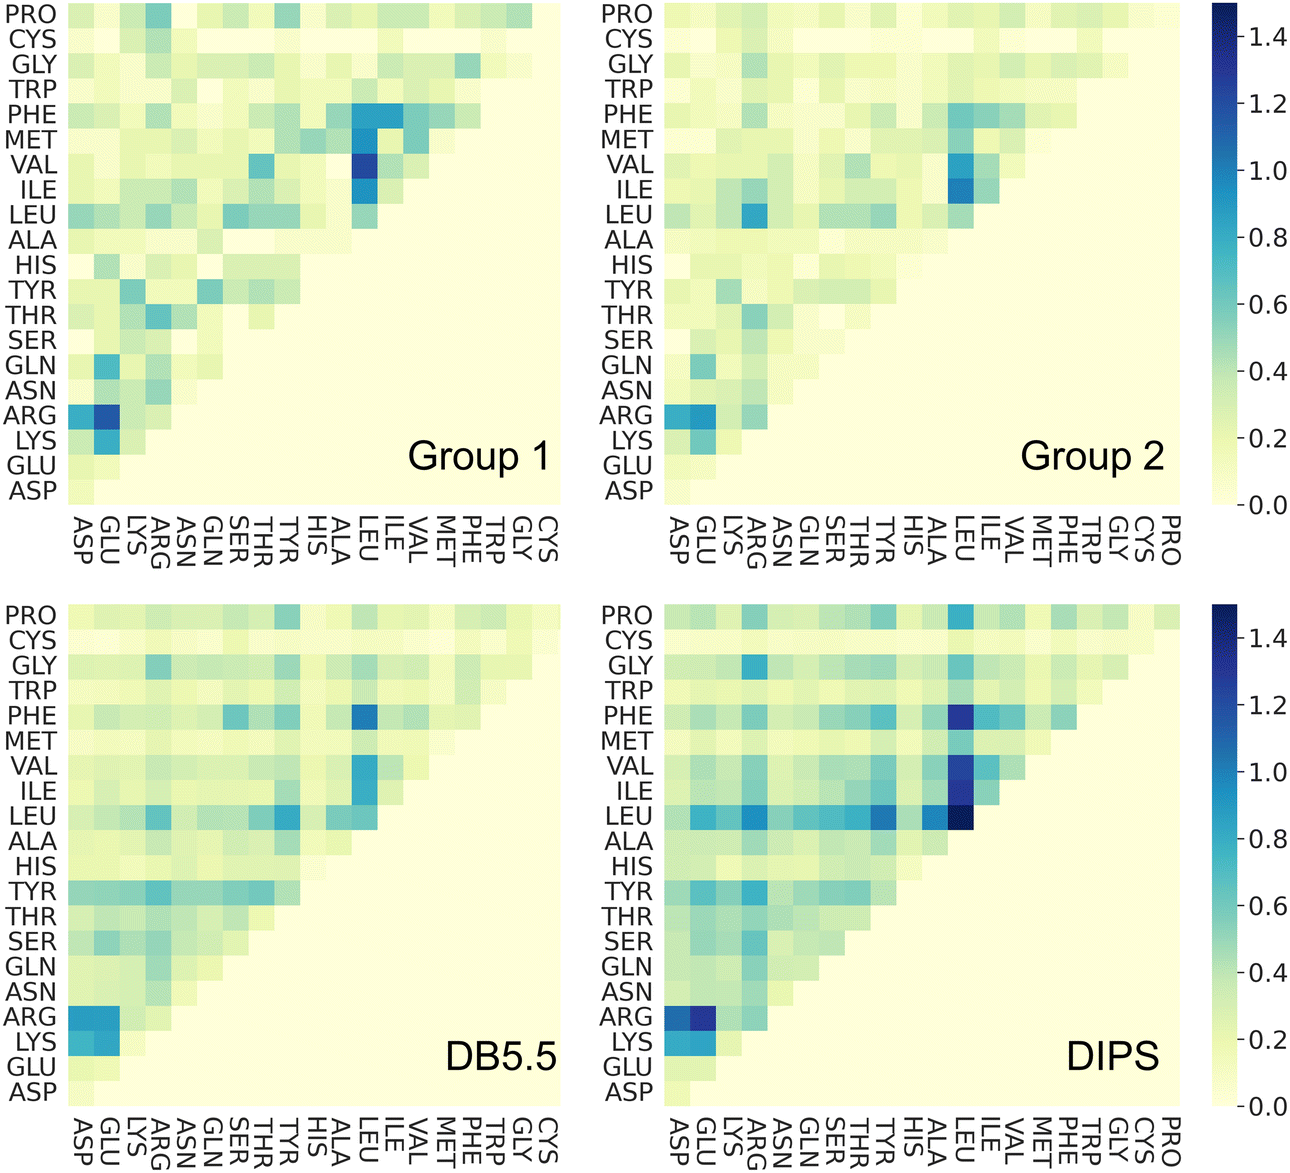 | ||
| Fig. 4 Residue pair preference profiles. The residue pair preference profile is calculated using the procedure below. All pairs of residue–residue interaction counts are recorded for an interface, resulting in a 20 by 20 matrix. The interaction matrices are then averaged over all complexes in the dataset without normalization. The higher the value, the more prevalent such pair of interaction is observed in a dataset. Interacting residue pairs are defined as those with any non-hydrogen atoms within 4.5 Å of each other and the two residues must be from two different proteins. Residues with modifications like phosphorylation and protonation are counted as their original form. | ||
Ternary structure formation mechanism imparted by ligand–protein interactions
Aside from protein–protein interactions, molecular glue-induced complex structures offer an opportunity to examine the interactions between the small molecule and the two protein partners. Fig. 5 plots the two ligand–protein BSA in the representative structures taken from Table 1. The diagonal line in Fig. 5 indicates a region where the two ligand–protein BSA in a complex are equal. As the complex structures deviate from this diagonal region, increasing asymmetry is seen between the interfaces formed between the molecular glue and the two binding partner proteins. The asymmetry of interactions between the molecular glue and its protein binding partners can guide the understanding of their ternary structure formation.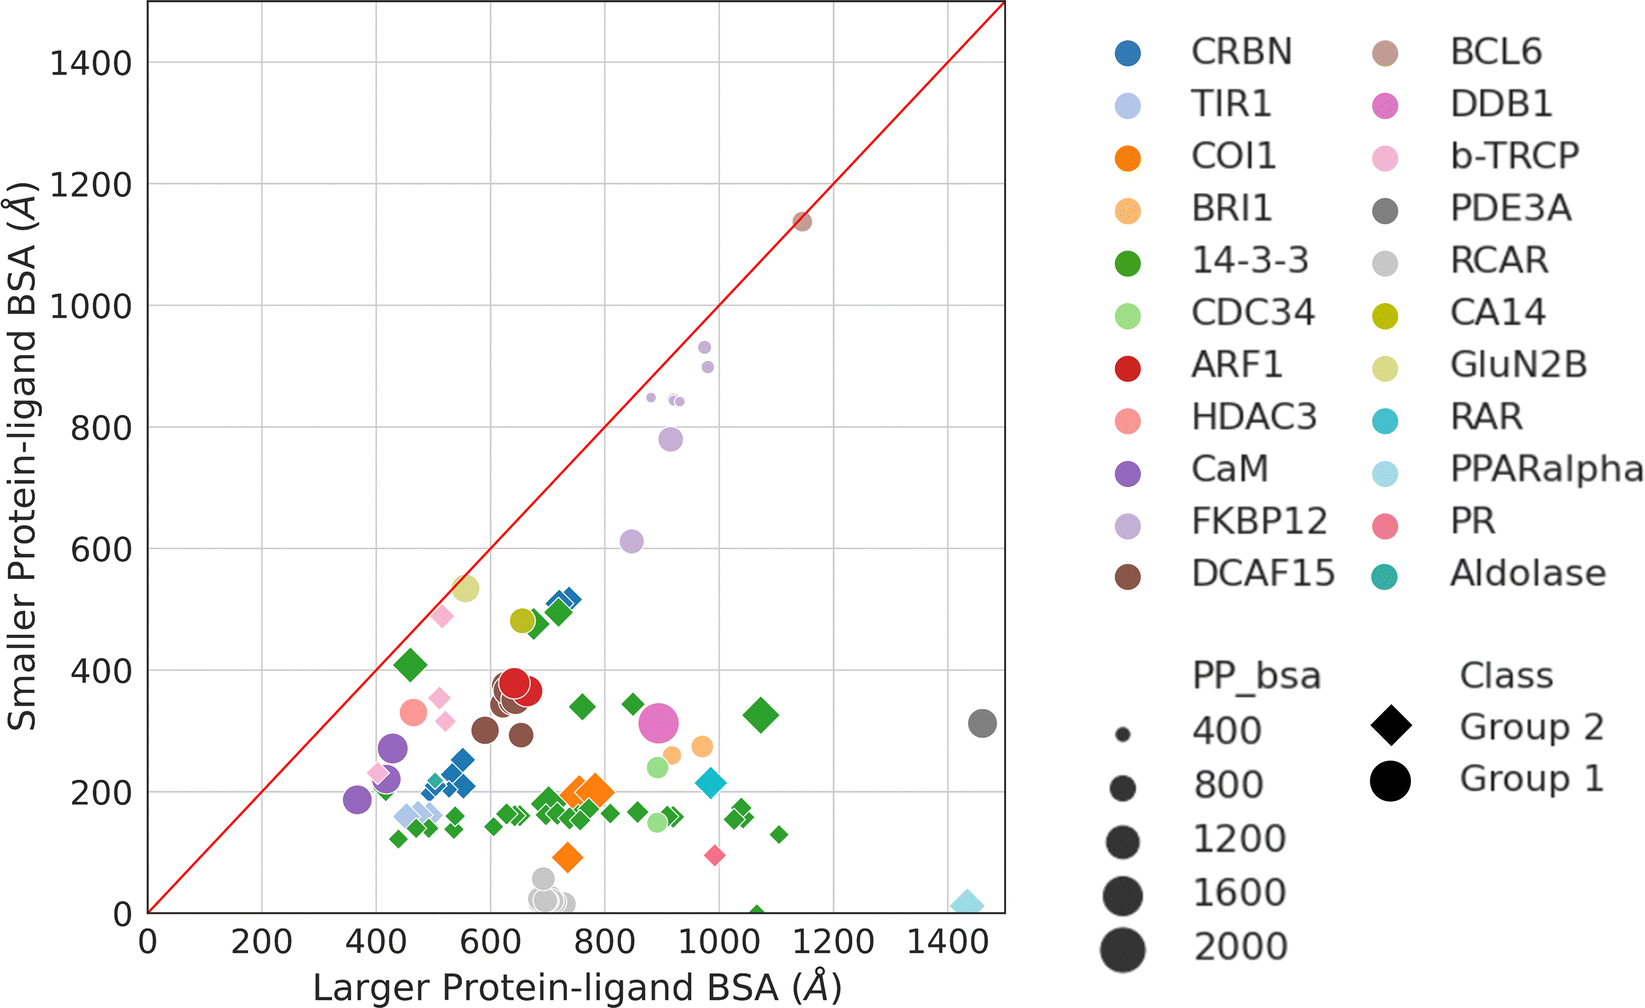 | ||
| Fig. 5 Ligand–protein BSA of all structures in Table 1. For those effector proteins with multiple binding partners (e.g., FKBP12 and 14-3-3), all of them are included in this plot with the same color and shape indicating the same effector protein. Ligand–protein BSA is computed in a similar fashion as the PPI BSA. In a molecular glue induced ternary complex, the ligand (i.e., molecular glue) interacts with both protein partners. The BSA of the two interfaces are calculated separately. For each of the ligand–protein interface, the SASA is computed for the two components alone and for the complex. The difference is then calculated and reported as the final ligand–protein BSA. The two ligand–protein BSA for a complex are then ranked by their magnitudes, resulting in a smaller and a larger BSA. Plotting the smaller BSA against larger BSA resulted in this plot. The complexes are colored by their effector proteins, with the shape indicating which group of interaction mode they belong to (Group 1: circle and Group 2: diamond). The size of the symbols indicates the size of the PPI BSA of the complex. The PDB IDs of these complexes can be found in Table 1. | ||
As may be expected for molecular glues, the majority of compounds show asymmetric binding where the ligand BSA is larger for one protein in the PPI compared to the other. This is more prominent in complexes from Group 2, likely due to two factors: (1) unresolved structure of disordered regions in one protein partner, usually the one containing the sequence motif, and (2) intrinsic binding between the glue and one of the proteins even without the second protein partner, which will be discussed further below. The most asymmetric cases lie in the bottom right corner, for example the complex structure formed between the peroxisome proliferator-activated receptor-α (PPARα) and the silencing mediator for retinoid and thyroid hormone receptors, SMRT (PDBID: 1KKQ50). There is an extensive interface between the glue GW6471 and PPARα while little interaction is seen between GW6471 and SMRT. This is supported by the already existing binding affinity between GW6471 and PPARα.50 Without GW6471, the binding between PPARα and SMRT is weak, with a KD of 8.0 ± 3.4μM measured by fluorescence polarization assay.50 Adding the molecular glue enhances the KD by 5-fold. By comparing the receptor structures bound with antagonist GW6471 and agonist GW409544, it is clear that the observed binding cooperativity lies in the induced conformational change of the AF-2 helix upon GW6471 binding, which moves and exposes a surface that is favorable for SMRT binding (Fig. 6A). Another example is the CR8-induced ternary complex between DDB1 and CDK12-CyclinK (PDBID:6TD3).18 CR8 is a known CDK inhibitor51 and the crystal structure of the ternary complex shows that it has extensive interactions with CDK12. Without CR8 the binding between CDK12-CyclinK and DDB1 is minimal with a KD of ∼50 μM measured by isothermal titration calorimetry (ITC).18 Binding of CR8 likely shifts the distribution of CDK12 conformations to one that favors binding to DDB1 (KD < 100 nM, measured by ITC18). Fig. 6B shows the C-terminal structural difference between an inactive CDK12 in complex with ADP and the CR8 bound DDB1-CDK12/CyclinK complex. When CR8 is bound to CDK12, it disrupts the interactions between the C-terminal short helix and the C-lobe of the kinase as seen in the inactive state, causing the C-terminus to adopt a conformation that can be recognized by DDB1, leading to the degradation of CyclinK. In both complexes which show pronounced asymmetry, the ternary structure formation is driven by ligand–protein binding, which induces allosteric conformational change of the protein surface, making it recognizable by the binding partner.
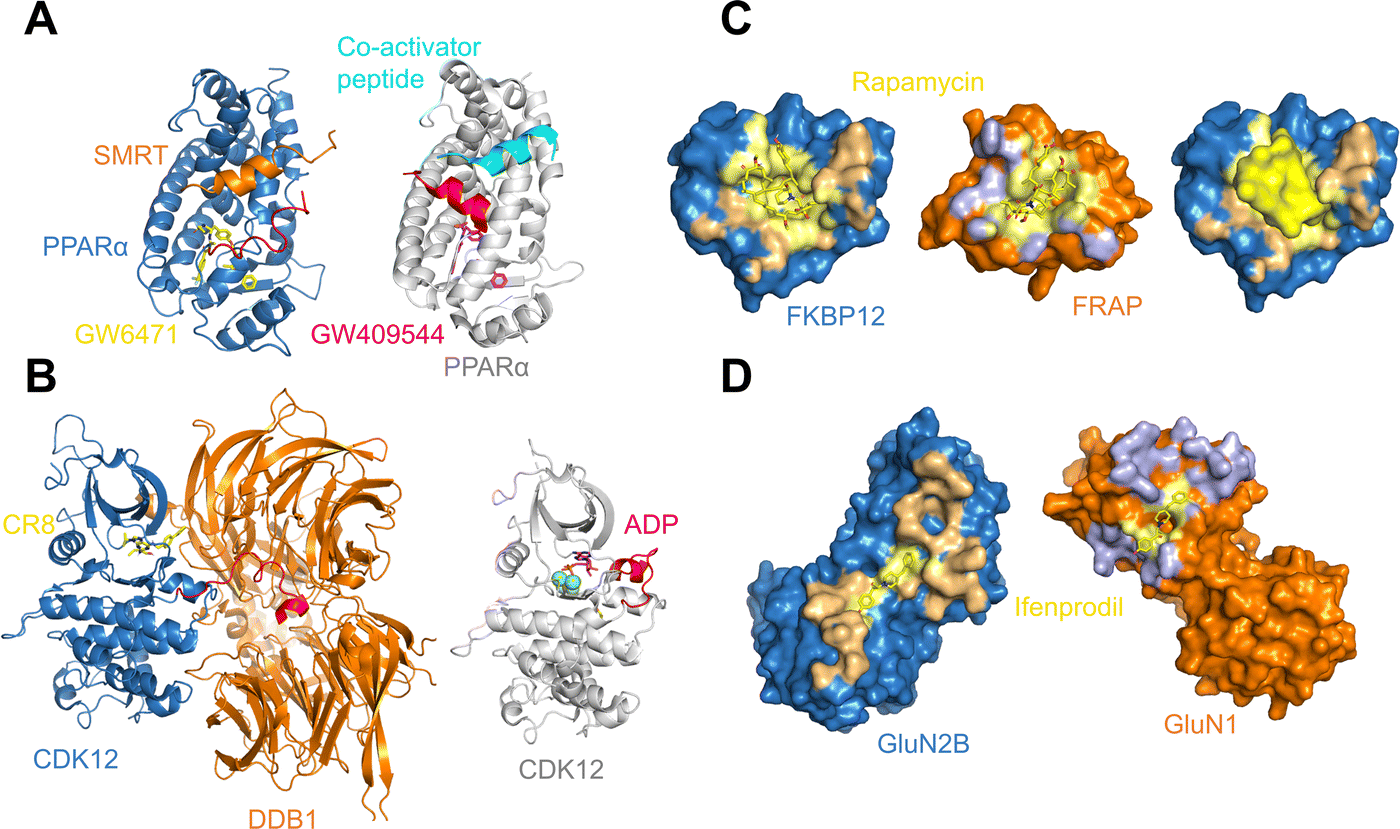 | ||
| Fig. 6 (A) Binding of antagonist GW6471 (yellow) to the PPARα receptor (blue) alters the AF-2 helix (red) conformation (left; PDB ID: 1KKQ) compared to when PPARα is bound to an agonist GW409544 (magenta) (right; PDB ID: 1K7L). The conformational difference in the AF-2 helix dictates the binding partner protein whether it is the co-repressor peptide SMRT (left; orange) or a co-activator peptide (right; cyan). (B) Binding of CR8 (yellow) to CDK12 (blue) alters the conformation of its C-terminal region (red) (left; PDB ID: 6TD3) compared to when CDK12 is inactive and bound to ADP (magenta) (right; PDB ID: 4NST). The new conformation of the CDK12 C-terminus resulted from CR8 binding is well-suited to bind to DDB1 (left; orange). (C) The protein binding area (light orange) and the ligand binding pocket (light yellow) in FKBP12 (blue) shown in surface presentation (left). The protein binding area (light blue) and the ligand binding surface (light yellow) in FRAP (orange) shown in surface presentation (middle). Binding of rapamycin (yellow) changes the surface of FKBP12 (blue), making it favorable for FRAP binding (right). The structures are taken from the FKBP12-rapamycin-FRAP complex (PDB ID: 1FAP). (D) The protein binding area (light orange) and the ligand binding surface (light yellow) in GluN2B (blue) shown in surface presentation (left). The protein binding area (light blue) and the ligand binding surface (light yellow) in GluN1 (orange) shown in surface presentation. The structures are taken from the GluN2B-ifenprodil-GluN1 complex (PDB ID: 3QEL). | ||
A portion of molecular glue induced complexes have roughly similar buried surface area between the molecular glue and the two protein binding partners. These are presented as datapoints close to the diagonal line in Fig. 5. Some complexes belong to this category do not show any protein–protein binding without the molecular glue. For example, the complex formed by FKBP12, rapamycin, and FRAP (PDB ID: 1FAP) has no detectable interactions between FKBP12 and FRAP. However, rapamycin is known to have high affinity binding to FKBP12 with a KD of 0.2 nM.52,53 It also binds to FRAP but weakly (KD = 26 μM53). This can be seen from Fig. 6C, where the PPI BSA is rather small but there is a deep, concaved binding site on FKBP12 used to bind rapamycin. The rapamycin binding surface on FRAP is shallower in line with the weaker KD between two. Even though rapamycin only binds weakly to FRAP, the FKBP12-rapamycin complex binds to FRAP in much higher affinity (ternary KD = 12 nM) revealed by SPR measurements.53 This is likely due to the binding of rapamycin to FKBP12 creating a new composite surface, driving the recruitment of FRAP.
In the diagonal region of Fig. 5, there are also complexes with intrinsic protein–protein binding affinities even without the presence of molecular glues. Adding molecular glues to the mix further strengthens the PPIs, leading to stable ternary complexes. This is exemplified by the complex formed between the NMDA receptor amino-terminal domains GluN1, GluN2B, and ifenprodil (PDB ID: 3QEL).54 In the ternary structure, the interface areas between ifenprodil and the two amino-terminal domains are almost identical, and there are no obvious pockets on either of the receptor subunits that indicate ifenprodil-subunit binding (Fig. 6D). This coincides with the observation that no binding could be detected between ifenprodil with either GluN1 or GluN2B.54 Without ifenprodil, GluN1 and GluN2B do interact and form a heterodimer with a KD of 0.7–1 μM when mixed. In fact, there is extensive PPI between the two proteins in the ternary complex with a PPI BSA at 1,229 Å2 (Fig. 6D). When ifenprodil is introduced, a 20-fold dimer stabilization effect is seen. The ternary structure formation in this case likely starts with the dimerization of GluN1 and GluN2B, forming a binding pocket for ifenprodil. Once ifenprodil is bound, it further stabilizes the complex.
Analysis of molecular glue-induced ternary structures indicate that there are likely two main pathways of how the ternary structure is formed (Fig. 7); either a protein–protein binary interface is formed first and then the complex incorporates a small molecule ligand at the interface, which further enhances binding (Path 1 in Fig. 7), or a small molecule binds to a protein partner first, which leads to altered protein surface properties, much like the effects of post-translational modification,34 making this surface available for association with another protein (Path 2 in Fig. 7). A similar scheme of molecular glue-induced ternary structure formation has been proposed by Cao and coworkers.55 The two pathways for ternary structure formation are not independent of each other, even though in some complexes one may dominate over the other as is the case in GluN2B-ifenprodil-GluN1 and FKBP12-rapamycin-FRAP (Fig. 7). There are cases where both paths are exploited to form a ternary complex. One example is CRBN-lenalidomide-CK1α, where relatively weak binary binding exists between the two proteins, as well as between CRBN and lenalidomide. Even though it is tempting to categorize all known molecular glue-induced complexes into these three categories, it remains a difficult task until experimental affinity for the binary components in the ternary systems are measured and reported, especially for those that are weak. Fig. 7 also reveals that the ternary structure formation process is a closed reaction cycle with every elementary step reversible. Because of this feature, the KD of all four elementary reactions are related by the cooperativity (α) of the system, where α = K1D/K4D = K2D/K3D. This provides the basis for further kinetic modeling of these systems. Such a framework is useful in the rational discovery of molecular glues and neosubstrates. The implication of this analysis is that different ternary structure formation mechanisms should be taken into consideration as one searches for molecular glues and neosubstrates of E3 ubiquitin ligases. Strategies for molecular glue discovery where ternary complexes are driven primarily by protein–protein binding versus ligand–protein binding need to be considered differently.
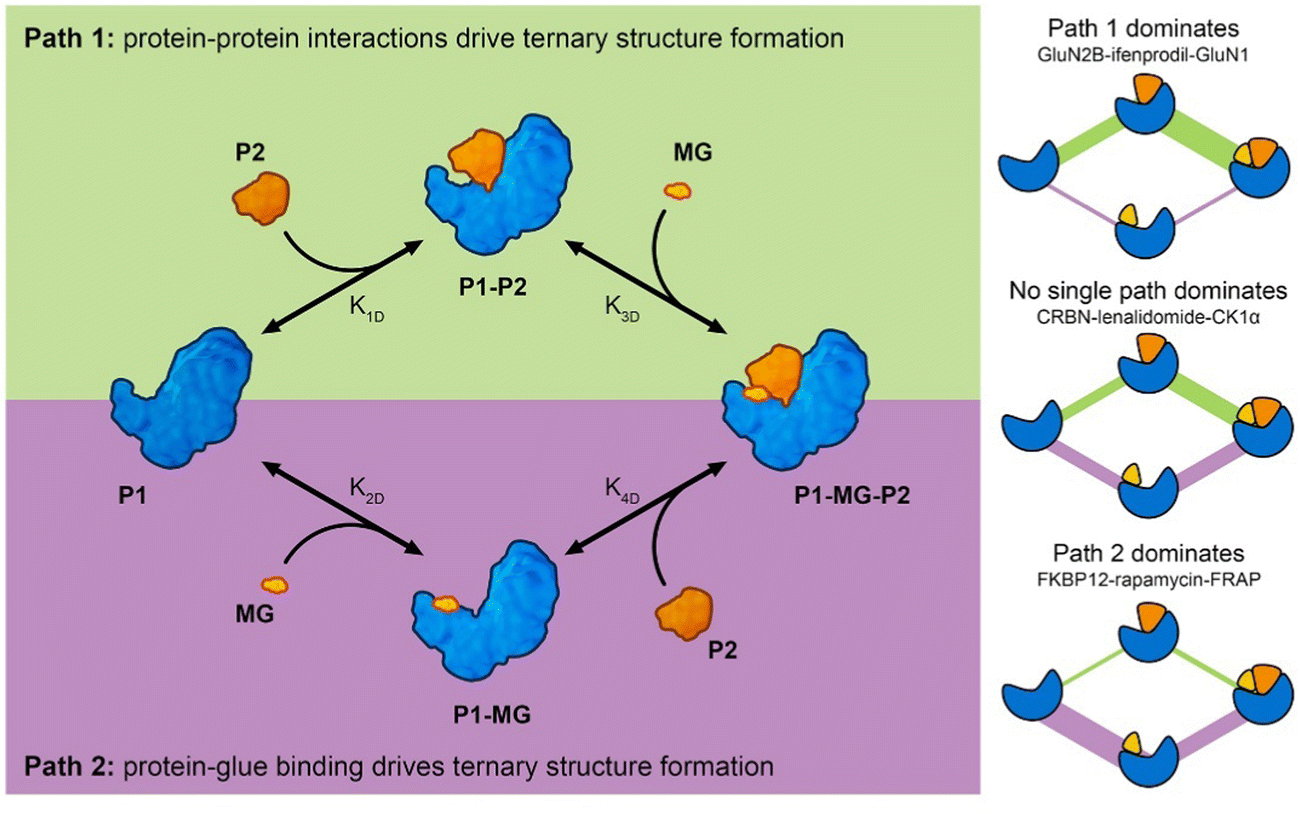 | ||
| Fig. 7 Molecular glue-induced ternary structure formation mechanism. (left) The elementary reactions leading to ternary complexes. There are two paths for ternary structure formation. Path 1 starts from protein–protein binding while Path 2 starts from protein and molecular glue binding. Both paths meet at the final product – the formed ternary complex. (right) Three examples showing complexes with different ternary structure formation mechanisms. In the complex formed by GluN2B, ifenprodil, and GluN1, Path 1 dominates with K1D,GluN2B-GluN1 = 1 μM, K2D,GluN2B-ifenprodil = N.D., and K3D,GluN2B-ifenprodil-GluN1 = 50 nM. In the complex formed by CRBN, lenalidomide, and CK1α, no single path dominates the ternary structure formation (K1D,CRBN-CK1α = 2 μM, K2D,CRBN-lenalidomide = 180 nM, K4D,CRBN-lenalidomide-CK1α = 12 nM). In the complex formed by FKBP12-rapamycin-FRAP, Path 2 dominates with K1D,FKBP12-FRAP = N.D., K2D,FKBP12-rapamycin = 0.2 nM, K4D,FKBP12-rapamycin-FRAP = 12 nM. The color schemes of the components follow those in the graph on the left. These components include P1, P1–P2, P1-MG-P2, and P1-MG starting from the left, going clockwise. The edges connecting the symbols represent the reaction fluxes between different states. The thickness is a rough indication of the amount of flux with thicker lines representing higher flux and route dominance. | ||
Computational approaches for identifying weak protein–protein interfaces
Discovering weak protein–protein interactions that can be further stabilized is key to develop molecular glues. Rational design of molecular glues has been difficult mainly due to a lack of understanding and predictability of weak interactions, for example between the protein of interest and the E3 ubiquitin ligase. As outlined above, the molecular glue can simply enhance an already existing PPI or it can induce one via tight binding to a single protein first. Here, we focus on the first scenario, identifying existing, weak, fortuitous interactions between two proteins could be the first step in rational design and discovery of new molecular glues. However, this approach remains challenging. For known MG-PPI, the binding affinity between the two proteins without the molecular glue can be in the μM range,18,25,47,55,56 too weak for structure determination approaches such as X-ray crystallography. NMR spectroscopy can be used to probe weak protein–protein interactions,57 but the throughput is slow and therefore is ill-suited for the task of screening many potential protein pairs. Computational methods of PPI prediction could be leveraged to fill the gap of identifying PPIs with weak intrinsic binding affinity.Computational approaches for predicting protein–protein complex structures typically involve two steps, complex generation and ranking. The two tasks can be achieved via either physics-based or machine learning (ML)-based and deep learning (DL)-based algorithms. Physics-based approaches rely on the underlying physics of the system and require rather little a priori knowledge, while ML/DL models leverage existing protein–protein complex data to learn the correct patterns for prediction.
Physics-based protein–protein docking methods can further be divided into ab initio approaches, or homology-based approaches to reduce the search space. The homology-based approach searches for homologous complexes with known structures (e.g., templates), which are used to guide docking pose generation.58–62 The ab initio approach uses a variety of methods to search the conformational space of the PPIs, including fast Fourier transform63–65 and geometric hashing,66,67 and spherical polar Fourier correlations.68,69 Both approaches provide candidate docked poses called decoys. Ab initio docking is especially helpful when no homologous complex structures exist of the queries, as is largely the case for molecular glue induced complexes. This makes ab initio docking an attractive tool for generating candidate structures of gluable PPI. Recently, DL techniques have also been used to generate protein–protein complex decoys and have provided results that are on par or better than those generated using traditional physics-based docking approaches and with much less computing time.70,71
After docking poses are generated, a scoring scheme is employed to rank them so that the most plausible structure can be selected. There are two different types of scoring functions, physics-based and knowledge-based. Physics-based scoring functions usually include a weighted, linear combination of energy terms such as van der Waals, electrostatics, and desolvation energies.72,73 They can also include empirical terms such as shape and chemical complementarity of the interacting surfaces and the size of buried interfaces.74,75 The optimal weights of these terms need to be determined using known protein–protein complex systems. Knowledge-based scoring functions typically take the shape of a statistical potential that is constructed using known complex structures.76–79 The frequencies of interactions between atoms or residues are recorded for a set of known, diverse complexes. By applying Boltzmann's equation to the ratio of the observed and expected frequencies for an atom/residue pair, one can estimate its potential of mean force. A total score can then be computed for a given interface as a contribution from all interacting atom/residue pairs and is used in ranking.
Another avenue for developing these special scoring functions is to use a ML model trained on appropriate datasets. There are already several ML-based decoy generation and ranking algorithms46,70,80–83 publicly available. One example is the MaSIF framework70 which uses protein surface patches with precomputed geometric and physicochemical features as inputs. It then applies a geometric neural network to the inputs to generate fingerprint representations. The fingerprints of potential binding partners are scanned and those that show complementarity were used to generate decoys, followed by reranking using another trained neural network. The performance on a test set of 100 complexes is on par with commonly used physics-based docking programs PatchDock84 and ZDOCK85,86 but with a fraction of the computational cost. A recent development of the framework, dMaSIF,87 is a differentiable end-to-end DL model built on the MaSIF framework. It does not require precomputed features and uses a point cloud to represent the protein surface. The change introduced by dMaSIF led to a significant improvement in run time and memory use while maintaining a similar level of performance as MaSIF.
Inspired by the MaSIF and dMaSIF protein–protein interaction prediction workflow, Orasch and coworkers88 devised an DL model that learns the most suitable embeddings for predicting protein–protein interactions using point cloud representation of protein surfaces together with precomputed features. They trained this model using the MaSIF dataset and a more diverse orthogonal dataset and then applied it to predict protein–protein interfaces formed upon PROTAC binding. For a set of 16 complexes, an average area under the receiver operating characteristic curve (ROC AUC) of 0.87 is achieved, much better than a random model which would give an ROC AUC of 0.5. This indicates that the features present in the training set of known protein–protein complexes are likely important in the PROTAC-induced protein–protein interfaces as well. One caveat of the study is that no precision or recall values were reported for the PROTAC-induced complex set. These are important measures of model performance and should be part of model performance evaluation. Still, this study highlights the potential of using ML and DL in predicting weak interfaces, like the ones induced by molecular glues and PROTACs, especially when appropriate datasets are used in training.
A more rigorous approach for ranking the quality of protein–protein poses is to compute the free energy of association. This can be achieved using free energy simulations coupled with enhanced sampling techniques. There are many flavors of free energy calculations. The most commonly used ones are free energy perturbation (FEP),89–91 thermodynamic integration (TI),92 and potential of mean force (PMF) calculations.93 The first two are routinely used to predict binding free energies between proteins and ligands in the drug discovery settings and have shown promise in terms of accuracy and efficiency.94,95 FEP calculations are also starting to gain popularity in mutation effect prediction at protein–protein binding interfaces as encouraging results emerge.96–98 PMF calculations can be used to compute the absolute binding free energy of protein complexes. For example, umbrella sampling simulations99,100 impose a series of biases along a reaction coordinate, in this case the distance between the two binding partners, guiding the dissociation or association of the complex. Methods like the weighted-histogram analysis method101,102 or multistate Bennett acceptance ratio103 can then be used to obtain the unbiased the population distribution along the reaction coordinate, from which the PMF along the reaction coordinate can be computed. The binding free energy is the PMF difference between the associated and fully dissociated states. This approach has been used to study the association of well-characterized barstar-barnase104 protein complex and the predicted binding free energy is within 2 kcal/mol of experimental value.105 Other techniques like metadynamics106 and adaptive bias force107–109 simulations can also be used to sample the conformational space upon association or dissociation and obtain the PMF, from which the binding free energy is extracted. A recent study by Wang et al., showcased the utility of metadynamics in protein–protein binding free energy predictions.110 The dissociation PMF profiles and the binding free energies of 19 distinctive protein–protein complexes were computed and compared with the corresponding experimental measurements. A remarkable R2 of 0.74 was observed between the predicted and the experimental binding free energy values, indicating a high degree of correlation. The main advantage of applying the PMF approach to compute binding free energy is that it uses explicit representation for both the solvent (e.g., water) and the solute atoms and employs molecular dynamics simulations to incorporate conformational flexibility. Even though it produces accurate binding free energies, the computational cost is also considerable. Adequate sampling is the key for success in PMF-based free energy calculations. In the metadynamics study,110 50 replicas and an accumulative simulation time of 2 μs are required to obtain the converged binding free energy for each system tested. However, given the low throughput this approach is restricted for use when a small subset of decoys has already been chosen for analysis or when no other alternatives are available.
Limitations still exist for computational prediction of complex structures. One major obstacle is the lack of ability to incorporate structural rearrangement upon complex formation. Most physics-based and ML-based methods work well on complexes formed between rigid components, but the performance drops when one or both monomers undergo conformational change upon complex formation.59,111,112 Techniques such as soft docking,113–115 ensemble docking,116,117 sidechain optimization,72,118,119 and adaptive conformer generation120 can be applied in ab intio docking to overcome some of the flexibility issues, especially those involving small and local changes (e.g., sidechain rearrangement). Predicting complexes involving large conformational change upon binding is still challenging for ab intio docking. With ML-based methods, by choosing the appropriate protein representation and model architecture, one may be well-positioned when faced with complex prediction challenges where flexibility is involved. For example, a coarse-grained representation of protein surfaces using residue-level instead of atom-level features will likely be less sensitive to sidechain conformational changes and produce reasonable results for those with small induced conformational changes upon binding.112,121 DL methods like AlphaFold71,122 and RoseTTAFold123 use multiple sequence alignment and residue pairwise relations to represent protein structures. These representations are processed by multiple neural networks to predict the relative distances between residues, which are then used to guide the folding of a single chain protein or the binding of two proteins. Because of these representations, such methods are able to succeed in predicting complex structures that undergo large conformational changes upon binding and are traditionally deemed as hard targets.124
Another factor preventing the application of these methods in predicting molecular glue-induced PPI is accuracy. Many of the current scoring functions in docking programs and ML/DL methods are developed using complex datasets with little or no presence of MG-PPI and thus fail. For example, AlphaFold-multimer71 relies on co-evolutionary information encoded in the multiple sequence alignments to guide the complex prediction, but most of the MG-PPI do not have this intrinsic property, except for those involving disease causing mutations on the native substrates of E3 ubiquitin ligases, such as those pS33/pS37 degron mutants and β-TRCP.25 This review serves as a first attempt to understand the interactions governing MG-PPI and how they differ from other protein–protein complexes. With the development of special scoring functions and new, appropriate training datasets we can overcome this important problem.
Concluding discussion
Molecular glue-induced ternary complex is an umbrella term used to describe all protein complexes that require a third entity, usually a small molecule, to assemble or to gain stability. As there is appreciable difference in all known molecular glues,36 there is heterogeneity in the interfaces they induce, as well as the mechanisms of how the ternary complexes are formed. In this review, we divided the PPIs stabilized by molecular glues into two categories, those that involve interfaces from well-folded protein domains and those that feature specific sequence motif and folded domain interactions. The interaction patterns differ for these two types of interfaces with the first showing similarity to the rest of protein–protein interfaces seen in the PDB. The second category of interfaces involve sequence motifs spanning three to thirteen amino acids, many of which have signature interaction motifs such as phosphorylated Ser/Thr and leucine zipper. The different nature of these two types of PPIs demands separate discovery strategies.Based on the currently known molecular glue-induced ternary complexes, the mechanism of ternary structure formation varies for different complexes. On one extreme of the spectrum, ternary structure formation starts from a small molecule binding to one of the protein partners, either altering its surface properties or its conformational distribution, making it more attractive to the other protein partner. On the other end of the spectrum, the two proteins come together first with some binding affinity. The newly formed complex then offers a binding pocket for a molecular glue to bind and stabilize the ternary complex. Most of the ternary complexes likely form using a mixture of these two mechanisms. In essence, the formation of ternary complexes involving molecular glues is similar to that induced by bi-specific degraders.125 From monomers, there are two pathways to form a ternary complex. Each path contains two reactions, binary and ternary formation (Fig. 7). The KD of these reactions are constrained by cooperativity. Three-component systems like these have been studied extensively.125,126 This means that one can interrogate these ternary systems using analytical and numerical simulations. For example, ordinary differential equations can be set up to describe the system of reactions. For a given initial condition, with the KD known, one may compute the amount of ternary complexes formed. On the other hand, for a desired amount of ternary structure formation, one may back calculate the KD that produce such an amount and use this information to guide the identification of molecular glues and neosubstrates.
In the context of E3 ubiquitin ligases, the rational discovery of neosubstrates and molecular glues is difficult because one needs to consider both variables simultaneously. To simplify this problem, it is useful to narrow down the search space by reducing the number of candidate neosubstrates or molecular glues. In the effort to reduce the number of neosubstrates, being able to predict which target protein and E3 ubiquitin ligase pairs are likely to form weak protein–protein interactions that can be further stabilized by small molecules is key. Direct prediction of whether two proteins could come together with the help of a small molecule using cutting edge ML algorithms is challenging due to the lack of appropriate datasets since the number and diversity of known molecular glue-induced complexes is limited. Predicting the binding affinities between two protein partners in a high throughput fashion is still an open challenge. However, protein–protein decoy generation and ranking algorithms, both physics-based and ML-based, show promise in finding the most likely complexes formed between two proteins.70,84–88 These complexes then need to be evaluated by their ability to bind and to be stabilized by small molecules. Such a problem is similar to those in traditional small molecule drug discovery where one needs to identify effective binders for the targets of interest. Experimentally, this is achieved by performing high throughput screens and hit validation followed by lead optimization. Computational approaches such as binding pocket identification,127–132 protein–ligand docking,133–138 virtual screening,139–141 and ligand binding free energy calculations94,95,142,143 can also be applied and have been shown to be helpful in this area. With a combination of computational and experimental approaches, rational discovery of molecular glues may indeed be feasible, even though the best and the most effective solution to this task is yet to be determined.
Recent development of DL models trained on large datasets to predict protein structures122,123 and protein–protein complex structures71,144,145 puts ML/DL methods in the spotlight in all fields of biology. Methods inspired by these ML/DL programs can be extremely helpful in predicting potential complexes between two proteins of interest. Recently, Tsaban et al.146 revealed that AlphaFold2 can be used to predict peptide–protein complexes with reasonable accuracy without using multiple sequence alignment information for the peptide portion based on the hypothesis that binding of a peptide to its well-folded partner is similar to the final step of protein folding,147 where the last piece of unstructured fragment folds unto the folded portion. DL methods like AlphaFold and RosettaFold also hold potential to incorporate conformational changes into complex structure prediction. This is especially helpful for predicting complexes like DDB1-CR8-CDK12, where binding of CR8 to apo CDK12 leads to large conformational change of the latter, revealing a new surface for DDB1 association. By applying attention mechanism to key interactions and folding the complex from scratch, one may finally overcome the challenge of flexible docking. The research in this area is still in early stage but it has been shown in a recent NeurIPS conference paper that using an iterative transformer network, the DL approach, GeoDock148 is able to predict backbone conformational changes upon protein–protein complex formation. Another example of using DL in protein–protein complex prediction is the protein surface embedding developed in the MaSIF framework70 trained using a large structural dataset. This embedding could be used in different kinds of predictions tasks. Language models like BERT (Bidirectional Encoder Representations from Transformers)149 have also been shown to be able to learn protein representations that encode their fundamental properties such as secondary structure, binding site hotspots, and sites for post-translational modification.150,151 Using such a model trained on degron data from the ELM database, Hou and coworkers49 show that they can predict new degrons and assign them to E3 ubiquitin ligases. In conclusion, the outlook for molecular glue discovery is bright and ML/DL methods hold tremendous potential to aid in this process. Framing the question correctly and constructing appropriate datasets are crucial elements to success.
Lastly, being able to predict whether and how ternary structures would form is only solving part of the puzzle. Ultimately, one needs to design small molecule glues that can induce ternary structure formation and degradation of disease relevant neo-substrates. Ternary structure formation does not always guarantee degradation. This has been thoroughly discussed in the review on enzymology of degraders.152 A few recent studies have used physics modeling153,154 and ML techniques155 to predict or rationalize degradability of PROTAC molecules. These studies all point to lysines, especially those that are E2-accesible ubiquitination sites, are indicative of degradation potential. It is difficult to say how generalizable these approaches are as they are mostly based on a handful of E3 ligases. The majority of E3 ligases are underexplored in terms of their structures and their ability to engage in molecular glue-induced degradation. The field is in its early days, but it is quickly evolving. Many exciting new studies are well under way. Concerted efforts from both computational and experimental groups are required to fully understand and harness the E3 ligase-mediated degradation system.
Conflicts of interest
All authors are employees and stockholders for Amgen, Inc.Acknowledgements
We would like to thank members of the Induced Proximity Platform, Medicinal Chemistry, Digital Health and Innovation, and Center for Research Acceleration by Digital Innovation groups at Amgen for helpful discussion. We especially thank Craig Kiefer for figure illustration.References
- T. Ito, H. Ando, T. Suzuki, T. Ogura, K. Hotta, Y. Imamura, Y. Yamaguchi and H. Handa, Identification of a Primary Target of Thalidomide Teratogenicity, Science, 2010, 327(5971), 1345–1350 CrossRef CAS PubMed.
- M. E. Matyskiela, S. Couto, X. Zheng, G. Lu, J. Hui, K. Stamp, C. Drew, Y. Ren, M. Wang, A. Carpenter, C.-W. Lee, T. Clayton, W. Fang, C.-C. Lu, M. Riley, P. Abdubek, K. Blease, J. Hartke, G. Kumar, R. Vessey, M. Rolfe, L. G. Hamann and P. P. Chamberlain, SALL4 mediates teratogenicity as a thalidomide-dependent cereblon substrate, Nat. Chem. Biol., 2018, 14(10), 981–987 CrossRef CAS PubMed.
- P. P. Chamberlain, A. Lopez-Girona, K. Miller, G. Carmel, B. Pagarigan, B. Chie-Leon, E. Rychak, L. G. Corral, Y. J. Ren, M. Wang, M. Riley, S. L. Delker, T. Ito, H. Ando, T. Mori, Y. Hirano, H. Handa, T. Hakoshima, T. O. Daniel and B. E. Cathers, Structure of the human Cereblon–DDB1–lenalidomide complex reveals basis for responsiveness to thalidomide analogs, Nat. Struct. Mol. Biol., 2014, 21(9), 803–809 CrossRef CAS PubMed.
- J. Krönke, N. D. Udeshi, A. Narla, P. Grauman, S. N. Hurst, M. McConkey, T. Svinkina, D. Heckl, E. Comer, X. Li, C. Ciarlo, E. Hartman, N. Munshi, M. Schenone, S. L. Schreiber, S. A. Carr and B. L. Ebert, Lenalidomide Causes Selective Degradation of IKZF1 and IKZF3 in Multiple Myeloma Cells, Science, 2014, 343(6168), 301–305 CrossRef PubMed.
- G. Lu, R. E. Middleton, H. Sun, M. Naniong, C. J. Ott, C. S. Mitsiades, K.-K. Wong, J. E. Bradner and W. G. Kaelin, The Myeloma Drug Lenalidomide Promotes the Cereblon-Dependent Destruction of Ikaros Proteins, Science, 2014, 343(6168), 305–309 CrossRef CAS PubMed.
- E. S. Fischer, K. Bohm, J. R. Lydeard, H. Yang, M. B. Stadler, S. Cavadini, J. Nagel, F. Serluca, V. Acker, G. M. Lingaraju, R. B. Tichkule, M. Schebesta, W. C. Forrester, M. Schirle, U. Hassiepen, J. Ottl, M. Hild, R. E. Beckwith, J. W. Harper, J. L. Jenkins and N. H. Thoma, Structure of the DDB1-CRBN E3 ubiquitin ligase in complex with thalidomide, Nature, 2014, 512(7512), 49–53 CrossRef CAS PubMed.
- J. Krönke, E. C. Fink, P. W. Hollenbach, K. J. MacBeth, S. N. Hurst, N. D. Udeshi, P. P. Chamberlain, D. R. Mani, H. W. Man, A. K. Gandhi, T. Svinkina, R. K. Schneider, M. McConkey, M. Järås, E. Griffiths, M. Wetzler, L. Bullinger, B. E. Cathers, S. A. Carr, R. Chopra and B. L. Ebert, Lenalidomide induces ubiquitination and degradation of CK1α in del(5q) MDS, Nature, 2015, 523(7559), 183–188 CrossRef PubMed.
- T. Owa, H. Yoshino, T. Okauchi, K. Yoshimatsu, Y. Ozawa, N. H. Sugi, T. Nagasu, N. Koyanagi and K. Kitoh, Discovery of Novel Antitumor Sulfonamides Targeting G1 Phase of the Cell Cycle, J. Med. Chem., 1999, 42(19), 3789–3799 CrossRef CAS PubMed.
- T. Han, M. Goralski, N. Gaskill, E. Capota, J. Kim, T. C. Ting, Y. Xie, N. S. Williams and D. Nijhawan, Anticancer sulfonamides target splicing by inducing RBM39 degradation via recruitment to DCAF15, Science, 2017, 356(6336), eaal3755 CrossRef PubMed.
- T. Uehara, Y. Minoshima, K. Sagane, N. H. Sugi, K. O. Mitsuhashi, N. Yamamoto, H. Kamiyama, K. Takahashi, Y. Kotake, M. Uesugi, A. Yokoi, A. Inoue, T. Yoshida, M. Mabuchi, A. Tanaka and T. Owa, Selective degradation of splicing factor CAPERα by anticancer sulfonamides, Nat. Chem. Biol., 2017, 13(6), 675–680 CrossRef CAS PubMed.
- T. C. Ting, M. Goralski, K. Klein, B. Wang, J. Kim, Y. Xie and D. Nijhawan, Aryl Sulfonamides Degrade RBM39 and RBM23 by Recruitment to CRL4-DCAF15, Cell Rep., 2019, 29(6), 1499–1510.e6 CrossRef CAS PubMed.
- D. Benjamin, M. Colombi, C. Moroni and M. N. Hall, Rapamycin passes the torch: a new generation of mTOR inhibitors, Nat. Rev. Drug Discovery, 2011, 10(11), 868–880 CrossRef CAS PubMed.
- P. Germain, C. Gaudon, V. Pogenberg, S. Sanglier, A. Van Dorsselaer, C. A. Royer, M. A. Lazar, W. Bourguet and H. Gronemeyer, Differential Action on Coregulator Interaction Defines Inverse Retinoid Agonists and Neutral Antagonists, Chem. Biol., 2009, 16(5), 479–489 CrossRef CAS PubMed.
- A. le Maire, C. Teyssier, C. Erb, M. Grimaldi, S. Alvarez, A. R. de Lera, P. Balaguer, H. Gronemeyer, C. A. Royer, P. Germain and W. Bourguet, A unique secondary-structure switch controls constitutive gene repression by retinoic acid receptor, Nat. Struct. Mol. Biol., 2010, 17(7), 801–807 CrossRef CAS PubMed.
- J. J. Siekierka, S. H. Hung, M. Poe, C. S. Lin and N. H. J. N. Sigal, A cytosolic binding protein for the immunosuppressant FK506 has peptidyl-prolyl isomerase activity but is distinct from cyclophilin, Nature, 1989, 341(6244), 755–757 CrossRef CAS PubMed.
- P. J. Watson, L. Fairall, G. M. Santos and J. W. R. Schwabe, Structure of HDAC3 bound to co-repressor and inositol tetraphosphate, Nature, 2012, 481(7381), 335–340 CrossRef CAS PubMed.
- C. Ottmann, M. Weyand, T. Sassa, T. Inoue, N. Kato, A. Wittinghofer and C. Oecking, A Structural Rationale for Selective Stabilization of Anti-tumor Interactions of 14-3-3 proteins by Cotylenin A, J. Mol. Biol., 2009, 386(4), 913–919 CrossRef CAS PubMed.
- M. Słabicki, Z. Kozicka, G. Petzold, Y.-D. Li, M. Manojkumar, R. D. Bunker, K. A. Donovan, Q. L. Sievers, J. Koeppel, D. Suchyta, A. S. Sperling, E. C. Fink, J. A. Gasser, L. R. Wang, S. M. Corsello, R. S. Sellar, M. Jan, D. Gillingham, C. Scholl, S. Fröhling, T. R. Golub, E. S. Fischer, N. H. Thomä and B. L. Ebert, The CDK inhibitor CR8 acts as a molecular glue degrader that depletes cyclin K, Nature, 2020, 585(7824), 293–297 CrossRef PubMed.
- C. Mayor-Ruiz, S. Bauer, M. Brand, Z. Kozicka, M. Siklos, H. Imrichova, I. H. Kaltheuner, E. Hahn, K. Seiler, A. Koren, G. Petzold, M. Fellner, C. Bock, A. C. Müller, J. Zuber, M. Geyer, N. H. Thomä, S. Kubicek and G. E. Winter, Rational discovery of molecular glue degraders via scalable chemical profiling, Nat. Chem. Biol., 2020, 16(11), 1199–1207 CrossRef CAS PubMed.
- L. Lv, P. Chen, L. Cao, Y. Li, Z. Zeng, Y. Cui, Q. Wu, J. Li, J.-H. Wang and M.-Q. J. E. Dong, Discovery of a molecular glue promoting CDK12-DDB1 interaction to trigger cyclin K degradation, eLife, 2020, 9, e59994 CrossRef CAS PubMed.
- S. Brenner and R. A. Lerner, Encoded combinatorial chemistry, Proc. Natl. Acad. Sci. U. S. A., 1992, 89(12), 5381–5383 CrossRef CAS PubMed.
- N. Favalli, G. Bassi, J. Scheuermann and D. Neri, DNA-encoded chemical libraries – achievements and remaining challenges, FEBS Lett., 2018, 592(12), 2168–2180 CrossRef CAS PubMed.
- R. A. Goodnow, C. E. Dumelin and A. D. Keefe, DNA-encoded chemistry: enabling the deeper sampling of chemical space, Nat. Rev. Drug Discovery, 2017, 16(2), 131–147 CrossRef CAS PubMed.
- D. Neri and R. A. Lerner, DNA-Encoded Chemical Libraries: A Selection System Based on Endowing Organic Compounds with Amplifiable Information, Annu. Rev. Biochem., 2018, 87(1), 479–502 CrossRef CAS PubMed.
- K. R. Simonetta, J. Taygerly, K. Boyle, S. E. Basham, C. Padovani, Y. Lou, T. J. Cummins, S. L. Yung, S. K. von Soly, F. Kayser, J. Kuriyan, M. Rape, M. Cardozo, M. A. Gallop, N. F. Bence, P. A. Barsanti and A. Saha, Prospective discovery of small molecule enhancers of an E3 ligase-substrate interaction, Nat. Commun., 2019, 10(1), 1402 CrossRef PubMed.
- M. E. Matyskiela, G. Lu, T. Ito, B. Pagarigan, C.-C. Lu, K. Miller, W. Fang, N.-Y. Wang, D. Nguyen, J. Houston, G. Carmel, T. Tran, M. Riley, L. A. Nosaka, G. C. Lander, S. Gaidarova, S. Xu, A. L. Ruchelman, H. Handa, J. Carmichael, T. O. Daniel, B. E. Cathers, A. Lopez-Girona and P. P. Chamberlain, A novel cereblon modulator recruits GSPT1 to the CRL4CRBN ubiquitin ligase, Nature, 2016, 535(7611), 252–257 CrossRef CAS PubMed.
- E. S. Wang, A. L. Verano, R. P. Nowak, J. C. Yuan, K. A. Donovan, N. A. Eleuteri, H. Yue, K. H. Ngo, P. H. Lizotte, P. C. Gokhale, N. S. Gray and E. S. Fischer, Acute pharmacological degradation of Helios destabilizes regulatory T cells, Nat. Chem. Biol., 2021, 17(6), 711–717 CrossRef CAS PubMed.
- B. Zarzycka, M. A. Kuenemann, M. A. Miteva, G. A. F. Nicolaes, G. Vriend and O. Sperandio, Stabilization of protein–protein interaction complexes through small molecules, Drug Discovery Today, 2016, 21(1), 48–57 CrossRef CAS PubMed.
- S. A. Andrei, E. Sijbesma, M. Hann, J. Davis, G. O’Mahony, M. W. D. Perry, A. Karawajczyk, J. Eickhoff, L. Brunsveld, R. G. Doveston, L.-G. Milroy and C. Ottmann, Stabilization of protein–protein interactions in drug discovery, Expert Opin. Drug Discovery, 2017, 12(9), 925–940 CrossRef CAS PubMed.
- P. P. Chamberlain and B. E. Cathers, Cereblon modulators: Low molecular weight inducers of protein degradation, Drug Discovery Today: Technol., 2019, 31, 29–34 CrossRef PubMed.
- G. Dong, Y. Ding, S. He and C. Sheng, Molecular Glues for Targeted Protein Degradation: From Serendipity to Rational Discovery, J. Med. Chem., 2021, 64(15), 10606–10620 CrossRef CAS PubMed.
- T. B. Faust, K. A. Donovan, H. Yue, P. P. Chamberlain and E. S. Fischer, Small-Molecule Approaches to Targeted Protein Degradation, Annu. Rev. Cancer Biol., 2021, 5(1), 181–201 CrossRef.
- Z. Kozicka and N. H. Thomä, Haven't got a glue: Protein surface variation for the design of molecular glue degraders, Cell Chem. Biol., 2021, 28(7), 1032–1047 CrossRef CAS PubMed.
- S. L. Schreiber, The Rise of Molecular Glues, Cell, 2021, 184(1), 3–9 CrossRef CAS PubMed.
- A. Domostegui, L. Nieto-Barrado, C. Perez-Lopez and C. Mayor-Ruiz, Chasing molecular glue degraders: screening approaches, Chem. Soc. Rev., 2022, 51(13), 5498–5517 RSC.
- T. M. Geiger, S. C. Schäfer, J. K. Dreizler, M. Walz and F. Hausch, Clues to molecular glues, Curr. Opin. Chem. Biol., 2022, 2, 100018 CrossRef CAS.
- J. M. Sasso, R. Tenchov, D. S. Wang, L. S. Johnson, X. Wang and Q. A. Zhou, Molecular glues: The adhesive connecting targeted protein degradation to the clinic, Biochemistry, 2022 DOI:10.1021/acs.biochem.2c00245.
- N. Kerres, S. Steurer, S. Schlager, G. Bader, H. Berger, M. Caligiuri, C. Dank, J. R. Engen, P. Ettmayer, B. Fischerauer, G. Flotzinger, D. Gerlach, T. Gerstberger, T. Gmaschitz, P. Greb, B. Han, E. Heyes, R. E. Iacob, D. Kessler, H. Kölle, L. Lamarre, D. R. Lancia, S. Lucas, M. Mayer, K. Mayr, N. Mischerikow, K. Mück, C. Peinsipp, O. Petermann, U. Reiser, D. Rudolph, K. Rumpel, C. Salomon, D. Scharn, R. Schnitzer, A. Schrenk, N. Schweifer, D. Thompson, E. Traxler, R. Varecka, T. Voss, A. Weiss-Puxbaum, S. Winkler, X. Zheng, A. Zoephel, N. Kraut, D. McConnell, M. Pearson and M. Koegl, Chemically Induced Degradation of the Oncogenic Transcription Factor BCL6, Cell Rep., 2017, 20(12), 2860–2875 CrossRef CAS PubMed.
- M. Słabicki, H. Yoon, J. Koeppel, L. Nitsch, S. S. Roy Burman, C. Di Genua, K. A. Donovan, A. S. Sperling, M. Hunkeler, J. M. Tsai, R. Sharma, A. Guirguis, C. Zou, P. Chudasama, J. A. Gasser, P. G. Miller, C. Scholl, S. Fröhling, R. P. Nowak, E. S. Fischer and B. L. Ebert, Small-molecule-induced polymerization triggers degradation of BCL6, Nature, 2020, 588(7836), 164–168 CrossRef PubMed.
- Schrodinger, LLC, The PyMOL Molecular Graphics System, Version 1.8. 2015.
- T. Vreven, I. H. Moal, A. Vangone, B. G. Pierce, P. L. Kastritis, M. Torchala, R. Chaleil, B. Jiménez-García, P. A. Bates, J. Fernandez-Recio, A. M. Bonvin and Z. Weng, Updates to the Integrated Protein-Protein Interaction Benchmarks: Docking Benchmark Version 5 and Affinity Benchmark Version 2, J. Mol. Biol., 2015, 427(19), 3031–3041 CrossRef CAS PubMed.
- R. Chen, J. Mintseris, J. Janin and Z. Weng, A protein–protein docking benchmark, Proteins: Struct., Funct., Genet., 2003, 52(1), 88–91 CrossRef CAS PubMed.
- J. Mintseris, K. Wiehe, B. Pierce, R. Anderson, R. Chen, J. Janin and Z. Weng, Protein–protein docking benchmark 2.0: An update, Proteins: Struct., Funct., Genet., 2005, 60(2), 214–216 CrossRef CAS PubMed.
- H. Hwang, B. Pierce, J. Mintseris, J. Janin and Z. Weng, Protein–protein docking benchmark version 3.0, Proteins: Struct., Funct., Genet., 2008, 73(3), 705–709 CrossRef CAS PubMed.
- H. Hwang, T. Vreven, J. Janin and Z. Weng, Protein–protein docking benchmark version 4.0, Proteins: Struct., Funct., Genet., 2010, 78(15), 3111–3114 CrossRef CAS PubMed.
- R. J. L. Townshend, R. Bedi, P. A. Suriana and R. O. Dror, End-to-end learning on 3D protein structure for interface prediction, In Proceedings of the 33rd International Conference on Neural Information Processing Systems, Curran Associates Inc., 2019, p. 1401.
- L. B. Sheard, X. Tan, H. Mao, J. Withers, G. Ben-Nissan, T. R. Hinds, Y. Kobayashi, F.-F. Hsu, M. Sharon, J. Browse, S. Y. He, J. Rizo, G. A. Howe and N. Zheng, Jasmonate perception by inositol-phosphate-potentiated COI1–JAZ co-receptor, Nature, 2010, 468(7322), 400–405 CrossRef CAS PubMed.
- M. Kumar, M. Gouw, S. Michael, H. Sámano-Sánchez, R. Pancsa, J. Glavina, A. Diakogianni, J. A. Valverde, D. Bukirova, J. Čalyševa, N. Palopoli, N. E. Davey, L. B. Chemes and T. J. Gibson, ELM—the eukaryotic linear motif resource in 2020, Nucleic Acid Res., 2019, 48(D1), D296–D306 Search PubMed.
- C. Hou, Y. Li, M. Wang, H. Wu and T. Li, Systematic prediction of degrons and E3 ubiquitin ligase binding via deep learning, BMC Biol., 2022, 20(1), 162 CrossRef CAS PubMed.
- H. E. Xu, T. B. Stanley, V. G. Montana, M. H. Lambert, B. G. Shearer, J. E. Cobb, D. D. McKee, C. M. Galardi, K. D. Plunket, R. T. Nolte, D. J. Parks, J. T. Moore, S. A. Kliewer, T. M. Willson and J. B. Stimmel, Structural basis for antagonist-mediated recruitment of nuclear co-repressors by PPARα, Nature, 2002, 415(6873), 813–817 CrossRef CAS PubMed.
- K. Bettayeb, N. Oumata, A. Echalier, Y. Ferandin, J. A. Endicott, H. Galons and L. Meijer, CR8, a potent and selective, roscovitine-derived inhibitor of cyclin-dependent kinases, Oncogene, 2008, 27(44), 5797–5807 CrossRef CAS PubMed.
- B. E. Bierer, P. S. Mattila, R. F. Standaert, L. A. Herzenberg, S. J. Burakoff, G. Crabtree and S. L. Schreiber, Two distinct signal transmission pathways in T lymphocytes are inhibited by complexes formed between an immunophilin and either FK506 or rapamycin, Proc. Natl. Acad. Sci. U. S. A., 1990, 87(23), 9231–9235 CrossRef CAS PubMed.
- L. A. Banaszynski, C. W. Liu and T. J. Wandless, Characterization of the FKBP·Rapamycin·FRB Ternary Complex, J. Am. Chem. Soc., 2005, 127(13), 4715–4721 CrossRef CAS PubMed.
- E. Karakas, N. Simorowski and H. Furukawa, Subunit arrangement and phenylethanolamine binding in GluN1/GluN2B NMDA receptors, Nature, 2011, 475(7355), 249–253 CrossRef CAS PubMed.
- S. Cao, S. Kang, H. Mao, J. Yao, L. Gu and N. Zheng, Defining molecular glues with a dual-nanobody cannabidiol sensor, Nat. Commun., 2022, 13(1), 815 CrossRef CAS PubMed.
- X. Du, O. A. Volkov, R. M. Czerwinski, H. Tan, C. Huerta, E. R. Morton, J. P. Rizzi, P. M. Wehn, R. Xu, D. Nijhawan and E. M. Wallace, Structural Basis and Kinetic Pathway of RBM39 Recruitment to DCAF15 by a Sulfonamide Molecular Glue E7820, Structure, 2019, 27(11), 1625–1633.e3 CrossRef CAS PubMed.
- J. Vaynberg and J. Qin, Weak protein–protein interactions as probed by NMR spectroscopy, Trends Biotechnol., 2006, 24(1), 22–27 CrossRef CAS PubMed.
- P. J. Kundrotas, I. Anishchenko, T. Dauzhenka, I. Kotthoff, D. Mnevets, M. M. Copeland and I. A. Vakser, Dockground: A comprehensive data resource for modeling of protein complexes, Protein Sci., 2018, 27(1), 172–181 CrossRef CAS PubMed.
- P. J. Kundrotas and I. A. Vakser, Global and local structural similarity in protein-protein complexes: implications for template-based docking, Proteins, 2013, 81(12), 2137–2142 CrossRef CAS PubMed.
- A. S. Aytuna, A. Gursoy and O. Keskin, Prediction of protein-protein interactions by combining structure and sequence conservation in protein interfaces, Bioinformatics, 2005, 21(12), 2850–2855 CrossRef CAS PubMed.
- D. Petrey and B. Honig, Structural bioinformatics of the interactome, Annu. Rev. Biophys., 2014, 43, 193–210 CrossRef CAS PubMed.
- A. Szilagyi and Y. Zhang, Template-based structure modeling of protein-protein interactions, Curr. Opin. Struct. Biol., 2014, 24, 10–23 CrossRef CAS PubMed.
- H. A. Gabb, R. M. Jackson and M. J. E. Sternberg, Modelling protein docking using shape complementarity, electrostatics and biochemical information11 Edited by J. Thornton, J. Mol. Biol., 1997, 272(1), 106–120 CrossRef CAS PubMed.
- E. Katchalski-Katzir, I. Shariv, M. Eisenstein, A. A. Friesem, C. Aflalo and I. A. Vakser, Molecular surface recognition: determination of geometric fit between proteins and their ligands by correlation techniques, Proc. Natl. Acad. Sci. U. S. A., 1992, 89(6), 2195–2199 CrossRef CAS PubMed.
- D. Padhorny, A. Kazennov, B. S. Zerbe, K. A. Porter, B. Xia, S. E. Mottarella, Y. Kholodov, D. W. Ritchie, S. Vajda and D. Kozakov, Protein–protein docking by fast generalized Fourier transforms on 5D rotational manifolds, Proc. Natl. Acad. Sci. U. S. A., 2016, 113(30), E4286–E4293 CrossRef CAS PubMed.
- E. Mashiach, D. Schneidman-Duhovny, A. Peri, Y. Shavit, R. Nussinov and H. J. Wolfson, An integrated suite of fast docking algorithms, Proteins: Struct., Funct., Genet., 2010, 78(15), 3197–3204 CrossRef CAS PubMed.
- D. Schneidman-Duhovny, Y. Inbar, R. Nussinov and H. J. Wolfson, PatchDock and SymmDock: servers for rigid and symmetric docking, Nucleic Acids Res., 2005, 33(Web Server issue), W363–W367 CrossRef CAS PubMed.
- D. W. Ritchie and G. J. L. Kemp, Protein docking using spherical polar Fourier correlations, Proteins: Struct., Funct., Genet., 2000, 39(2), 178–194 CrossRef CAS.
- G. Macindoe, L. Mavridis, V. Venkatraman, M.-D. Devignes and D. W. Ritchie, HexServer: an FFT-based protein docking server powered by graphics processors, Nucleic Acid Res., 2010, 38(suppl_2), W445–W449 CrossRef CAS PubMed.
- P. Gainza, F. Sverrisson, F. Monti, E. Rodolà, D. Boscaini, M. M. Bronstein and B. E. Correia, Deciphering interaction fingerprints from protein molecular surfaces using geometric deep learning, Nat. Methods, 2020, 17(2), 184–192 CrossRef CAS PubMed.
- R. Evans, M. O’Neill, A. Pritzel, N. Antropova, A. Senior, T. Green, A. Žídek, R. Bates, S. Blackwell, J. Yim, O. Ronneberger, S. Bodenstein, M. Zielinski, A. Bridgland, A. Potapenko, A. Cowie, K. Tunyasuvunakool, R. Jain, E. Clancy, P. Kohli, J. Jumper and D. Hassabis, Protein complex prediction with AlphaFold-Multimer, bioRxiv, 2022 DOI:10.1101/2021.10.04.463034.
- J. J. Gray, S. Moughon, C. Wang, O. Schueler-Furman, B. Kuhlman, C. A. Rohl and D. Baker, Protein–Protein Docking with Simultaneous Optimization of Rigid-body Displacement and Side-chain Conformations, J. Mol. Biol., 2003, 331(1), 281–299 CrossRef CAS PubMed.
- T. M.-K. Cheng, T. L. Blundell and J. Fernandez-Recio, pyDock: Electrostatics and desolvation for effective scoring of rigid-body protein–protein docking, Proteins: Struct., Funct., Genet., 2007, 68(2), 503–515 CrossRef CAS PubMed.
- V. Venkatraman, Y. D. Yang, L. Sael and D. Kihara, Protein-protein docking using region-based 3D Zernike descriptors, BMC Bioinf., 2009, 10(1), 407 CrossRef PubMed.
- X. Gong, P. Wang, F. Yang, S. Chang, B. Liu, H. He, L. Cao, X. Xu, C. Li, W. Chen and C. Wang, Protein–protein docking with binding site patch prediction and network-based terms enhanced combinatorial scoring, Proteins: Struct., Funct., Bioinf., 2010, 78(15), 3150–3155 CrossRef CAS PubMed.
- G. Moont, H. A. Gabb and M. J. E. Sternberg, Use of pair potentials across protein interfaces in screening predicted docked complexes, Proteins: Struct., Funct., Bioinf., 1999, 35(3), 364–373 CrossRef CAS.
- L. Jiang, Y. Gao, F. Mao, Z. Liu and L. Lai, Potential of mean force for protein–protein interaction studies, Proteins: Struct., Funct., Bioinf., 2002, 46(2), 190–196 CrossRef CAS PubMed.
- S.-Y. Huang and X. Zou, An iterative knowledge-based scoring function for protein–protein recognition, Proteins: Struct., Funct., Genet., 2008, 72(2), 557–579 CrossRef CAS PubMed.
- S. Viswanath, D. V. S. Ravikant and R. Elber, Improving ranking of models for protein complexes with side chain modeling and atomic potentials, Proteins: Struct., Funct., Bioinf., 2013, 81(4), 592–606 CrossRef CAS PubMed.
- X. Wang, S. T. Flannery and D. Kihara, Protein Docking Model Evaluation by Graph Neural Networks, Front. Mol. Biosci., 2021, 8, 647915 CrossRef CAS PubMed.
- X. Wang, G. Terashi, C. W. Christoffer, M. Zhu and D. Kihara, Protein docking model evaluation by 3D deep convolutional neural networks, Bioinformatics, 2020, 36(7), 2113–2118 CrossRef CAS PubMed.
- N. Renaud, C. Geng, S. Georgievska, F. Ambrosetti, L. Ridder, D. F. Marzella, M. F. Réau, A. M. J. J. Bonvin and L. C. Xue, DeepRank: a deep learning framework for data mining 3D protein-protein interfaces, Nat. Commun., 2021, 12(1), 7068 CrossRef CAS PubMed.
- S. Eismann, R. J. L. Townshend, N. Thomas, M. Jagota, B. Jing and R. O. Dror, Hierarchical, rotation-equivariant neural networks to select structural models of protein complexes, Proteins: Struct., Funct., Genet., 2021, 89(5), 493–501 CrossRef CAS PubMed.
- D. Duhovny, R. Nussinov and H. J. Wolfson, in Efficient Unbound Docking of Rigid Molecules, Algorithms in Bioinformatics, ed. R. Guigó and D. Gusfield, Springer Berlin Heidelberg, Berlin, Heidelberg, 2002, pp. 185–200 Search PubMed.
- B. G. Pierce, Y. Hourai and Z. Weng, Accelerating protein docking in ZDOCK using an advanced 3D convolution library, PLoS One, 2011, 6(9), e24657 CrossRef CAS PubMed.
- B. Pierce and Z. Weng, A combination of rescoring and refinement significantly improves protein docking performance, Proteins: Struct., Funct., Genet., 2008, 72(1), 270–279 CrossRef CAS PubMed.
- F. Sverrisson, J. Feydy, B. E. Correia and M. M. Bronstein, In Fast end-to-end learning on protein surfaces, 2021 IEEE/CVF Conference on Computer Vision and Pattern Recognition (CVPR), 20-25 June 2021; 2021; pp. 15267–15276.
- O. Orasch, N. Weber, M. Müller, A. Amanzadi, C. Gasbarri and C. Trummer, Protein-protein interaction prediction for targeted protein degradation, Int. J. Mol. Sci., 2022, 23(13), 7033 CrossRef CAS PubMed.
- R. W. Zwanzig, High-Temperature Equation of State by a Perturbation Method. I. Nonpolar Gases, J. Chem. Phys., 1954, 22(8), 1420–1426 CrossRef CAS.
- W. L. Jorgensen and L. L. Thomas, Perspective on Free-Energy Perturbation Calculations for Chemical Equilibria, J. Chem. Theory Comput., 2008, 4, 869–876 CrossRef CAS PubMed.
- Y. Deng and B. Roux, Computations of Standard Binding Free Energies with Molecular Dynamics Simulations, J. Phys. Chem. B, 2009, 113(8), 2234–2246 CrossRef CAS PubMed.
- J. G. Kirkwood, Statistical Mechanics of Fluid Mixtures, J. Chem. Phys., 1935, 3(5), 300–313 CrossRef CAS.
- B. Roux, The calculation of the potential of mean force using computer simulations, Comput. Phys. Commun., 1995, 91(1), 275–282 CrossRef CAS.
- T.-S. Lee, B. K. Allen, T. J. Giese, Z. Guo, P. Li, C. Lin, T. D. McGee, D. A. Pearlman, B. K. Radak, Y. Tao, H.-C. Tsai, H. Xu, W. Sherman and D. M. York, Alchemical Binding Free Energy Calculations in AMBER20: Advances and Best Practices for Drug Discovery, J. Chem. Inf. Model., 2020, 60(11), 5595–5623 CrossRef CAS PubMed.
- L. Wang, Y. Wu, Y. Deng, B. Kim, L. Pierce, G. Krilov, D. Lupyan, S. Robinson, M. K. Dahlgren, J. Greenwood, D. L. Romero, C. Masse, J. L. Knight, T. Steinbrecher, T. Beuming, W. Damm, E. Harder, W. Sherman, M. Brewer, R. Wester, M. Murcko, L. Frye, R. Farid, T. Lin, D. L. Mobley, W. L. Jorgensen, B. J. Berne, R. A. Friesner and R. Abel, Accurate and Reliable Prediction of Relative Ligand Binding Potency in Prospective Drug Discovery by Way of a Modern Free-Energy Calculation Protocol and Force Field, J. Am. Chem. Soc., 2015, 137(7), 2695–2703 CrossRef CAS PubMed.
- A. J. Clark, C. Negron, K. Hauser, M. Sun, L. Wang, R. Abel and R. A. Friesner, Relative Binding Affinity Prediction of Charge-Changing Sequence Mutations with FEP in Protein–Protein Interfaces, J. Mol. Biol., 2019, 431(7), 1481–1493 CrossRef CAS PubMed.
- A. J. Clark, T. Gindin, B. Zhang, L. Wang, R. Abel, C. S. Murret, F. Xu, A. Bao, N. J. Lu, T. Zhou, P. D. Kwong, L. Shapiro, B. Honig and R. A. Friesner, Free Energy Perturbation Calculation of Relative Binding Free Energy between Broadly Neutralizing Antibodies and the gp120 Glycoprotein of HIV-1, J. Mol. Biol., 2017, 429(7), 930–947 CrossRef CAS PubMed.
- F. Fratev, N501Y and K417N Mutations in the Spike Protein of SARS-CoV-2 Alter the Interactions with Both hACE2 and Human-Derived Antibody: A Free Energy of Perturbation Retrospective Study, J. Chem. Inf. Model., 2021, 61(12), 6079–6084 CrossRef CAS PubMed.
- M. Mezei, Adaptive umbrella sampling: Self-consistent determination of the non-Boltzmann bias, J. Comput. Phys., 1987, 68(1), 237–248 CrossRef.
- G. M. Torrie and J. P. Valleau, Nonphysical sampling distributions in Monte Carlo free-energy estimation: Umbrella sampling, J. Comput. Phys., 1977, 23(2), 187–199 CrossRef.
- S. Kumar, J. M. Rosenberg, D. Bouzida, R. H. Swendsen and P. A. Kollman, THE weighted histogram analysis method for free-energy calculations on biomolecules. I. The method, J. Comput. Chem., 1992, 13(8), 1011–1021 CrossRef CAS.
- M. Souaille and B. t Roux, Extension to the weighted histogram analysis method: combining umbrella sampling with free energy calculations, Comput. Phys. Commun., 2001, 135(1), 40–57 CrossRef CAS.
- M. R. Shirts and J. D. Chodera, Statistically optimal analysis of samples from multiple equilibrium states, J. Chem. Phys., 2008, 129(12), 124105 CrossRef PubMed.
- G. Schreiber and A. R. Fersht, Energetics of protein-protein interactions: Analysis ofthe Barnase-Barstar interface by single mutations and double mutant cycles, J. Mol. Biol., 1995, 248(2), 478–486 CAS.
- J. C. Gumbart, B. Roux and C. Chipot, Efficient Determination of Protein–Protein Standard Binding Free Energies from First Principles, J. Chem. Theory Comput., 2013, 9(8), 3789–3798 CrossRef CAS PubMed.
- A. Laio and M. Parrinello, Escaping free-energy minima, Proc. Natl. Acad. Sci. U. S. A., 2002, 99(20), 12562–12566 CrossRef CAS PubMed.
- E. Darve and A. Pohorille, Calculating free energies using average force, J. Chem. Phys., 2001, 115(20), 9169–9183 CrossRef CAS.
- J. Comer, J. C. Gumbart, J. Hénin, T. Lelièvre, A. Pohorille and C. Chipot, The Adaptive Biasing Force Method: Everything You Always Wanted To Know but Were Afraid To Ask, J. Phys. Chem. B, 2015, 119(3), 1129–1151 CrossRef CAS PubMed.
- A. Lesage, T. Lelièvre, G. Stoltz and J. Hénin, Smoothed Biasing Forces Yield Unbiased Free Energies with the Extended-System Adaptive Biasing Force Method, J. Phys. Chem. B, 2017, 121(15), 3676–3685 CrossRef CAS PubMed.
- J. Wang, A. Ishchenko, W. Zhang, A. Razavi and D. Langley, A highly accurate metadynamics-based Dissociation Free Energy method to calculate protein–protein and protein–ligand binding potencies, Sci. Rep., 2022, 12(1), 2024 CrossRef CAS PubMed.
- T. Vreven, H. Hwang, B. G. Pierce and Z. Weng, Evaluating template-based and template-free protein–protein complex structure prediction, Briefings Bioinf., 2014, 15(2), 169–176 CrossRef CAS PubMed.
- B. Dai and C. Bailey-Kellogg, Protein interaction interface region prediction by geometric deep learning, Bioinformatics, 2021, 37(17), 2580–2588 CrossRef CAS PubMed.
- B. Ma, T. Elkayam, H. Wolfson and R. Nussinov, Protein–protein interactions: Structurally conserved residues distinguish between binding sites and exposed protein surfaces, Proc. Natl. Acad. Sci. U. S. A., 2003, 100(10), 5772–5777 CrossRef CAS PubMed.
- A. Heifetz and M. Eisenstein, Effect of local shape modifications of molecular surfaces on rigid-body protein–protein docking, Protein Eng., Des. Sel., 2003, 16(3), 179–185 CrossRef CAS PubMed.
- P. N. Palma, L. Krippahl, J. E. Wampler and J. J. G. J. P. S. Moura, BiGGER: A new (soft) docking algorithm for predicting protein interactions, Proteins: Struct., Funct., Genet., 2000, 39, 372–384 CrossRef CAS.
- R. Grünberg, J. Leckner and M. Nilges, Complementarity of Structure Ensembles in Protein-Protein Binding, Structure, 2004, 12(12), 2125–2136 CrossRef PubMed.
- G. R. Smith, M. J. E. Sternberg and P. A. Bates, The Relationship between the Flexibility of Proteins and their Conformational States on Forming Protein–Protein Complexes with an Application to Protein–Protein Docking, J. Mol. Biol., 2005, 347(5), 1077–1101 CrossRef CAS PubMed.
- J. Fernández-Recio, M. Totrov and R. Abagyan, ICM-DISCO docking by global energy optimization with fully flexible side-chains, Proteins: Struct., Funct., Genet., 2003, 52(1), 113–117 CrossRef PubMed.
- C. Dominguez, R. Boelens and A. M. J. J. Bonvin, HADDOCK: A Protein−Protein Docking Approach Based on Biochemical or Biophysical Information, J. Am. Chem. Soc., 2003, 125(7), 1731–1737 CrossRef CAS PubMed.
- N. A. Marze, S. S. Roy Burman, W. Sheffler and J. J. Gray, Efficient flexible backbone protein–protein docking for challenging targets, Bioinformatics, 2018, 34(20), 3461–3469 CrossRef CAS PubMed.
- R. Sanchez-Garcia, C. O. S. Sorzano, J. M. Carazo and J. Segura, BIPSPI: a method for the prediction of partner-specific protein–protein interfaces, Bioinformatics, 2018, 35(3), 470–477 CrossRef PubMed.
- J. Jumper, R. Evans, A. Pritzel, T. Green, M. Figurnov, O. Ronneberger, K. Tunyasuvunakool, R. Bates, A. Žídek, A. Potapenko, A. Bridgland, C. Meyer, S. A. A. Kohl, A. J. Ballard, A. Cowie, B. Romera-Paredes, S. Nikolov, R. Jain, J. Adler, T. Back, S. Petersen, D. Reiman, E. Clancy, M. Zielinski, M. Steinegger, M. Pacholska, T. Berghammer, S. Bodenstein, D. Silver, O. Vinyals, A. W. Senior, K. Kavukcuoglu, P. Kohli and D. Hassabis, Highly accurate protein structure prediction with AlphaFold, Nature, 2021, 596(7873), 583–589 CrossRef CAS PubMed.
- M. Baek, F. DiMaio, I. Anishchenko, J. Dauparas, S. Ovchinnikov, G. R. Lee, J. Wang, Q. Cong, L. N. Kinch, R. D. Schaeffer, C. Millán, H. Park, C. Adams, C. R. Glassman, A. DeGiovanni, J. H. Pereira, A. V. Rodrigues, A. A. van Dijk, A. C. Ebrecht, D. J. Opperman, T. Sagmeister, C. Buhlheller, T. Pavkov-Keller, M. K. Rathinaswamy, U. Dalwadi, C. K. Yip, J. E. Burke, K. C. Garcia, N. V. Grishin, P. D. Adams, R. J. Read and D. Baker, Accurate prediction of protein structures and interactions using a three-track neural network, Science, 2021, 373(6557), 871–876 CrossRef CAS PubMed.
- R. Yin, B. Y. Feng, A. Varshney and B. G. Pierce, Benchmarking AlphaFold for protein complex modeling reveals accuracy determinants, Protein Sci., 2022, 31, e4379 CrossRef CAS PubMed.
- E. F. Douglass, C. J. Miller, G. Sparer, H. Shapiro, D. A. Spiegel and A. Comprehensive, Mathematical Model for Three-Body Binding Equilibria, J. Am. Chem. Soc., 2013, 135(16), 6092–6099 CrossRef CAS PubMed.
- G. Gnacadja, A method to calculate binding equilibrium concentrations in the allosteric ternary complex model that supports ligand depletion, Math. Biosci., 2011, 232(2), 135–141 CrossRef CAS PubMed.
- D. Kozakov, L. E. Grove, D. R. Hall, T. Bohnuud, S. E. Mottarella, L. Luo, B. Xia, D. Beglov and S. Vajda, The FTMap family of web servers for determining and characterizing ligand-binding hot spots of proteins, Nat. Protoc., 2015, 10(5), 733–755 CrossRef CAS PubMed.
- C.-H. Ngan, D. R. Hall, B. Zerbe, L. E. Grove, D. Kozakov and S. Vajda, FTSite: high accuracy detection of ligand binding sites on unbound protein structures, Bioinformatics, 2012, 28(2), 286–287 CrossRef CAS PubMed.
- R. Brenke, D. Kozakov, G.-Y. Chuang, D. Beglov, D. Hall, M. R. Landon, C. Mattos and S. Vajda, Fragment-based identification of druggable ‘hot spots’ of proteins using Fourier domain correlation techniques, Bioinformatics, 2009, 25(5), 621–627 CrossRef CAS PubMed.
- T. Halgren, New Method for Fast and Accurate Binding-site Identification and Analysis, Chem. Biol. Drug Des., 2007, 69(2), 146–148 CrossRef CAS PubMed.
- T. A. Halgren, Identifying and Characterizing Binding Sites and Assessing Druggability, J. Chem. Inf. Model., 2009, 49(2), 377–389 CrossRef CAS PubMed.
- A. Meller, M. Ward, J. Borowsky, J. M. Lotthammer, M. Kshirsagar, F. Oviedo, J. L. Ferres and G. R. Bowman, Predicting the locations of cryptic pockets from single protein structures using the PocketMiner graph neural network, bioRxiv, 2022 DOI:10.1101/2022.06.28.497399.
- J. Bao, X. He and J. Z. H. Zhang, DeepBSP—a Machine Learning Method for Accurate Prediction of Protein–Ligand Docking Structures, J. Chem. Inf. Model., 2021, 61(5), 2231–2240 CrossRef CAS PubMed.
- I. Igashov, A. R. Jamasb, A. Sadek, F. Sverrisson, A. Schneuing, P. Liò, T. L. Blundell, M. Bronstein and B. Correia, Decoding Surface Fingerprints for Protein–Ligand Interactions, bioRxiv, 2022 DOI:10.1101/2022.04.26.489341.
- A. T. McNutt, P. Francoeur, R. Aggarwal, T. Masuda, R. Meli, M. Ragoza, J. Sunseri and D. R. Koes, GNINA 1.0: molecular docking with deep learning, J. Cheminf., 2021, 13(1), 43 Search PubMed.
- S. Ruiz-Carmona, D. Alvarez-Garcia, N. Foloppe, A. B. Garmendia-Doval, S. Juhos, P. Schmidtke, X. Barril, R. E. Hubbard and S. D. Morley, rDock: A Fast, Versatile and Open Source Program for Docking Ligands to Proteins and Nucleic Acids, PLoS Comput. Biol., 2014, 10(4), e1003571 CrossRef PubMed.
- J. Eberhardt, D. Santos-Martins, A. F. Tillack and S. Forli, AutoDock Vina 1.2.0: New Docking Methods, Expanded Force Field, and Python Bindings, J. Chem. Inf. Model., 2021, 61(8), 3891–3898 CrossRef CAS PubMed.
- O. Trott and A. J. Olson, AutoDock Vina: Improving the speed and accuracy of docking with a new scoring function, efficient optimization, and multithreading, J. Comput. Chem., 2010, 31(2), 455–461 CAS.
- E. Vitali, F. Ficarelli, M. Bisson, D. Gadioli, M. Fatica, A. R. Beccari and G. J. A. P. A. Palermo, GPU-optimized Approaches to Molecular Docking-based Virtual Screening in Drug Discovery: A Comparative Analysis, arXiv, 2022 DOI:10.48550/arxiv.2209.05069.
- U. Rester, From virtuality to reality - Virtual screening in lead discovery and lead optimization: a medicinal chemistry perspective, Curr. Opin. Drug Discovery Dev., 2008, 11(4), 559–568 CAS.
- W. P. Walters, M. T. Stahl and M. A. Murcko, Virtual screening—an overview, Drug Discovery Today, 1998, 3(4), 160–178 CrossRef CAS.
- R. Abel, L. Wang, E. D. Harder, B. J. Berne and R. A. Friesner, Advancing Drug Discovery through Enhanced Free Energy Calculations, Acc. Chem. Res., 2017, 50(7), 1625–1632 CrossRef CAS PubMed.
- J. Thompson, W. P. Walters, J. A. Feng, N. A. Pabon, H. Xu, B. B. Goldman, D. Moustakas, M. Schmidt and F. York, Optimizing active learning for free energy calculations, Artif. Intell. Life Sci., 2022, 2, 100050 Search PubMed.
- I. R. Humphreys, J. Pei, M. Baek, A. Krishnakumar, I. Anishchenko, S. Ovchinnikov, J. Zhang, T. J. Ness, S. Banjade, S. R. Bagde, V. G. Stancheva, X.-H. Li, K. Liu, Z. Zheng, D. J. Barrero, U. Roy, J. Kuper, I. S. Fernández, B. Szakal, D. Branzei, J. Rizo, C. Kisker, E. C. Greene, S. Biggins, S. Keeney, E. A. Miller, J. C. Fromme, T. L. Hendrickson, Q. Cong and D. Baker, Computed structures of core eukaryotic protein complexes, Science, 2021, 374(6573), eabm4805 CrossRef CAS PubMed.
- D. F. Burke, P. Bryant, I. Barrio-Hernandez, D. Memon, G. Pozzati, A. Shenoy, W. Zhu, A. S. Dunham, P. Albanese, A. Keller, R. A. Scheltema, J. E. Bruce, A. Leitner, P. Kundrotas, P. Beltrao and A. Elofsson, Towards a structurally resolved human protein interaction network, bioRxiv, 2021 DOI:10.1101/2021.11.08.467664.
- T. Tsaban, J. K. Varga, O. Avraham, Z. Ben-Aharon, A. Khramushin and O. Schueler-Furman, Harnessing protein folding neural networks for peptide–protein docking, Nat. Commun., 2022, 13(1), 176 CrossRef CAS PubMed.
- P. Vanhee, F. Stricher, L. Baeten, E. Verschueren, T. Lenaerts, L. Serrano, F. Rousseau and J. Schymkowitz, Protein-Peptide Interactions Adopt the Same Structural Motifs as Monomeric Protein Folds, Structure, 2009, 17(8), 1128–1136 CrossRef CAS PubMed.
- L.-S. Chu, J. A. Ruffolo and J. J. Gray, Protein-Protein Docking with Iterative Transformer. NeurIPS MLSB 2022.
- J. Devlin, M.-W. Chang, K. Lee and K. Toutanova, BERT: Pre-training of Deep Bidirectional Transformers for Language Understanding, arXiv, 2018, DOI:10.48550/arxiv.1810.04805.
- J. Vig, A. Madani, L. R. Varshney, C. Xiong, R. Socher and N. F. Rajani, BERTology Meets Biology: Interpreting Attention in Protein Language Models, arXiv, 2020, DOI:10.48550/arxiv.2006.15222.
- A. Rives, J. Meier, T. Sercu, S. Goyal, Z. Lin, J. Liu, D. Guo, M. Ott, C. L. Zitnick, J. Ma and R. Fergus, Biological structure and function emerge from scaling unsupervised learning to 250 million protein sequences, Proc. Natl. Acad. Sci. U. S. A., 2021, 118(15), e2016239118 CrossRef CAS PubMed.
- S. L. Fisher and A. J. Phillips, Targeted protein degradation and the enzymology of degraders, Curr. Opin. Chem. Biol., 2018, 44, 47–55 CrossRef CAS PubMed.
- T. Dixon, D. MacPherson, B. Mostofian, T. Dauzhenka, S. Lotz, D. McGee, S. Shechter, U. R. Shrestha, R. Wiewiora, Z. A. McDargh, F. Pei, R. Pal, J. V. Ribeiro, T. Wilkerson, V. Sachdeva, N. Gao, S. Jain, S. Sparks, Y. Li, A. Vinitsky, X. Zhang, A. M. Razavi, I. Kolossváry, J. Imbriglio, A. Evdokimov, L. Bergeron, W. Zhou, J. Adhikari, B. Ruprecht, A. Dickson, H. Xu, W. Sherman and J. A. Izaguirre, Predicting the structural basis of targeted protein degradation by integrating molecular dynamics simulations with structural mass spectrometry, Nat. Commun., 2022, 13(1), 5884 CrossRef CAS PubMed.
- N. Bai, K. M. Riching, A. Makaju, H. Wu, T. M. Acker, S.-C. Ou, Y. Zhang, X. Shen, D. N. Bulloch, H. Rui, B. W. Gibson, D. L. Daniels, M. Urh, B. M. Rock and S. C. Humphreys, Modeling the CRL4A ligase complex to predict target protein ubiquitination induced by cereblon-recruiting PROTACs, J. Biol. Chem., 2022, 298(4), 101653 CrossRef CAS PubMed.
- W. Zhang, S. S. R. Burman, J. Chen, K. A. Donovan, Y. Cao, C. Shu, B. Zhang, Z. Zeng, S. Gu, Y. Zhang, D. Li, E. S. Fischer, C. Tokheim and X. S. Liu, Machine Learning Modeling of Protein-intrinsic Features Predicts Tractability of Targeted Protein Degradation, Genomics, Proteomics Bioinf., 2022 DOI:10.1016/j.gpb.2022.11.008.
- K. Miyazono, T. Miyakawa, Y. Sawano, K. Kubota, H. J. Kang, A. Asano, Y. Miyauchi, M. Takahashi, Y. Zhi, Y. Fujita, T. Yoshida, K. S. Kodaira, K. Yamaguchi-Shinozaki and M. Tanokura, Structural basis of abscisic acid signalling, Nature, 2009, 462(7273), 609–614 CrossRef CAS PubMed.
- F. Dupeux, J. Santiago, K. Betz, J. Twycross, S. Y. Park, L. Rodriguez, M. Gonzalez-Guzman, M. R. Jensen, N. Krasnogor, M. Blackledge, M. Holdsworth, S. R. Cutler, P. L. Rodriguez and J. A. Marquez, A thermodynamic switch modulates abscisic acid receptor sensitivity, EMBO J., 2011, 30(20), 4171–4184 CrossRef CAS PubMed.
- P. Yin, H. Fan, Q. Hao, X. Yuan, D. Wu, Y. Pang, C. Yan, W. Li, J. Wang and N. Yan, Structural insights into the mechanism of abscisic acid signaling by PYL proteins, Nat. Struct. Mol. Biol., 2009, 16(12), 1230–1236 CrossRef CAS PubMed.
- S. Han, M. K. Min, S. Y. Lee, C. W. Lim, N. Bhatnagar, Y. Lee, D. Shin, K. Y. Chung, S. C. Lee, B. G. Kim and S. Lee, Modulation of ABA Signaling by Altering VxGPhiL Motif of PP2Cs in Oryza sativa, Mol. Plant, 2017, 10(9), 1190–1205 CrossRef CAS PubMed.
- S. Han, J.-y Lee, Y. Lee, T.-H. Kim and S. Lee, Comprehensive survey of the VxGΦL motif of PP2Cs from Oryza sativa reveals the critical role of the fourth position in regulation of ABA responsiveness, Plant Mol. Biol., 2019, 101(4), 455–469 CrossRef CAS PubMed.
- PubChem Bioassay Record for Bioactivity AID 1412034 - SID 404713788, Bioactivity for AID 1412034-SID 404713788. In ChEMBL, National Center for Biotechnology Information: 2022.
- J. J. Siekierka, S. H. Hung, M. Poe, C. S. Lin and N. H. Sigal, A cytosolic binding protein for the immunosuppressant FK506 has peptidyl-prolyl isomerase activity but is distinct from cyclophilin, Nature, 1989, 341(6244), 755–757 CrossRef CAS PubMed.
- D. E. Bussiere, L. Xie, H. Srinivas, W. Shu, A. Burke, C. Be, J. Zhao, A. Godbole, D. King, R. G. Karki, V. Hornak, F. Xu, J. Cobb, N. Carte, A. O. Frank, A. Frommlet, P. Graff, M. Knapp, A. Fazal, B. Okram, S. Jiang, P. Y. Michellys, R. Beckwith, H. Voshol, C. Wiesmann, J. M. Solomon and J. Paulk, Structural basis of indisulam-mediated RBM39 recruitment to DCAF15 E3 ligase complex, Nat. Chem. Biol., 2020, 16(1), 15–23 CrossRef CAS PubMed.
- T. B. Faust, H. Yoon, R. P. Nowak, K. A. Donovan, Z. Li, Q. Cai, N. A. Eleuteri, T. Zhang, N. S. Gray and E. S. Fischer, Structural complementarity facilitates E7820-mediated degradation of RBM39 by DCAF15, Nat. Chem. Biol., 2020, 16(1), 7–14 CrossRef CAS PubMed.
- S. Robineau, M. Chabre and B. Antonny, Binding site of brefeldin A at the interface between the small G protein ADP-ribosylation factor 1 (ARF1) and the nucleotide-exchange factor Sec7 domain, Proc. Natl. Acad. Sci. U. S. A., 2000, 97(18), 9913–9918 CrossRef CAS PubMed.
- J. Viaud, M. Zeghouf, H. Barelli, J. C. Zeeh, A. Padilla, B. Guibert, P. Chardin, C. A. Royer, J. Cherfils and A. Chavanieu, Structure-based discovery of an inhibitor of Arf activation by Sec7 domains through targeting of protein-protein complexes, Proc. Natl. Acad. Sci. U. S. A., 2007, 104(25), 10370–10375 CrossRef CAS PubMed.
- M. Zhang, J. M. Pascal, M. Schumann, R. S. Armen and J. F. Zhang, Identification of the functional binding pocket for compounds targeting small-conductance Ca(2)(+)-activated potassium channels, Nat. Commun., 2012, 3, 1021 CrossRef PubMed.
- Z. Y. Wang, H. Seto, S. Fujioka, S. Yoshida and J. Chory, BRI1 is a critical component of a plasma-membrane receptor for plant steroids, Nature, 2001, 410(6826), 380–383 CrossRef CAS PubMed.
- H. Huang, D. F. Ceccarelli, S. Orlicky, D. J. St-Cyr, A. Ziemba, P. Garg, S. Plamondon, M. Auer, S. Sidhu, A. Marinier, G. Kleiger, M. Tyers and F. Sicheri, E2 enzyme inhibition by stabilization of a low-affinity interface with ubiquitin, Nat. Chem. Biol., 2014, 10(2), 156–163 CrossRef CAS PubMed.
- D. St-Cyr, D. F. Ceccarelli, S. Orlicky, A. M. van der Sloot, X. Tang, S. Kelso, S. Moore, C. James, G. Posternak, J. Coulombe-Huntington, T. Bertomeu, A. Marinier, F. Sicheri and M. Tyers, Identification and optimization of molecular glue compounds that inhibit a noncovalent E2 enzyme–ubiquitin complex, Sci. Adv., 2021, 7(44), eabi5797 CrossRef CAS PubMed.
- C. W. Garvie, X. Wu, M. Papanastasiou, S. Lee, J. Fuller, G. R. Schnitzler, S. W. Horner, A. Baker, T. Zhang, J. P. Mullahoo, L. Westlake, S. H. Hoyt, M. Toetzl, M. J. Ranaghan, L. de Waal, J. McGaunn, B. Kaplan, F. Piccioni, X. Yang, M. Lange, A. Tersteegen, D. Raymond, T. A. Lewis, S. A. Carr, A. D. Cherniack, C. T. Lemke, M. Meyerson and H. Greulich, Structure of PDE3A-SLFN12 complex reveals requirements for activation of SLFN12 RNase, Nat. Commun., 2021, 12(1), 4375 CrossRef CAS PubMed.
- C. Ottmann, S. Marco, N. Jaspert, C. Marcon, N. Schauer, M. Weyand, C. Vandermeeren, G. Duby, M. Boutry, A. Wittinghofer, J.-L. Rigaud and C. Oecking, Structure of a 14-3-3 Coordinated Hexamer of the Plant Plasma Membrane H + -ATPase by Combining X-Ray Crystallography and Electron Cryomicroscopy, Mol. Cell, 2007, 25(3), 427–440 CrossRef CAS PubMed.
- A. T. Fuglsang, S. Visconti, K. Drumm, T. Jahn, A. Stensballe, B. Mattei, O. N. Jensen, P. Aducci and M. G. Palmgren, Binding of 14-3-3 Protein to the Plasma Membrane H + -ATPase AHA2 Involves the Three C-terminal Residues Tyr946-Thr-Val and Requires Phosphorylation of Thr947, J. Biol. Chem., 1999, 274(51), 36774–36780 CrossRef CAS PubMed.
- M. Wurtele, C. Jelich-Ottmann, A. Wittinghofer and C. Oecking, Structural view of a fungal toxin acting on a 14-3-3 regulatory complex, EMBO J., 2003, 22(5), 987–994 CrossRef PubMed.
- R. Rose, S. Erdmann, S. Bovens, A. Wolf, M. Rose, S. Hennig, H. Waldmann and C. Ottmann, Identification and structure of small-molecule stabilizers of 14-3-3 protein-protein interactions, Angew. Chem., Int. Ed., 2010, 49(24), 4129–4132 CrossRef CAS PubMed.
- C. Ottmann, M. Weyand, T. Sassa, T. Inoue, N. Kato, A. Wittinghofer and C. Oecking, A structural rationale for selective stabilization of anti-tumor interactions of 14-3-3 proteins by cotylenin A, J. Mol. Biol., 2009, 386(4), 913–919 CrossRef CAS PubMed.
- L. G. Milroy, L. Brunsveld and C. Ottmann, Stabilization and inhibition of protein-protein interactions: the 14-3-3 case study, ACS Chem. Biol., 2013, 8(1), 27–35 CrossRef CAS PubMed.
- M. Molzan, S. Kasper, L. Roglin, M. Skwarczynska, T. Sassa, T. Inoue, F. Breitenbuecher, J. Ohkanda, N. Kato, M. Schuler and C. Ottmann, Stabilization of physical RAF/14-3-3 interaction by cotylenin A as treatment strategy for RAS mutant cancers, ACS Chem. Biol., 2013, 8(9), 1869–1875 CrossRef CAS PubMed.
- R. G. Doveston, A. Kuusk, S. A. Andrei, S. Leysen, Q. Cao, M. P. Castaldi, A. Hendricks, L. Brunsveld, H. Chen, H. Boyd and C. Ottmann, Small-molecule stabilization of the p53 - 14-3-3 protein-protein interaction, FEBS Lett., 2017, 591(16), 2449–2457 CrossRef CAS PubMed.
- A. Kaplan, S. A. Andrei, A. van Regteren Altena, T. Simas, S. L. Banerjee, N. Kato, N. Bisson, Y. Higuchi, C. Ottmann and A. E. Fournier, Polypharmacological Perturbation of the 14-3-3 Adaptor Protein Interactome Stimulates Neurite Outgrowth, Cell Chem. Biol., 2020, 27(6), 657–667.e6 CrossRef CAS PubMed.
- I. J. De Vries-van Leeuwen, D. da Costa Pereira, K. D. Flach, S. R. Piersma, C. Haase, D. Bier, Z. Yalcin, R. Michalides, K. A. Feenstra, C. R. Jiménez, T. F. A. de Greef, L. Brunsveld, C. Ottmann, W. Zwart and A. H. de Boer, Interaction of 14-3-3 proteins with the Estrogen Receptor Alpha F domain provides a drug target interface, Proc. Natl. Acad. Sci. U. S. A., 2013, 110(22), 8894–8899 CrossRef CAS PubMed.
- F. Bosica, S. A. Andrei, J. F. Neves, P. Brandt, A. Gunnarsson, I. Landrieu, C. Ottmann and G. O'Mahony, Design of Drug-Like Protein–Protein Interaction Stabilizers Guided By Chelation-Controlled Bioactive Conformation Stabilization, Chem. – Eur. J., 2020, 26(31), 7131–7139 CrossRef CAS PubMed.
- D. Bier, S. Mittal, K. Bravo-Rodriguez, A. Sowislok, X. Guillory, J. Briels, C. Heid, M. Bartel, B. Wettig, L. Brunsveld, E. Sanchez-Garcia, T. Schrader and C. Ottmann, The Molecular Tweezer CLR01 Stabilizes a Disordered Protein–Protein Interface, J. Am. Chem. Soc., 2017, 139(45), 16256–16263 CrossRef CAS PubMed.
- D. Bier, M. Bartel, K. Sies, S. Halbach, Y. Higuchi, Y. Haranosono, T. Brummer, N. Kato and C. Ottmann, Small-Molecule Stabilization of the 14-3-3/Gab2 Protein–Protein Interaction (PPI) Interface, ChemMedChem, 2016, 11(8), 911–918 CrossRef CAS PubMed.
- C. Anders, Y. Higuchi, K. Koschinsky, M. Bartel, B. Schumacher, P. Thiel, H. Nitta, R. Preisig-Müller, G. Schlichthörl, V. Renigunta, J. Ohkanda, J. Daut, N. Kato and C. Ottmann, A Semisynthetic Fusicoccane Stabilizes a Protein-Protein Interaction and Enhances the Expression of K+ Channels at the Cell Surface, Chem. Biol., 2013, 20(4), 583–593 CrossRef CAS PubMed.
- S. A. Andrei, P. de Vink, E. Sijbesma, L. Han, L. Brunsveld, N. Kato, C. Ottmann and Y. Higuchi, Rationally Designed Semisynthetic Natural Product Analogues for Stabilization of 14-3-3 Protein–Protein Interactions, Angew. Chem., Int. Ed., 2018, 57(41), 13470–13474 CrossRef CAS PubMed.
- Q. L. Sievers, G. Petzold, R. D. Bunker, A. Renneville, M. Slabicki, B. J. Liddicoat, W. Abdulrahman, T. Mikkelsen, B. L. Ebert and N. H. Thoma, Defining the human C2H2 zinc finger degrome targeted by thalidomide analogs through CRBN, Science, 2018, 362(6414), eaat0572 CrossRef PubMed.
- H. Furihata, S. Yamanaka, T. Honda, Y. Miyauchi, A. Asano, N. Shibata, M. Tanokura, T. Sawasaki and T. Miyakawa, Structural bases of IMiD selectivity that emerges by 5-hydroxythalidomide, Nat. Commun., 2020, 11(1), 4578 CrossRef CAS PubMed.
- AppTec, W. Unleashing the potential of hit discovery. https://www.crelux.com/pdf/HitS-at-a-glance.pdf.
- G. Nishiguchi, F. Keramatnia, J. Min, Y. Chang, B. Jonchere, S. Das, M. Actis, J. Price, D. Chepyala, B. Young, K. McGowan, P. J. Slavish, A. Mayasundari, J. A. Jarusiewicz, L. Yang, Y. Li, X. Fu, S. H. Garrett, J. B. Papizan, K. Kodali, J. Peng, S. M. Pruett Miller, M. F. Roussel, C. Mullighan, M. Fischer and Z. Rankovic, Identification of Potent, Selective, and Orally Bioavailable Small-Molecule GSPT1/2 Degraders from a Focused Library of Cereblon Modulators, J. Med. Chem., 2021, 64(11), 7296–7311 CrossRef CAS PubMed.
- N. Dharmasiri, S. Dharmasiri and M. Estelle, The F-box protein TIR1 is an auxin receptor, Nature, 2005, 435(7041), 441–445 CrossRef CAS PubMed.
- S. R. Harborough, A. P. Kalverda, G. S. Thompson, M. Kieffer, M. Kubes, M. Quareshy, V. Uzunova, J. M. Prusinska, K.-I. Hayashi, R. Napier, I. W. Manfield and S. Kepinski, A fuzzy encounter complex precedes formation of the fully-engaged TIR1-Aux/IAA auxin co-receptor system, bioRxiv, 2019 DOI:10.1101/781922.
- K. P. Madauss, E. T. Grygielko, S.-J. Deng, A. C. Sulpizio, T. B. Stanley, C. Wu, S. A. Short, S. K. Thompson, E. L. Stewart, N. J. Laping, S. P. Williams and J. D. Bray, A Structural and in Vitro Characterization of Asoprisnil: A Selective Progesterone Receptor Modulator, Mol. Endocrinol., 2007, 21(5), 1066–1081 CrossRef CAS PubMed.
| This journal is © The Royal Society of Chemistry 2023 |