
 Open Access Article
 This Open Access Article is licensed under a Creative Commons Attribution-Non Commercial 3.0 Unported Licence
Harnessing graphene oxide nanocarriers for siRNA delivery in a 3D spheroid model of lung cancer
Francesca
Grilli
ab,
Eman M.
Hassan
a,
Fabio
Variola
 b and
Shan
Zou
*ac
b and
Shan
Zou
*ac
aMetrology Research Centre, National Research Council of Canada, 100 Sussex Drive, Ottawa, ON K1A 0R6, Canada. E-mail: shan.zou@nrc-cnrc.gc.ca; Tel: +1-613 9499675
bDepartment of Mechanical Engineering, University of Ottawa, 800 King Edward Avenue, Ottawa, ON K1N 6N5, Canada
cDepartment of Chemistry, Carleton University, 1125 Colonel By Drive, Ottawa, ON K1S 5B6, Canada
First published on 9th August 2023
Abstract
Gene therapy has been recently proposed as an effective strategy for cancer treatment. A significant body of literature proved the effectiveness of nanocarriers to deliver therapeutic agents to 2D tumour models, which are simple but not always representative of the in vivo reality. In this study, we analyze the efficiency of 3D spheroids combined with a minimally modified graphene oxide (GO)-based nanocarrier for siRNA delivery as a new system for cell transfection. Small interfering RNA (siRNA) targeting cluster of differentiation 47 (CD47; CD47_siRNA) was used as an anti-tumour therapeutic agent to silence the genes expressing CD47. This is a surface marker able to send a “don't eat me” signal to macrophages to prevent their phagocytosis. Also, we report the analysis of different GO formulations, in terms of size (small: about 100 nm; large: >650 nm) and functionalization (unmodified or modified with polyethylene glycol (PEG) and the dendrimer PAMAM), aiming to establish the efficiency of unmodified GO as a nanocarrier for the transfection of A549 lung cancer spheroids. Small modified GO (smGO) showed the highest transfection efficiency values (>90%) in 3D models. Interestingly, small unmodified GO (sGO) was found to be promising for transfection, with efficiency values >80% using a higher siRNA ratio (i.e., 3![[thin space (1/6-em)]](https://www.rsc.org/images/entities/char_2009.gif) :1). These results demonstrated the higher efficiency of spheroids compared to 2D models for transfection, and the high potential of unmodified GO to carry siRNA, providing a promising new in vitro model system for the analysis of anticancer gene therapies.
:1). These results demonstrated the higher efficiency of spheroids compared to 2D models for transfection, and the high potential of unmodified GO to carry siRNA, providing a promising new in vitro model system for the analysis of anticancer gene therapies.
Introduction
Cancer is one of the primary causes of mortality worldwide,1 and the study of its biology and possible treatment is one of the main goals of biomedical research. To improve our understanding of its mechanisms towards more effective therapeutic solutions, significant efforts have been applied to the development of physiologically accurate in vitro models in order to find a connection between two-dimensional (2D) cell cultures and animal models. Results from this work have yielded three-dimensional (3D) models such as in vitro tumour spheroids.2 Several studies have been carried out to compare the cytotoxicity, internalization, and cellular sensitivity to chemotherapeutic drugs or other anticancer therapies, such as radiotherapy or gene therapy, using both 2D and 3D models.2–5 It was found that cell behavior is highly dependent on the model used, showing higher sensitivity for the therapeutic agent in 2D and 3D as a function of the cell line. However, the size of spheroids and cell packing density could play an important role in uptake tests using nanoparticles, introducing new parameters, such as the limitation of nutrient transport and the complexity of cell–cell interactions in vitro.6 Therefore, cellular spheroids have become a complex heterogeneous model with cell–cell interactions and a gradient of oxygen, pH, and nanoparticle concentration between the outermost layers and the centre of mass, which is more representative of reality.2,6,7 Moreover, cells arranged in spheroidal structures (spheroids) within 3D culture systems have been observed to exhibit a more realistic phenotype compared to cells grown in conventional 2D monolayer cultures.8In the last decade, gene therapy has gained increasing interest due to its high potential for the effective treatment of cancer, cardiovascular diseases, rare infections and genetic diseases.9,10 In the case of cancer, transfection can be used to change the protein expression of the cells to make them less aggressive or more sensitive to therapeutic agents or even just to the patient's immune system. In this context, cluster of differentiation 47 (CD47) is a surface protein that is expressed by many normal cell lines, but overexpressed on almost all tumours and acts by regulating several signaling systems associated with tumour growth and invasion.11–13 One of the main pathways of CD47 inhibits the action of the immune system. Upon binding of this protein to the inhibitory receptor (i.e., signal regulatory protein, SIRPα), present on the surface of macrophages, the CD47–receptor complex sends an antiphagocytic “don't eat me” signal to prevent phagocytosis.12–14 Suppression of CD47 overexpression on cancer cells can lead to inhibition of the resistance of the tumour itself by making it “visible” to immune surveillance and thus being eliminated through phagocytosis.11 In the field of gene therapy, RNA is a powerful therapeutic tool currently established for manipulating gene expression.15,16 In particular, small interfering RNA (siRNA) can be employed as a promising anti-cancer technique to specifically and selectively down-regulate protein expression by targeting and binding the specific mRNA present in the cytosol of cells, thanks to the complementary base pairing.17 We and others have tested the siRNA targeting CD47 (CD47_siRNA) to effectively knock down CD47 protein expression in several cancer cell lines (Scheme 1), inhibiting the anti-phagocytosis signal of such cancer cells and demonstrating their susceptibility to macrophages following treatment.11,17–19 In order to achieve transfection, the siRNA must enter the body, pass through the circulation and reach the tumour site and penetrate the cell membrane to bind the mRNA inside the cancerous cells. During this journey, several difficulties and barriers can arise which limit the efficacy and use of siRNA. Within the blood, unprotected nucleic acid must avoid renal filtration, internalization by phagocytes, aggregation with serum proteins, and enzymatic degradation by endogenous nucleases.20 The half-life of unmodified siRNA within blood has been estimated to range from several minutes to 1 hour.21 Furthermore, the absence of tumour recognition factors makes targeting non-specific within the body. Therefore, a gene that shares a similarity with the target gene can be inadvertently silenced, with possible unwanted side effects. Finally, penetration through the cell membrane can be difficult as nucleic acids and the plasma membrane both have strong hydrophilicity and net negative charge.21,22 These effects result in a limited therapeutic efficiency of siRNA with a small percentage arriving to the target tumour cells, even after injecting large quantities of siRNA.17 These considerations suggest that siRNA delivery needs an effective carrier in order to achieve successful and efficient tumour transfection.
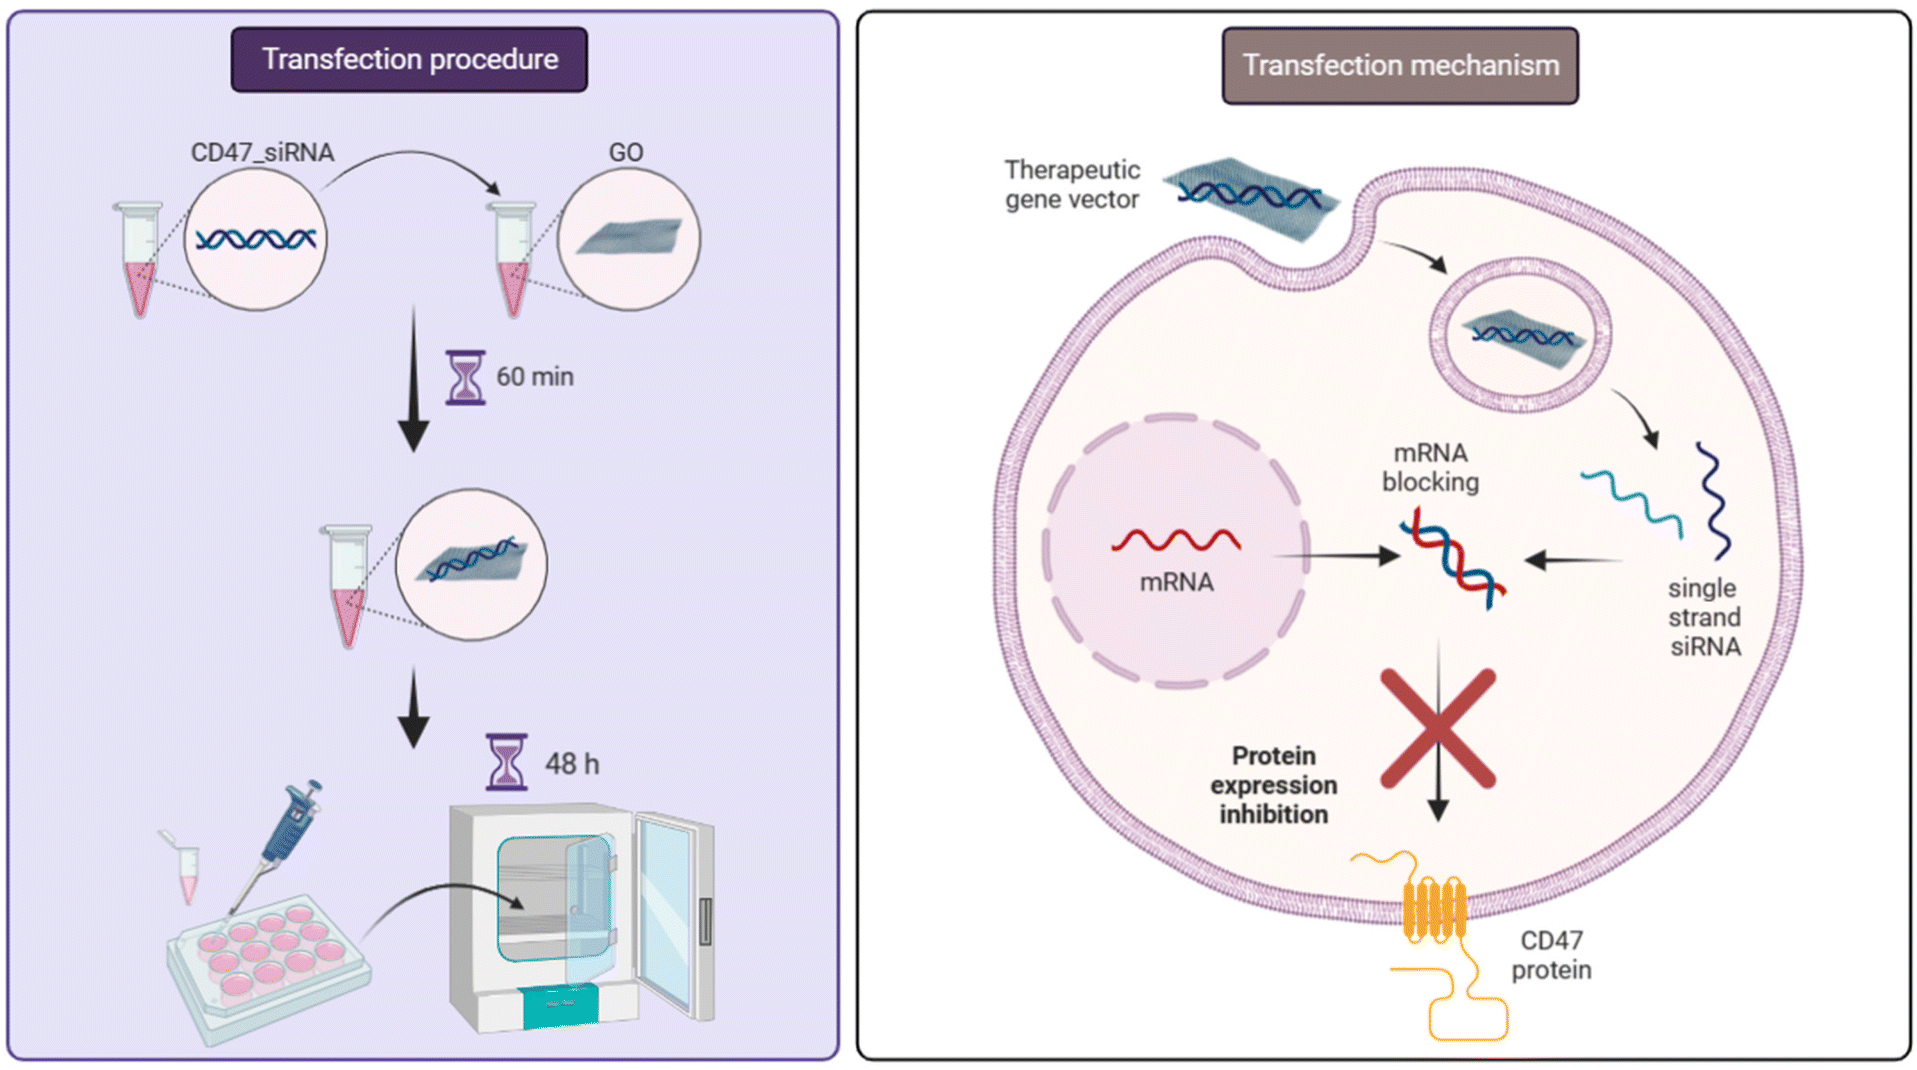 | ||
| Scheme 1 Schematic representation of CD47_siRNA binding on GO nanosheets and their delivery inside cancer cells and the cell transfection mechanism. | ||
Among the large arrays of available nanocarriers, graphene oxide (GO) has gained a lot of interest during the past two decades due to its unique characteristics, such as a two-dimensional single-layer structure, which provides it a high surface-to-volume ratio that is very important in interacting with cells.23 In fact, a large surface area allows more interactions with cellular structures and likely achieves greater internalization, while a small volume limits its toxicity as less material will have to be removed from the body.23,24 The most commonly observed uptake mechanism for the internalization of graphene oxide is through endocytic pathways, with caveolin-dependent endocytosis being the prevailing mechanism.25 This particular mechanism involves the nanoparticles being exposed to a neutral pH environment within a structure called a caveosome.26 Notably, the process of GO internalization is influenced by various factors, including the cell line employed and the size of GO flakes.27,28 Additionally, other parameters such as shape and surface charge can impact this mechanism.26,28 Smaller GO sizes (50–200 nm) have generally demonstrated heightened internalization efficiency. However, it is noteworthy that larger particles (500 nm–10 μm) are also effectively internalized, predominantly through phagocytosis pathways, in diverse cell lines.28,29 In the process of internalization through endocytosis, in the absence of suitable surface modifications on the nanoparticles to enhance their surface charge or facilitate the proton sponge effect for escape, there is a possibility that they will persist within the late endosome until it merges with the lysosomal compartment, where they can undergo digestion.26 In relation to this, it is noteworthy that the surface of GO flakes contains abundant functional groups capable of binding to various molecules, including payload in large quantities. GO is also able to respond to different stimuli, such as pH or near infrared radiation (NIR), which could enable the design of a multifunctional substrate for tumour treatment.30,31 Stimuli-responsive materials present significant advantages in drug delivery compared to conventional carriers. These advantages, for example, encompass minimized premature release of therapeutic agents in physiological fluids, enhanced encapsulation efficiency, and decreased undesirable adverse effects.26 Finally, it is biocompatible and its toxicity is reduced due in part to the presence of negative charges on its surface, which limits its harmful interactions with cell membranes.32 Nevertheless, GO is generally used after undergoing functionalization by the addition of polymer or dendrimer molecules that can increase its stability in the body fluids and make its surface more compatible for nucleic acid loading and cell internalization.31–33 The GO surface has been modified with functional groups such as polyethyleneimine (PEI), polyethylene glycol (PEG), chitosan, and dendrimers to deliver anticancer drugs and genes in vitro and in vivo.15,23 However, the addition of polymers implies further processing of the material, and it can also increase the GO toxicity as a result of the positive charges from the addition of cationic polymers, inducing cytotoxicity for cells due to the strong physical interactions with the cell membrane, which can cause its damage and breakage.32,34 On the other hand, GO has a hydrophilic nature, suggesting that it possesses great potential to generate a uniform dispersion in aqueous solutions and to effectively penetrate cell membranes without the addition of other molecules.35
In this study, we realized spheroids using a diverse range of cell lines, encompassing both normal and cancerous cells. To represent solid tumors, adherent cell lines like A549 and HepG2 were utilized, while suspension cell lines such as THP-1 and NB4 were chosen to explore the feasibility of generating 3D models for blood cancers. For each of these cell lines, a consistent methodology was employed to construct and collect spheroids that mirrored distinct pathologies. This enabled us to compare and contrast 3D models of various tumors obtained through a standardized approach. By doing so, we underscored the unique prerequisites concerning the number of cells to be seeded and the duration of growth for each specific cell line. Specifically, spheroids of A549 cells were used as a 3D model of lung cancer. CD47_siRNA was used to knock down the overexpressed CD47 protein in A549 cells. GO nanocarriers with two different size ranges (small: around 100 nm and big: >650 nm), either unmodified or modified with PEG and PAMAM, were used to deliver CD47_siRNA in A549 spheroids. Silencing CD47 in cells grown in spheroids could be of great benefit in the understanding of in vivo tumour response to gene therapies. Moreover, the use of different GO formulations can clarify the impact of modification and dimension on cell internalization and transfection. In particular, the possibility of combining 3D models with unmodified GO nanocarriers, simpler to prepare since no chemical functionalizations are involved, for the transfection of CD47_siRNAs could offer an excellent model system solution for the study of anti-cancer treatments.
Materials and methods
Materials and reagents
Dulbecco's modified Eagle's medium (DMEM), Phosphate Buffered Saline (PBS) 1× solution (pH 7.4), Fetal Bovine Serum (FBS), 0.5% trypsin EDTA (10× trypsin), Opti-MEM transfection media, Nunclon™ Sphera™ 96-well U-bottom plates and 12-well flat bottom super low attachment plates used to prepare single and multi-spheroids, respectively, and 96-well flat bottom plates used for toxicity measurements were purchased from Thermo Fisher Scientific (Canada). Cell Counting Kit 8 (WST-8) was purchased from Cedarlane (Canada). PE anti-human CD47 antibody was purchased from BioLegend (USA). The PE-Annexin V Apoptosis Detection Kit was purchased from BD Biosciences (Canada). DsiRNA CD47 (CD47_siRNA), negative control DsiRNA (ctrl N) and nuclease free duplex buffer used for transfection were purchased from Integrated DNA Technologies (IDT, USA). The CD47_siRNA duplex sequences used for transfection are:5′-rGrCrArArCrArArCrCrUrUrUrCrCrArGrCrUrArCrUrUrUTG-3′
5′-rCrArArArArGrUrArGrCrUrGrGrArArArGrGrUrUrGrUrUrGrCrArG-3′. The negative control was provided as a “universal negative control”, not a scrambled sequence of the above.
In house GO (hGO) was synthesized through the modified Hummers’ method and filtered to produce big GO (bGO, >650 nm). hGO that underwent a sonication process (probe sonicator, Cole Parmer, Canada) at 10 W for 9 intervals of 10 minutes on/off in a 0 °C water bath was used to create small GO (sGO, around 100 nm). Parts of such bGO and sGO were subsequently chemically modified by the addition of 6-arm amine-terminated polyethylene glycol (PEG, 25 mg, Jenkem Technology, 15 kDa) and PAMAM dendrimers (10 μL, 4.0 generation, primary amine surface area, 10.1 w/w% in water, 10 kDa, Dendritech Inc.) as previously reported.15 Modified GO flake dispersions of large size (bmGO > 650 nm; 0.7 mg mL−1) and small size (smGO ∼ 100 nm; 1 mg mL−1) were obtained. In our previous study, we conducted FTIR analyses to validate the effectiveness of surface functionalization of graphene oxide (GO) using PEG and PAMAM. DLS measurements were also conducted to determine the size distribution of smGO, sGO, bmGO and bGO. Detailed results and figures can be found in our previous publication (Colloids and Surfaces B: Biointerfaces 217 (2022) 112609; Fig. S1, S2 and S5).15 Commercial GO water dispersions (250 mL; concentration: 0.5 mg mL−1) were purchased from Grephenea, Cambridge, USA.
Cell culturing of normal and cancerous cell lines
NIH 3T3 (mouse embryonic fibroblasts, normal cells), A549 (human lung cancer cells), HepG2 (human liver cancer cells) and NB4 and THP-1 (acute myelocytic leukaemia cancer cells) were purchased from American Type Culture Collection (ATCC, USA) and were cultured in DMEM, supplemented with 10% FBS, at 37 °C under a humidified atmosphere containing 5% CO2.3D spheroid realization with NIH 3T3, A549, HepG2, NB4 and THP-1 cells
All cultured cells were trypsinized and centrifuged at 1500 rpm for 5 min. The resulting pellet was resuspended and the cell viability was assessed using trypan blue before plating. Successively, cells were suspended in fresh media and seeded at 5 × 10³ cells per well in a non-adherent 96-well plate to grow spheroids. Every 3 days, 100 μL of media was changed in each well with a fresh one, paying attention to not disturb the cells at the bottom. Spheroid formation and growth were evaluated at 24, 48, 72, 96 h, 7 and 10 d after seeding. A549 and HepG2 cells were also seeded at 2.5 × 10⁵ cells per well in a non-adherent 12-well plate for the formation of multi-spheroids for apoptosis and transfection experiments.GO cytotoxicity and induced cell apoptosis in 2D cell models
The WST-8 assay was used to assess the viability of cells in 2D culture after exposure to hGO and a commercial GO (cGO) (n = 6). NIH 3T3 and A549 cells were seeded on 96-well flat-bottom plates at a density of 2.5–3.5 × 10³ cells per well and incubated in 100 μL of media for 24 h at 37 °C under 5% CO2 to allow them to adhere. The following day, these two cell lines, plus NB4 (seeding density of 7 × 10³), were treated with different concentrations of hGO and cGO (1, 4, 16 and 64 μg mL−1) for a predetermined exposure period of either 24, 48 or 72 h. Cells without treatments were used as controls. At each time point, 10 μL of WST-8 was added to each well and the plates were incubated at 37 °C for 2 h. The absorbance was measured at 450 nm using a microplate reader (FLUOstar Omega microplate reader, Mandel Scientific, Canada). To determine the viability percentage of the cells after GO treatments, the following equation was used: | (1) |
Apoptosis and transfection efficiency evaluation by flow cytometric measurements
NIH 3T3, A549, and NB4 cells cultured in 2D were also analysed to determine cell apoptosis after GO exposure using the PE-Annexin V apoptosis detection kit by flow cytometry analysis (BD-FACS Canto model 640166, SN: V0099, USA). hGO and cGO concentrations and the analysed time points were kept the same as in the WST-8 test. NIH 3T3 and A549 cells were seeded on 6-well plates at a density of 1 × 10⁵ cells per well and incubated in 2 mL of media for 24 h at 37 °C under 5% CO2 to allow them to adhere. The following day, NIH 3T3, A549, and NB4 cells were treated with hGO and cGO. At each time point, cells were harvested and treated with trypsin for 5–10 minutes to obtain individual cell suspensions, followed by centrifugation at 1500 rpm for 5 min. The cell pellets were suspended in 100 μL of binding buffer and then 5 μL of PE-Annexin V was added to the cell suspension and incubated for 15 min. Finally, 400 μL of binding buffer was added and cell apoptosis was evaluated.For the transfection analysis, A549 cells were seeded at 2.5 × 10⁵ cells per well in non-adherent 12-well tissue culture plates and at 1 × 10⁵ cells per well in 6-well adherent plates to form 3D spheroids and a 2D monolayer, respectively. Cells were allowed to grow and reach 75% confluence in 2D culture or form spheroids in 5 d in DMEM supplemented with 10% FBS. Then, the media were changed with Opti-MEM media for transfection. For the preparation of the CD47_siRNA and GO complexes (CD47_siRNA-GOs) with the different formulations of GO, transfection-mixes (transfection media–CD47_siRNA-GO) were prepared by mixing CD47_siRNA (in 1:1 or 3:1 CD47_siRNA:GO wt:wt) in 200 μL of Opti-MEM transfection media with each of the GO formulations (i.e., smGO, bmGO, sGO, and bGO) and incubated for 1 h at room temperature (21 ± 2 °C). To evaluate the loading efficiency of GO_siRNA formulations, we previously conducted a study where we monitored the increased absorbance signals with increased binding ratios of CD47_siRNA to smGO carriers. In this experiment, we mixed smGO (1 μg) with CD47_siRNA at different ratios (w/w: 1–10) and the resulting complexes were added to a flat bottom 96-well plate, and their absorbance at 260 nm was measured.15
The different transfection mixes were added to the A549 cells at a concentration of 0.25 μg mL−1 and incubated at 37 °C under 5% CO2 for 48 h. To ensure that CD47_siRNA was delivered specifically to the target cells, a universal negative control (ctrl N) was used. CD47_siRNA alone (ctrl CD47) was also used to evaluate the uptake of the target siRNA by the cells without any delivery system. Finally, untreated cells were used as transfection controls (ctrl untr).
The transfection of CD47_siRNA was evaluated using standard antibody staining with PE anti-human CD47 antibodies to measure levels of CD47 marker expression. The efficiency of transfection was assessed by measuring the expression levels of the CD47 marker in the treated cells and ctrl untr. After centrifugation, the pellet was washed twice, and suspended in cold PBS (4 °C) and then 5 μL of PE anti-human CD47 was added and incubated at room temperature for 30 min. The siRNA knockdown efficiency of CD47 markers was calculated according to the following formula:
 | (2) |
Since three-dimensional conformations of spheroids can prevent adequate diffusion of media to the center of the cell mass, the percentage of cells undergoing apoptosis was also evaluated using the PE Annexin V apoptosis detection kit, followed by flow cytometry analysis at 24, 48, 72, 96 h, 7 and 10 d after seeding. From the apoptosis percentages obtained through flow cytometry, cell viability was also calculated using the following formula:
| %cell viability = 100% − %apoptosis | (3) |
Statistical analysis
All flow cytometry and cytotoxicity results are presented as mean ± standard deviation (SD). Experiments were repeated 3 times in duplicate (n = 3). All flow cytometric data were then analysed using FlowJo software (10.6 version, 2019). All statistical analyses were performed and bar/dot graphs were generated using GraphPad Prism 8.02. Differences between more than three conditions were analysed using a one-way ANOVA test, while differences among two independent variables on a dependent variable were evaluated by two-way ANOVA. A value of P < 0.05 was considered statistically significant.Results and discussion
3D spheroid formation with normal and cancer cell lines
NIH 3T3, A549, HepG2, THP-1, and NB4 cells were grown into spheroids. Optical microscopy images show the formation of single spheroids (Fig. 1A) and multi-spheroids (Fig. 1B). The morphology of the spheroids changes in shape, density and size, depending on the cell lines, despite keeping the seeding density consistent (5 × 10³ cells per well), highlighting the differences among cell lines in terms of size and packing capacity.6 A good spheroid is defined as a cell mass that grows in a spherical shape, has well-defined boundaries, and is characterized by a clear colour.36 NIH 3T3 cells demonstrated a marked ability to rapidly form spheroids, satisfying the aforementioned criteria already at 24 h. Similarly, A549 cells proved to be capable of forming such 3D structures after 5–7 days of incubation. HepG2 cells showed rapid aggregation ability but less uniformity in size and shape. This is particularly evident from the images of the multi-spheroids in Fig. 1B. Finally, both leukemia cell lines were found to be unable to form spheroids independently, highlighting a difference between adherent and suspension cell lines. After 48 h (Fig. 1A), THP-1 cells began to aggregate to some extent but lost this feature in the following days, resulting only in a mass of accumulated cells at the bottom of the well. In contrast, NB4 cells never showed any tendency to aggregate and remained completely disaggregated even after 7 days of culture (Fig. 1A). To the best of our knowledge, no studies have reported the formation of spheroids using NB4 cells, while THP-1 cells were observed to undergo disaggregation in a previous work, similar to our findings.37 In this study, THP-1 cells differentiated into macrophages and formed compact spheroids, while the non-differentiated THP-1 cells were in a loose aggregate configuration after 3 d of incubation. Similar results were published with adherent cells, where NIH 3T3 formed a compact spheroid structure starting just 6 h after seeding, while A549 cells resulted in a loose aggregate during the first days of incubation.6 Accordingly, liver spheroids required to 3 weeks to reach a functionally mature conformation, starting with the same seeding density.38 In addition, authors reported that the morphology of HepG2 spheroids was more compact and regular, most likely due to the different spheroid formation procedure, in which cells were seeded in microwells and subjected to centrifugation to ensure their accumulation in the centre of the well. In another study, an irregular lung cancer spheroid shape was observed using the hanging-drop method for their formation.8 Longer spheroid formation time limited the initial seeding density that can be used, as a low cell number should be seeded to avoid cell death in the centre of the 3D cell culture due to a lack of nutrients that struggle to penetrate within a large cell mass.39 For these reasons, A549 lung cancer cells were chosen for our subsequent experiments reported below. | ||
| Fig. 1 Spheroids of different cell lines formed at different time points after seeding of 5000 cells per well in 96-well U-bottom plates for the formation of single spheroids (A) and 12-well flat bottom plates for the formation of multi-spheroids after 5 days for A549 and 48 h for HepG2 (B). The spheroids were realized using ultra low cell attachment plates. | ||
Lung cancer 2D cultures and spheroid realization and viability test
A549 lung cancer cells were thus selected and used for growing spheroids and comparing them to the respective 2D cultures in terms of viability and CD47 protein expression. The two cell models (Fig. 2A) were created by seeding A549 cells in two different multi-wells, namely standard 6-well plates for 2D culture and 12-well super low cell attachment plates for the growth of multi-spheroids. A549 cells began to aggregate approximately 96 h after seeding and form spheroids within 7 d (Fig. 2B). Apoptosis was monitored for up to 3 d starting with the same seeding concentration (2.5 × 10⁵ cell per well), since by that time, 2D culture cells reached 70–80% confluence. Results of cell viability (Fig. 2D) derived from apoptosis measurements indicated that both 2D and 3D cultures are viable (cell viability ≥90%) at each time point, with no significant differences observed between the two cultures. Notably, cell viability in 2D culture increased over time (P < 0.05), whereas in spheroids, it remained almost constant. This can be explained by the fact that A549 cells in 2D have a high division rate (about 28 h)40, while cells in a spheroidal configuration present lower proliferation, maybe due to the cell contact inhibition.41 However, the time required for the spheroid formation before performing other tests could influence cell viability and thus cell response to different analyses.6 The spheroids were maintained in culture for up to 10 d to check their behaviour and viability for longer culture periods to assess the maximum incubation time with high cell viability, before performing further experiments. Apoptosis tests were completed by flow cytometry (Fig. 2C) and the cell viability was derived (Fig. 2E) considering the percentage of cells negative to the stain. From the results obtained at each time point (i.e., 24, 48, 72 and 96 h and 7 and 10 d), the cells within the spheroids are viable throughout all the culture periods (cell viability ≥80%). However, although there was no significant reduction in viability until day 7, by day 10 the viability was significantly lower (80%) compared to every other time point (≥90%), possibly suggesting the cell stress due to a lack of nutrients which struggle to penetrate from the surrounding to the centre of the spheroid. These results suggest that cells can survive much longer as 3D spheroids than in 2D cultures, and the number of cells that can be seeded and supported in 3D is much greater than in 2D. Same observations can be found in a previous study.42 In another study A549 cells were cultured in spheroids, and the viability at days 3 and 7 reached values of 86% and 65%, respectively.39 However, the lower viability percentages obtained can be attributed to the higher cell seeding density used in that study. Specifically, A549 cells were seeded in a concentration of about 8 × 10⁴ cells per cm2 in 200 μL of media, while in our experiments the same cells were seeded at about 6.5 × 10⁴ cells per cm2 in 2 mL of media. It has been demonstrated, using different cell lines and dead cell staining (e.g., propidium iodide and caspase 3/7), that limiting the initial seeding cell number can prevent cell suffering and death in the core of the spheroid during its formation, resulting in spheroids composed mostly of viable cells.3,43,44 | ||
| Fig. 2 A549 spheroid formation (A and B), apoptosis (C) and viability (D and E) at different time points after seeding 2500 cells per well. (A) Schematic representation of the cell seeding procedure for the preparation of 2D and 3D cellular models. (B) Microscopy images showing the spheroid formation over 10 days. (C) Representative flow cytometry plots of apoptosis results after 24, 48, 72 and 96 h and 7 and 10 days, using the PE Annexin V apoptosis detection kit. (D) Viability percentages of 2D and 3D cell cultures were obtained from apoptosis measurements at 24, 48, and 72 h. (E) Viability percentages obtained from the apoptosis results in (C) conducted at all the time points in (B). Values in (D) and (E) are shown as mean ± SD of the three trials of duplicate samples (n = 3). The statistical significance between the two cell models in (C) was determined by two-way ANOVA, where P < 0.05 was considered significant and P > 0.05 was not significant (ns). One-way ANOVA was used for statistical analysis in (E): P < 0.05 was considered significant (*P < 0.05; **P < 0.01; ***P < 0.001; results with p > 0.05 are not shown). | ||
We also evaluated the CD47 surface marker expression in A549 cultured in both 2D and 3D configurations using flow cytometry and PE anti-human CD47 antibodies. The results showed a significant reduction (P < 0.05) in CD47 expression in the spheroids (8741 ± 712) compared to the 2D culture (10270 ± 1162). This finding is consistent with previous studies that showed a decreased protein expression intensity in many cell lines, including A549, when cultured in 3D with respect to 2D.42,45 The reduced expression in 3D cultures might be closer to the in vivo situations, since 2D conditions generally promote abnormal cellular proliferation, metabolism and cell interactions, which are not similar to the in vivo cancer tissue behaviour.42 In conclusion, spheroids demonstrated to be a potential powerful cell culture tool for further experiments.
Cytotoxicity and cell apoptosis of GO in 2D cultures of normal and cancer cell lines
To assess the cytotoxicity of hGO, its interactions with cells were studied and compared with cGO. Four different concentrations (i.e., 1, 4, 16, and 64 μg mL−1) were selected. The higher concentrations are generally not used for transfection, but were chosen to have an indication of the maximum usable noncytotoxic limit (cell viability ≥80%). As for cells, three lines were considered, namely one normal line (i.e., NIH 3T3), and two tumour lines, of which one adherent (i.e., A549) and one in suspension (i.e., NB4).Results of these toxicity tests (Fig. 3A–C) demonstrate the presence of dependence with respect to concentration and cell line. Notably, as the dose of GO used increases, the cell viability of all three cell lines evaluateddecreases. A549 showed high viability values, showing the lowest results of about 40% after 24 h of incubation with hGO and 21% after 48 h with cGO at a concentration of 64 μg mL−1. Also, for 1 and 4 μg mL−1 of both hGO and cGO, A549 cells remained viable throughout all the culture periods. Similarly, NB4 showed the same trend for the two lower concentrations (4 and 16 μg mL−1) of GOs, while demonstrating a higher sensitivity to the material in terms of toxicity when used at concentrations ≥16 μg mL−1. Already at 24 h, NB4 viability was 38% and 17% for hGO and cGO, respectively, at a concentration equal to 16 μg mL−1, and 6% and 12% at 64 μg mL−1. Similarly, NIH 3T3 did not show toxicity for both the GO formulations at a concentration of 1 μg mL−1 for all 3 d. However, different results were obtained for 4 μg mL−1 with a cell viability <80% in the first two days and then increased to about 80% after 72 h, with a higher cell viability for the cells treated with hGO compared to cGO at each time point. For concentrations ≥16 μg mL−1, NIH 3T3 showed cell viability values <50% already at 24 h and <10% at 48 h for both the GOs. Interestingly, all three cell lines do not show a time dependency. Specifically for NB4, the cell viability increases during the time when incubated with both the GO formulations at each concentration. NIH 3T3 and A549, instead, show a different behaviour. NIH 3T3 viability increased in time when incubated with the two lower concentrations of GOs (≤4 μg mL−1) and decrease with the two higher concentrations (≥16 μg mL−1), while A549 cell viability showed the opposite trend. For all the cell lines, concentrations and time points, hGO generally showed less toxicity than cGO. In agreement with our results, the concentration dependency has previously been reported for NIH 3T3 and A549, with much greater toxicity of GO for the normal cells, while discrepancies about time dependency are reported in the literature.46,47 Another parameter that might affect the results is the test used. MTT and WST-8 assays were used in previous work to study the cytotoxicity of GO flakes and it was observed that GO interfered with the reagents, giving inaccurate results.48
 | ||
| Fig. 3 Cell viability and apoptosis assays of cancer and normal cells incubated with different GO concentrations (0, 1, 4, 16, and 64 μg mL−1) for 24, 48 and 72 h. (A–C) Viability results obtained using the WST-8 cytotoxicity assay and calculated relative to the control cells (GO concentration: 0 μg mL−1) in (A) NIH 3T3 fibroblasts, (B) A549 lung cancer cells, and (C), NB4 leukemia cancer cells. (D–F) Apoptosis results of cancer and normal cells in (A–C) obtained using the PE Annexin V apoptosis detection kit and flow cytometry measurements. (G) Heat map summarizing the viability results obtained using WST-8 in (A–C) and the ones derived from apoptosis measurements (D–F). Values on each graph (A–F) are shown as mean ± SD of the three trials of duplicate samples (n = 3). Statistical significance was determined by one-way ANOVA, where p < 0.05 was considered significant and P > 0.05 was not significant (ns). | ||
To better study the toxicity of GO on the three cell lines, apoptosis tests were also completed using flow cytometry (Fig. 3D–F). Similar to WST-8 tests, apoptosis evaluation presented a concentration and cell line dependency with respect to both hGO and cGO. A549 cells showed apoptosis values of <20% for concentrations up to 4 μg mL−1 of both GO formulations during the entire culture period, and up to 48 h for 16 μg mL−1. The highest concentration (64 μg mL−1) of hGO resulted in higher apoptosis, with 36% of cells in an apoptotic state after 24 h, and this increased over time, reaching 83% at 72 h. At this concentration, cGO showed reduced apoptosis compared to hGO during the incubation period, with a peak of 45% after 3 d. NB4 cells showed almost no apoptosis for all concentrations of both in house and commercial GOs up to 4 μg mL−1 during the 3 d of incubation. The highest apoptosis registered was 37% for cGO at a concentration of 64 μg mL−1. These results for suspension cells are in agreement with the findings of a previous study.49 Similarly, NIH 3T3 cells presented very low apoptosis percentages (<6%) for both hGO and cGO at concentrations ≤4 μg mL−1 during the whole culture period, while for concentrations ≥16 μg mL−1, apoptosis increased significantly over time, reaching values >90% for hGO and cGO at 64 μg mL−1 after 48 h.
The cell viability results obtained through the WST-8 assay and apoptosis measurements are depicted in the heat map in Fig. 3G and compared with each other. NIH 3T3 cells began to show very low viability values (<30%) as early as 24 h for the highest concentration of hGO, with viability <10% for GO concentrations ≥16 μg mL−1 at day 3. These results were different from what were observed with WST-8, in which viability values <50% were recorded for concentrations ≥16 μg mL−1 already at 24 h for both hGO and cGO. In contrast, the NB4 cells remained in the green spectrum of the heat map for all concentrations at both 24 and 48 h, showing viability values between 60 and 80% only at 72 h and for the higher concentrations (≥16 μg mL−1). These results are consistent with the WST-8 results, even though the cell viability derived from the apoptosis test was higher. For example, the cell viability from the WST-8 test was >40% at 24 h with 64 μg mL−1 of both hGO and cGO, while the one derived from the apoptosis measurement was >80%.
A549 cells show intermediate sensitivity to the material in comparison with the other cell lines. With 64 μg mL−1 hGO at 24 h, viability <40% was determined, which decreases to a minimum of 10–19% at 72 h. For such cells, cGO showed cytotoxicity only at 72 h for 16 and 64 μg mL−1, with a minimum viability value of about 40–49%, demonstrating less toxicity than hGO on A549 cells. The viability values with WST-8 and apoptosis-derived calculations presented similar results, with some differences observed for the highest concentration of cGO. For instance, at 24 h and 16 μg mL−1 hGO and cGO, WST-8 assay showed cell viabilities of around 80%, while the apoptosis analysis revealed viabilities of 80% and 70%, respectively. However, significant differences were observed for the highest concentration of cGO. Specifically, the WST-8 assay showed that cell viability was <40% already after 24 h, whereas with the apoptosis test, viability remained >80% until 48 h. Furthermore, observing all three cell lines and the viability results derived from the apoptosis test, we found time-dependent toxicity of GOs that was not evident with the WST-8 assay. The lower toxicity of GO on NB4 cells compared to A549 ones, could be explained by the lower probability of suspension cells interacting with GO flakes. When cells adhere to a substrate and cannot move to interact with nanocarriers, their internalization become easier. Another factor could be that adherent cells have the extra cellular matrix receptors on their surface, which are crucial for increasing the interaction efficiency with GO flakes with respect to suspension cells, which lack these receptors.50 However, for all three cell lines, the cell viability of samples treated with hGO was consistently higher than that of the samples treated with cGO at all concentrations and time points, in agreement with both the WST-8 and apoptosis analyses. In addition, hGO was not toxic at concentrations up to 4 μg mL−1 for all cell lines, as cell viability remained above 90% and 80% for the apoptosis and WST-8 assays, respectively, for up to 3 d of incubation, as previously reported.15 These results confirm the possibility of using hGO safely at low concentrations (≤4 μg mL−1) for transfection.
Transfection efficiency in 3D vs. 2D lung cancer cell models
After validating the biocompatibility of GO, even when used at concentrations of 4 μg mL−1, and optimizing spheroid growth, the following step was used to assess whether 3D models were different than 2D models for transfection. To this end, transfection experiments using CD47_siRNA with smGO, bmGO, sGO and bGO as delivery systems were conducted and the transfection efficiency was then evaluated in A549 2D cultures and 3D spheroids. A decrease in CD47 expression levels was represented by the shift of the peaks towards lower PE-CD47 intensities of the treated samples with respect to the controls (Fig. 4A–H), which demonstrated the successful siRNA transfection through GO nanocarriers.51 In our previous study, we provided evidence of smGO cellular uptake and internalization through the utilization of AlexaFluor568 labeled smGO and nuclei staining.15 The carrier formulation of smGO demonstrated the highest knockdown of CD47 marker expression in both cell cultures over all other model systems, with an efficiency of 40% in 2D and 90% in 3D culture, respectively. The efficiency decreased when using sGO, resulting in approximately 7% and 61% knockdown in 2D and 3D cultures, respectively. Results using bmGO displayed values of 22% and 68% for 2D and 3D cultures, respectively, indicating a slightly higher knockdown efficiency compared to sGO. Interestingly, model systems using bGO evidenced a knockdown efficiency of only 2% and 7% in 2D and 3D cultures, respectively, which was similar to the control groups (6% and 13% for ctrl CD47 and 16% and 7% for ctrl N, in 2D and 3D cultures, respectively). Apoptosis tests were also performed on all samples after transfection (Fig. 4I), which demonstrated the safety of all the complexes used for transfection, with cell viabilities of >90%. These results thus revealed not only a strong dependence of CD47 knockdown efficiency on GO size and functionalization, but also a remarkable higher efficacy of such nanocarriers when used in combination with 3D over 2D cell cultures. Fig. 4I displays the difference in transfection efficiency between the two cell cultures for each delivery system used. The existing literature on 2D models provides analogous findings to those obtained with smGO in our study.52,53 Significant higher knockdown percentage results were obtained for smGO, bmGO and sGO after the delivery of CD47_siRNA in spheroids with respect to 2D cell cultures, while comparable results were obtained for ctrl N, ctrl CD47 and bGO-CD47. This result is surprising since cells in a 3D configuration are closely packed to each other, and this aspect might limit the diffusion and penetration of nanocarriers in the centre of the spheroid, restricting the transfection only in the outer layer.4 However, it has been demonstrated that the transfection efficiency in spheroids is highly dependent on the cell line. When cells form a less dense spheroid, the transfection efficiency can be high since the cell packing does not limit the penetration of nanocarriers to the centre of the spheroid.5 In fact, as previously assessed, different cell lines show different abilities in packing in 3D configurations. Another factor that can affect transfection efficiency in the two different cell cultures is the ability of the cells to divide. When cultured in 3D spheroids, cells have a limited proliferation capacity, which can reduce the transfectability of nucleic acid. As a result, RNAs have shown higher transfectability in non-dividing cells compared to DNA, making it more suitable for transfection in 3D cultures.41 Another study has shown that the difference in transfection efficiency between 2D and 3D cultures can also be influenced by the delivery system used.3 They observed that when using calcium phosphate-based nanocarriers, it led to higher transfection efficiency in spheroids (3D) in contrast to 2D cultures. However, when using Lipofectamine (a different type of nanocarrier), the opposite result was observed (i.e., higher transfection efficiency in 2D cultures compared to spheroids). This observation is supported by studies demonstrating a higher internalization of nanocarriers in HeLa (human cervical cancer cell line), MCF-7, and MDA-MB-231 (human breast cancer cell lines) cells grown as spheroids compared to 2D cultures.7 | ||
| Fig. 4 Flow cytometry histograms showing the MFI of PE-CD47 in A549 2D cell culture (A–D) and 3D spheroids (E–H) after transfection of CD47_siRNA with smGO (A and E), sGO (B and F), bmGO (C and G) and bGO (D and H). (I) Representative bar graph of the knockdown efficiency and dot plots of cell viability, both measured with respect to ctrl untr and highlighting the difference between 3D and 2D models. Values in the graphs are shown as mean ± SD of the three trials of duplicate samples (n = 3). The statistical significance was determined by two-way ANOVA, where P < 0.05 was considered significant (*P < 0.05; **P < 0.01; ***P < 0.001; ****P < 0.0001) and P > 0.05 was not significant (ns). | ||
Influence of GO flake size and functionalization on transfection efficiency in 3D spheroids
The size and chemical modification of GO flakes have been reported to affect the CD47_siRNA transfection in A549 and other cell lines.13 Adjusting the size of nanocarriers is an important parameter that can be altered to improve their ability to penetrate the plasma membrane.32 In addition, chemical modification of the GO surface is another option that is often used to increase the cellular internalization of GO-based carriers.23 Here, to assess the knockdown efficiency, we conducted an analysis comparing different GO-based nanocarrier formulations. Specifically, we compared the effectiveness of smGO, sGO, bmGO and bGO as delivery systems for CD47_siRNA in A549 spheroids. In Fig. 5A–D, the flow cytometry measurements are shown as histograms, where the shift in the curves for the cells transfected through the different GO formulations can be compared with the three controls (ctrl untr, ctrl CD47 and ctrl N). smGO showed a narrow peak concentrated around a low mean fluorescence intensity (MFI) values of PE-CD47, and showed an internalization of nanocarriers inside the cells and a uniform CD47 knockdown. Similarly, sGO showed a peak that was distributed at low PE fluorescent intensities, even though there were higher values as well. In contrast, bmGO exhibited a wide peak, indicating that CD47 expression was not uniform among cells after transfection. A narrow peak was displayed for the case of bGO, but no shift was observed with respect to the controls, suggesting that no transfection occurred. These results suggest the presence of a difference in the internalization and transfection processes related to the GO flake dimension. For a clear illustration, MFI values were also plotted in the dot plot in Fig. 5E. The results showed that smGO, sGO and bmGO can be used efficiently to achieve CD47_siRNA transfection in spheroids, as the MFI of cells is significantly reduced (<3900) after treatment compared to all three controls (>7800; Fig. 5E). As expected, the MFI of bGO-treated cells was not significantly lower (8620) than that of all the controls (7821–8729, demonstrating the inefficiency of such GO formulation to deliver CD47_siRNA into A549 spheroids). These results indicate a size-dependent transfection efficiency that can be attributed to the internalization of GO-based nanocarriers by the cells, with a lower cellular uptake for the big sizes for both the modified and unmodified GO formulations. This result is also supported by other,54 whereas unmodified GO flakes with a lateral size of about 10–40 μm were observed to not be able to enter the plasma membrane. However, even if it was reported that the cell internalization of GO is size-dependent in different cell lines;55,56 interestingly, the literature is not in total consensus.29,45,57 | ||
| Fig. 5 Flow cytometry measurements of PE-CD47 MFI in spheroids after transfection of the CD47_siRNA complex with smGO (A), sGO (B), bmGO (C) and bGO (D). (E) Representative dot graph of MFI measured in (A)–(D). (F) CD47 knockdown efficiency with respect to ctrl untr of spheroids treated with the four GO formulations (smGO, sGO, bmGO and bGO). Values in the graphs are shown as mean ± SD of the three trials of duplicate samples (n = 3). The statistical significance was determined by one-way ANOVA, where P < 0.05 was considered significant (**P < 0.01; ****P < 0.0001). Not significant results (P > 0.05) are not shown. | ||
Our results also show that smGO is the most efficient nanocarrier formulation, followed immediately by bmGO, with knockdown efficiencies of 90% and 69%, respectively (Fig. 5F). The modification of GO flakes with PEG and PAMAM resulted in a higher transfection efficiency, demonstrating a high influence of the modification on the cellular internalization.
This result is in good agreement with the literature, since the addition of polymers (such as PEG, PEI, polyvinyl alcohol (PVA), and chitosan) on the GO flakes enhanced their stability in the body fluids, and thus increased the binding sites for the nucleic acid loading and the interactions with the plasma membranes, due to the positive charges of the polymer chains.30,58,59 Moreover, our previous study15 has demonstrated that modifying graphene oxide (GO) with amine-functionalized PEG and PAMAM enhances both the stability and dispersibility of GO. In line with our current research, this modification also leads to a higher knockdown efficiency compared to unmodified GO. The inclusion of PAMAM further enhances the electrostatic interactions between PAMAM and siRNA, thereby improving the effectiveness of siRNA-mediated CD47 knockdown.60 The incorporation of PEG and PAMAM into our GO formulations facilitates the efficient delivery of CD47_siRNA by promoting the release of siRNA from the endosome, exploiting the “proton sponge” effect.61,62 Through their pronounced positive charge, the GO-PEG-PAMAM formulations attract and sustain a substantial influx of protons, causing endosomes to undergo osmotic swelling and rupture, thereby releasing siRNA into the cytosol.62 On the other hand, unmodified GO may have limited ability to escape from endosomes on its own. However, GO nanocarriers can disrupt the endosomal membrane, causing its rupture and release of the cargo into the cytosol, due to unique physicochemical properties of GO, such as its sharp edges and ability to interact with lipid bilayers.63 In the present work, the use of sGO for the transfection yields an efficiency of about 60%, significantly lower than that obtained with smGO, but comparable to the efficiency of bmGO. In contrast, bGO, as anticipated from the MFI values, exhibits a significantly lower knockdown efficiency than all other GO formulations, demonstrating no transfection results. The reason why sGO showed an interestingly high transfection efficiency still needs to be better studied. Nonetheless, a possible explanation may be attributed to the different interactions of the siRNA with the GO functional groups such as -COOH, -OH and epoxy. When the GO is modified with the addition of polymers, a higher number of binding sites are available for the nucleic acids. In addition, the positive charges of the polymers and the negative charges of the siRNA can lead to a stronger interaction.64–66 These factors can be advantageous during the formation of siRNA–GO complexes, but detrimental for the release of the nucleic acid once the nanocarrier enter inside the cell. In contrast, unmodified GO may exhibit reduced efficacy in terms of the number of nucleic acids bound to each flake and escaping the endosome due to a lack of positive charges; however, nanocarriers that successfully reach the cytosol have a higher propensity for efficient cargo release. Modification of GO was also often used because it could avoid the clearance of the nanocarriers from the bloodstream when injected in vivo. However, carriers at the nanoscale can circulate in the body for longer time without being recognized by macrophages and can easily penetrate the tissues when <200 nm.23,67 From these results, we observed that the modification of GO flakes might be the first parameter influencing the nanocarrier internalization by the cells, followed by their size. Nevertheless, sGO demonstrated a great potential in being used for further experiments.
Transfection with different ratios of anti-CD47 siRNA and GO flakes in 3D spheroids
To determine whether it was possible to increase the transfection efficiency using sGO as a delivery system, we decided to determine if increasing the ratio of CD47_siRNA:GO to 3:1 would make a difference. The GO formulations used here were 1:1 and 3:1 sGO-to-bGO ratios. The selection of the CD47_siRNA:GO 3:1 ratio was based on a comprehensive analysis conducted in a previous study to evaluate the binding efficiency between CD47_siRNA and GO at different ratios.15 This analysis encompassed a wide range of ratios, spanning from 1:0 to 10:1 (Fig. S9B in ref. 15). The purpose of this investigation was to determine the optimal ratio for efficient loading of siRNA onto GO nanocarriers.
This analysis revealed that up to a ratio of 3:1, there was a significant increase in the amount of siRNA binding to GO, indicating efficient loading. However, beyond this ratio, the loading efficiency curve tended to plateau. Based on these findings, we selected the ratio of 3:1 to perform transfection experiments aiming to achieve optimal knockdown efficiency. In Fig. 6A and B, the flow cytometry measurements of the treated samples were reported as peaks of PE-CD47 fluorescence intensities and were compared with ctrl untr and ctrl CD47. bGO-CD47_siRNA (1:1) showed a peak very similar in shape to the controls, with high intensity values, showing no transfection, as previously observed. Increasing the ratio to 3:1, bGO presented a little shift to the left and a wider peak, suggesting that with a higher number of siRNA bound to the GO flakes, even if a very low percentage of them are internalized by the cells, and some transfection could be observed. Differently, sGO-CD47_siRNA (1:1) presented a wide peak slightly shifted with respect to the controls and spread in a range between 0 and 104 log fluorescence intensity. This indicated a behaviour similar to bGO-CD47_siRNA (3:1), but with a higher probability for the nanocarriers to be internalized since the peak is taller for lower intensity values. Interestingly, increasing the siRNA to delivery system ratio to 3:1, the peak distribution of fluorescence intensity remained spread over the same range, but the mean shifted to a lower fluorescence intensity. This indicates a higher average level of transfection. These observations were confirmed by the MFI values reported in Fig. 6C.
 | ||
| Fig. 6 CD47 knockdown represented in flow cytometry measurements on spheroids treated with sGO (A) and bGO (B) with 1:1 and 3:1 ratios. (C) Representative bar graph of the MFI in (A) and (B). (D) Knockdown efficiency measured with respect to ctrl untr, and highlighting the difference between 1:1 and 3:1 ratios. Values in the graphs are shown as mean ± SD of the three trials of duplicate samples (n = 3). The statistical significance was determined by one-way ANOVA, where P < 0.05 was considered significant (*P < 0.05; **P < 0.01; ***P < 0.001; ****P < 0.0001), and P > 0.05 was not significant (ns). | ||
No significant difference in MFI was found between CD47_siRNA:bGO (1:1) and the controls (8552 and 7289 for ctrl untr and ctrl CD47, respectively), which indicated that no transfection occurred. However, a significant decrease in MFI was reported for every other delivery system and ratio with respect to the controls. This shows that these delivery systems were able to transfect CD47 in A549 spheroids, although with varying efficiency. A higher knockdown efficiency for both GO formulations when used at a 3:1 ratio was observed (Fig. 6D). However, by employing bGO, the efficiency increased from about 6% to 32%, with 1:1 and 3:1 ratios, respectively, but it never exceeded 35–40% and was not significant. Therefore, the bGO formulation remained the least efficient GO formulation for the experimental conditions used in this study. On the other hand, when using sGO, the knockdown efficiency was shown to reach and exceed 80% when used at a 3:1 ratio. These results are significantly higher than those obtained with the 1:1 ratio. This analysis demonstrated that upon increasing the CD47_siRNA:GO ratio, it is possible to obtain a higher transfection efficiency, as observed in other studies.15,68,69 GO thus proves to be a potentially viable alternative to chemically modified GO. This alternative might be preferable in some cases because unmodified GO, such as sGO, is less processed and therefore less expensive and complex. Moreover, unmodified GO can be less toxic because it does not contain the dendrimer, which has many positive charges that are useful for binding nucleic acids but may be harmful to cells.34
Conclusions
Tumour spheroids were successfully grown as in vitro cell models for CD47_siRNA transfection using GO-based vectors. Lung cancer spheroids were found to form and remain viable for up to 10 days of culture, demonstrating prolonged viability over traditional 2D cultures. Moreover, spheroids also exhibit metabolic and proliferative gradients more similar to those of in vivo tumours. Remarkably, our results indicate that A549 spheroids showed a higher ability to be transfected than 2D cultures, achieving silencing values of the gene responsible for CD47 marker expression around 90%. The results were very promising compared to other studies reported in the literature using different vectors and cell lines.In addition, different hGO formulations were used and compared as vectors to deliver CD47_siRNA into A549 spheroids. First, it was shown that all four GO-based formulations did not exhibit cytotoxicity or apoptotic effects in tumour and normal cells even for concentrations much higher than that used for transfection, indicating their safety to be administered. Subsequently, it was observed that chemical modification and GO flake size are two parameters highly influencing the ability of nanocarriers to be internalized in both 2D and 3D cell cultures of A549, with modification having a greater influence than size. Interestingly, sGO was able to achieve very similar transfection values to smGO simply by increasing the CD47_siRNA:GO ratio to 3:1, proving to be a promising alternative as a nucleic acid delivery system in cancer cells.
These results demonstrate the advantages of employing spheroid models in terms of similarity to the in vivo environment, ease of maintenance, and genetic manipulation using small GO-based vectors. These promising results pave the way for the use of this model system for further studies on different cell lines, vectors and therapeutic agents for the study of in vitro tumour gene therapies.
Author contributions
Conceptualization, SZ and FG; methodology, FG, EMH and SZ; formal analysis, FG and SZ; investigation, FG, EMH and SZ; resources, SZ; data curation, FG and SZ; writing – original draft preparation, FG; writing – review and editing, all; supervision, SZ and FV; project administration, SZ; funding acquisition, SZ. All authors have read and agreed to the published version of the manuscript.Conflicts of interest
There are no conflicts to declare.Acknowledgements
S. Z. is thankful for the financial support from the Natural Sciences and Engineering Research Council of Canada through the Discovery Grant (RGPIN-03835) for facilitating the stipend of F. G. We also thank Drs. Zygmunt J. Jakubek and Maohui Chen and Ms. Parisa H. Gohari for their contribution to the characterization and processing of graphene oxides used in this study.References
- H. Sung, J. Ferlay, R. L. Siegel, M. Laversanne, I. Soerjomataram, A. Jemal and F. Bray, CA Cancer J. Clin., 2021, 71, 209–249 CrossRef PubMed.
- T. Rodrigues, B. Kundu, J. Silva-Correia, S. C. Kundu, J. M. Oliveira, R. L. Reis and V. M. Correlo, Pharmacol. Ther., 2018, 184, 201–211 CrossRef CAS PubMed.
- V. Sokolova, L. Rojas-Sanchez, N. Bialas, N. Schulze and M. Epple, Acta Biomater., 2019, 84, 391–401 CrossRef CAS PubMed.
- Y. K. Monfared, M. Mahmoudian, C. Cecone, F. Caldera, S. Haiaty, H. R. Heidari, R. Rahbarghazi, A. Matencio, P. Zakeri-Milani and F. Trotta, Pharmaceutics, 2022, 14, 2690 CrossRef CAS PubMed.
- M. E. A. Schäfer, F. Keller, J. Schumacher, H. Haas, F. Vascotto, U. Sahin, M. Hafner and R. Rudolf, Cells, 2022, 11, 1026 CrossRef PubMed.
- F. Sambale, A. Lavrentieva, F. Stahl, C. Blume, M. Stiesch, C. Kasper, D. Bahnemann and T. Scheper, J. Biotechnol., 2015, 205, 120–129 CrossRef CAS PubMed.
- K. Juarez-Moreno, D. Chavez-Garcia, G. Hirata and R. Vazquez-Duhalt, Toxicol. in Vitro, 2022, 85, 105461 CrossRef CAS PubMed.
- T. Hurrell, K. S. Lilley and A. D. Cromarty, Toxicol. Lett., 2019, 300, 40–50 CrossRef CAS PubMed.
- Z. Huang, P. Yu and J. Tang, OncoTargets Ther., 2020, 13, 5395–5405 CrossRef CAS PubMed.
- M. G. Rolver, L. O. Elingaard-Larsen and S. F. Pedersen, J. Visualized Exp., 2019, 148, e59714 Search PubMed.
- M. Feng, K. D. Marjon, F. Zhu, R. Weissman-Tsukamoto, A. Levett, K. Sullivan, K. S. Kao, M. Markovic, P. A. Bump, H. M. Jackson, T. S. Choi, J. Chen, A. M. Banuelos, J. Liu, P. Gip, L. Cheng, D. Wang and I. L. Weissman, Nat. Commun., 2018, 9, 3194 CrossRef PubMed.
- J. C. Kaczmarek, P. S. Kowalski and D. G. Anderson, Genome Med., 2017, 9, 60 CrossRef PubMed.
- K. T. Love, K. P. Mahon, C. G. Levins, K. A. Whitehead, W. Querbes, J. R. Dorkin, J. Qin, W. Cantley, L. L. Qin, T. Racie, M. Frank-Kamenetsky, K. N. Yip, R. Alvarez, D. W. Sah, A. de Fougerolles, K. Fitzgerald, V. Koteliansky, A. Akinc, R. Langer and D. G. Anderson, Proc. Natl. Acad. Sci. U. S. A., 2010, 107, 1864–1869 CrossRef CAS PubMed.
- Z. Li, Y. Li, J. Gao, Y. Fu, P. Hua, Y. Jing, M. Cai, H. Wang and T. Tong, Life Sci., 2021, 273, 119150 CrossRef CAS PubMed.
- E. M. Hassan and S. Zou, Colloids Surf., B, 2022, 217, 112609 CrossRef CAS PubMed.
- Y. Zhu, L. Zhu, X. Wang and H. Jin, Cell Death Dis., 2022, 13, 644 CrossRef CAS PubMed.
- A. Singh, P. Trivedi and N. K. Jain, Artif. Cells, Nanomed., Biotechnol., 2018, 46, 274–283 CrossRef CAS PubMed.
- S. M. G. Hayat, V. Bianconi, M. Pirro, M. R. Jaafari, M. Hatamipour and A. Sahebkar, Cell. Oncol., 2020, 43, 19–30 CrossRef CAS PubMed.
- E. M. Hassan, S. McWhirter, G. C. Walker, Y. Martinez-Rubi and S. Zou, ACS Appl. Mater. Interfaces, 2023, 15, 3791–3803 CrossRef CAS PubMed.
- F. Alexis, E. Pridgen, L. K. Molnar and O. C. Farokhzad, Mol. Pharm., 2008, 5, 505–515 CrossRef CAS PubMed.
- J. M. Layzer, A. P. McCaffrey, A. K. Tanner, Z. Huang, M. A. Kay and B. A. Sullenger, RNA, 2004, 10, 766–771 CrossRef CAS PubMed.
- K. A. Whitehead, R. Langer and D. G. Anderson, Nat. Rev. Drug Discovery, 2009, 8, 129–138 CrossRef CAS PubMed.
- A. M. Itoo, S. L. Vemula, M. T. Gupta, M. V. Giram, S. A. Kumar, B. Ghosh and S. Biswas, J. Controlled Release, 2022, 350, 26–59 CrossRef CAS PubMed.
- R. G. Morgan, A. C. Chambers, D. N. Legge, S. J. Coles, A. Greenhough and A. C. Williams, Sci. Rep., 2018, 8, 7952 CrossRef CAS PubMed.
- J. Huang, C. Zong, H. Shen, M. Liu, B. Chen, B. Ren and Z. Zhang, Small, 2012, 8, 2577–2584 CrossRef CAS PubMed.
- C. G. Liu, Y. H. Han, R. K. Kankala, S. B. Wang and A. Z. Chen, Int. J. Nanomed., 2020, 15, 675–704 CrossRef CAS PubMed.
- M. Kucki, L. Diener, N. Bohmer, C. Hirsch, H. F. Krug, V. Palermo and P. Wick, J. Nanobiotechnol., 2017, 15, 46 CrossRef PubMed.
- Z. Tu, K. Achazi, A. Schulz, R. Mülhaupt, S. Thierbach, E. Rühl, M. Adeli and R. Haag, Adv. Funct. Mater., 2017, 27, 1701837 CrossRef.
- R. G. Mendes, B. Koch, A. Bachmatiuk, X. Ma, S. Sanchez, C. Damm, O. G. Schmidt, T. Gemming, J. Eckert and M. H. Rummeli, J. Mater. Chem. B, 2015, 3, 2522–2529 RSC.
- S. S. Saravanabhavan, M. Rethinasabapathy, S. Zsolt, A. B. Kalambettu, S. Elumalai, M. Janakiraman, Y. S. Huh and B. Natesan, Mater. Sci. Eng., C, 2019, 99, 1459–1468 CrossRef CAS PubMed.
- L. Wang and J. Yan, J. Photochem. Photobiol., B, 2019, 192, 68–73 CrossRef CAS PubMed.
- F. Grilli, P. Hajimohammadi Gohari and S. Zou, Int. J. Mol. Sci., 2022, 23, 6802 CrossRef CAS PubMed.
- N. Karki, H. Tiwari, M. Pal, A. Chaurasia, R. Bal, P. Joshi and N. G. Sahoo, Colloids Surf., B, 2018, 169, 265–272 CrossRef CAS PubMed.
- S. Chen, S. Zhang, Y. Wang, X. Yang, H. Yang and C. Cui, Asian J. Pharm. Sci., 2021, 16, 598–611 CrossRef PubMed.
- S. F. Kiew, L. V. Kiew, H. B. Lee, T. Imae and L. Y. Chung, J. Controlled Release, 2016, 226, 217–228 CrossRef CAS PubMed.
- T. Ishiguro, H. Ohata, A. Sato, K. Yamawaki, T. Enomoto and K. Okamoto, Cancer Sci., 2017, 108, 283–289 CrossRef CAS PubMed.
- S. Mukundan, P. Singh, A. Shah, R. Kumar, K. C. O'Neill, C. L. Carter, D. G. Russell, S. Subbian and B. Parekkadan, Biomedicines, 2021, 9, 1209 CrossRef CAS PubMed.
- S. Stransky, R. Cutler, J. Aguilan, E. Nieves and S. Sidoli, Epigenet. Chromatin, 2022, 15, 35 CrossRef CAS PubMed.
- F. Saleh, A. Harb, N. Soudani and H. Zaraket, J. Infect. Public Health, 2020, 13, 1142–1147 CrossRef PubMed.
- R. Limame, A. Wouters, B. Pauwels, E. Fransen, M. Peeters, F. Lardon, O. De Wever and P. Pauwels, PLoS One, 2012, 7, e46536 CrossRef CAS PubMed.
- S. Uchida, K. Yanagihara, A. Matsui, K. Kataoka and K. Itaka, Micromachines, 2020, 11, 426 CrossRef PubMed.
- M. Ravi, S. R. Kaviya and V. Paramesh, Cytotechnology, 2016, 68, 429–441 CrossRef CAS PubMed.
- S. Kessel, S. Cribbes, S. Bonasu, W. Rice, J. Qiu and L. L. Chan, Cytometry, Part A, 2017, 91, 883–892 CrossRef CAS PubMed.
- M. Singh, D. A. Close, S. Mukundan, P. A. Johnston and S. Sant, Assay Drug Dev. Technol., 2015, 13, 570–583 CrossRef CAS PubMed.
- A. Ito, H. Nasako, R. Akizuki, Y. Takashina, H. Eguchi, T. Matsunaga, Y. Yoshino, S. Endo and A. Ikari, Int. J. Mol. Sci., 2021, 22, 6582 CrossRef CAS PubMed.
- B. R. Coleman, T. Knight, V. Gies, Z. J. Jakubek and S. Zou, ACS Appl. Mater. Interfaces, 2017, 9, 28911–28921 CrossRef CAS PubMed.
- Y. Liao, W. Wang, Z. Li, Y. Wang, L. Zhang, X. Huang and P. Cai, J. Appl. Toxicol., 2021, 41, 1103–1114 CrossRef CAS PubMed.
- K. H. Liao, Y. S. Lin, C. W. Macosko and C. L. Haynes, ACS Appl. Mater. Interfaces, 2011, 3, 2607–2615 CrossRef CAS PubMed.
- S. Gurunathan, M. H. Kang, M. Jeyaraj and J. H. Kim, Int. J. Mol. Sci., 2019, 20, 247 CrossRef PubMed.
- T. Montier, P. Delepine, K. Le Ny, Y. Fichou, M. Le Bris, E. Hardy, E. Picquet, J. C. Clement, J. J. Yaouanc and C. Ferec, Biochim. Biophys. Acta, 2004, 1665, 118–133 CrossRef CAS PubMed.
- J. Liu, L. Wang, F. Zhao, S. Tseng, C. Narayanan, L. Shura, S. Willingham, M. Howard, S. Prohaska, J. Volkmer, M. Chao, I. L. Weissman and R. Majeti, PLoS One, 2015, 10, e0137345 CrossRef PubMed.
- H. M. Abdel-Bar, A. A. Walters, J. T. W. Wang and K. T. Al-Jamal, Adv. Healthc. Mater., 2021, 10, 2001853 CrossRef CAS PubMed.
- Y. Zhang, Z. Zhang, S. Li, L. Zhao, D. Li, Z. Cao, X. Xu and X. Yang, ACS Nano, 2021, 15, 16030–16042 CrossRef CAS PubMed.
- M. Zhou, N. Lozano, J. K. Wychowaniec, T. Hodgkinson, S. M. Richardson, K. Kostarelos and J. A. Hoyland, Acta Biomater., 2019, 96, 271–280 CrossRef CAS PubMed.
- R. Di Santo, L. Digiacomo, S. Palchetti, V. Palmieri, G. Perini, D. Pozzi, M. Papi and G. Caracciolo, Nanoscale, 2019, 11, 2733–2741 RSC.
- V. Mirzaie, M. Ansari, S. N. Nematollahi-Mahani, M. Moballegh Nasery, B. Karimi, T. Eslaminejad and Y. Pourshojaei, Drug Des., Dev. Ther., 2020, 14, 3087–3097 CrossRef CAS PubMed.
- F. F. Contreras-Torres, A. Rodriguez-Galvan, C. E. Guerrero-Beltran, E. Martinez-Loran, E. Vazquez-Garza, N. Ornelas-Soto and G. Garcia-Rivas, Mater. Sci. Eng., C, 2017, 73, 633–642 CrossRef CAS PubMed.
- Z. Mirzaie, A. Reisi-Vanani and M. Barati, J. Drug Delivery Sci. Technol., 2019, 50, 380–387 CrossRef CAS.
- J. Zhang, L. Yan, P. Wei, R. Zhou, C. Hua, M. Xiao, Y. Tu, Z. Gu and T. Wei, Eur. J. Pharmacol., 2021, 895, 173866 CrossRef CAS PubMed.
- M. Vincent, I. De Lázaro and K. Kostarelos, Gene Ther., 2017, 24, 123–132 CrossRef CAS PubMed.
- Q. Fan, Z. Yang, Y. Li, Y. Cheng and Y. Li, Adv. Funct. Mater., 2021, 31, 2101646 CrossRef CAS.
- J. Wang, Z. Lu, M. G. Wientjes and J. L.-S. Au, AAPS J., 2010, 12, 492–503 CrossRef CAS PubMed.
- O. Akhavan, E. Ghaderi and A. Akhavan, Biomaterials, 2012, 33, 8017–8025 CrossRef CAS PubMed.
- H. Bao, Y. Pan, Y. Ping, N. G. Sahoo, T. Wu, L. Li, J. Li and L. H. Gan, Small, 2011, 7, 1569–1578 CrossRef CAS PubMed.
- Y. He, L. Zhang, Z. Chen, Y. Liang, Y. Zhang, Y. Bai, J. Zhang and Y. Li, J. Mater. Chem. B, 2015, 3, 6462–6472 RSC.
- N. Yadav, N. Kumar, P. Prasad, S. Shirbhate, S. Sehrawat and B. Lochab, ACS Appl. Mater. Interfaces, 2018, 10, 14577–14593 CrossRef CAS PubMed.
- F. Zhi, H. Dong, X. Jia, W. Guo, H. Lu, Y. Yang, H. Ju, X. Zhang and Y. Hu, PLoS One, 2013, 8, e60034 CrossRef CAS PubMed.
- S. Yazdani, M. Mozaffarian, G. Pazuki, N. Hadidi, I. Gallego, G. Puras and J. L. Pedraz, Sci. Rep., 2022, 12, 21114 CrossRef CAS PubMed.
- T. Santadkha, W. Skolpap, K. C. Remant, A. Ansari, C. Kucharski, T. A. Dick and H. Uludag, Invest. New Drugs, 2022, 40, 962–976 CrossRef CAS PubMed.
| This journal is © The Royal Society of Chemistry 2023 |