DOI:
10.1039/D3AY01431B
(Paper)
Anal. Methods, 2023,
15, 5369-5379
Quantification of solution-free red blood cell staining by sorption kinetics of Romanowsky stains to agarose gels†
Received
15th August 2023
, Accepted 22nd September 2023
First published on 26th September 2023
Abstract
The imaging and quantification of stained red blood cells (RBCs) are important for identifying RBCs in hematology and for diagnosing diseased RBCs or parasites in cytopathology. Romanowsky staining has been used traditionally to produce hues in blood cells using a mixture of anionic eosin Y and cationic methylene blue and azure B. While Romanowsky stains have been widely used in cytopathology, end-users have experienced problems with varying results in staining due to the premature precipitation or evaporation of methanol, leading to the inherent inconsistency of solution-based Romanowsky staining. Herein, we demonstrate that the staining and destaining of blood smears are controllable by the contact time of agarose gel stamps. While the extent of staining and destaining is discernable by the hue values of stamped red blood cells in micrographs, the quantification of adsorbed and desorbed Romanowsky dye molecules (in particular, eosin Y, methylene blue and azure B) from and to the agarose gel stamps needs a model that can explain the sorption process. We found predictable sorption of the Romanowsky dye molecules from the pseudo-second-order kinetic model for adsorption and the one phase decay model for desorption. Thus, the method of agarose gel stamping demonstrated here could be an alternative to solution-based Romanowsky staining with the predictable quantity of sorption and timing of contact.
1. Introduction
Hydrogels are polymeric networks capable of integrating large amounts of water within their molecular structure. The applications of hydrogel technology in biomedicine include drug delivery, surgical tools, cosmetics, device coatings and tissue regeneration, to name a few.1 In an effort to perform blood or pathology tests without accessing to a large clinical center,2,3 we utilized agarose to fabricate agarose gel stamps to leverage solution-free stamping technology to detect white blood cells (WBCs) and malaria-infected red blood cells (RBCs).4 Upon solidification, agarose forms nanometre-scale pores ranging from 100 to 200 nm,5 which is advantageous for the adsorption and desorption of Romanowsky dyes. Since the gelation of agarose is predominantly driven by hydrogen bonds and electrostatic interactions, packaging Romanowsky dyes in agarose gels requires no further modification of agarose gels or Romanowsky dyes to apply this stamping technology. Agarose exhibits a high rate of dye removal over multiple adsorption–desorption cycles in comparison to gelatin,6 alginate7 and polyaniline/polypyrrole8 composites. Agarose gels do not exhibit swelling or shrinkage in aqueous buffer,9 which allows the fabrication of agarose gel stamps with high precision and maintains excellent mechanical properties. While the application of the hydrogel stamping method demonstrates that solution-free staining is a better alternative to several solution staining methods, quantitative characterization of sorption kinetics on the hydrogel stamping with the ternary mixture of Romanowsky stains (a mixture of anionic eosin Y and cationic methylene blue and azure B) is yet to be achieved.
As shown in Fig. 1, we demonstrate that staining and destaining of smeared RBCs using the agarose gel stamps with the ternary mixture of Romanowsky dyes are quantifiable by evaluating hue values of micrographs. For the quantitative assessment of adsorbed or desorbed amount of Romanowsky dyes, we performed the adsorption and desorption of the ternary mixture of Romanowsky dyes to and from agarose gels. We found that isotherms and different kinetic models can be employed to estimate the quantity of Romanowsky dyes for the solution-free hydrogel stamping technology.
 |
| | Fig. 1 Overall schematic of the experiments for quantification. First, we stained and destained RBCs with the agarose gel stamps and the values of hue (H) were assessed with respect to contact time. For quantitative assessment, we measured concentration changes and employed isotherms and kinetics models. | |
2. Experimental
2.1. Chemicals and specimens
We purchased eosin Y disodium salt (EY, cat# E4382-25G, Sigma-Aldrich), methylene blue (MB, cat# M9140-25G, Sigma-Aldrich), azure B (AZB, cat# A4043-5G, Sigma-Aldrich), agarose (Agarose, cat# A4679, Sigma-Aldrich), and methanol (cat# 179957, Sigma-Aldrich) and used them without any further modification. The collection and application of whole blood were approved by the Institutional Review Board (P01-202003-31-007) of the Korea National Institute for Bioethics Policy (Seoul, Korea).
2.2. Formation of ternary mixture stamps to quantify staining and destaining of RBCs
To measure the colour intensity from stained RBCs using the agarose gel with the ternary mixture, 4 μL of whole blood was dropped on the precleaned glass slide and smeared in the miLab™ (Noul Co., Ltd). Then, the smeared glass (smear width, 1.6 cm) was fixed for 2 min in methanol. To stain and destain RBCs, 0.7 mL of circular agarose gel (2% w/v, diameter of 2 cm and height of 0.22 cm) was created and submerged in the ternary mixture solution (EY 3.5 μM, MB 70 μM and AZB 140 μM). The circular agarose gel was incubated on a rocker with 150 rpm at room temperature for 48 h. Before and after the incubation of the agarose gel, absorbance of the ternary mixture was measured at 518, 645 and 664 nm. After 48 h of incubation for adsorption, all the agarose gel was collected and applied to the RBC smeared slides for staining. The circular agarose gel was put on the RBC smeared slides and incubated for 10 s, 30 s, 60 s and 600 s for staining. At the end of staining, the circular agarose gel was removed and stained RBC smeared slides were dried for 10 s. Then, the circular agarose gel without any Romanowsky dyes was placed on the stained region of the slide to destain the smeared RBCs. The destaining time was also varied from 10 s, 30 s, 60 s to 600 s. After destaining of smeared RBCs, slides were dried for 10 s.
2.3. Application of miLab™ hydrogel stamps to RBC smeared slides
To prepare the RBC smeared slides using different types of agarose gels, 5 μL of whole blood was dropped on the precleaned glass of the miLab™ cartridge, which was inserted into the miLab™ (Noul Co., Ltd). Each miLab™ cartridge consists of red, blue and clear agarose gels. The red agarose gel contains EY, the blue agarose gel contains MB and AZB and the clear agarose gel contains no Romanowsky stains.4 For simulated conditions, we stained the RBC smeared slides with the red agarose gel for 10 s, the blue agarose gels for 60 s and the clear agarose gels for 30 s sequentially. To compare the extent of staining with different combinations of red, blue and clear agarose gels, the RBC smeared slides were stained and destained with different combinations of 10 s, 30 s and 60 s.
2.4. Imaging of stained RBCs after stamping with agarose gels
At least three images from three different slides were acquired using a microscope (Olympus CX33, 50× NA: 0.50 or 100× NA: 0.95, exposure 200 ms). In each image, 50 RBCs were randomly selected. In each RBC, the region of interest (ROI) was defined as a diameter of 7 μm. Then, the RGB values at the ROI were extracted from the split images with red, green and blue channels using Image J. Then, mean values (0–255) of red (R), green (G) and blue (B) were normalized by dividing by 255 (R′, G′ and B′, respectively) and transformed to HSV (hue, saturation and value) values with the following equation:10
C
max is a maximum value and Cmin is a minimum value among R′, G′, and B′.
| |  | (2-1) |
| |  | (2-2) |
| |  | (2-3) |
If Cmax is R′, hue (H) is followed eqn (2-1) when mod6 is remainder after dividing by 6. If Cmax is G′, H is followed eqn (2-2) and if Cmax is B′, H is followed eqn (2-3). When Δ = 0, H is also 0.
| |  | (3) |
When
Δ = 0, saturation (
S) is 0 but
S is followed
eqn (3) in other cases. Value (
V) is the same as
Cmax.
2.5. Oscillatory rheometry
Samples for oscillatory rheometry were cast using custom moulds of 8 mm diameter and 2 mm height. Agarose gels at 20 mg mL−1 including different combinations of dyes, types of buffer (HEPES 50 mM) or additives (Tween-20 0.5% (w/v)) were prepared. For comparison, the ternary mixture was adsorbed for 48 h at 150 rpm. Both storage (G′) and loss (G′′) moduli of agarose gels were determined by frequency sweeping from 0.628 to 62.8 (rad s−1) at a strain of 10% using a TA Discovery HR-2 rheometer with an 8 mm parallel plate.
2.6. Calculation of concentrations of ternary mixtures
To decide a peak wavelength of each Romanowsky dye, samples were transferred into 96-well plates for absorbance measurement using a Cytation3 Spectrophotometer and absorbance was plotted against wavelengths ranging from 450 to 700 nm (Fig. S1, ESI†). The peak wavelengths of each dye were decided at 518, 664 and 645 nm for EY, MB11 and AZB,12 respectively. By observing the absorbance values of the unknown at each peak wavelength correlated with the peak of individual Romanowsky dyes, we were able to solve the system of equations:| |  | (5) |
| |  | (6) |
| |  | (7) |
here, cEY, cMB and cAZB are the concentrations of EY, MB and AZB and εEYX, εMBX and εAZBX represent the coefficients of extinction for EY, MB and AZB at a specific wavelength X. Ax represents the absorbance value at wavelength X,  is the path length and λ1, λ2, and λ3 correlate with peaks of the individual dyes' absorption spectra.
2.7. Adsorption isotherms of ternary mixtures to agarose gels
The agarose precursor solution was transferred to a custom-made hollow cylinder using a 1 mL syringe (cat#309628, BD) and allowed to solidify. To assess the adsorption capacity of the agarose gels, a total of 3.5 mL ternary mixture and agarose gels (20 mg mL−1) in a 50 mL tube were added. Thiazine molecules can be adsorbed to glass; thus, we performed all adsorption and desorption experiments with polypropylene plasticware.13 The tubes were shaken (150 rpm) at room temperature for 48 h. Concentrations were measured and calculated at the end of 48 h. The initial and final absorbances of each Romanowsky dye were measured using a Cytation3 spectrophotometer or a VersaMax (Molecular Devices, CA) and the concentrations were calculated by the system of eqn (5) through (7). The adsorption capacity qe (mg g−1) was calculated using the following equation:| | 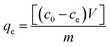 | (8) |
where co and ce are the initial and final concentrations of each Romanowsky dye in the ternary solution, respectively, V is the volume of the ternary solution (3.5 mL), and m is the dry weight of the adsorbent (14 mg).
The Langmuir model assumes monolayer coverage of dyes over a homogeneous sorbent surface.14 Thus, the Langmuir adsorption isotherm is a commonly used isotherm model describing the adsorbate–adsorbent interactions by the following equation:
| |  | (9) |
where
ce (mg L
−1) is the equilibrium concentration in solution,
qe (mg g
−1) is the adsorption capacity at equilibrium,
Qsat (mg g
−1) is the maximum adsorption capacity and
KL (L mg
−1) is the Langmuir adsorption equilibrium constant.
2.8. Kinetics of adsorption and desorption of ternary mixtures to agarose gels
To assess the kinetics of adsorption, the agarose gels were prepared in the same manner to construct isotherms. For adsorption kinetics, 165 μL of samples (EY 3.5 μM, MB 70 μM and AZB 140 μM) were moved to a well in a 96-well plate and absorbance at 518 nm, 645 nm and 664 nm was measured at different time points (0.33, 0.66, 1, 1.33, 1.66, 2, 4, 6, 24 and 48 h). Immediately after 48 h of adsorption, agarose gels were moved to fresh 3.5 mL of 150 mM NaCl solution in new 50 mL conical tubes. Conical tubes containing these gels were shaken at 150 rpm at room temperature for another 48 h. The method of concentration measurement and time points were the same for isotherms. The three models were used to fit the data. The pseudo-first order (PFO) kinetic model was plotted as follows:| |  | (10) |
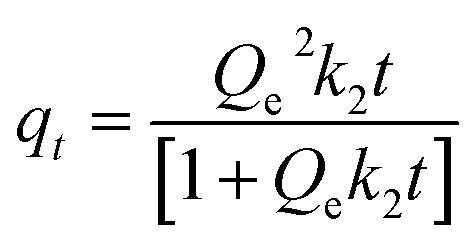
where qt (mg g−1) is the amount adsorbed/desorbed at time t (min), Qe (mg g−1) is the equilibrium adsorption capacity and k1 is the adsorption rate constant (L min−1). The pseudo-second order (PSO) kinetic model was plotted as follows:| |  | (11) |
where qt (mg g−1) is the amount adsorbed at time t (min), Qe (mg g−1) is the equilibrium adsorption capacity and k2 is the adsorption rate constant (g mg−1 min−1). The intraparticle diffusion (IPD) model was applied as follows:| |  | (12) |
where qt (mg g−1) is the amount adsorbed at time t (min), k3 is the adsorption rate constant (g mg−1 min−1/2) and C is a constant associated with the boundary layer effect. To assess the kinetics of desorption, data were fitted with the one phase decay model:| |  | (13) |
where Qmax or Qmin (mg g−1) is the maximally or minimally adsorbed quantity at time t (min), respectively, and τ is the characteristic decay time (min).
2.9. Statistical analysis
For quantification of H or S, 198 RBCs were counted for staining and destaining data and 40 ROIs were counted for background data, with three different RBC smeared slides. The statistical significance between the sample and control was calculated by one-way ANOVA with Dunnett's multiple comparison or with Tukey's post hoc test (α = 0.05) where p < 0.05 was considered statistically significant.
3. Results and discussion
3.1. The extent of staining and destaining to and from RBCs is quantifiable by the values of hue
To assess the required time for RBC staining by the ternary mixture adsorbed agarose gels, we used H from micrographs. While the RGB colour space can produce a wide variety of colours, the relationship between the constituent amounts of red (R), green (G) and blue (B) light and the resulting colour is not intuitive.15H is what we most often think as colour and is represented by a single number in 360°: red is 0, yellow is 60, green is 120 and cobalt is 240. The HSV (hue, saturation, value) colour space has been widely applied in cytopathology since this approach is designed to align more closely with the way human vision perceives colour attributes. Examples include the analysis of whole blood components,10,16 histological images with reduced variation17 or colon tissue images to detect cancers using convolutional neural network (CNN).18 In Romanowsky staining, the dyes containing acidic EY (red) and basic AZB (oxidized MB, blue-purple) produce neutral stains, where basic AZB binds to the anionic (acidic) nuclei and acidic EY binds to the highly cationic (basic) cytoplasm. MB that has undergone oxidative demethylation is knowns as polychrome MB, which has about 11 dyes including azure A, azure B, azure C, methylene blue, methylene violet Bernthsen, methyl thionoline and thionoline.19 The Romanowsky effect describes the production of purple colour in the chromatins of the nucleus and the certain granules in the cytoplasm of RBCs when AZB combines with EY to give azure B-eosin complexes.20 In principle, Romanowsky staining works to produce a variety of H by modulating the ratios of MB/AZB to EY, solvent composition (methanol content), pH of phosphate buffer and timing of staining.20
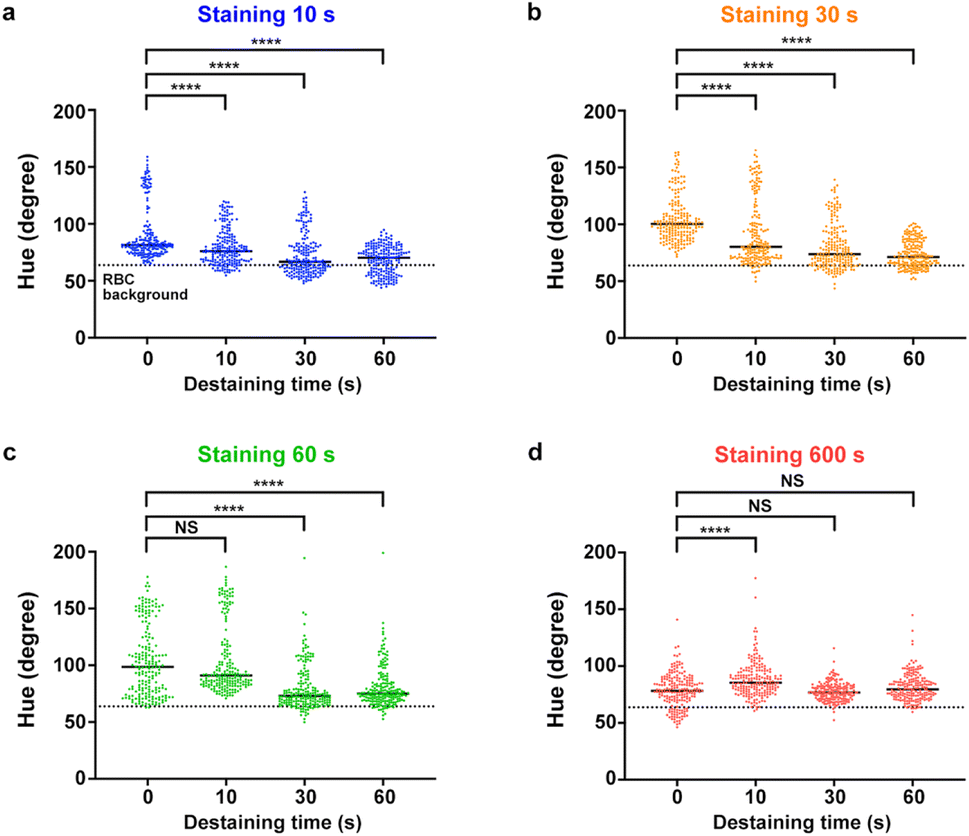
As shown in Fig. 1, staining is the desorption of the ternary mixture dyes to RBCs and destaining is the adsorption of the ternary mixture dyes to agarose gels. First, we assessed the background H after staining the RBC smear for 10 s, 30 s and 60 s with the ternary mixture adsorbed agarose gels. As shown in Fig. S2a (ESI†), background H from mostly plasma is around 200 (cerulean to azure) without strong time-dependency. However, the background H from RBC is around 80 (chartreuse to lime) for 10 s and around 100 (kelly green) for 30 s and 60 s (Fig. S2b, ESI†). As shown in Fig. S2b (ESI†), as the contact time increases, H from RBCs increases accordingly. However, the difference between 30 s and 60 s staining is statistically not significant (p = 0.977 with Tukey's post hoc analysis). Moreover, the mean of H from RBCs is decreased to around 70 (chartreus) in the case of 600 s staining. Next, we evaluated H with different staining–destaining durations. In Fig. 2a, these H are collected after staining for 10 s and different destaining durations, as indicated in each column. We also plotted the background H with a dotted line (RBC background, H = 64). As expected, the longer the destaining lasts, the more the H decrease. In the given time frame up to 60 s, none of the destaining completely removed the staining of RBCs as indicated that all mean H are higher than the RBC background line. In all cases of 60 s destaining, H increases (Fig. 2a or 2c) or remains somewhat similar to 30 s destaining (Fig. 2b), which is indicative of possible resorption of dyes to RBCs from agarose gels after 30 s of destaining.4 Destaining for 10 s after 60 s of staining (Fig. 2c) is not enough to remove adsorbed Romanowsky dyes from RBCs. In Fig. 2d, H remains similar regardless of destaining duration, which makes it difficult to infer the amount of transfer in the cycle of staining and destaining of RBCs. Due to the difficulties in the quantification, we decided not to assess the changes of H beyond 60 s.
 |
| | Fig. 2 Changes in values of H with respect to different periods of staining and destaining of RBCs. In (a–d), destaining was performed for 10 s, 30 s and 60 s after 10 s (a), 30 s (b), 60 s (c) and 600 s (d) of staining. N = 3 samples and 120 RBCs in each column, one way ANOVA with Dunnett's multiple comparison tests, ****p < 0.0001 and NS (non-significant). Scatter dot plot with mean. | |
H is the colour sensed due to the wavelength and S indicates the purity of the colour. From eqn 4, V does not appear to change with coloration quality. After we extracted S with respect to different periods of staining and destaining, we found that S is minimally changed (Fig. S3, ESI†) out of the entire range from 0 to 1. Thus, it is expected that S is not a good determinant to assess the extent of RBC staining from agarose gels with the ternary mixture. In contrast, H shown in Fig. 2 and S2† ranges from 0 to above 200 and shows relatively wider and distinguishable ranges. Thus, the feature of our analysis is determined with the values of H in the HSV colour space.
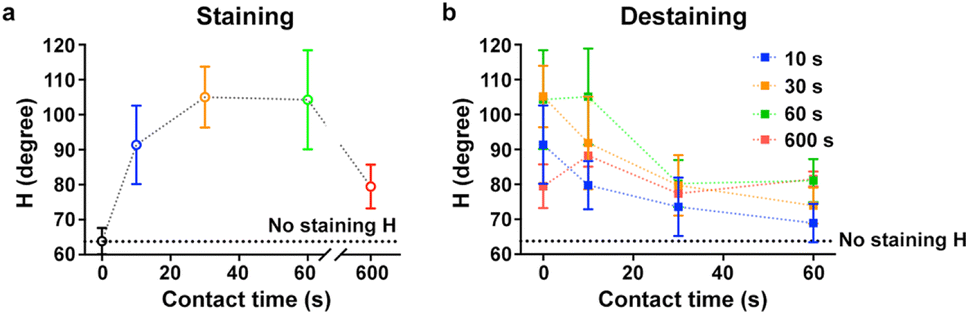
As shown in Fig. 3a, staining of RBCs with the ternary mixture adsorbed agarose gel increases the values of H monotonically up to 30 s. The values of H in 10 s and 30 s of destaining also monotonically decrease, while those of 60 s decrease a bit irregular with more pronounced changes between 10 s and 30 s of destaining otherwise with relatively small changes (Fig. 3b). During 60 s of staining, values of H increase up to 100 (lime to kelly green) because of the desorption of MB or AZB from agarose gels. If the contact time increases up to 600 s, however, values of H decrease to around 70 (chartreuse) because the cytoplasm of RBCs is predominantly stained by EY. Data presented in Fig. 2 and 3 demonstrate that the extent of staining and destaining to RBCs is quantifiable. In addition, we are able to discern colourfulness by values of H. To quantify the amount of Romanowsky dye transfer, it is imperative to directly measure the concentration changes in the cycle of staining and destaining. Next, we adsorbed the ternary mixture to agarose gels and desorbed the adsorbed ternary mixture from the agarose gels to buffer solution to determine isotherms and kinetic models of the Romanowsky dye transfer.
 |
| | Fig. 3 Changes in values of H during staining and destaining of RBCs. (a) Staining of RBCs is tracked at 10 s, 30 s, 60 s and 600 s. (b) Destaining of RBCs is tracked in three different periods of staining 10 s (blue), 30 s (orange), 60 s (green) and 600 s (red). Mean ± SEM, 120 data points and n = 3 samples. | |
3.2. Concentrations of ternary mixtures are calculable by the system of equations
To determine the concentrations of ternary mixtures, we used an approach with systems of equations21,22 to calculate the concentrations of each Romanowsky dye in a solution containing a mixture of EY, MB and AZB. We found that those intercepts are close to zero and the R2 values of each curve are 0.99 (Fig. 4). This allows us to set up the following system of equations:| | | A518 = 40.5cEY + 1.37cMB + 1.77cAZB | (14) |
| | | A645 = 0.0120cEY + 21.0cMB + 22.8cAZB | (15) |
| | | A664 = 0.0163cEY + 26.8cMB + 13.9cAZB | (16) |
 |
| | Fig. 4 Standard curves to evaluate concentrations of the ternary mixture. To calculate concentrations of ternary mixtures of EY (a), MB (b) and AZB (c) at three different wavelengths (518 nm, 664 nm and 645 nm, respectively), the linear regression formula and R2 (all >0.99) are denoted. The slope of each regression eqn (14)–(16) are used for the coefficient matrix eqn (17); n = 3, mean ± SD. | |
Some coefficients are lower than others. For example, coefficients of cMB or cAZB are smaller than that of cEY in eqn (14), indicating that A518 values are predominantly determined by cEY since the concentration change of EY is more apparent at the wavelength of 518 nm than those at 645 or 664 nm (Fig. 4a). However, in eqn (15) and (16), coefficients of cMB or cAZB are somewhat similar to each other, meaning that MB and AZB dyes are expected to have similar absorbance (Fig. 4b and c). In addition, none of the coefficients in eqn (14)–(16) are zero; it is imperative to use all of the coefficients (3 × 3 matrix coefficients in eqn (17)) to calculate the concentrations of any ternary mixture in our study.
| |  | (17) |
3.3. Shear modulus of agarose gels is maintained when Romanowsky dyes are adsorbed after the solidification of agarose gels
In our previous publication,4 we demonstrated that the hydrogel stamping technology is a simple, reproducible, solution-free, and inexpensive approach to stain blood cells. The delivery and removal of dyes are mediated by agarose gels. The microstructure of agarose gels consists of a dense interwoven network of fibres and pores5,9,23 ranging from 100–200 nm.24 A single molecule of MB has a cross-section of 0.8–0.9 nm,25,26 and thus can pass freely through the pores of agarose gels. AZB is the oxidized form of MB and has similar topological polar surface areas (TPSA) to MB (MB, 0.439 nm2 and AZB, 0.527 nm2). Therefore, it is reasonable to assume that the molecular cross-section of AZB would be similar to 0.8–0.9 nm and thus physical interaction of MB and AZB within the pores of agarose gels would be similar. In contrast, the diameter of EY is around 1.6 nm (TPSA of EY, 0.838 nm2);27 thus, we expect to see different extent of interactions of EY with agarose gels.
Initially, we hypothesized that the bulk mechanical properties of agarose gels are altered upon mixing with Romanowsky dyes during solidification or upon adsorption after the solidification of agarose gels. We found that the mechanical properties of agarose gels were altered upon the addition of individual or mixture of Romanowsky dyes during solidification. Dyed agarose gels were prepared by mixing EY or MB![[thin space (1/6-em)]](https://www.rsc.org/images/entities/char_2009.gif) :AZB (1:2 ratio) before solidification of agarose gels.4 While the red and the clear agarose gels maintained a storage modulus of around 20 kPa and loss modulus of around 3 kPa, the addition of MB and AZB before solidification significantly altered both storage and loss moduli, as evidenced in Fig. 5. After adsorbing the ternary mixture to agarose gels for 48 h, we did not find any significant difference of shear modulus (both storage and loss moduli) between the ternary mixture adsorbed agarose gel and either the blue agarose gel with HEPES or the clear agarose gels (Fig. 5). Upon cooling of agarose solution, the polysaccharide chains of agarose made of the repeating unit of D-galactose and 3,6-anhydro-L-galactopyranose are aligned and form a mesh of channels of diameter from 100 to 200 nm, where the structure is held together by hydrogen bonding. To restore the mechanical properties of the blue agarose gels, we attempted to include an additive in the blue agarose gels. The nonionic surfactant polysorbate 20 (Tween-20) only increases the loss modulus (G′′) of the blue agarose gels to a certain extent, not the storage modulus. However, 50 mM HEPES (4-(2-hydroxyethyl)-1-piperazineethanesulfonic acid) increased both storage and loss moduli. HEPES is a zwitterionic molecule that can stabilize polysaccharide–thiazine (an organic compound containing a ring of four carbon, one nitrogen and one sulphur atom such as MB) dye by shielding electrostatic interactions.28 It is reported that the adsorption of MB is primarily mediated by polysaccharide functional groups such as C–C, C–O and C–O–C.29,30 However, adsorption of the ternary mixture (ternary in Fig. 5) to solidified agarose gels did not alter the mechanical properties. Since small molecules, i.e., dye or detergent, are presumably adsorbed to the surface or pores of agarose gels after solidification, the alignment or networking of polysaccharide chains is not likely interfered.
:AZB (1:2 ratio) before solidification of agarose gels.4 While the red and the clear agarose gels maintained a storage modulus of around 20 kPa and loss modulus of around 3 kPa, the addition of MB and AZB before solidification significantly altered both storage and loss moduli, as evidenced in Fig. 5. After adsorbing the ternary mixture to agarose gels for 48 h, we did not find any significant difference of shear modulus (both storage and loss moduli) between the ternary mixture adsorbed agarose gel and either the blue agarose gel with HEPES or the clear agarose gels (Fig. 5). Upon cooling of agarose solution, the polysaccharide chains of agarose made of the repeating unit of D-galactose and 3,6-anhydro-L-galactopyranose are aligned and form a mesh of channels of diameter from 100 to 200 nm, where the structure is held together by hydrogen bonding. To restore the mechanical properties of the blue agarose gels, we attempted to include an additive in the blue agarose gels. The nonionic surfactant polysorbate 20 (Tween-20) only increases the loss modulus (G′′) of the blue agarose gels to a certain extent, not the storage modulus. However, 50 mM HEPES (4-(2-hydroxyethyl)-1-piperazineethanesulfonic acid) increased both storage and loss moduli. HEPES is a zwitterionic molecule that can stabilize polysaccharide–thiazine (an organic compound containing a ring of four carbon, one nitrogen and one sulphur atom such as MB) dye by shielding electrostatic interactions.28 It is reported that the adsorption of MB is primarily mediated by polysaccharide functional groups such as C–C, C–O and C–O–C.29,30 However, adsorption of the ternary mixture (ternary in Fig. 5) to solidified agarose gels did not alter the mechanical properties. Since small molecules, i.e., dye or detergent, are presumably adsorbed to the surface or pores of agarose gels after solidification, the alignment or networking of polysaccharide chains is not likely interfered.
 |
| | Fig. 5 Viscoelasticity of agarose gels with Romanowsky dyes mixed during solidification or adsorbed after solidification. Viscoelasticity of clear, red (EY) and blue (MB/AZB) agarose gels as well as the ternary mixture adsorbed agarose gel is compared at 6.3 rad s−1 (1 Hz). Storage (G′) and loss (G′′) modulus, mean ± SD, n = 5. | |
3.4. Isotherms of adsorption allow us to narrow down the concentration ranges of the ternary mixture for kinetic experiments
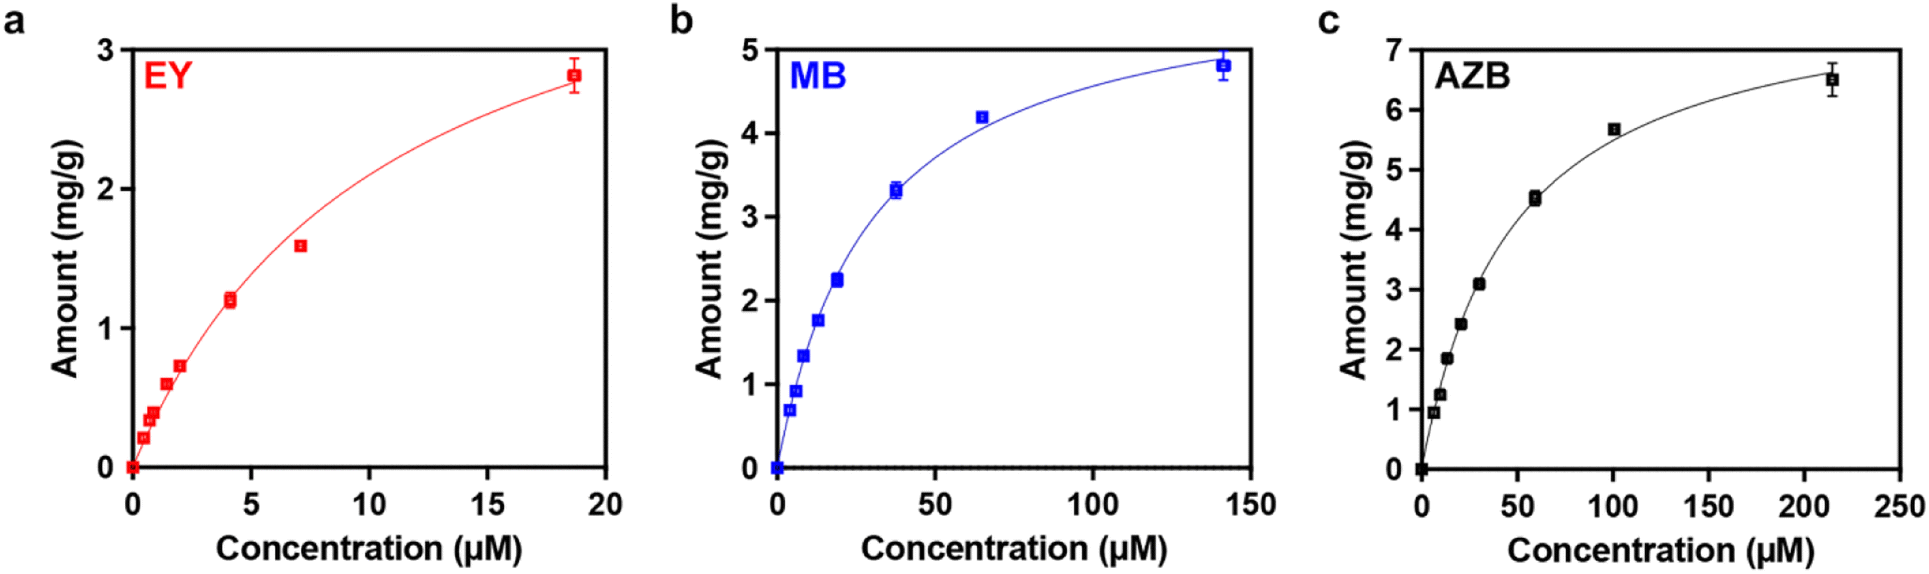
To estimate the limit of adsorption of Romanowsky dyes to agarose gels, we performed adsorption of ternary mixtures at multiple concentrations for 48 h. Adsorption isotherms of individual dyes show that the Langmuir isotherm explains the adsorption of molecules of each Romanowsky dye to the agarose gel surface (Fig. 6–c) with high goodness of fit (R2 = 0.999). KL of EY is 93.3 L mg−1 and those of MB and AZB are 33.3 L mg−1 and 21.1 L mg−1, respectively (Table 1). This result supports that EY exhibits a stronger interaction with agarose gels than that of MB or AZB with agarose gels. The Langmuir model fits adsorption data well, indicating that the amount of adsorbed Romanowsky dye molecules is saturated at higher concentrations.
 |
| | Fig. 6 Adsorption isotherms of ternary mixtures. Isotherms of EY (a) MB (b) and AZB (c) are measured during the 48 h of adsorption; mean ± SD, n = 5. | |
Table 1 Parameters of the Langmuir isotherms
| Model |
Parameters |
Langmuir isotherm |
| EY |
MB |
AZB |
| Adsorption isotherm |
Q
sat (mg g−1) |
4.35 |
5.94 |
8.09 |
|
K
L (L mg−1) |
93.3 |
33.3 |
21.1 |
|
R
2
|
0.992 |
0.998 |
0.998 |
From the molecular structures (EY is an anionic xanthene and MB or AZB is a cationic thiazine) and size of each Romanowsky dye molecule, we expect that the adsorption could be classified into two groups. As shown in Table 1, EY has stronger binding to the surface of agarose (higher KL, binding strength of Romanowsky dyes to the surface of agarose gels) than either MB or AZB does. This is possibly attributed to the larger TPSA of EY and/or preferential biding through the pores of agarose, while the adsorption of MB or AZB is likely non-specific and promiscuous throughout the surface or pores of agarose gels. Apparently, the absorbance spectra of MB and AZB are not completely separated from each other (Fig. S1, ESI†), and Fig. 4b and c show such concurrent contribution to absorbance, which may have overestimation of Qsat.
Further, relatively lower concentration of EY in the ternary mixtures made the estimated Qsat lower than those of MB or AZB. Collectively, it is expected that the amount of MB or AZB destaining from RBCs (removal of MB or AZB by agarose gels) would be larger than that of EY. Next, to further quantify the sorption of the ternary mixture over the course of 48 h, we selected one of the higher concentrations tested in isotherms (EY 3.5 μM, MB 70 μM and AZB 140 μM) in assessing the kinetics. This concentration is higher enough to easily measure concentrations by UV-vis and is closer to the asymptote in the sorption isotherms (Fig. 6a–c).
3.5. Adsorption and desorption kinetics show discernible affinities of Romanowsky dye molecules to agarose gels
To predict the kinetics of adsorption and desorption, we measured concentration changes of the selected ternary mixture during 48 h of adsorption and 48 h of desorption. As shown in Fig. 7, the amount (mg g−1) of dye adsorption and desorption approaches a maximum value asymptotically. While we fit three different kinetic models for adsorption (destaining, Fig. S4, ESI†), we found that the pseudo-second order (PSO) kinetic model fits with high R2 values over the entire duration of 48 h (Table 2 and S1). The PSO kinetic model predicts that the adsorption rate is dependent on adsorption capacity, not on the concentration of adsorbates,31 implying that the type of the dye is a more important contributor than the concentration of the dye in our hydrogel stamping technology. The pseudo-first order (PFO) kinetic model (Fig. S4, ESI†) also fits the adsorption of the ternary mixture over the entire duration of 48 h with relatively high R2 values as well. The PFO kinetic model assumes that the rate of dye uptake is directly proportional to the difference between the saturated concentration and the amount of dye uptake with time, which is generally applicable only over the initial stage of an adsorption process.31 Therefore, the PSO kinetic model is presumably the best fit in the range of 48 h for the kinetics of adsorption of the ternary mixture, indicating that the adsorption capacity of respective Romanowsky dye molecules in agarose gels is the key determinant to understand the sorption kinetics. For all of our interpretation, we avoid the abuse of fitting kinetics data with the linearized models of kinetics and use nonlinear fitting methods with eqn (10) through (13).32
 |
| | Fig. 7 Adsorption and desorption kinetics of ternary mixtures. At a fixed concentration of the ternary mixture (EY 3.5 μM, MB 70 μM and AZB 140 μM), kinetics of adsorption (48 h) of EY (a), MB (c) and AZB (e) is measured and fitted with the PSO kinetics model. The quantity of the ternary mixture of EY (b), MB (d) and AZB (f) retained in agarose gels was estimated by the one phase decay model. Patterned areas in (b), (d) and (f) indicate the quantity of each Romanowsky dye molecule with high affinity. Mean ± SD, n = 5. | |
Table 2 Parameters of the PSO kinetic model (adsorption)
| Model |
Parameters |
Adsorption |
| EY |
MB |
AZB |
| Pseudo 2nd order kinetics |
Q
e (mg g−1) |
1.15 |
3.47 |
4.77 |
|
k
2 (g mg−1 min−1) |
0.0285 |
0.00612 |
0.00465 |
|
R
2
|
0.959 |
0.990 |
0.994 |
After 48 h of adsorption, we assessed the quantity of Romanowsky dye molecules in agarose gels over another 48 h (Fig. 7b, d and f) by fitting the desorption data with the one phase decay model.33 As indicated by the filled areas, the binding affinity of EY is higher than that of both MB and AZB, as evidenced by the ratio of Qmax to Qmin (Table 3). This result is also corroborated by higher values of KL of EY than that of either MB or AZB (Table 1). These results show that around 50.0%, 75.5% and 81.9% of EY, MB and AZB, respectively, are released over the first 240 min (Table S2†) and the rest of them is bound to agarose gels with high affinity (referred as the patterned areas in Fig. 7b, d and f). Further, considering the nature of the interactions between Romanowsky dye molecules and agarose gels, the adsorption kinetics is possibly associated with the diffusion of Romanowsky dyes through the pores of agarose gels as discussed above. We fit the data with the intraparticle diffusion (IPD) of the adsorbate (the Romanowsky dye molecules) via two mechanisms: pore and surface diffusion.34 In the IPD kinetic model, particle porosity (distribution and morphology) and tortuosity are key factors affecting the pore diffusion. As shown in Fig. S4 (ESI†) and R2 values in Table S1 (ESI†), the IPD kinetic model showed low goodness of fit (values of R2 being less than 0.6). If we fit the data with the IPD kinetic model up to 240 min, the values of R2 are higher (Table S3†). Overall, the IPD kinetic model can explain the sorption kinetics better in earlier time points due to the pore diffusion of the Romanowsky dye molecules. The larger EY molecules (diameter of around 1.6 nm) showed relatively rapid adsorption probably bypassing the diffusion of smaller pores and the desorption is probably slowed due to steric hindrance. In contrast, relatively smaller molecules of MB or AZB (diameter of around 0.8–0.9 nm) showed slightly higher rate of IPD kinetics. We have observed that agarose gels release either MB or AZB a bit faster to smeared RBCs in comparison to EY, indicating that both pore diffusion and the nature of interactions between the charged molecules of thiazine and polysaccharide affect the apparently higher rate of desorption. However, this warrants further investigation with molecular spectroscopy including Fourier transform infrared spectroscopy (FT-IR), Raman spectroscopy and X-ray photoelectron spectroscopy (XPS) in conjunction with thermogravimetric analysis (TGA).35
Table 3 Parameters of the one phase decay kinetic model (desorption)
| Model |
Parameters |
Desorption |
| EY |
MB |
AZB |
| One phase decay |
Q
max (mg g−1) |
1.05 |
3.20 |
4.44 |
|
Q
min (mg g−1) |
0.499 |
0.675 |
0.672 |
|
τ (min) |
47.3 |
35.2 |
34.3 |
|
R
2
|
0.977 |
0.982 |
0.982 |
3.6. The desorbed and adsorbed amount of Romanowsky dyes to and from agarose gels is quantifiable on the time scale of RBC staining (desorption) and destaining (adsorption)
Despite the different time scales of experiments (Fig. 3 and 7), we attempt to quantify the amount of each Romanowsky dye transferred to and from agarose gels using the PSO kinetic model (Table 2) and the one phase decay model (Table 3). For example, the desorbed amount of the total of ternary mixture for 60 s estimated is 0.0430 nmole of EY, 0.533 nmole of MB and 0.853 nmole of AZB, which is presumably transferred to the smeared RBCs in the area of 3.2 cm2. Data in Fig. 7b, d and f show that the relative quantity of retained MB and AZB in agarose gels is higher, indicating that blue staining is easier in earlier time points in comparison to red staining by agarose gels.
When using a mixture of these three Romanowsky dyes in a single agarose gel for staining/destaining, the extent of staining/destaining can be adjusted by changing the ratio of each dye. However, since EY and AZB can precipitate when combined, there is a limitation to adjusting the ratio of stains. It may be more efficient to stain separately by combining appropriate Romanowsky dyes with similar physical properties.
Thus, staining with EY first may be useful due to its ability to stain RBCs relatively fast. Staining with MB or AZB later using another agarose gel can prevent discoloration due to higher amount of desorption (staining) (Table 4). However, it is important to stain MB and AZB for a sufficient time to prevent rapid adsorption (destaining) into the agarose gel and ensure discernible staining.
Table 4 Estimated amount of each dye per 14 mg agarose from the PSO kinetic model of adsorption and the one phase decay model of desorption, respectively
| Time (s) |
Adsorption (nmole) |
Desorption (nmole) |
| EY |
MB |
AZB |
EY |
MB |
AZB |
| 0 |
0.000 |
0.000 |
0.000 |
22.7 |
140 |
203 |
| 10 |
0.137 |
0.547 |
0.817 |
22.6 |
140 |
202 |
| 30 |
0.398 |
1.60 |
2.39 |
22.6 |
139 |
201 |
| 60 |
0.783 |
3.16 |
4.74 |
22.4 |
137 |
198 |
Changes of RBC colours by the solution-free hydrogel stamping occur within 30 s and the assessment of such colour changes is feasible with microscopy, as evidenced by Fig. 3. In contrast, the measurement of concentrations with UV-vis spectrometry on the same time scale is challenging due to relatively small changes within 60 s, as evidenced by the time scale of τ in Table 3. Another limitation is that three different dyes are measured at three different wavelengths to evaluate concentrations and their changes (Fig. S1, ESI† and Fig. 4). Changes in adsorbed or desorbed dyes can be theoretically measured after dissolving agarose at a higher temperature around 60 °C, while significant loss of samples and measurement errors are expected.
3.7. Quantitative correlation is verified with the application of the hydrogel stamps to RBC smeared slides
As shown in Fig. 6 and 7, the type of interaction of EY and MB/AZB is distinguished from the results of Langmuir isotherms and PSO kinetics. Thus, we separated EY and MB/AZB from the ternary mixture. This separation is always preferred due to the charged natures of Romanowsky dyes as well as the evaporation of methanol, which cause precipitation in solution. Therefore, separation of Romanowsky dyes in hydrogels can prevent unintended precipitation and the control of staining/destaining simply with contact time would be advantageous to quality control of RBC staining. Here, we demonstrate the quantitative assessment of stained/destained RBCs with three separate agarose gels by simply controlling the contact time between RBC smeared slides and agarose gels.
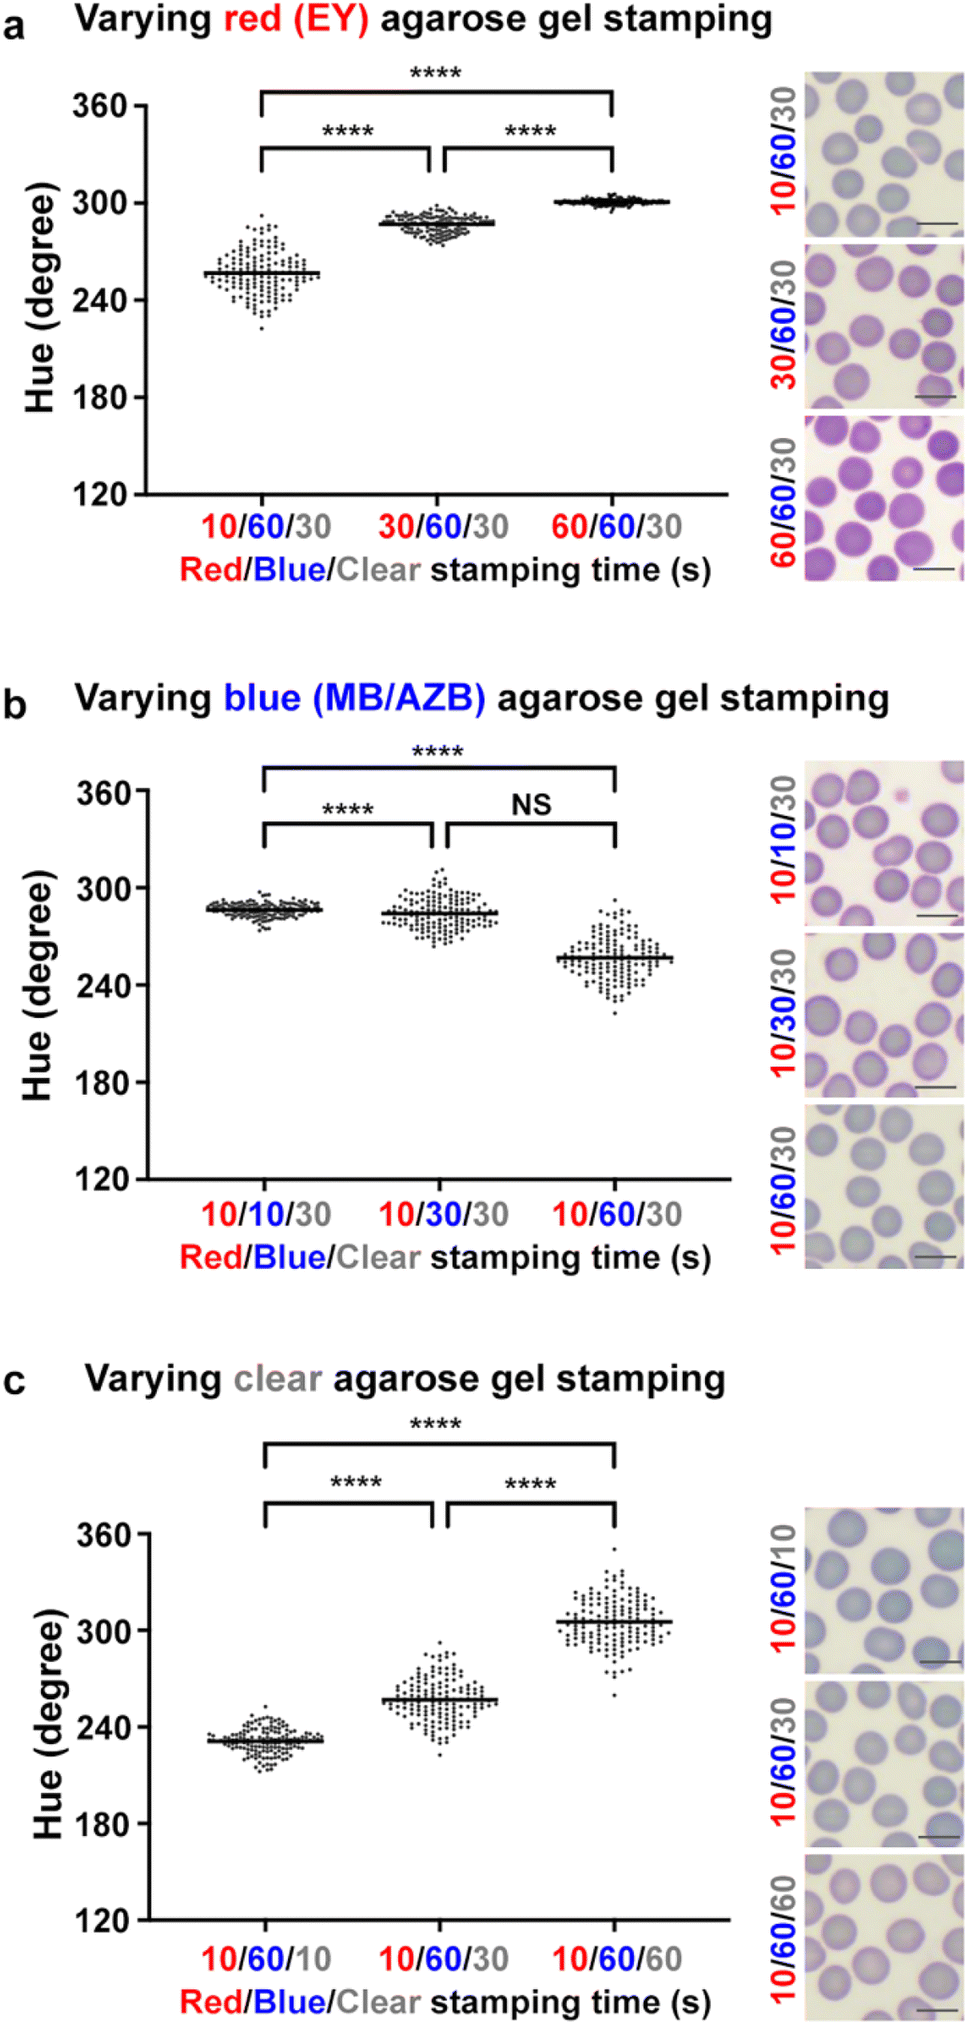
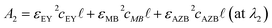
In Fig. 8, we varied the combination of three different agarose gels with contact times of 10 s, 30 s and 60 s. While 27 combinations (3 agarose gels and 3 different contact periods = 33) can be generated, we simplified the combination and extracted values of H with 9 combinations. With fixed staining of blue and clear agarose gels (Fig. 8a), increasing the contact time of red agarose gel increased the values of H (from mean values of 257 to 300). The corresponding images of RBCs show a similar trend, showing an increase of redness in the colours of RBC cytoplasm. Similarly in Fig. 8b, increasing the contact time of blue agarose gel decreased the values of H (mean values of 286 to 257) and the blueness in RBC cytoplasm also increased. In Fig. 8c, destaining with clear agarose gels increased the values of H (from mean values of 231 to 305) along with the changes of the corresponding colours in RBC cytoplasm. In Fig. 8c, the change of H ranges from 230° (Pantone blue) to 300° (light magenta). In contrast, data in Fig. 2a–c show that H in green (81°–140°) is turned to H in yellow (51°–60°) after destaining. While the concentrations of the ternary mixture in Fig. 2 and that in Fig. 8 are quite different, data presented in both figures show that the blueness of H is removed via destaining with clear agarose gels. That is, green is changed to yellow in Fig. 2, and Pantone blue is changed to light magenta in Fig. 8. This removal of blueness is also evidenced in the images of Fig. 8c. Since RBCs are devoid of nuclei (anionic), removal of cationic MB/AZB dyes is easier. As shown in Table 1 and Fig. 6, the sorption of MB/AZB to and from the agarose gel is relatively faster than anionic EY. Background values of H are maintained relatively consistent as shown in Fig. S5 (ESI†) even though the contact time of the agarose gel was increased. In comparison to the values of S in Fig. S3 (ESI†), those in Fig. S6 (ESI†) vary in a wider range from 0.07 to 0.23, which is primarily attributed to significantly higher concentrations of dyes in the miLab™ cartridge. As discussed above, the concentrations of the ternary mixture were much lower for analytical purposes: absorbance above 1.0 allows less than 10% of light to be transmitted through the sample (absorbance = log10100/% transmittance), which may sacrifice the accuracy of absorbance measurements.36 By separating EY and MB/AZB from the ternary mixture, it prevents the precipitation after forming the azure B-eosin complexes while providing larger possible formulation space for different combinations of EY and MB/AZB concentrations.
 |
| | Fig. 8 Application of the miLab™ hydrogel stamps to RBC smeared slides. miLab™ agarose gels (red including EY, blue including MB/AZB and clear including no dyes) were applied to RBC smeared slides at different combinations of staining and destaining time. H and representative images of stained and destained RBCs are reported with varying staining time of red (EY) (a), blue (MB/AZB) (b) and clear (c) agarose gels. One way ANOVA with Tukey's post hoc tests, ****p < 0.0001 and NS (non-significant). Scatter dot plot with mean. Scale bar, 10 μm. | |
4. Conclusions
We previously published the hydrogel stamping technology.4 To better quantify the transferred amount of Romanowsky dye molecules to and from agarose gels, we first tested if the transfer is quantifiable by measuring the extent of staining on smeared RBCs. The values of H gave us reasonable estimation, but precise quantification of the transfer needed a standard curve method. Since Romanowsky staining uses a ternary mixture and the sorption behaviour of each dye is assumed to be different, we collected adsorption and desorption data to fit with predictable models. The ternary mixture shows predictable adsorption to agarose gels as evidenced by high goodness of fit with the Langmuir isotherms. We also found that the kinetics of adsorption is explained by the PSO kinetic model, where the nature of Romanowsky dyes is the determinant of the kinetics, and that the kinetics of desorption shows an exponential decay with a fraction of Romanowsky dye molecules retained in agarose gels due to the high affinity of Romanowsky dye molecules. Our methods applied in this study demonstrate that quantification of the transferred Romanowsky dye molecules is feasible by bright field microscopy with quantifying H values and UV-vis spectrometry with established models of kinetics.
Author contributions
Conceptualization: Chae Yun Bae, Younghoon Song, Bhuvnesh Bharti, Jangwook P. Jung, data curation: Chae Yun Bae, Hamid Esmaeili, Syed A. Zamin, Min Jeong Seol, Eunmi Hwang, Suk Kyung Beak, Younghoon Song, Jangwook P. Jung, formal analysis: Chae Yun Bae, Hamid Esmaeili, Syed A. Zamin, Eunmi Hwang, Suk Kyung Beak, Younghoon Song, Bhuvnesh Bharti, Jangwook P. Jung, funding acquisition: Jangwook P. Jung, investigation: Chae Yun Bae, Jangwook P. Jung, methodology: Chae Yun Bae, Hamid Esmaeili, Jangwook P. Jung, project administration: Jangwook P. Jung, resources: Younghoon Song, supervision: Jangwook P. Jung, validation: Min Jeong Seol, Jangwook P. Jung, visualization: Chae Yun Bae, Bhuvnesh Bharti, Jangwook P. Jung, writing – original draft preparation: Chae Yun Bae, Hamid Esmaeili, Jangwook P. Jung, writing – review & editing: Chae Yun Bae, Hamid Esmaeili, Min Jeong Seol, Eunmi Hwang, Suk Kyung Beak, Younghoon Song, Bhuvnesh Bharti, Jangwook P. Jung.
Conflicts of interest
The authors declare the following competing financial interest(s): CYB, MJS, EH, SKB and YS are employees of Noul Co., Ltd JPJ was a member of Scientific Advisory Board (Technical Consultant) in Noul Co., Ltd.
Acknowledgements
This work was in part supported by the Korea Institute for Advancement of Technology (KIAT) grant funded by the Korea Government (MOTIE) (Project Number: 1415183667, P0019783) and the Korea Medical Device Development Fund grant funded by the Ministries of Science and ICT (Information and Communications Technology); Trade, Industry and Energy; Health and Welfare; Food and Drug Safety (Project Number: 1711195607, RS-2020-KD000092). The authors acknowledge the partial support from the Louisiana Board of Regents Research Competitiveness Subprogram (LEQSF(2018-21)-RD-A-03, JPJ), the National Science Foundation CAREER award (DMR-2047018, JPJ) and LSU Faculty Research Grant-Emerging Research (JPJ).
Notes and references
- S. Correa, A. K. Grosskopf, H. Lopez Hernandez, D. Chan, A. C. Yu, L. M. Stapleton and E. A. Appel, Chem. Rev., 2021, 121, 11385–11457 CrossRef CAS PubMed.
- J. S. Cybulski, J. Clements and M. Prakash, PLoS One, 2014, 9, e98781 CrossRef PubMed.
- M. S. Bhamla, B. Benson, C. Chai, G. Katsikis, A. Johri and M. Prakash, Nat. Biomed. Eng., 2017, 1, 0009 CrossRef CAS.
- J.-H. Choi, L. K. Chin, B. M. Woo, Y. Song, M. J. Seol, Y. Hong, A.-Q. Liu, S. Jang, H. Ploegh, H. Im and D. Lee, ACS Appl. Mater. Interfaces, 2021, 13, 22124–22130 CrossRef CAS.
- J.-Y. Xiong, J. Narayanan, X.-Y. Liu, T. K. Chong, S. B. Chen and T.-S. Chung, J. Phys. Chem. B, 2005, 109, 5638–5643 CrossRef CAS.
- Y. Chen, Y. Ma, W. Lu, Y. Guo, Y. Zhu, H. Lu and Y. Song, Molecules, 2018, 23, 2473 CrossRef PubMed.
- M. Erfani and V. Javanbakht, Int. J. Biol. Macromol., 2018, 114, 244–255 CrossRef CAS PubMed.
- M. Maruthapandi, V. B. Kumar, J. H. T. Luong and A. Gedanken, ACS Omega, 2018, 3, 7196–7203 CrossRef CAS PubMed.
- A. Hayashi and T. Kanzaki, Food Hydrocolloids, 1987, 1, 317–325 CrossRef CAS.
- W. M. Fong Amaris, C. Martinez, L. J. Cortés-Cortés and D. R. Suárez, Malar. J., 2022, 21, 74 CrossRef CAS PubMed.
- A. Fernández-Pérez and G. Marbán, ACS Omega, 2020, 5, 29801–29815 CrossRef PubMed.
- R. Pospíchal, K. Nesměrák, P. Rychlovský and I. Němcová, Anal. Lett., 2007, 40, 1167–1175 CrossRef.
- W. Y. Seow and C. A. E. Hauser, J. Environ. Chem. Eng., 2016, 4, 1714–1721 CrossRef CAS.
- M. A. Abdullah, L. Chiang and M. Nadeem, Chem. Eng. J., 2009, 146, 370–376 CrossRef CAS.
- H. S. Fairman, M. H. Brill and H. Hemmendinger, Color Res. Appl., 1997, 22, 11–23 CrossRef.
-
D. Cruz, C. Jennifer, Valiente Jr, L. C. Castor, C. M. T. Mendoza, B. A. Jay, L. S. C. Jane and P. T. B. Brian, in 2017 IEEE 9th International Conference on Humanoid, Nanotechnology, Information Technology, Communication and Control, Environment and Management (HNICEM), IEEE, 2017, pp. 1–7 Search PubMed.
- K. Yabusaki, T. Faits, E. McMullen, J. L. Figueiredo, M. Aikawa and E. Aikawa, PLoS One, 2014, 9, e89627 CrossRef PubMed.
-
R. Velastegui and M. Pedersen, in 2021 9th European Workshop on Visual Information Processing (EUVIP), IEEE, 2021, pp. 1–6 Search PubMed.
- S. A. Bentley, P. N. Marshall and F. E. Trobaugh, Anal. Quant. Cytol., 1980, 2, 15–18 CAS.
- R. Horobin, Biotech. Histochem., 2011, 86, 36–51 CrossRef CAS PubMed.
- R. Hajian and A. Soltaninezhad, J. Spectrosc., 2013, 2013, 405210 Search PubMed.
- N. S. Abdelwahab and M. A. Mohamed, Chem. Pharm. Bull., 2017, 65, 558–565 CrossRef CAS PubMed.
- J. Narayanan, J.-Y. Xiong and X.-Y. Liu, J. Phys.: Conf. Ser., 2006, 28, 83–86 CrossRef CAS.
- S. Golawska, I. Sprawka, A. Golawski and H. Matok, Aust. J. Crop Sci., 2014, 8, 263–270 Search PubMed.
- S. Wang, Z. H. Zhu, A. Coomes, F. Haghseresht and G. Q. Lu, J. Colloid Interface Sci., 2005, 284, 440–446 CrossRef CAS PubMed.
- H. Valdés, M. Sánchez-Polo, J. Rivera-Utrilla and C. A. Zaror, Langmuir, 2002, 18, 2111–2116 CrossRef.
- M. Chakraborty and A. K. Panda, Spectrochim. Acta, Part A, 2011, 81, 458–465 CrossRef CAS PubMed.
- E. Schulte, D. Wittekind and V. Kretschmer, Acta Histochem., Suppl., 1989, 37, 139–147 CAS.
- M. A. Al-Ghouti and R. S. Al-Absi, Sci. Rep., 2020, 10, 15928 CrossRef CAS PubMed.
- R. Hoseinzadeh Hesas, A. Arami-Niya, W. M. A. Wan Daud and J. N. Sahu, Bioresources, 2013, 8, 2950–2966 CrossRef.
-
T. R. Sahoo and B. Prelot, in Nanomaterials for the Detection and Removal of Wastewater Pollutants, ed. B. Bonelli, F.S. Freyria, I. Rossetti and R. Sethi, Elsevier, 2020, pp. 161–222 Search PubMed.
- Y. Xiao, J. Azaiez and J. M. Hill, Ind. Eng. Chem. Res., 2018, 57, 2705–2709 CrossRef CAS.
- A. P. Richter, J. S. Brown, B. Bharti, A. Wang, S. Gangwal, K. Houck, E. A. Cohen Hubal, V. N. Paunov, S. D. Stoyanov and O. D. Velev, Nat. Nanotechnol., 2015, 10, 817–823 CrossRef CAS PubMed.
- M. Hubbe, S. Azizian and S. Douven, Bioresources, 2019, 14, 7582–7626 Search PubMed.
- M. Yang, X. Liu, Y. Qi, W. Sun and Y. Men, J. Colloid Interface Sci., 2017, 506, 669–677 CrossRef CAS PubMed.
- R. W. Burke, E. R. Deardorff and O. Menis, J. Res. Natl. Bur. Stand., Sect. A, 1972, 76A, 469–482 CrossRef CAS PubMed.
|
| This journal is © The Royal Society of Chemistry 2023 |
Click here to see how this site uses Cookies. View our privacy policy here. 
 Open Access Article
 This Open Access Article is licensed under a Creative Commons Attribution-Non Commercial 3.0 Unported Licence
 *a,
Hamid
Esmaeili‡
b,
Syed A.
Zamin
b,
Min Jeong
Seol
a,
Eunmi
Hwang
a,
Suk Kyung
Beak
a,
Younghoon
Song
a,
Bhuvnesh
Bharti
*a,
Hamid
Esmaeili‡
b,
Syed A.
Zamin
b,
Min Jeong
Seol
a,
Eunmi
Hwang
a,
Suk Kyung
Beak
a,
Younghoon
Song
a,
Bhuvnesh
Bharti


 is the path length and λ1, λ2, and λ3 correlate with peaks of the individual dyes' absorption spectra.