
 Open Access Article
 This Open Access Article is licensed under a Creative Commons Attribution-Non Commercial 3.0 Unported Licence
A new modality for cholesterol impact tracking in colon cancer development – Raman imaging, fluorescence and AFM studies combined with chemometric analysis†
K.
Beton-Mysur
 and
B.
Brożek-Płuska
*
and
B.
Brożek-Płuska
*
Lodz University of Technology, Faculty of Chemistry, Institute of Applied Radiation Chemistry, Laboratory of Laser Molecular Spectroscopy, Wroblewskiego 15, 93-590 Lodz, Poland. E-mail: beata.brozek-pluska@p.lodz.pl; Tel: +48 42 631 31 92
First published on 2nd October 2023
Abstract
Colorectal cancer (CRC) is the third most common cancer worldwide. Obesity, alcohol consumption, smoking, high consumption of red or processed meat and a diet with low fibre, fruit, and vegetable intake increase CRC risk. Despite advances in surgery (the basic treatment for recovery), chemotherapy, and radiotherapy, CRC remains the second leading cause of cancer-related deaths in the world. Therefore the social importance of this problem stimulates research aimed at developing new tools for rapid CRC diagnosis and analysis of CRC risk factors. Considering the association between the cholesterol level and CRC, we hypothesize that cholesterol spectroscopic and AFM (atomic force microscopy) studies combined with chemometric analysis can be new, powerful tools used to visualize the cholesterol distribution, estimate cholesterol content and determine its influence on the biochemical and nanomechanical properties of colon cells. Our paper presents the analysis of human colon tissues: normal and cancer and human colon single cells normal CCD18-Co and cancer CaCo-2 in the physiological state and CaCo-2 upon mevastatin supplementation. Based on vibrational features we have shown that Raman spectroscopy and imaging allow cholesterol content in human colon tissues and human colon single cells of both types to be tracked and allow the effectiveness of mevastatin in the mevalonate pathway modulation and disruption of the cholesterol level to be proven. All observations have been confirmed by chemometric analysis including principal component analysis (PCA) and partial least squares discriminant analysis (PLSDA). The positive impact of statins on cholesterol content has also been studied by using fluorescence microscopy and atomic force microscopy (AFM). A significant increase in Young modulus as a mechanomarker for CaCo-2 human cancer colon cells upon mevastatin supplementation compared to CCD18-Co human normal colon cells was observed. This paper is one of the first reports about the use of Raman spectroscopic techniques in cholesterol investigations and the first one about cholesterol investigation using Raman spectroscopy (RS) on human cells ex vivo in the context of colon cancer development.
Introduction
Colorectal cancer (CRC) is the third most commonly diagnosed cancer and the second most common cause of oncological death in the world and as such represents a major public health issue worldwide.1 About 6% of CRCs are predetermined by a hereditary syndrome, while around 25% have a familial background, being tightly intertwined with many of the modifiable risk factors such as diet. Non-modifiable risk factors for CRCs include increasing age, male gender, African or American race and residence in high-income countries,2 while modifiable factors include obesity, moderate to heavy alcohol consumption, smoking, high consumption of red or processed meat and a diet with low fibre, fruit, and vegetable intake.1,2 Also, genetic factors play an important role in its pathogenesis.2Table 1 presents an overview of different factors associated with CRC development.| Notes | Proposed function | References | |
|---|---|---|---|
| a LXR – liver X receptor; CYP8B1 – cytochrome P450, family 8, subfamily B, polypeptide 1, also known as sterol 12-alpha-hydroxylase; CYP46A1 – cytochrome P450 family 46 subfamily A member 1; cholesterol 24-hydroxylase; CYP2R1 – cytochrome P450 family 2 subfamily R member 1, an enzyme which is the principal vitamin D 25-hydroxylase; CYP7B1 – cytochrome P450 family 7 subfamily B member 1, 25-hydroxycholesterol 7-alpha-hydroxylase also known as oxysterol and steroid 7-alpha-hydroxylase; OSBPL9 – oxysterol binding protein like 9, a protein coding gene; FXR – bile acid receptor – farnesoid X receptor; PER1 – period circadian regulator 1, encodes the period circadian protein homolog 1 protein in humans; PER2 – period circadian regulator 2, a protein in mammals encoded by the PER2 gene; PER3 – period circadian regulator 3, encodes the period circadian protein homolog 3 protein in humans; RORA – retinoic acid-related orphan receptor A; SIRT1 – sirtuin 1, also known as NAD-dependent deacetylase sirtuin-1. | |||
| Total serum cholesterol | Increased in humans | Higher risk for CRC | 3–5 |
| CYP7A1 | SNP and haplotype | Associated with CRC | 6–8 |
| Oxyphytosterols | Treatment of CRC cell lines | Anti-proliferative and pro-apoptotic | 9 |
| Dietary oxysterols | Treatment of Caco-2 | Pro-apoptotic | 10 |
| 27-Hydroxycholesterol | Treatment of CRC cell lines | Anti-proliferative | 11 |
| 7α-7β-Hydroxycholesterol; 5α,6α-epoxyhydrocholesterol and 7β-hydroxysitosterol | Treatment of Caco-2 | Pro-apoptotic | 12–14 |
| 7β-Hydroxycholesterol | Treatment of Caco-2 | Induced expression of inflammatory and chemotactic cytokines | 15 |
| 7-Ketocholesterol | Treatment of Caco-2 | Reduced barrier functions, anti-apoptotic, induced viability, and lower inflammatory response | 16 and 17 |
| Treatment of HT-29 | Induction of ER stress | 18 | |
| Treatment of Caco-2 | Mitochondrial functionality | 19 | |
| 25-Hydroxycholesterol | Treatment of Caco-2 | Reduced barrier functions, anti-apoptotic and induced viability | 16 |
| Treatment of DLD-1 | Induction of cell death and anoikis | 20 | |
| Treatment of Caco-2 | Enhanced IL1B induction of IL8 | 21 | |
| LXR | Induction by an agonist in CRC cell lines | Anti-proliferative | 22 |
| CYP8B1, CYP46A1, and CYP2R1 | Higher expression in CRC | Poor prognosis | 23 |
| CYP7B1 | Higher expression in CRC | Good prognosis | 23 |
| OSBPL9 | Downregulation in CRC tumors | Poor prognosis | 24 |
| LXR | Increased expression | Good prognosis | 25 |
| Activation in HT-29 | Anti-proliferative | 26 and 27 | |
| FXR | Decreased expression in CRC tumors | Poor prognosis | 28 and 29 |
| Knockout in mice | Increased susceptibility to chemically-induced | 29 and 30 | |
| Overexpression in CRC cell lines | Reduced tumor growth, anti-proliferative, and pro-apoptotic | 29–31 | |
| PER1 and PER3 | Decreased expression in CRC tumors | Poor prognosis | 32 |
| PER1 and BMAL1 | Decreased PER1 and increased BMAL1 in CRC tumors | Poor prognosis | 33 |
| PER2 | Increased CRC tumors | Good prognosis | 32 |
| RORA | SNPs | Risk of development of CRC | 34 |
| Lower expression in CRC tumors | Good prognosis | 34 | |
| SIRT1 | Transgenic mice and human tumor specimens | Suppression of in vivo tumor formation | 35 |
As one can see from Table 1 the risk factor of CRC is directly related to the increased level of cholesterol. Due to the fact that the results presented above were obtained using conventional methods of molecular biology, which are high-cost, time-consuming and used complex protocols of sample preparation we decided to examine if the cholesterol can be tracked by using Raman spectroscopy, Raman imaging and AFM, which are lower-cost and fast and do not demand complex sample preparation. The utility of spectroscopic and microscopic techniques will be verified by chemometric analysis.
Cholesterol was first discovered by Poulletier de la Salle from bile and gallstones in 1769.36 Cholesterol occurs in the human body in tissues and plasma in free form or as cholesterol esters. It is a very important structural and building component of biological membranes and the outer layer of lipoproteins.37 Cholesterol is synthesized in many human tissues from acetyl-CoA and is a precursor to all steroids in the body, including corticosteroids and vitamin D.37–39 Slightly more than half of human cholesterol is produced by biosynthesis (about 700 mg/24 h), and the rest is provided in the diet. Most of the dietary cholesterol is in the form of cholesterol ester and its transportation in the body is carried out in bound form with different Apo proteins forming an Apo-lipoprotein complex (cholesterol carrier/transporter). About 10% of cholesterol is synthesized in the liver and another 10% in the intestines. Virtually all nucleated cells have the ability to synthesize cholesterol in the endoplasmic reticulum.
In detail, cholesterol biosynthesis takes place in 5 stages: (1) synthesis of mevalonate from acetyl-CoA, (2) formation of an isoprenoid unit from mevalonate (with CO2 molecule loss), (3) condensation of 6 isoprenoid units to form squalene, (4) cyclization of squalene to the parent steroid – lanosterol, and (5) formation of cholesterol from lanosterol. Fig. 1 shows the early steps of cholesterol biosynthesis (including the main regulatory stage, which is the site of action for the most effective cholesterol-modulating drugs – statins).
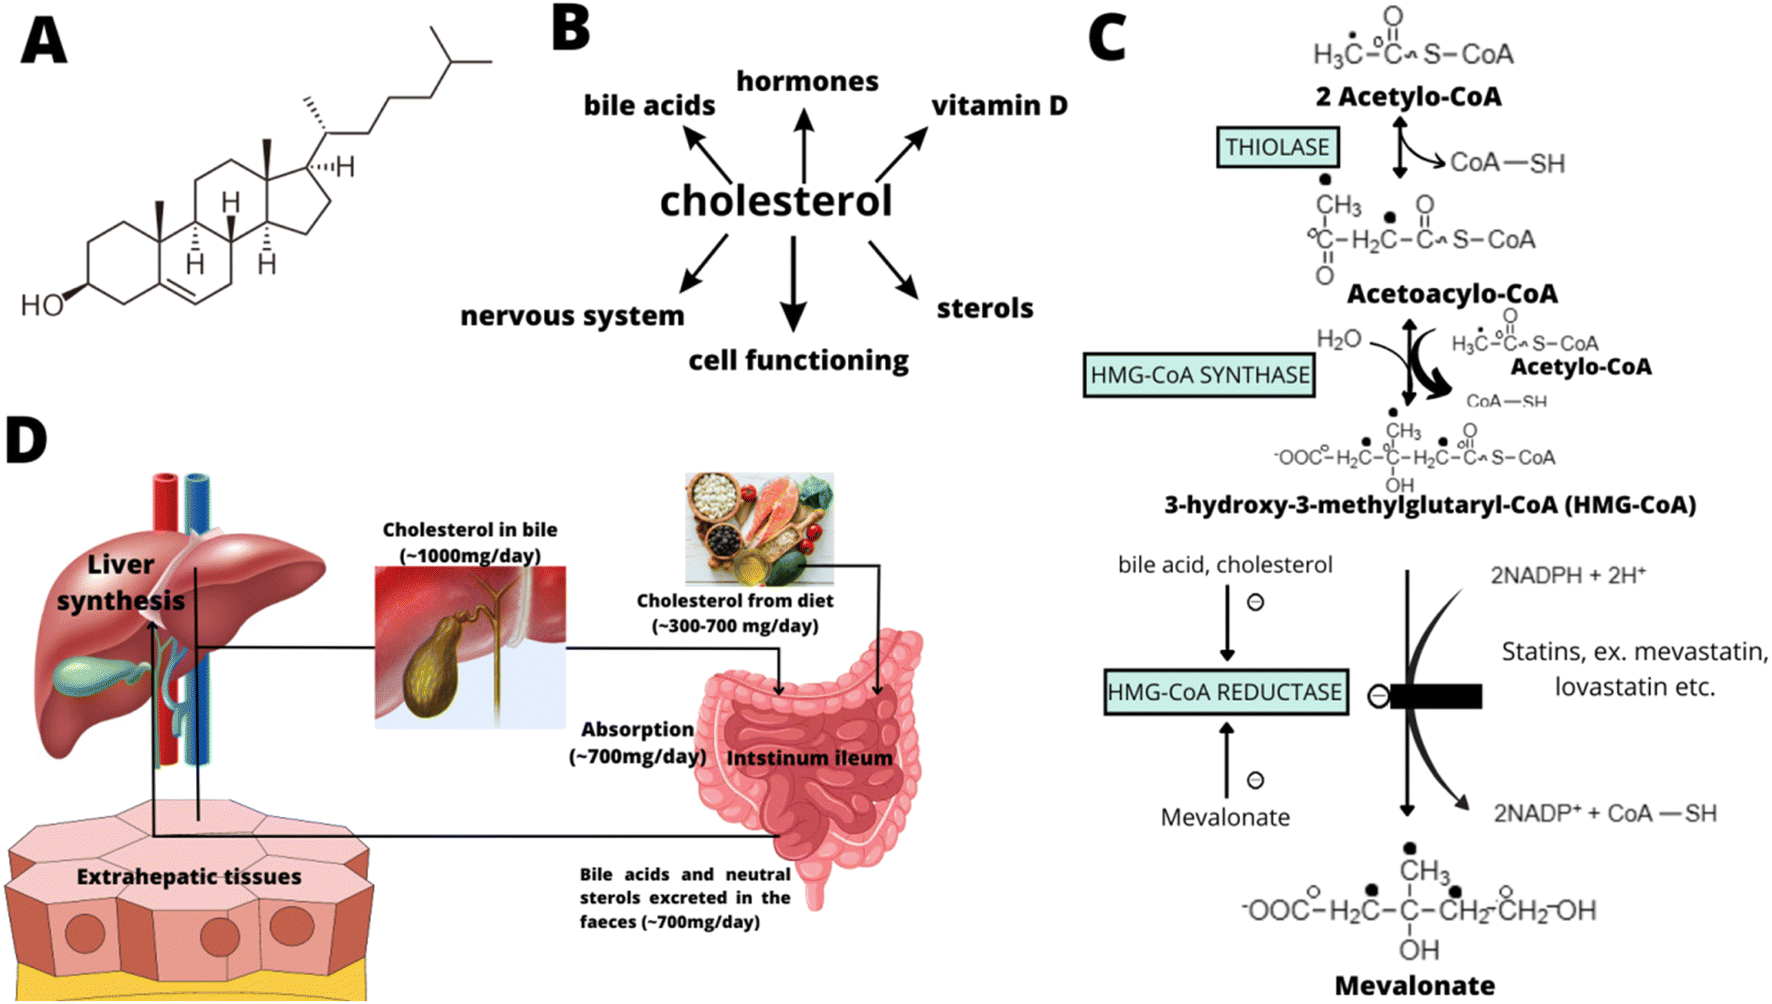 | ||
| Fig. 1 The structure of cholesterol (A), the main roles of cholesterol in the human body (B), the early steps of cholesterol biosynthesis (including the main regulatory stage modulated by statins) (C), and the main places of cholesterol biosynthesis and absorption (D). | ||
All types of cancer cells can also synthesize cholesterol and have the ability to rapidly take up cholesterol to support tumor growth.40,41 Interestingly, majorities of cancers (colorectal cancer, glioblastoma, breast cancer, non-small cell lung cancer, hepatocellular carcinoma, etc.) exhibit up-regulated ACLY (ATP citrate lyase) expression thereby supporting cancer cell proliferation.42–44
Cholesterol metabolism in normal cells is well-regulated. In normal cells when the cholesterol blood level increases the biosynthesis of cholesterol decreases and vice versa. The intensity of biosynthesis is controlled via a feedback mechanism by inhibiting HMG-CoA reductase and downregulation of the LDLR (low density lipoprotein receptor) through inactivation of sterol regulatory element-binding protein 2 (SREBP 2) pathway signaling.45 For cancer cells an increasing expression of the acyl-CoA: cholesterol acyltransferase 1 (ACAT1) enzyme is characteristic.46,47 Stored cholesterol esters may function as a reservoir for rapid cell division so they are crucial in cancer development. A schematic representation of the differences in cholesterol metabolism in normal and cancer cells is shown in Fig. 2.
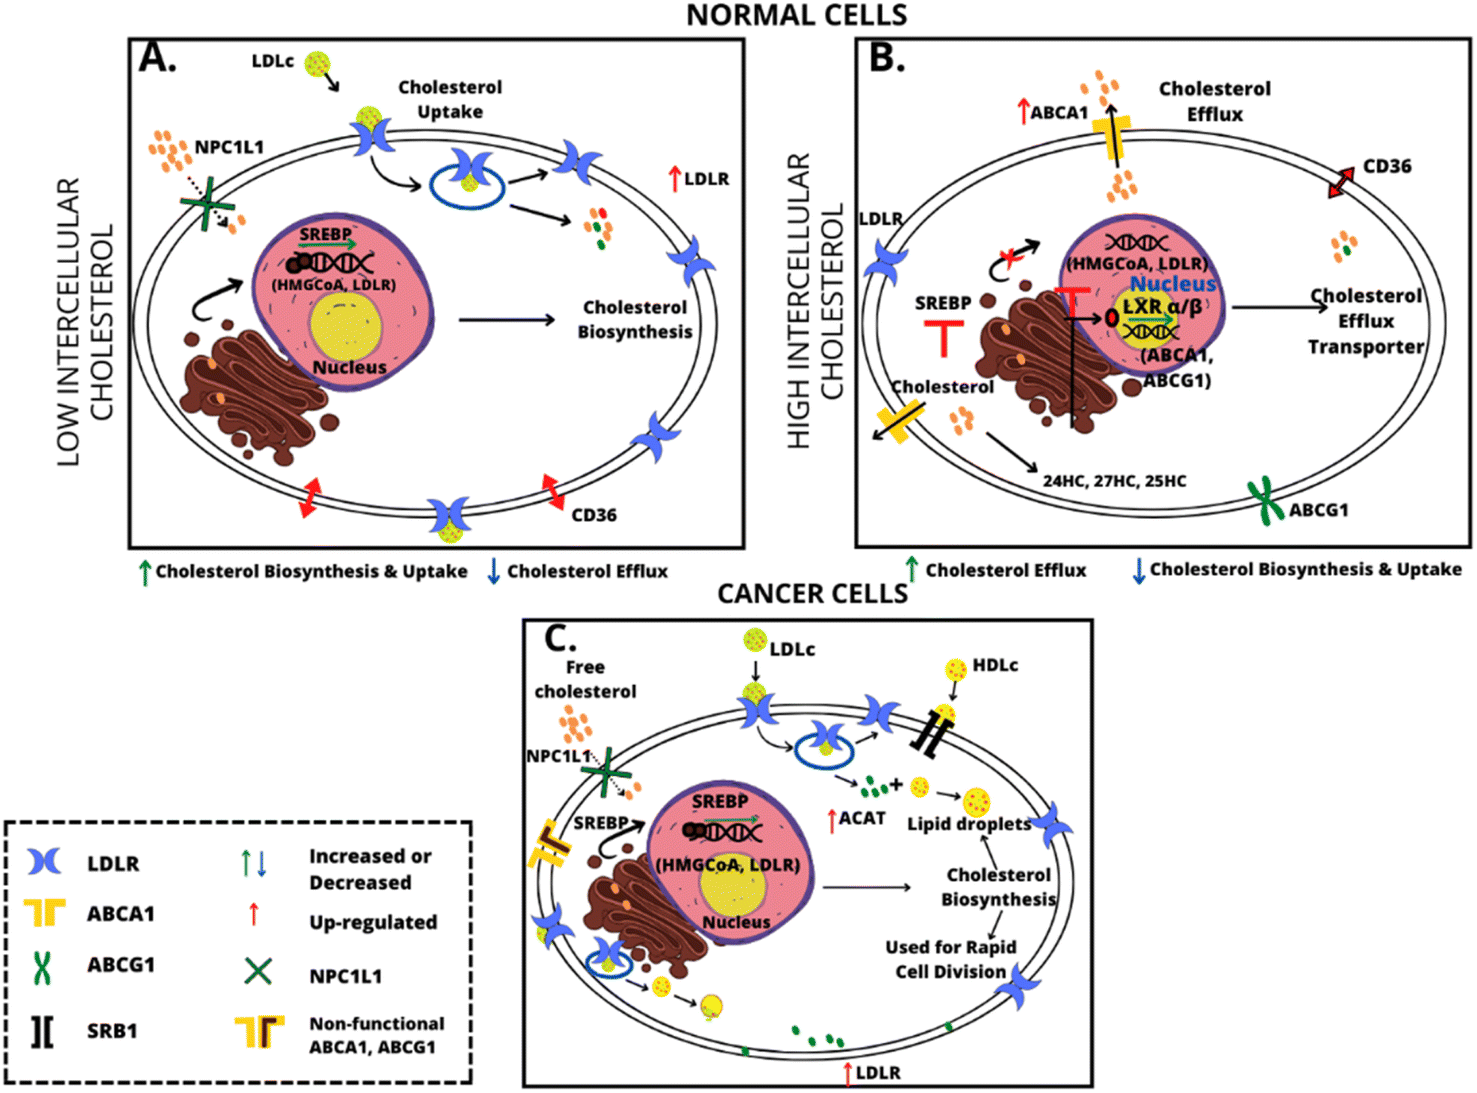 | ||
| Fig. 2 Schematic representation of the difference in cholesterol metabolism in normal and cancer cells. | ||
Summarizing deregulated cholesterol metabolism as leading to up-regulation of cholesterol uptake, biosynthesis, and accumulation supports cancer cell proliferation, metastasis, invasion, and drug resistance.48,49 The importance of cholesterol in human body metabolism is evidenced by the award of the Nobel Prize to Goldstein J. L. and Brown M. S. in 1985 for their discoveries on cholesterol metabolism.
In the context of relation between the cholesterol level and CRC cancer an earlier study suggested that a high blood cholesterol level may reduce the risk of colon cancer independently.50 However, other groups have found that an increased blood cholesterol level does not have any protective effect on the occurrence and progression of colon cancer; instead it increases the risk of cancer.5,51 The decrease in the blood cholesterol level in CRC patients may be a consequence of increased uptake of blood cholesterol by colon cancer cells and as such it is less likely to be a cause for colon cancer initiation. Moreover, some studies have shown a negative correlation between cancer malignancy and global patient prognosis.52
For tissues, colon cancers express a higher level of LDLR compared to normal ones, which confirms enhanced cholesterol uptake from the blood by colon cancer cells and supports rapid colon cancer cell division. Törnberg et al. showed a positive correlation of cholesterol and β-lipoprotein levels with increased risk of rectal and colon cancer in the male population whereas there were non-significant correlations for females.53 Moreover, both LDL and VLDL were shown to activate the extracellular signal-regulated kinase (ERK)/mitogen-activated protein kinase (MAPK) signaling pathway and also help in intestinal inflammation by generating reactive oxygen species (ROS).8 ROS are a group of molecules and free radicals generated within cells through oxygen metabolism. Excessive ROS production can result in oxidative stress, characterized by oxidative damage to proteins, lipids and DNA.54 Evidence has indicated an important role for ROS induction in cancer development, metastasis, progression, and survival.55 The effects of ROS might be associated with multiple signalling pathways, including the MAPK pathway, which is one of the principal signalling conduits controlling cell proliferation and differentiation.54 Moreover, ROS and the MAPK pathway also play vital roles in inflammation, which is strongly associated with cancer initiation.56
In a human body homeostasis important role is played also by cholesterol derivatives. Oxysterols are oxidized forms of cholesterol found in low to very low concentrations in the human body.57 Cholesterol oxygenation usually occurs on the aliphatic side chain or steroid backbone and directly results from enzymatic activity or auto-oxidation in the presence of ROS. Side-chain oxidation generates 22-hydroxycholesterol (22-HC), 24-HC, 25-HC, and 27-HC, and oxidation occurring on the backbone generates 7a/b-hydroxycholesterol (7a-HC/7b-HC), 7-ketocholesterol (7-KC) and 5,6a/b-epoxycholesterol (5,6a-EC/5,6b-EC). Oxysterols can also be generated indirectly through lipid peroxidation.58 Oxysterols can inhibit the mevalonic acid (MVA) pathway and cholesterol (Chol) biosynthesis.3,10 Bile acids are also suspected to cause mitochondrial dysfunction, leading to ROS accumulation in colon cells. Of note, bile acid exposure, particularly DCA (dichloroacetic acid), triggers activation of the epidermal growth factor receptor (EGFR), MAKP, NF-κB (nuclear factor kappa-light-chain-enhancer of activated B cells), and protein kinase C (PKC) signalling pathways in normal colon and oesophageal epithelium and colon cancer cells. However, prolonged bile acid exposure induces apoptotic cell death via mitochondrial dysfunction, ROS release, and cytochrome c activation. These mechanisms contribute to colorectal tumorigenesis.
Statins competitively inhibit HMG-CoA reductase, which catalyses the rate-limiting step in the mevalonate pathway.59 By preventing the conversion of HMG-CoA to mevalonate, statins potently reduce endogenous cholesterol synthesis, leading to a decrease in circulating low density lipoprotein (LDL)-cholesterol. Independent of their lipid-lowering properties, statins appear to possess a variety of pleiotropic effects, including inhibition of cell proliferation, enhanced apoptosis, and modulation of inflammation, endothelial function, and angiogenesis. Statins have cholesterol-lowering abilities, exert multiple effects on many essential cellular functions such as proliferation, differentiation, and survival, and are involved in regulating cell shape and movement. Statins have been shown to inhibit proliferation and induce apoptosis in a wide variety of cancer cells, including colorectal cells.60–63
The presented paper is one of the first reports about the use of Raman spectroscopic techniques in cholesterol investigations and the first one about cholesterol investigation using Raman spectroscopy (RS) on human cells ex vivo in the context of colon cancer development.
Materials and methods
Chemical compounds
Mevastatin ≥98% (HPLC) catalogue number M2537-5MG, bis-benzimide H 33342 trihydrochloride catalogue number B2261, and Red Oil-O catalogue number O0625 were purchased from Merck Life Science Sp. z o. o. and used without additional purification. An XTT proliferation kit with catalogue number 20-300-1000 was purchased from Biological Industries. Cholesterol, catalogue number C3045-25G; arachidonic acid, catalogue number 10931-250MG; oleic acid, catalogue number O1383-5G; collagen, catalogue number C4243-20ML; cytidine, catalogue number C4654-5G; DNA, catalogue number D3035-5MG; mevalonic acid (MVA), catalogue number 50838-10MG were purchased from Merck Life Science Sp.z.o.o., an affiliate of Merck KGaA, Darmstadt, Germany, and used without additional purification.Cell culture
Research subjects were CCD-18Co (ATCC® CRL-1459™) and Caco-2 (ATCC® HTB-37™) cell lines purchased from ATCC: The Global Bioresource Center. The CCD-18Co cell line was cultured in accordance with the manufacturer's recommendations using ATCC-formulated Eagle's minimum essential medium with L-glutamine (catalog no. 30-2003). To make the complete growth medium, fetal bovine serum was added to a final concentration of 10%. The complete culture medium was renewed every 2–3 days. The cells CCD-18 Co were obtained from the patient and their characteristics and morphology are those of normal myofibroblasts in the colon. The CaCo-2 cell line was also cultured according to the ATCC protocols. The CaCo-2 cell line was obtained from a patient – a 72-year-old Caucasian male diagnosed with colon adenocarcinoma. To make the medium complete we based it on Eagle's Minimum Essential Medium with L-glutamine (catalog no. 30–2003), with the addition of fetal bovine serum to a final concentration of 20%. The medium was renewed once or twice a week.The biological safety of both CCD-18Co and Caco-2 cell lines has been classified by the American Biosafety Association (ABSA) as level 1 (BSL-1). During the study 60 cells were analyzed.
Cultivation conditions
Cell lines (CCD-18Co and CaCo-2) used in the experiments in this study were grown in flat-bottom culture flasks made of plasma treated polystyrene with a cell growth surface of 75 cm2. Flasks containing cells were stored in an incubator providing environmental conditions of 37 °C, 5% CO2, and 95% air.Cell treatment
CCD-18 Co and CaCo-2 cells were seeded onto calcium fluoride (CaF2) windows (25 × 1 mm) at a density of 103 cells per cm3 and were incubated for 24 h. After this time for CaCo-2 cells the standard growth medium was removed and 10 and 50 μM mevastatin solution (in the growth medium) was added. The time of incubation with both concentrations was 24 and 48 hours. Measurements for pure CCD-18 Co and CaCo-2 have been performed after 24 hours of incubation in the pure growth medium. For Raman measurements the cells were washed with PBS (phosphate buffered saline) and fixed with 4% formalin solution.Human colon tissues
Human colon tissue samples were collected during routine surgery as an intraoperative biological material. The non-fixed, fresh samples were used to prepare 16 μm sections. Specimens of the tissue from the tumor mass and the tissue from the safety margins outside of the tumor mass were prepared for Raman analysis by placing specimens on CaF2 windows. Additionally, tissue sections were stained (hematoxylin and eosin) for standard histological analysis. The histopathological analysis was performed by pathologists from the Medical University of Lodz, Department of Pathology, Chair of Oncology. All procedures performed in studies involving human participants were in accordance with the ethical standards of the institutional and/or national research committee and with the 1964 Helsinki Declaration. All tissue procedures were conducted under a protocol approved by the Institutional Bioethical Committee at the Medical University of Lodz, Poland (RNN/323/17/KE/17/10/2017, 17, October 2017). Written informed consent was obtained from patients. The Raman spectroscopy/imaging database contains data from 40 patients diagnosed with CRC (for each patient, normal and cancer tissues were analyzed).Raman spectroscopy and imaging
The fundamental information about Raman spectroscopy including the scheme explaining the phenomenon of Raman scattering is included in the ESI (see Raman Spectroscopy and Imaging and Schemes 1 and 2†).All Raman spectra and images presented and discussed in this paper were registered using a confocal microscope Alpha 300 RSA+ (WITec, Ulm, Germany) equipped with an Olympus microscope integrated with an optical fiber with a 50 μm core diameter coupled with an UHTS spectrometer (ultra high throughput spectrometer) and a CCD camera (Andor Newton DU970NUVB-353) operating in default mode at −60 °C in full vertical binning. A laser with an excitation line 532 nm was focused on the sample through a Nikon objective lens with a magnification of 40× and a numerical aperture (NA = 1.0) intended for cell measurements performed by immersion in PBS. The average excitation power of the laser during the experiments was 10 mW, with an integration time of 1.0 s. An edge filter was used to filter out the Rayleigh scattered light, which means that the reflected light that reaches the detector comes only from the plane from which the image is created. Spectra were collected with one acquisition per pixel and a diffraction grating of 1200 lines per mm. Cosmic rays were removed from each Raman spectrum (model: filter size: 2, dynamic factor: 10) and the Savitzky–Golay method was implemented for the smoothing procedure (order: 4, derivative: 0). All data were collected and processed using original software WITec Project Plus.
Statistical analysis
by varying the weighting factors a, b, c,… of the basis spectra

 .
.
The normalization, model: divided by norm (divide the spectrum by the dataset norm) was performed by using Origin software according to the formula:
where vn is the nthV value.
The normalization was performed for all Raman spectra presented in the manuscript.
The Origin software was also used to perform ANOVA analysis necessary to indicate statistically significant results (means comparison: the Tukey model, significance level: 0.05) and to calculate Pearson correlation coefficients (significance level: 0.05).
Fluorescence microscopy and ImageJ analysis
Fluorescence studies have been conducted by using an EVOS M7000 system. The EVOS M7000 imaging system is a high-performance, fully automated, inverted, multi-channel fluorescence and transmitted light imaging system. The EVOS M7000 system combines and integrates precision components that enable high-quality automated fluorescence imaging anywhere with unprecedented workflow efficiency. Powerful image analysis for cell segmentation and quantification was possible with the usage of the external ImageJ programme. ImageJ is a Java-based image processing program developed at the National Institutes of Health and the Laboratory for Optical and Computational Instrumentation (LOCI, University of Wisconsin).64,65 ImageJ can display, edit, analyze, process, save, and print 8-bit color and grayscale, 16-bit integer, and 32-bit floating point images. In this work, the ImageJ functionality to calculate area and pixel value statistics of user-defined selections and intensity-thresholded objects was used.Chemometric analysis
PCA and PLSDA were performed using MATLAB (MathWorks, USA) with PLS-Toolbox, Eigenvector Research Inc., USA.The partial least squares discriminant analysis (PLSDA) algorithm was used for predictive and descriptive modelling, as well as discriminative variable selection. PLSDA combines discriminant analysis and dimensionality reduction into one algorithm and is especially applicable to modelling high-dimensional data. PLSDA does not assume the data to fit a particular distribution and is thus more flexible than other discriminant algorithms. In spectroscopic applications, PLSDA aims to predict sample class membership contained in matrix Y based on spectroscopic data contained in matrix X. PLSDA utilizes analytes that have large variations in intensities across the samples and attempts to correlate them to the sample class information contained in Y. Other meaningful results from PLSDA are scores and loadings that describe the samples and variables, respectively. A scores plot would ideally show enough separation of the classes input as a part of the analysis, whereas a loadings plot would demonstrate the variables (i.e., spectroscopic peak features) that are significant in differentiating the sample classes. Samples have scores on each determined latent variables (LVs), and the spectroscopic variables have loadings for each LV. Therefore, a final result of PLSDA is the prediction of sample membership for both calibration/training sets of samples used to build the model and new samples. Moreover, sensitivity and specificity of the analytical method used in the study can be determined.
Principal component analysis is another technique for analyzing large datasets containing a high number of dimensions/features per observation, increasing the interpretability of data and simultaneously preserving the maximum amount of information. PCA is accomplished by linearly transforming the data into a new coordinate system where (most of) the variation in the data can be described with fewer dimensions than the initial data. Using PCA scores and loadings plots as for PLSDA can be determined.
AFM
The fundamental information about the measurement technique along with diagrams showing the method is included in the ESI (see AFM and Scheme 3†).AFM measurements were performed by using a PIK Instruments atomic force microscope with a scanning range of 100 × 100 μm in the X and Y axes and 15 μm in the Z axis with a positioning resolution in the XY axis of 6 pm and in the Z axis of 0.9 pm, equipped with an inverted microscope, enabling measurements in air and liquid, in contact and tapping modes. Nanosurf C3000 software was used for AFM data collection. During study topography maps and nanomechanical properties of human colon cells with and without supplementation of mevastatin were determined with the resolution 256 × 256 points per 60 × 60 μm. qp-Bio-AC-50 tips produced by Nanosensors with a spring constant equal to 0.68 N m−1 were used. The analysis of AFM data was performed by using AtomicJ software66 to obtain Young's modulus values. For AFM measurements cells were cultured on Petri dishes filled with culture media. Once the growing cells formed a semi-confluent monolayer, the dish with cells was mounted on the AFM scanner, the medium was replaced by PBS and the sample was measured within the next 1 h at room temperature and under ambient conditions.
Determination of the appropriate mevastatin concentration using the XTT test
For each cell type, XTT (sodium 3′-[1-(phenylaminocarbonyl)-3,4-tetrazolium]-bis (4-methoxy-6-nitro) benzene sulfonic acid hydrate) tests were performed 24 h and 48 h after the addition of mevastatin to the cells immersed in the culture medium. Preparation for the test included proper filling of 96-well plates according to the procedure developed at the Institute of Applied Radiation Chemistry in Lodz. The wells were filled in such a way that each row of the plate (8 wells) contained a specific series of measurements. For example – in one row all plates were filled with the medium, in another – control samples containing only cells immersed in the medium were taken, and only in subsequent rows – cells in the medium with the addition of a specific concentration of mevastatin were taken. Six different concentrations of mevastatin were selected for the test: 1 μM, 5 μM, 10 μM, 25 μM, 50 μM, and 100 μM. After completing each of the 96-well plates, the samples were incubated at 37 °C. After the addition of mevastatin (24 and 48 h), the XTT test was performed using the BioTek Synergy HTX apparatus. The measurement took about 3 hours. After the completion of the study, the obtained results had to be analyzed using a spreadsheet, resulting in a bar graph showing the effect of mevastatin concentration on the survival of the tested cell type, taking into account the time since the addition of mevastatin.In the manuscript the XTT data only for mevastatin–human colon cancer cell (CaCo-2) samples are presented because it is well known from the literature that statins are not destructive for normal cells, as is the case with most drugs used for cancer treatment.67–72
One can see from Fig. 3 that for each test, cell viability at the selected concentration fluctuated in the range of 80–90%. These results made it possible to conclude that for selected concentrations the effect of mevastatin on cells will be noticeable and the number of cells will still be sufficient to conduct further analysis regarding the study of nanomechanical and biochemical properties. To study the mevastatin dose effect measurements by using 10 and 50 μM were performed. In a further part of the experiments (Raman spectroscopy and imaging and AFM), the effect of mevastatin on human colon cancer cells (CaCo-2) after 24 and 48 hours was also investigated.
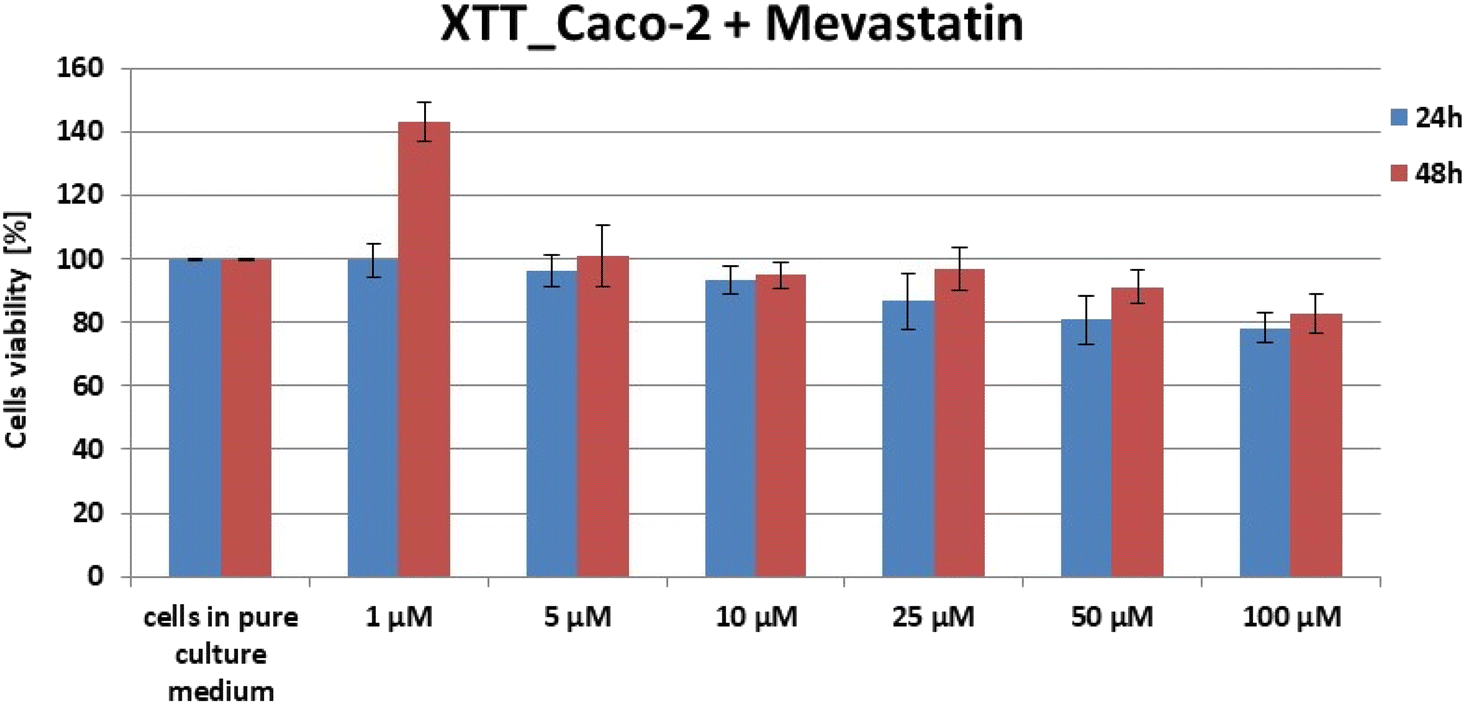 | ||
| Fig. 3 Results of XTT comparison of the percent viability of CaCo-2 human colon cancer cells supplemented with different concentrations of mevastatin in two different time intervals with the standard deviation ± SD. | ||
Results and discussion
One of the main goals of the presented study was to visualize the distribution of cholesterol and other mail block components such as nucleic acids, lipids, hydroxy-acids, and proteins in human normal and cancer colon tissues.To properly address biochemical changes, with the main focus on cholesterol/cholesterol esters in colon cancer tissues and cells compared to normal ones, we systematically investigated how the Raman method responds to ex vivo human tissues and in vitro human colon cells.
Before we formulate general conclusions that may be useful in medical diagnostics, we will provide data for one exemplary patient (marked with the symbol PB in our database), to discuss the most important research observations. We will present typical spectroscopic data: Raman mapping and average spectra based on thousands of spectra recorded in our measurements.
One of the well-established methods of the Raman imaging data investigation is basis analysis (BA) (described in the section Materials and methods). BA is widely used to estimate distribution and concentration of chemical components in analysed samples.73 During the BA analysis each measured spectrum of the 2D spectral array of the human colon sample was compared to the spectra of pure chemical components using least squares to fit each convergence to minimize the fitting error. Based on the BA algorithm we have performed the analysis for cancer and normal human colon tissues taking into account the chemical components that represent the main building blocks of human tissues or chemical components considered as the Raman human colon cancer biomarkers: arachidonic acid (AA), oleic acid (OA), cholesterol (Chol), collagen (Coll), cytidine (CYT), DNA (DNA) and mevalonic acid (MVA).
Based on Raman spectra typical for all mentioned above: fatty acids, sterols, proteins, nucleosides, nucleic acids, and hydroxy-acids, we can infer about the chemical composition of human colon normal and cancer tissues. Fig. 4, panels A–C show the results of BA for normal and cancer human colon ex vivo tissue samples.
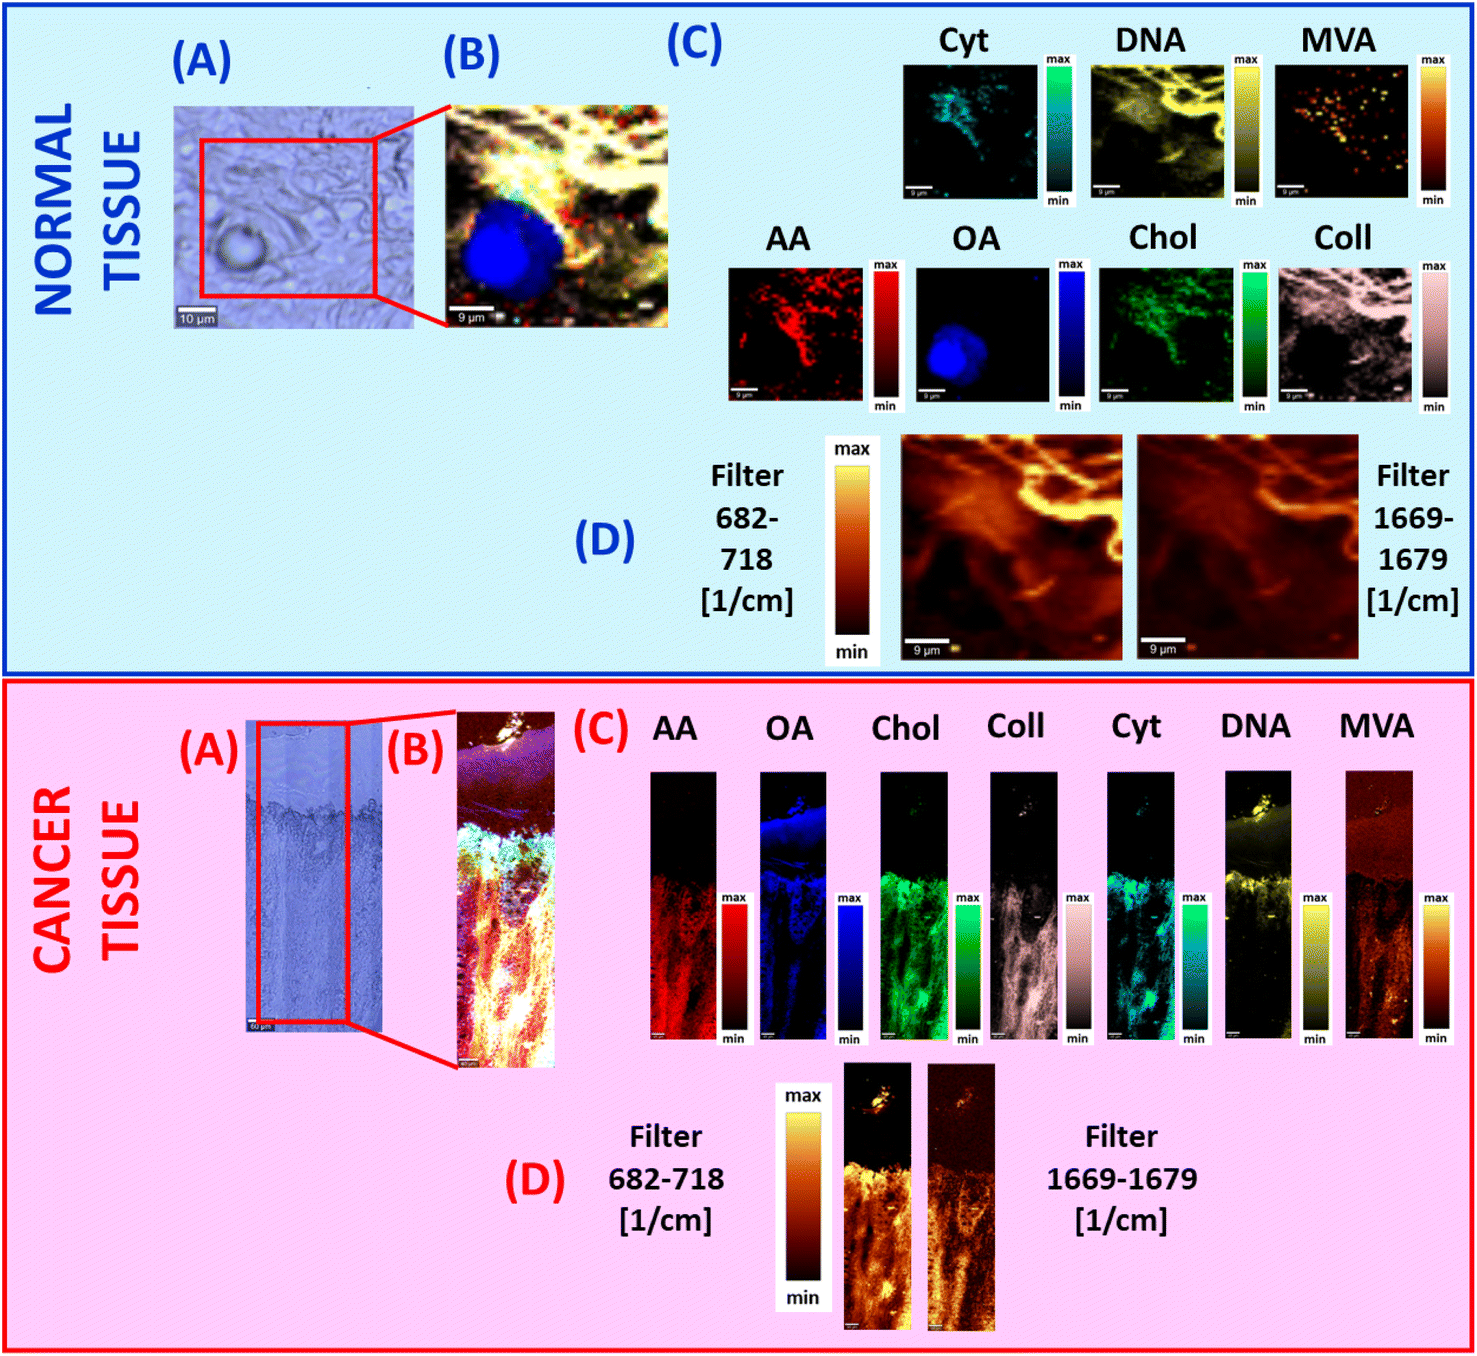 | ||
| Fig. 4 The microscopy image (A), the Raman image constructed by using the BA method (B), distribution of individual chemical components based on BA, and the results for arachidonic acid (AA), oleic acid (OA), cholesterol (Chol), collagen (Coll), cytidine (CYT), DNA (DNA), and mevalonic acid (MVA) (C) and filters: 682–718 cm−1 and 1669–1679 cm−1 (D) for ex vivo normal – upper blue panel and cancer – bottom red panel human colon tissues. The scale bar represents 9 μm. | ||
In detail we decided to choose AA, OA, Chol, Coll, CYT, DNA and MVA for BA because unsaturated fatty acids – UFAs (AA and OA) have been described to exert multiple biochemical functions during cancer evolution and expansion.74–76 Increased expression of lipogenic enzymes, such as acetyl-CoA carboxylase (ACC), fatty acid synthase (FASN), and ATP citrate lyase (ACLY), that promote cholesterol synthesis, represents a nearly universal phenotypic alteration in most tumours.42,77,78 Moreover, recent studies describing the cancer protective effects of UFAs – OA, eicosapentaenoic acid (EPA), and docosahexaenoic acid (DHA) have sparked renewed interest in using unsaturated fatty acids (UFAs) for cancer avoidance and treatment.79–83 However, the significance of omega-6 or omega-3 fatty acids (FAs) in cancer development should be better understood including mechanisms of anticancer actions by influencing cell proliferation, cell survival, angiogenesis, inflammation, metastasis and epigenetic abnormalities that are crucial to the onset and progression of cancer. AA and its metabolites have also recently generated heightened interest due to the growing evidence of their significant role in cancer biology.84,85 Thus, inhibitors of the AA cascade, first and foremost cyclooxygenase (COX) inhibitors, which have originally been of interest in the treatment of inflammatory conditions and certain types of cardiovascular disease, should attract attention as a “weapon” against cancer. Especially interesting is the role of AA in cancer chemoprevention, although the precise molecular mechanisms that link levels of AA and its metabolites with cancer progression have yet to be elucidated. Moreover, in cancer development the role of UFAs should be compared with the role of saturated fatty acid (SFA) influence.86,87
Raman spectra of collagen were used in BA because this compound represents the major component of the tumor microenvironment. Moreover, collagen molecules participate in cancer fibrosis and their biosynthesis can be regulated by cancer cells through mutated genes, transcription factors, signalling pathways and receptors. Furthermore, collagen can influence tumor cell behaviour through integrins, discoidin domain receptors, tyrosine kinase receptors, and some signalling pathways.88
In BA we also used the Raman spectra of cytidine because this molecule can be regarded as an early biomarker of colon cancer.89 Moreover, activation-induced cytidine deaminase (AID) was originally identified as an inducer of somatic hypermutation in the immunoglobulin gene and it was confirmed that the mutagenic activity of AID expression links inflammation to the development of CRC.90
In BA the DNA Raman spectra have been taken into account because DNA represents one of the most important chemical components of human cells and tissues and stool DNA tests are a non-invasive test for colon cancer screening. Moreover, stool DNA testing is intended to screen not only for CRC but also for precancerous polyps in people with no disease symptoms.91–93
Raman spectra of mevalonic acid were used in BA because MVA is a target molecule for the pleiotropic effect of statins, which blocks the MVA pathway. The MVA pathway plays a key role in the biosynthesis of cholesterol and other steroid compounds in the human body including vitamin D. It has been proven that disturbances in the MVA pathway should be considered one of the factors responsible for elevated cholesterol levels in cancer cells, as well as favouring the proliferation of cancer.94
One can see from Fig. 4 that cholesterol, cytidine, mevalonic acid, and arachidonic acid play predominant roles in the human colon cancer tissue composition in contrast to the normal one. Moreover, Fig. 4C proves that cholesterol content is higher for pathologically changed structures compared to the normal one because the area marked in green for cancer tissue is larger and the intensity of the colour is higher. This observation was also confirmed based on analysis of filters in the spectral ranges 682–718 cm−1 and 1669–1679 cm−1 (the spectral range of each filter was chosen to be characteristic for cholesterol vibrational modes).
In addition Fig. 4 shows that there is a perfect match between the morphological features of human colon tissue samples observed on microscopic images, Raman images and Raman filters. However, it must be stressed that Raman imaging (results obtained by using BA or Raman filters) provides additional and unique information, which is not available from histology or microscopy analysis; this is biochemical information. Moreover, by using Raman imaging the spatial distribution of chemical compounds can also be analyzed.
Fig. 5 shows the Raman spectra of individual components chosen for BA of human normal and cancer colon tissues. Moreover, panel (A) shows the explanation for why, to track the cholesterol content in human colon samples, we chose filters in the range 682–718 and 1669–1679 cm−1. One can see from Fig. 5 that for the range 682–718 cm−1 cholesterol contrary to the other components used in BA shows a single vibrational band. For the range 1669–1679 cm−1 the situation is more complex because vibrational peaks in this spectral range are recorded not only for cholesterol but also for OA, AA, and Coll. Despite the overlap of bands from the several compounds, this range is highly useful for further analysis because the bands are definitely more intense than those in the range 682–718 cm−1. Panel (B) shows the Raman spectrum of cholesterol with a short description of the main vibrational bands in relation to the cholesterol molecular structure.
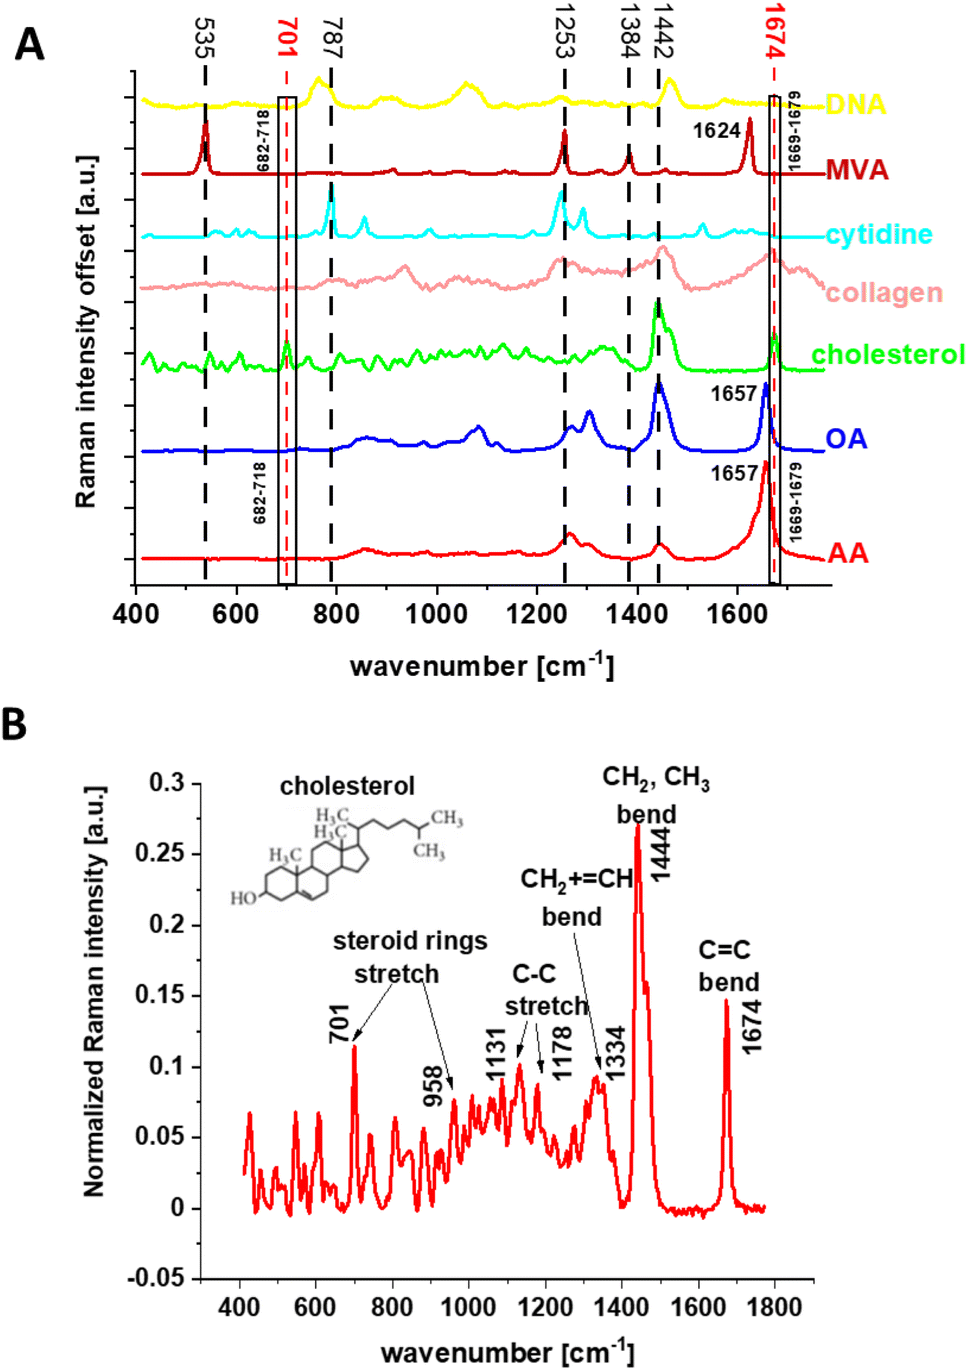 | ||
| Fig. 5 The Raman spectra of individual chemical components used in BA: arachidonic acid (AA), oleic acid (OA), cholesterol (Chol), collagen (Coll), cytidine (CYT), DNA (DNA), and mevalonic acid (MVA) with the indication of the spectral range of the filters used in the Raman imaging analysis (A), and the Raman spectrum of cholesterol with the assignment of the main bands to functional groups (B). | ||
The biochemical composition of human normal and cancer tissues has been compared in our study by using chemometric methods. Principal component analysis (PCA) was used to find the main differences between normal and pathologically changed samples. Fig. 6 shows the result of PCA.
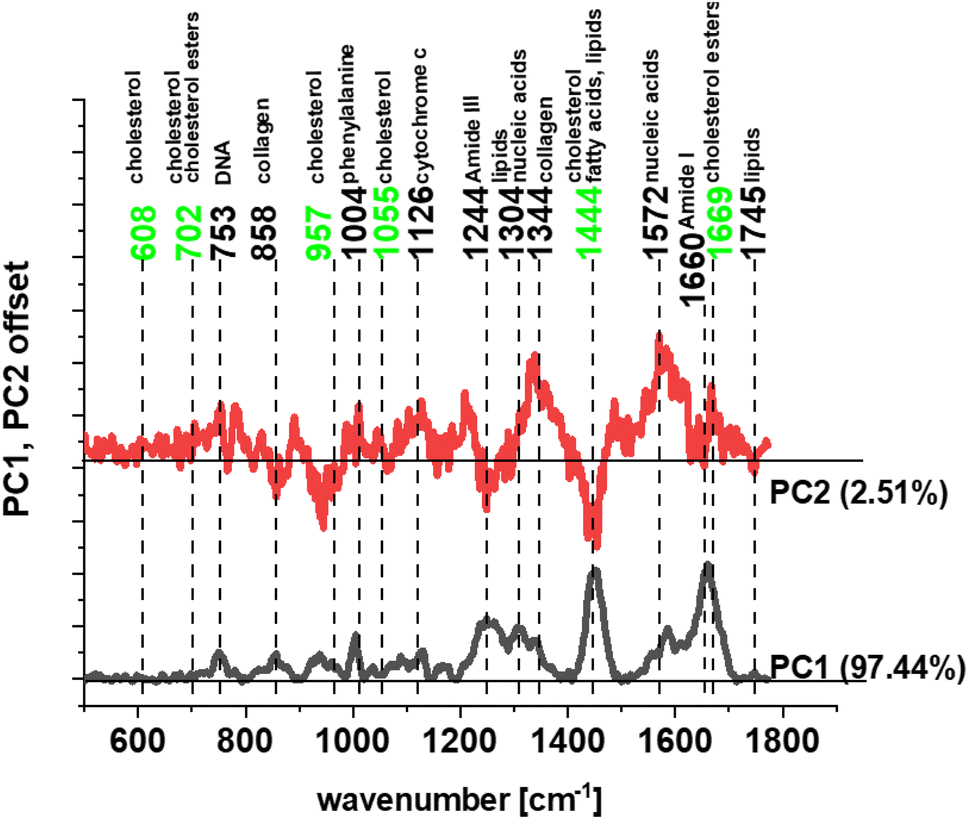 | ||
| Fig. 6 Loadings plot – PCA for human normal and cancer colon tissues (legend: PC1 – principal component no. 1 and PC2 – principal component no. 2). | ||
One can see from Fig. 6 that significant differences between human normal and cancer colon tissues can be found for frequencies typical for cholesterol/cholesterol esters (marked in green), other lipids, proteins and nucleic acids (marked in black). The higher content of cholesterol in cancer tissues can be explained by lipid metabolism changes in CRC that lead to dysregulated homeostasis and are directly associated not only with multifold cancer features but also with promoting inflammation, genome instability, mutation, and cell ageing.95
The second goal of our study was to determine the statistically significant differences between human normal and cancer colon cells including cancer cells supplemented by one of the statin group – mevastatin. Therefore to properly address this task we investigated how the Raman imaging and Raman spectroscopy methods respond to in vitro human normal and cancer cells without and upon mevastatin supplementation.
Statins belong to a group of compounds of biological importance with the activity of 3-hydroxy-3-methyl-glutaryl-CoA reductase inhibitors, an enzyme catalyzing the reduction of HMG-CoA to MVA.94 The pleiotropic effect of statins is due to blockage of the MVA pathway crucial for biosynthesis of cholesterol and other steroid compounds. This blocking of the production of steroid compounds with statins may be an important element of oncological therapy based on the inhibition of progressive tumor growth, and cholesterol is not the only target of their action. The inhibitory effect on the synthesis of isoprenoid compounds formed in the side branches of the MVA pathway may play an important role in the statin anti-cancer properties. These substances include dolichol, ubiquinone, isopentenes-loadenosine, geranylgeranyl pyrophosphate or farnesyl pyrophosphate.94,96–99
At the beginning we present the Ramana data for human colon cells: normal and cancer without mevastatin supplementation. Fig. 7 shows the microscopy image, Raman image, Raman images of all cell substructures identifed by using the CA algorithm (described in the Materials and methods section), average Raman spectra typical for identified lipid rich structures, mitochondria, nucleus, cytoplasm, cell membrane, the average Raman spectra for the cell as a whole and loadings plot based on PCA for human normal CCD18-Co and human cancer CaCo-2 colon cells.
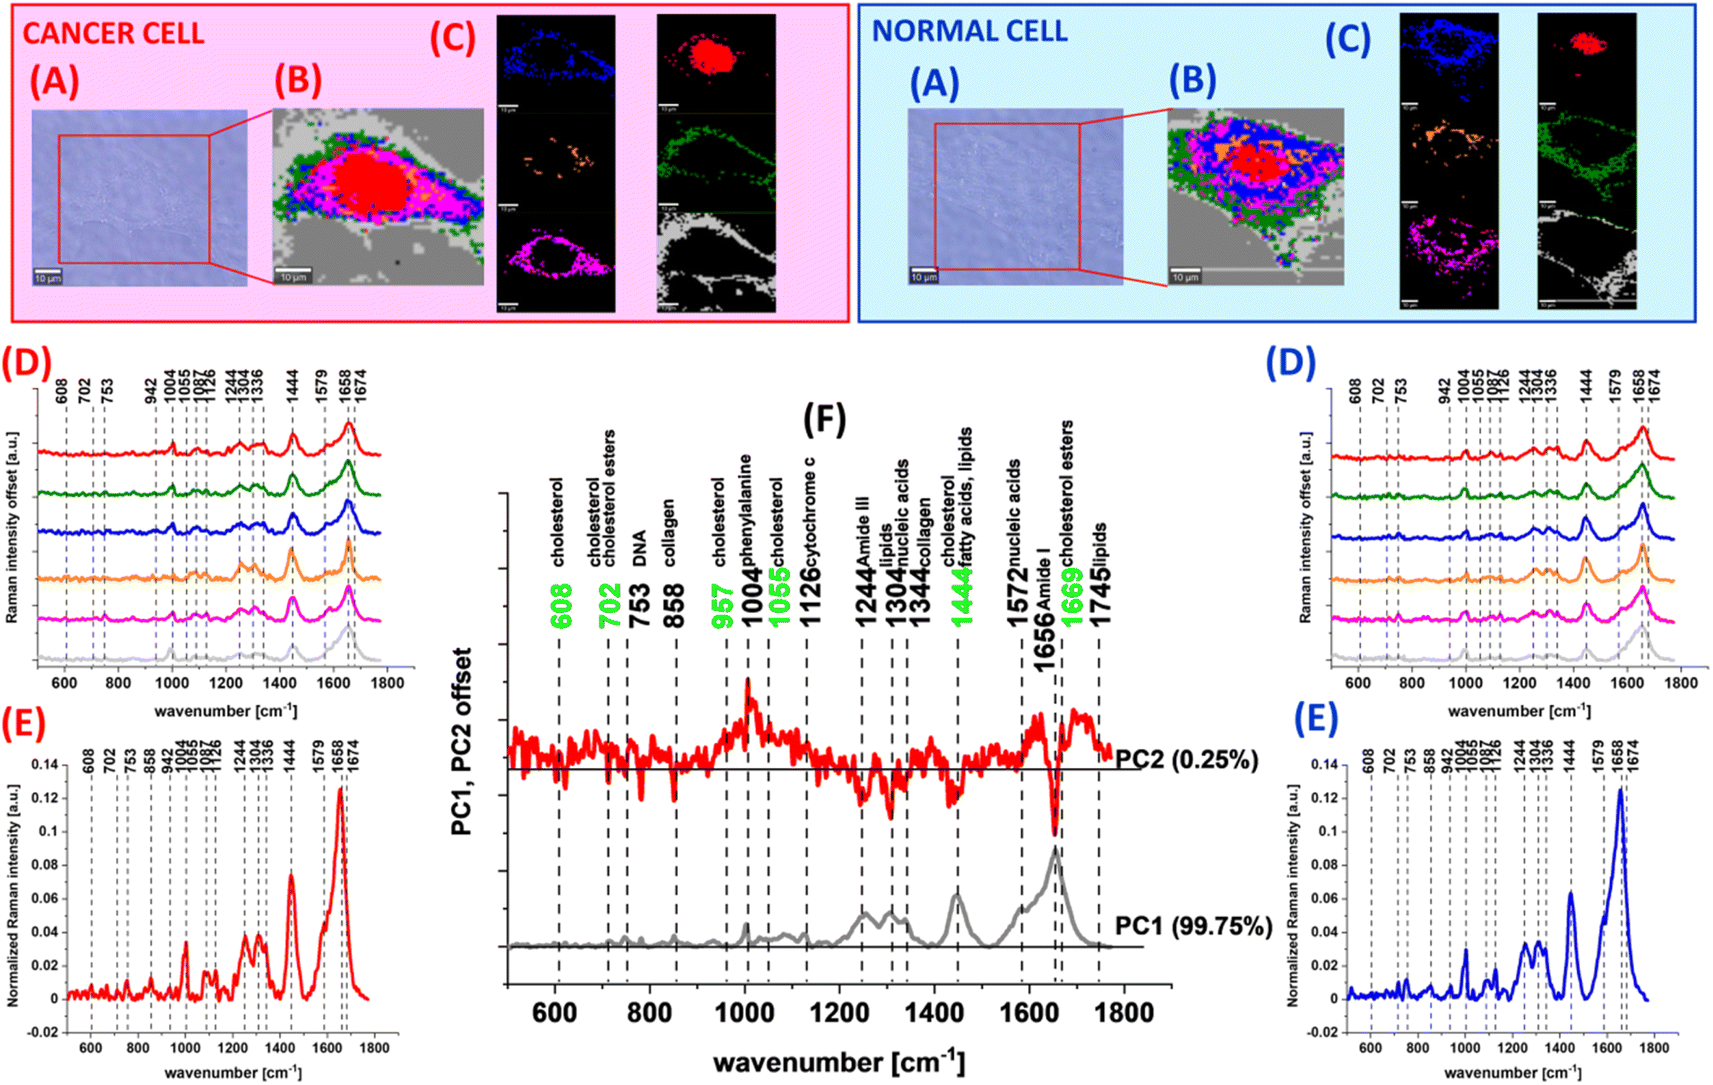 | ||
| Fig. 7 The microscopy image (A), Raman images constructed based on the cluster analysis (CA) method (B), Raman images of all clusters identified by CA assigned to: lipid-rich regions (blue and orange), mitochondria (magenta), nucleus (red), cytoplasm (green), and cell membrane (light grey) (C), the average Raman spectra typical for all identified clusters for low frequency regions (D), the average Raman spectrum for the cell as a whole (E), and loadings plot – PCA (F) for human normal CCD18-Co and human cancer CaCo-2 colon cells. All cells were measured in PBS, and colors of the spectra correspond to the colors of clusters. The scale bar represents 10 μm. | ||
One can see from Fig. 7 that based on the Raman spectra for each measurement the main biochemical components of single human colon cells can be identified. The fingerprint region of Raman spectra provides complex information on the biochemical composition of the analyzed sample e.g. the peaks at 608 and 702 cm−1 correspond to cholesterol/cholesterol esters, the band at 753 cm−1 is associated with nucleic acids and nucleoproteins,100 the peak ca. 858 cm−1 can be assigned to collagen,100,101 the peak at 957 cm−1 confirms the appearance of cholesterol, the band at 1004 cm−1 corresponds to phenylalanine,102–107 the peak at 1055 cm−1 once again confirms the cholesterol occurrence, the band at 1126 cm−1 is typical for saturated fatty acids and cytochrome c, the bands at 1304 and 1344 cm−1 correspond to lipids, nucleic acids and collagen respectively,102–107 the band at 1444 cm−1 is typical for cholesterol, lipids and fatty acids, and the peak at 1572 cm−1 correlates with nucleic acid contents. In the Raman spectra the peaks typical for proteins can also be observed in the form of amide I (C![[double bond, length as m-dash]](https://www.rsc.org/images/entities/char_e001.gif) O stretch) near 1660 cm−1, amide II (N–H bend + C–N stretch) near 1557 cm−1, and very weak amide III (C–N stretch + N–H bend) near 1260 cm−1 bands.102–107
O stretch) near 1660 cm−1, amide II (N–H bend + C–N stretch) near 1557 cm−1, and very weak amide III (C–N stretch + N–H bend) near 1260 cm−1 bands.102–107
Based on the Raman data obtained for normal and cancer human colon cells we could compare the vibrational futures of human colon single cells using the chemometric methods. Fig. 7F shows the PCA results obtained for CCD18-Co and CaCo-2 colon cells. One can see from Fig. 7D that bands differentiating human normal and cancer colon cells are typical for DNA, proteins and lipids (marked in black) with a significant contribution from cholesterol/cholesterol derivatives (marked in green).
A comparison of spectroscopic features was also made for human normal colon cells and human cancer colon cells – CaCo-2 upon mevastatin supplementation (for dose and time dependent experiments). Fig. 8 shows the microscopic images and Raman images of cells supplemented by mevastatin at concentrations of 10 and 50 μM and for 24 and 48 h.
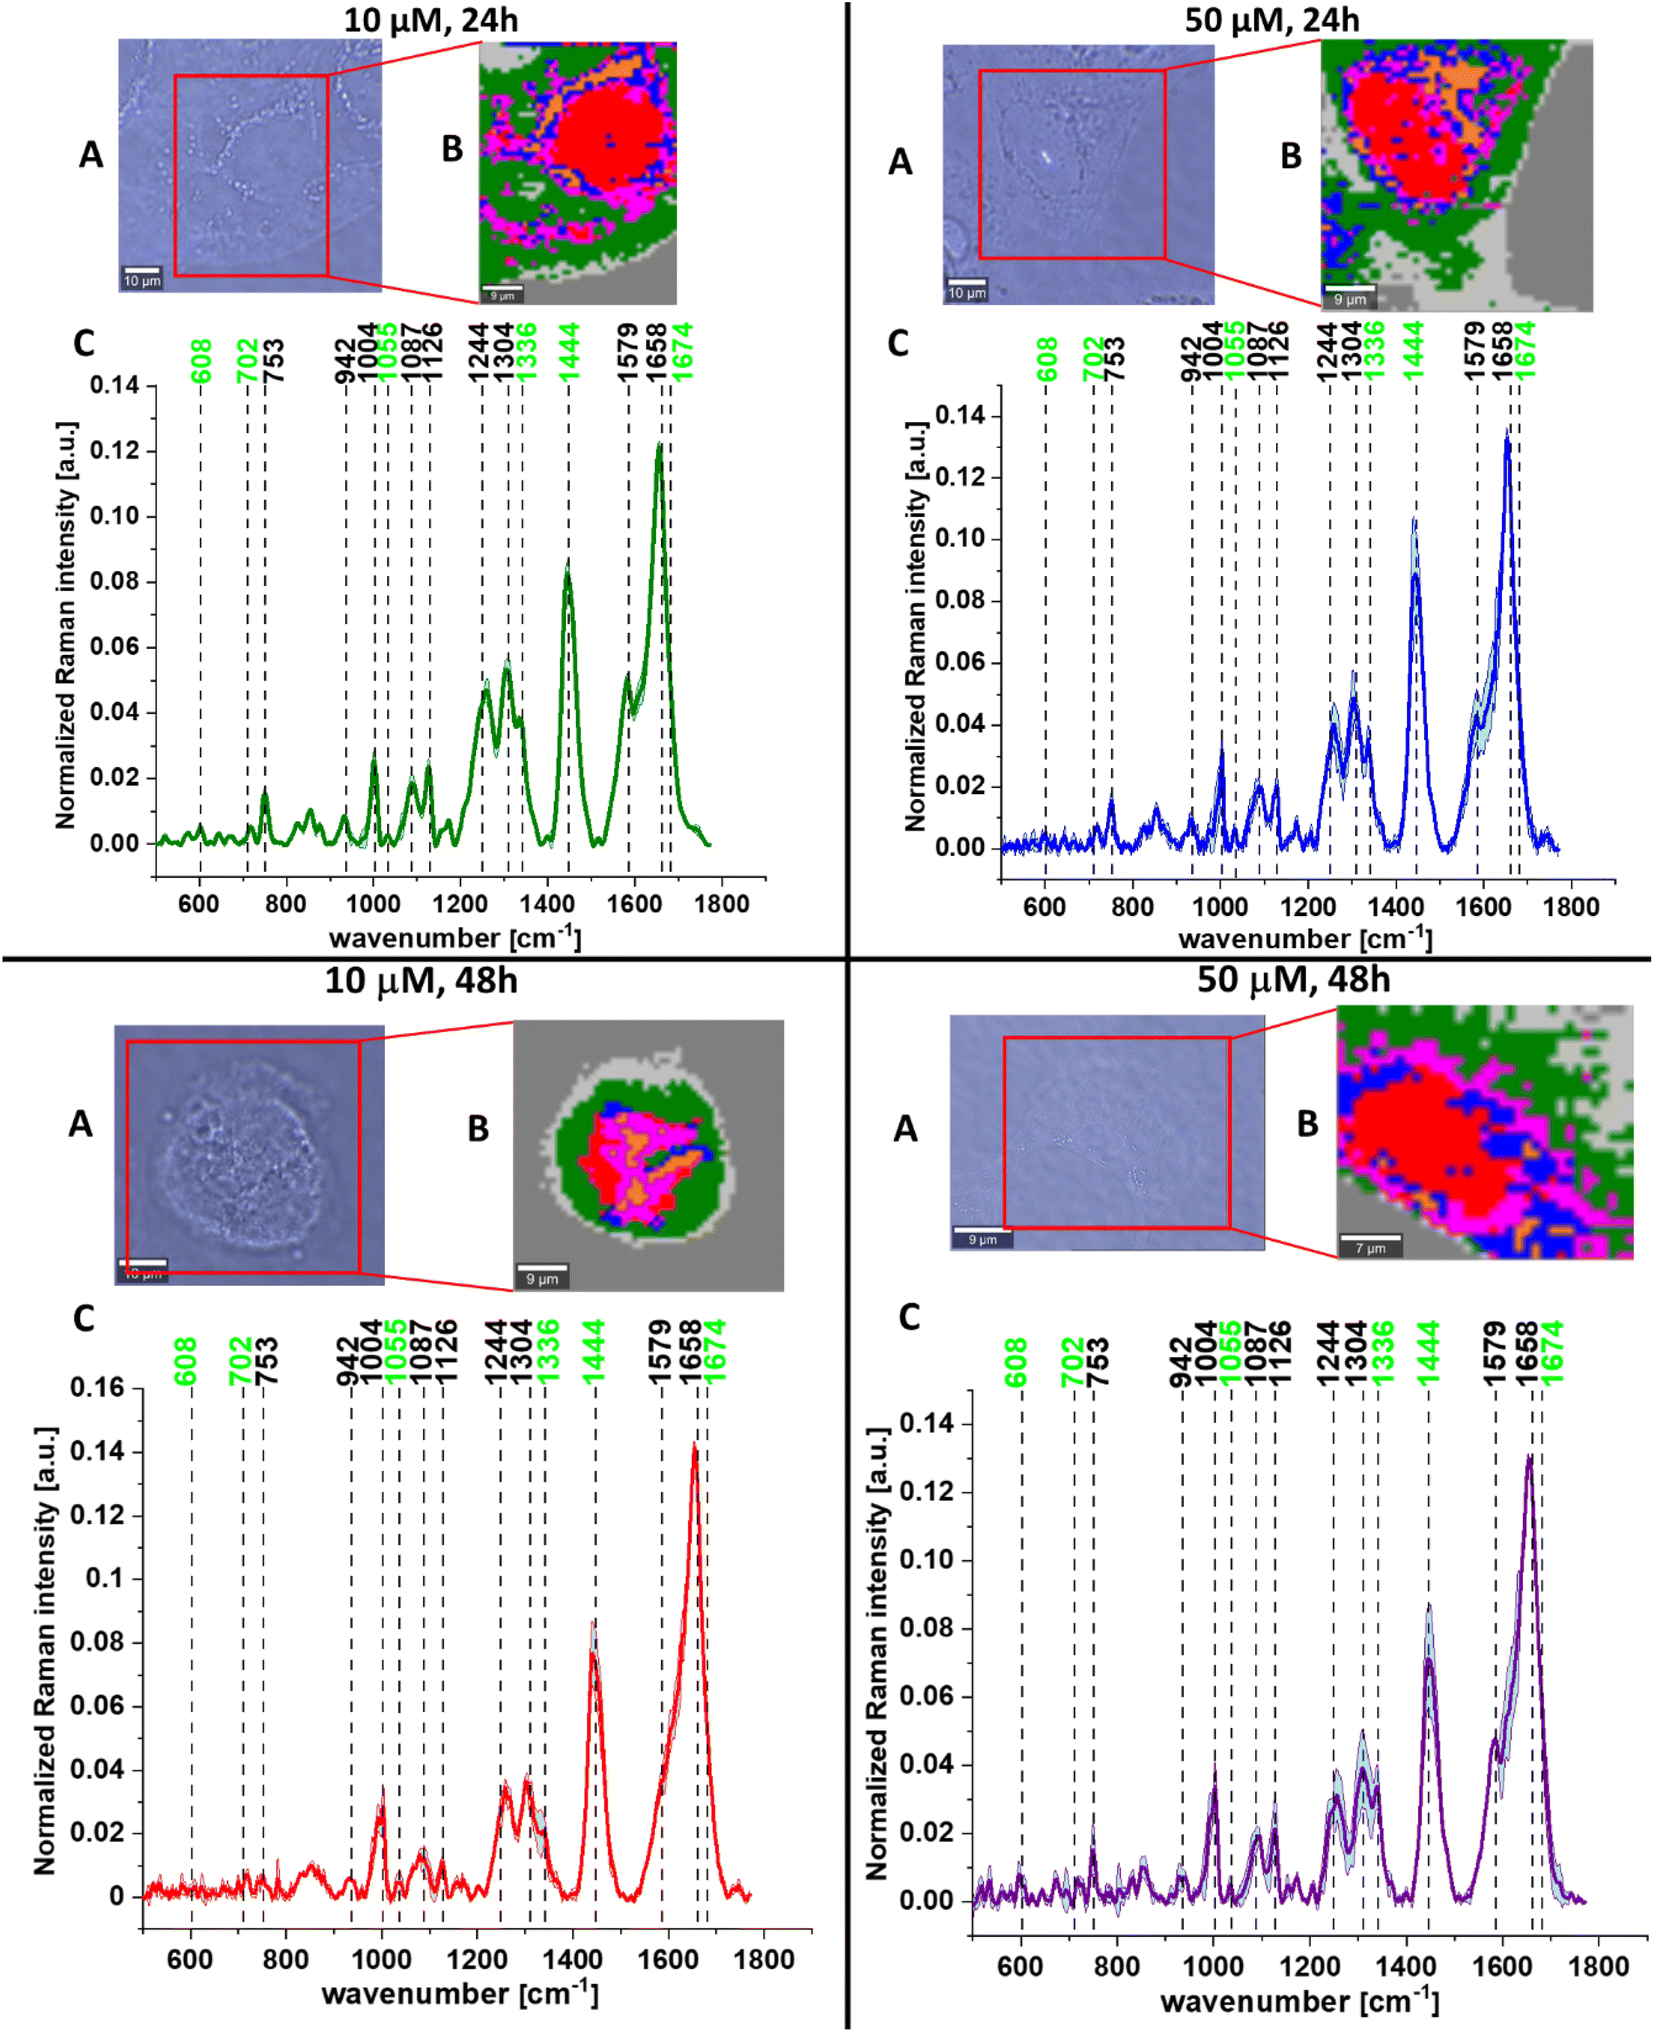 | ||
| Fig. 8 The microscopy image (A), Raman images constructed based on the cluster analysis (CA) method (B), and the average Raman spectra for cells as a whole (C) for human cancer colon cells CaCo-2 upon mevastatin supplementation for: 24 h and 10 μM (left upper panel, dark gren), 24 h and 50 μM (right upper panel, blue), 48 h and 10 μM (left bottom panel, red), and 48 h and 50 μM (right bottom panel, violet). All cells were measured in PBS, and all Raman vibrations typical for cholesterol/cholesterol esters are marked in light green. The scale bar represents 10 μm. | ||
To find valuable differences between human normal colon cells CCD18-Co and cancer cells upon mevastatin supplementation we have performed pairwise PCA and PLSDA. Fig. 9 shows the loadings plots – PC (A) and LV (B) for human normal CCD18-Co and human cancer CaCo-2 colon cells upon mevastatin supplementation for incubation times 24 and 48 h and a statin concentration of 10 and 50 μM respectively.
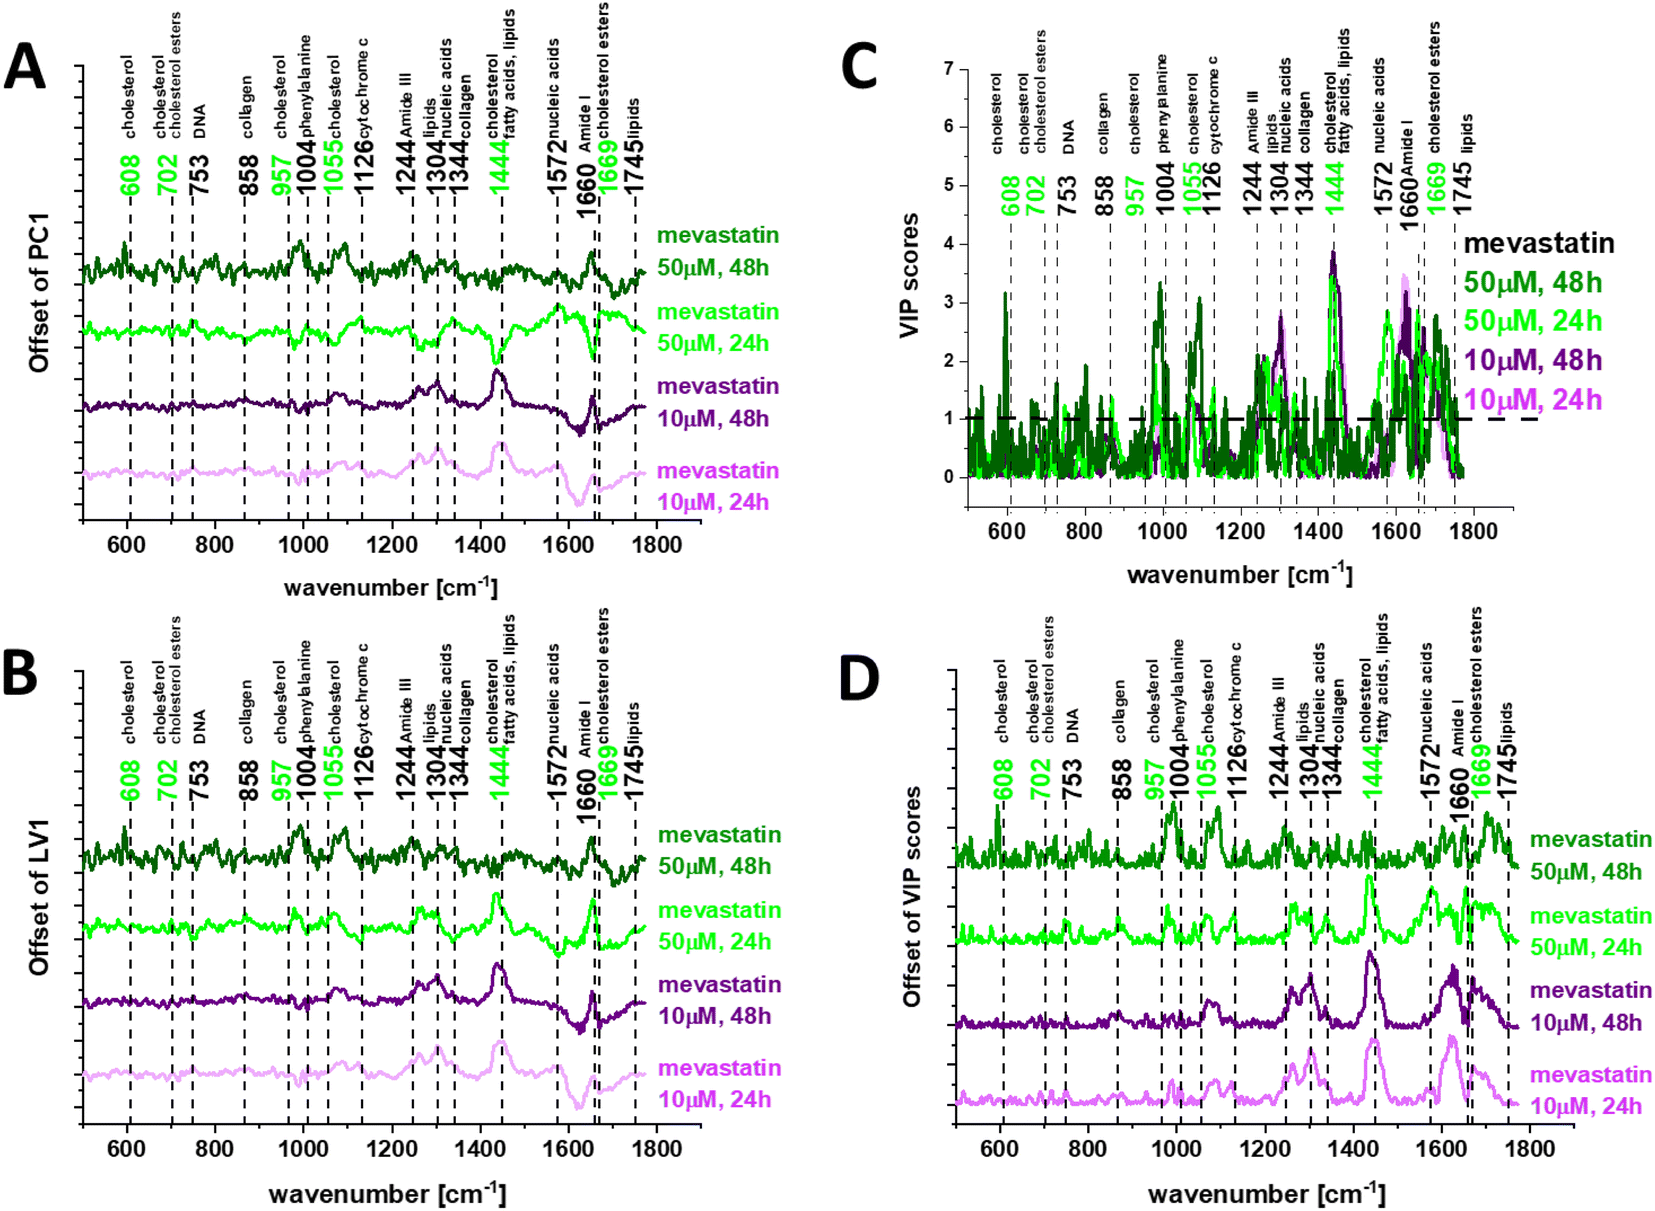 | ||
| Fig. 9 Loadings plots for PCA (A) and PLSDA (B) for human normal CCD18-Co and human cancer CaCo-2 colon cells upon mevastatin supplementation for incubation times 24 and 48 h and statin concentrations of 10 and 50 μM, and variable importance in projection (VIP) scores for the PLS-DA model based on Raman data for colon cell lines: normal and cancer supplemented with mevastatin at concentrations 10 and 50 μM and incubation times 24 and 48 h. (C) VIP scores in offset for direct comparison in (D). | ||
Chemometric analysis once again confirmed that the most significant differences between human normal colon cells and human cancer colon cells upon mevastatin supplementation correspond to DNA, proteins and lipids with a special emphasis on cholesterol/cholesterol derivatives. One can see from Fig. 9 that for longer time – 48 h and higher statin dose – 50 μM the differences between analyzed samples became smaller than for shorter incubation time – 24 h and a lower concentration – 10 μM where the same dose and time effects were noticed.
To test the Raman spectra classification potential for the investigated human colon cells: normal and cancer supplemented by mevastatin in different concentrations and for different incubation times we performed partial least squares discriminant analysis – PLSDA including variable importance in projection (VIP) scores – Fig. 9C and D. VIP greater than 1 helps identify the spectral features that are most important in cell differentiation.
The Raman bands that were most discriminatory in our study are highlighted in bold in Fig. 9C and D and can be observed at: 608, 753, 1004, 1055, 1244, 1304, 1444, 1572, 1660, and 1669 cm−1. The same discrimination between human normal colon cells and human cancer colon cells upon statin supplementation can be based on Raman bands typical for DNA, proteins and lipids including cholesterol/cholesterol esters.
The VIP scores presented in Fig. 9 show very well the effects of time and dose in the presented study. The strongest statin effect was observed for a concentration of 50 μM and an incubation time of 48 h (as the concentration of mevastatin added to the cancer cells increased, the Raman spectrum got closer and closer to the spectrum typical for normal cells, and differentiating peak intensities decreased).
Thanks to the PLSDA we also estimated the potential of Raman spectroscopy to differentiate all types of analyzed human colon cells (normal, cancer and cancer upon mevastatin supplementation). We calculated ROC curves (receiver operating characteristic curves) presented on Fig. S1 (see the ESI†).
Table 2 shows the results of PLSDA.
| CCD18-Co (normal cells) | CaCo-2 (cancer cells) + mevastatin 50 μM, 48 h | CaCo-2 (cancer cells) | |
|---|---|---|---|
| Sensitivity (C) | 1.000 | 0.830 | 1.000 |
| Specificity (C) | 0.667 | 0.667 | 0.917 |
| Sensitivity (CV) | 1.000 | 0.500 | 0.660 |
| Specificity (CV) | 0.670 | 0.670 | 0.670 |
To confirm the effect of mevastatin dose and incubation time we have also calculated the Pearson correlation coefficients for the analyzed samples. As the Pearson coefficient represents the ratio between the covariance of two variables and the product of their standard deviations, it is essentially a normalized measurement of the covariance. Table 3 shows the results of statistical analysis.
| Average Raman spectrum of | Average Raman spectrum of CCD18-Co cells | |
|---|---|---|
| Pearson correlation coefficient | p-Value | |
| CaCo-2 + mevastatin 10 μM, 24 h | 0.95946 | <0.05 |
| CaCo-2 + mevastatin 10 μM, 48 h | 0.95978 | <0.05 |
| CaCo-2 + mevastatin 50 μM, 24 h | 0.98034 | <0.05 |
| CaCo-2 + mevastatin 50 μM, 48 h | 0.98816 | <0.05 |
Raman imaging measurements regarding the mevastatin effect were combined with fluorescence microscopy studies. Fig. 10 presents fluorescence images of Caco-2 cells without and upon mevastatin supplementation and a diagram showing the area of lipid structures per one cell on average (the number of nuclei and the size of lipids area were quantified using ImageJ software).
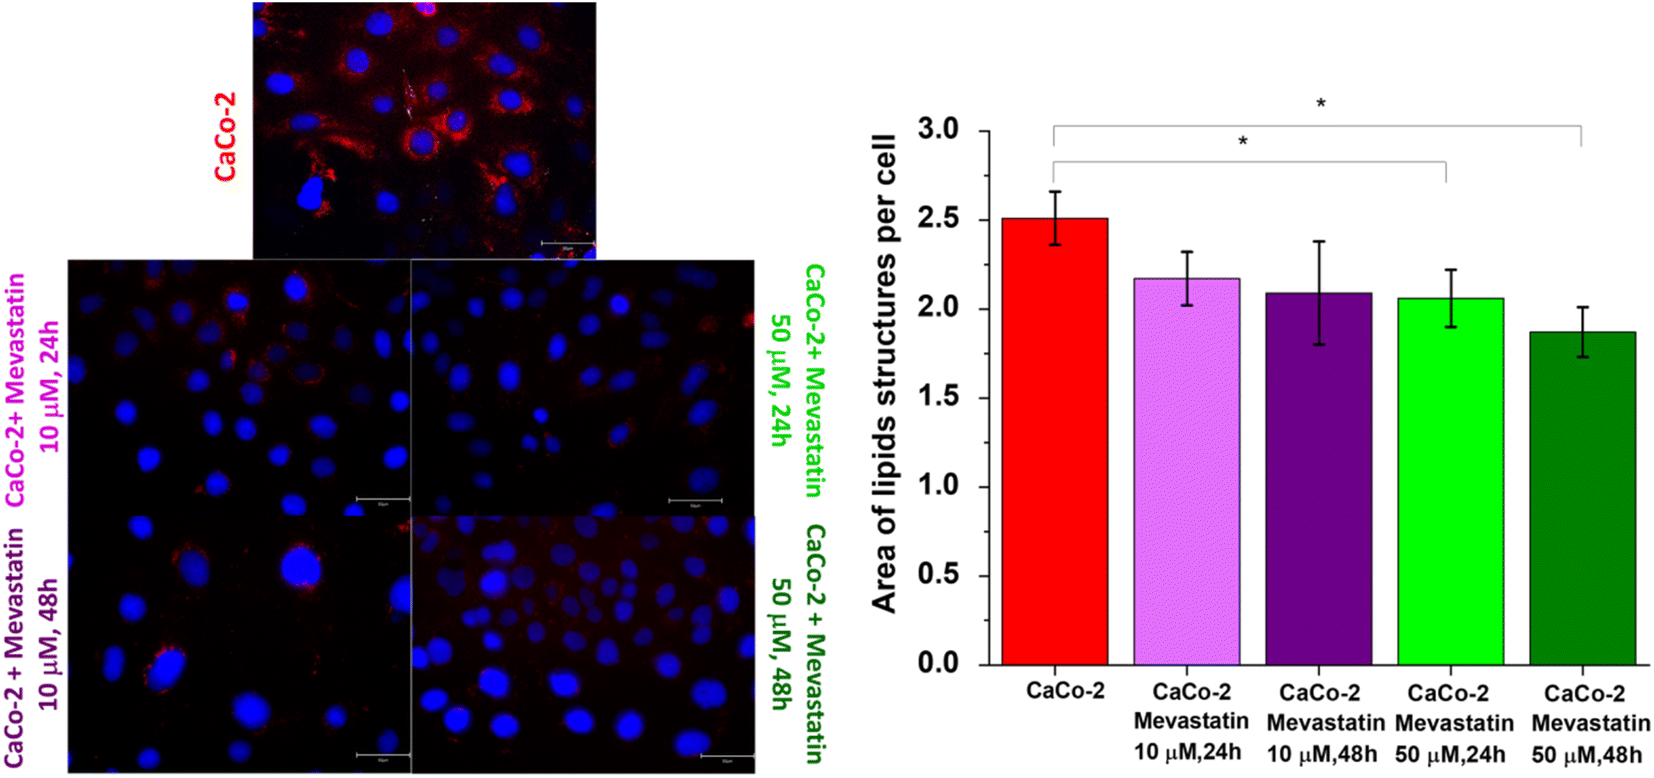 | ||
| Fig. 10 Fluorescence images of Caco-2 cells without and upon mevastatin supplementation and a diagram showing the area of lipid structures per one cell on average (the size of lipid areas was quantified using ImageJ software, number of series: 4). The scale bar represents 50 μm. | ||
One can see from the diagram presented in Fig. 10 that mevastatin effectively reduces the lipid content in human colon cells (less red color on the images upon mevastatin supplementation compared to the unsupplemented CaCo-2- cells).
Biochemistry studies were also extended with analysis of nanomechanical properties of human colon cells: normal, cancer and cancer upon mevastatin supplementation.
The determination of nanomechanical properties of cells as an indicator of cancer changes has become possible with the development of nanoresolution measurement techniques such as atomic force microscopy (AFM). The nanoscopic character of AFM is the most important advantage of this technique allowing the quantification of very local alterations corresponding to cancer progression.
Fig. 11A shows the principles of the AFM technique. Generally, results obtained from AFM measurements show that individual cancer cells are characterized by a lower Young's modulus (YM) allowing high deformability. Despite that the measured YM values depend on many factors such as the type of substrate used for cell growth, force loading rate or indentation depth the results prove that AFM is a suitable tool for altered cell recognition based on nanomechanical properties.108,109Fig. 11B presents the data obtained during AFM measurements: topography maps and force–distance curves related to the topography measurements for forward and backward traces (for randomly chosen points of cells) for human colon cells. The AFM measurements results for CaCo-2 and CaCo-2 upon mevastatin supplementation: 10 μM, 24 h, 10 μM, 48 h, 50 μM, 24 h, and 50 μM, 48 h are presented in Fig. S2A–E (see the ESI†).
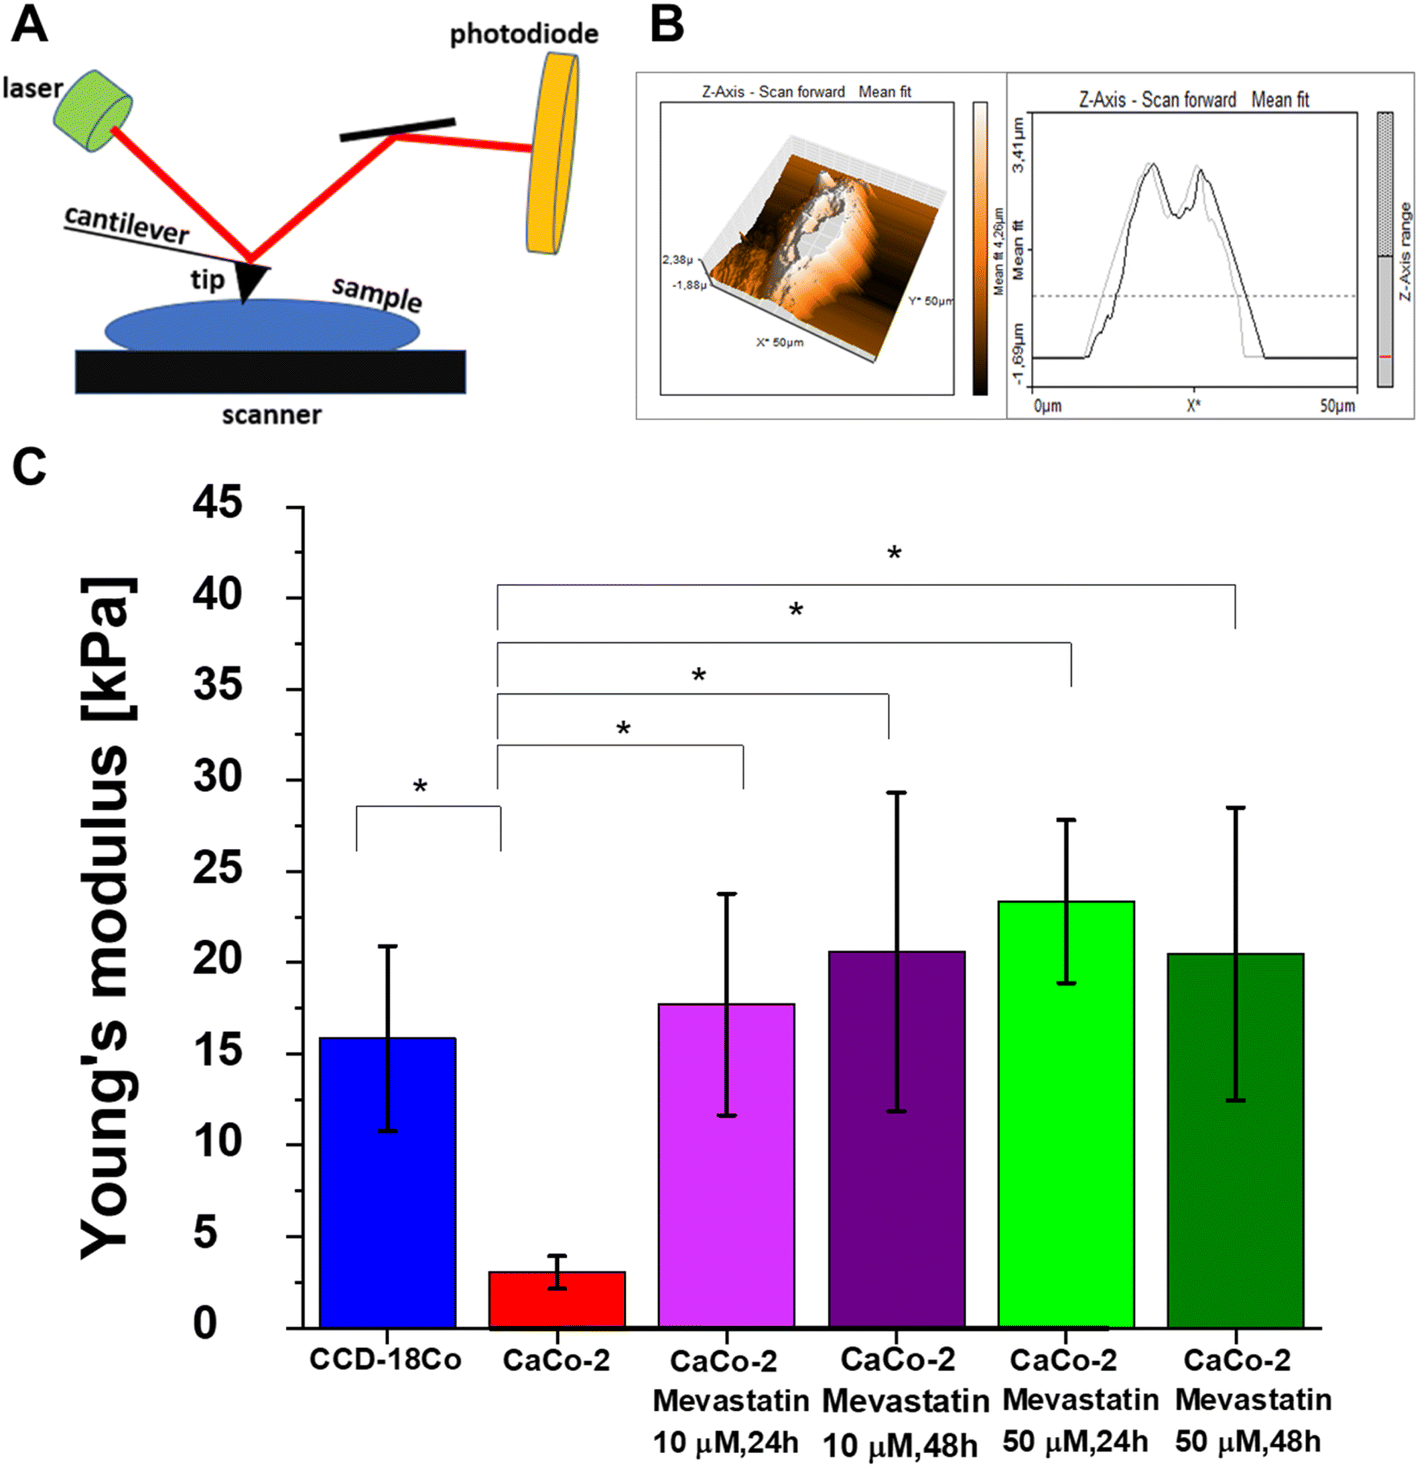 | ||
| Fig. 11 Principles of AFM (A), an AFM 3D topography map of CCD18-Co (B), and Young's modulus values calculated for CCD18-Co (blue); CaCo-2 (red); CaCo-2 supplemented with mevastatin: 10 μM, 24 h (light purple), 10 μM, 48 h (dark purple), 50 μM, 24 h (lime), and 50 μM, 48 h (dark green). Young's modulus values were calculated for the cells as a whole (C). | ||
Based on force–distance curves recorded by using the AFM technique we calculated YM for all analyzed types of samples, Fig. 11C shows the obtained results. One can see from Fig. 11C that in accordance with the literature data the human colon cancer cells are characterized by a lower YM compared to the normal cells. This observation once again confirms the ability of cancer cells to metastasize. Moreover, mevastatin supplementation influences the nanomechanical properties of human cancer colon CaCo-2 cells, which confirms the changes in biochemical composition and skeleton organization of the analyzed cells. Based on the force–distance curve analysis we calculated the cancer nanomarker in the form of YM obtaining the following values: 3.04 ± 0.98 kPa and 15.84 ± 5.06 kPa for human normal and cancer colon cells respectively. Upon mevastatin supplementation the time and dose effects were observed and a significant increase in YM minimum to 17,71 ± 6.07 kPa for a concentration of 10 μM and an incubation time of 24 h was noticed.
Conclusions
Based on Raman spectroscopy and imaging study we have proved that human colon normal and cancer tissues are characterized by significantly different contents of cholesterol. The BA and CA algorithms independently confirmed the higher content of cholesterol in human colon cancer tissues and in single human colon cancer cells. These observations are in agreement with literature results based on other analytical techniques.The chemometric analysis in the form of PCA and PLSDA also confirmed the significant role of cholesterol/cholesterol esters in differentiation of human colon normal and cancer tissues and human colon cells: normal, cancer and cancer upon mevastatin supplementation.
For mevastatin supplementation of CaCo-2 human cancer colon cells dose and incubation time effects were observed both for biochemical composition and nanomechanical properties.
The Raman imaging, fluorescence and AFM studies confirm that mevastatin is a substance with cholesterol lowering properties and can be successfully used in the treatment of hypercholesterolemia and cancer. For longer time and a higher statin dose the differences between the analyzed samples became smaller than for shorter incubation times and lower concentrations. A statin dose with an intracellular concentration of 50 μM during 48 h cell incubation showed the maximum therapeutic effects.
This paper is another voice in the discussion about the possibilities of the usefulness of the nanomechanical and vibrational properties of tissues and cells in diagnosis of cancer development.
Author contributions
K. Beton-Mysur: investigation, methodology, writing – original draft, manuscript editing; B. Brożek-Płuska: conceptualization, funding acquisition, investigation, methodology, writing – original draft, manuscript editing.Conflicts of interest
The authors declare that they have no known competing financial interests or personal relationships that could have appeared to influence the work reported in this paper.Acknowledgements
This work was supported by the National Science Centre of Poland (Narodowe Centrum Nauki) UMO-2017/25/B/ST4/01788 and by internal Grant no. W3/6D/2022 under the “FU2N - Fund for Upgrading the Skills of Young Scientists” program. This article was completed while the first author was a doctoral candidate in the Interdisciplinary Doctoral School at the Lodz University of Technology, Poland.References
- F. Bray, J. Ferlay, I. Soerjomataram, R. L. Siegel, L. A. Torre and A. Jemal, Global cancer statistics 2018: GLOBOCAN estimates of incidence and mortality worldwide for 36 cancers in 185 countries, Ca-Cancer J. Clin., 2018, 68, 394–424, DOI:10.3322/CAAC.21492.
- J. C. Obuch and D. J. Ahnen, Colorectal Cancer: Genetics is Changing Everything, Gastroenterol. Clin. North Am., 2016, 45, 459–476, DOI:10.1016/J.GTC.2016.04.005.
- X. Yao and Z. Tian, Dyslipidemia and colorectal cancer risk: a meta-analysis of prospective studies, Cancer Causes Control, 2015, 26, 257–268, DOI:10.1007/S10552-014-0507-Y/FIGURES/3.
- C. M. Kitahara, A. B. De González, N. D. Freedman, R. Huxley, Y. Mok, S. H. Jee and J. M. Samet, Total cholesterol and cancer risk in a large prospective study in Korea, J. Clin. Oncol., 2011, 29, 1592–1598, DOI:10.1200/JCO.2010.31.5200.
- H. Rodriguez-Broadbent, P. J. Law, A. Sud, K. Palin, S. Tuupanen, A. Gylfe, U. A. Hänninen, T. Cajuso, T. Tanskanen, J. Kondelin, E. Kaasinen, A. P. Sarin, S. Ripatti, J. G. Eriksson, H. Rissanen, P. Knekt, E. Pukkala, P. Jousilahti, V. Salomaa, A. Palotie, L. Renkonen-Sinisalo, A. Lepistö, J. Böhm, J. P. Mecklin, N. A. Al-Tassan, C. Palles, L. Martin, E. Barclay, S. M. Farrington, M. N. Timofeeva, B. F. Meyer, S. M. Wakil, H. Campbell, C. G. Smith, S. Idziaszczyk, T. S. Maughan, R. Kaplan, R. Kerr, D. Kerr, M. N. Passarelli, J. C. Figueiredo, D. D. Buchanan, A. K. Win, J. L. Hopper, M. A. Jenkins, N. M. Lindor, P. A. Newcomb, S. Gallinger, D. Conti, F. Schumacher, G. Casey, L. A. Aaltonen, J. P. Cheadle, I. P. Tomlinson, M. G. Dunlop and R. S. Houlston, Mendelian randomisation implicates hyperlipidaemia as a risk factor for colorectal cancer, Int. J. Cancer, 2017, 140, 2701–2708, DOI:10.1002/IJC.30709.
- B. C. Wertheim, J. W. Smith, C. Fang, D. S. Alberts, P. Lance and P. A. Thompson, Risk modification of colorectal adenoma by CYP7A1 polymorphisms and the role of bile acid metabolism in carcinogenesis, Cancer Prev. Res., 2012, 5, 197, DOI:10.1158/1940-6207.CAPR-11-0320.
- S. Tabata, G. Yin, S. Ogawa, K. Yamaguchi, M. Mineshita and S. Kono, Genetic polymorphism of cholesterol 7α-hydroxylase (CYP7A1) and colorectal adenomas: Self Defense Forces Health Study, Cancer Sci., 2006, 97, 406–410, DOI:10.1111/J.1349-7006.2006.00182.X.
- K. Matsuo, H. Ito, S. Hosono, M. Watanabe, T. Kawase, T. Suzuki, T. Hirai, Y. Yatabe, H. Tanaka and K. Tajima, Abstract B116: Association between CYP7A1 loci and the risk of proximal colon cancer in the Japanese, Cancer Prev. Res., 2010, 3, B116, DOI:10.1158/1940-6207.PREV-09-B116.
- Y. Zhu, D. Soroka and S. Sang, Oxyphytosterols as active ingredients in wheat bran suppress human colon cancer cell growth: Identification, chemical synthesis, and biological evaluation, J. Agric. Food Chem., 2015, 63, 2267–2276, DOI:10.1021/JF506361R/ASSET/IMAGES/LARGE/JF-2014-06361R_0007.JPEG.
- F. Biasi, C. Mascia, M. Astegiano, E. Chiarpotto, M. Nano, B. Vizio, G. Leonarduzzi and G. Poli, Pro-oxidant and proapoptotic effects of cholesterol oxidation products on human colonic epithelial cells: a potential mechanism of inflammatory bowel disease progression, Free Radical Biol. Med., 2009, 47, 1731–1741, DOI:10.1016/J.FREERADBIOMED.2009.09.020.
- J. Warns, G. Marwarha, N. Freking and O. Ghribi, 27-hydroxycholesterol decreases cell proliferation in colon cancer cell lines, Biochimie, 2018, 153, 171–180, DOI:10.1016/J.BIOCHI.2018.07.006.
- F. Biasi, E. Chiarpotto, B. Sottero, M. Maina, C. Mascia, T. Guina, P. Gamba, S. Gargiulo, G. Testa, G. Leonarduzzi and G. Poli, Evidence of cell damage induced by major components of a diet-compatible mixture of oxysterols in human colon cancer CaCo-2 cell line, Biochimie, 2013, 95, 632–640, DOI:10.1016/J.BIOCHI.2012.10.011.
- S. Roussi, A. Winter, F. Gosse, D. Werner, X. Zhang, E. Marchioni, P. Geoffroy, M. Miesch and F. Raul, Different apoptotic mechanisms are involved in the antiproliferative effects of 7β-hydroxysitosterol and 7β-hydroxycholesterol in human colon cancer cells, Cell Death Differ., 2005, 12(2), 128–135, DOI:10.1038/sj.cdd.4401530.
- G. Maier, G. Bing, U. Falken, E. Wagner and C. Unger, Antitumor activity and induction of apoptosis by water-soluble derivatives of 7 beta-hydroxycholesterol in human colon carcinoma cell lines, Anticancer Res., 1999,(5B), 4251–4256 CAS.
- C. Mascia, M. Maina, E. Chiarpotto, G. Leonarduzzi, G. Poli and F. Biasi, Proinflammatory effect of cholesterol and its oxidation products on CaCo-2 human enterocyte-like cells: effective protection by epigallocatechin-3-gallate, Free Radical Biol. Med., 2010, 49, 2049–2057, DOI:10.1016/J.FREERADBIOMED.2010.09.033.
- M. Chalubinski, K. Zemanek, W. Skowron, K. Wojdan, P. Gorzelak and M. Broncel, The effect of 7-ketocholesterol and 25-hydroxycholesterol on the integrity of the human aortic endothelial and intestinal epithelial barriers, Inflammation Res., 2013, 62, 1015–1023, DOI:10.1007/S00011-013-0660-X/TABLES/1.
- M. Chalubinski, K. Wojdan, P. Gorzelak, M. Borowiec and M. Broncel, The effect of oxidized cholesterol on barrier functions and IL-10 mRNA expression in human intestinal epithelium co-cultured with dendritic cells in the transwell system, Food Chem. Toxicol., 2014, 69, 289–293, DOI:10.1016/J.FCT.2014.04.005.
- W. H. Lee, C. S. Lee, K. Kwon, Y. S. Kwon, S. W. Kim, T. W. Goo and O. Y. Kwon, 7-Ketocholesterol induces endoplasmic reticulum stress in HT-29 cells, Z. Naturforsch., C: J. Biosci., 2009, 64, 307–310, DOI:10.1515/ZNC-2009-3-425/MACHINEREADABLECITATION/RIS.
- L. Alemany, J. M. Laparra, R. Barberá and A. Alegría, Evaluation of the cytotoxic effect of 7keto-stigmasterol and 7keto-cholesterol in human intestinal (Caco-2) cells, Food Chem. Toxicol., 2012, 50, 3106–3113, DOI:10.1016/J.FCT.2012.06.036.
- A. R. Tanaka, K. Noguchi, H. Fukazawa, Y. Igarashi, H. Arai and Y. Uehara, p38MAPK and Rho-dependent kinase are involved in anoikis induced by anicequol or 25-hydroxycholesterol in DLD-1 colon cancer cells, Biochem. Biophys. Res. Commun., 2013, 430, 1240–1245, DOI:10.1016/J.BBRC.2012.12.067.
- G. Serra, A. Incani, G. Serreli, L. Porru, M. P. Melis, C. I. G. Tuberoso, D. Rossin, F. Biasi and M. Deiana, Olive oil polyphenols reduce oxysterols-induced redox imbalance and pro-inflammatory response in intestinal cells, Redox Biol., 2018, 17, 348–354, DOI:10.1016/J.REDOX.2018.05.006.
- L. L. Vedin, J. A. Gustafsson and K. R. Steffensen, The oxysterol receptors lxrα and lxrβ suppress proliferation in the colon, Mol. Carcinog., 2013, 52, 835–844, DOI:10.1002/MC.21924.
- R. Swan, A. Alnabulsi, B. Cash, A. Alnabulsi, G. I. Murray, R. Swan, A. Alnabulsi, B. Cash, A. Alnabulsi and G. I. Murray, Characterisation of the oxysterol metabolising enzyme pathway in mismatch repair proficient and deficient colorectal cancer, Oncotarget, 2016, 7, 46509–46527, DOI:10.18632/ONCOTARGET.10224.
- N. A. Abdul Aziz, N. M. Mokhtar, R. Harun, M. M. H. Mollah, I. Mohamed Rose, I. Sagap, A. Mohd Tamil, W. Z. Wan Ngah and R. Jamal, A 19-Gene expression signature as a predictor of survival in colorectal cancer, BMC Med. Genomics, 2016, 9, 1–13, DOI:10.1186/S12920-016-0218-1/FIGURES/4.
- S. H. Yun, M. G. Park, Y. M. Kim, M. S. Roh and J. I. Park, Expression of chicken ovalbumin upstream promoter-transcription factor II and liver X receptor as prognostic indicators for human colorectal cancer, Oncol. Lett., 2017, 14, 4011–4020, DOI:10.3892/OL.2017.6659/HTML.
- D. Savic, R. C. Ramaker, B. S. Roberts, E. C. Dean, T. C. Burwell, S. K. Meadows, S. J. Cooper, M. J. Garabedian, J. Gertz and R. M. Myers, Distinct gene regulatory programs define the inhibitory effects of liver X receptors and PPARG on cancer cell proliferation, Genome Med., 2016, 8, 1–16, DOI:10.1186/S13073-016-0328-6/FIGURES/6.
- S. Uno, K. Endo, Y. Jeong, K. Kawana, H. Miyachi, Y. Hashimoto and M. Makishima, Suppression of β-catenin signaling by liver X receptor ligands, Biochem. Pharmacol., 2009, 77, 186–195, DOI:10.1016/J.BCP.2008.10.007.
- A. De Gottardi, F. Touri, C. A. Maurer, A. Perez, O. Maurhofer, G. Ventre, C. L. Bentzen, E. J. Niesor and J. F. Dufour, The Bile Acid Nuclear Receptor FXR and the Bile Acid Binding Protein IBABP Are Differently Expressed in Colon Cancer, Dig. Dis. Sci., 2004, 49(6), 982–989, DOI:10.1023/B:DDAS.0000034558.78747.98.
- S. Modica, S. Murzilli, L. Salvatore, D. R. Schmidt and A. Moschetta, Nuclear Bile Acid Receptor FXR Protects against Intestinal Tumorigenesis, Cancer Res., 2008, 68, 9589–9594, DOI:10.1158/0008-5472.CAN-08-1791.
- R. R. M. Maran, A. Thomas, M. Roth, Z. Sheng, N. Esterly, D. Pinson, X. Gao, Y. Zhang, V. Ganapathy, F. J. Gonzalez and G. L. Guo, Farnesoid X Receptor Deficiency in Mice Leads to Increased Intestinal Epithelial Cell Proliferation and Tumor Development, J. Pharmacol. Exp. Ther., 2009, 328, 469–477, DOI:10.1124/JPET.108.145409.
- F. Yang, Y. Hu, H. X. Liu and Y. J. Y. Wan, MiR-22-silenced cyclin a expression in colon and liver cancer cells is regulated by bile acid receptor, J. Biol. Chem., 2015, 290, 6507–6515, DOI:10.1074/jbc.M114.620369.
- G. Mazzoccoli, A. Panza, M. R. Valvano, O. Palumbo, M. Carella, V. Pazienza, G. Biscaglia, F. Tavano, P. Di Sebastiano, A. Andriulli and A. Piepoli, Clock Gene Expression Levels and Relationship With Clinical and Pathological Features in Colorectal Cancer Patients, Chronobiol Int., 2011, 28(10), 841–851 CrossRef CAS PubMed.
- T. Oshima, S. Takenoshita, M. Akaike, C. Kunisaki, S. Fujii, A. Nozaki, K. Numata, M. Shiozawa, Y. Rino, K. Tanaka, M. Masuda and T. Imada, Expression of circadian genes correlates with liver metastasis and outcomes in colorectal cancer, Oncol. Rep., 2011, 25, 1439–1446, DOI:10.3892/OR.2011.1207/HTML.
- D. Gu, S. Li, S. Ben, M. Du, H. Chu, Z. Zhang, M. Wang, Z. F. Zhang and J. Chen, Circadian clock pathway genes associated with colorectal cancer risk and prognosis, Arch. Toxicol., 2018, 92, 2681–2689, DOI:10.1007/S00204-018-2251-7/FIGURES/2.
- R. Firestein, G. Blander, S. Michan, P. Oberdoerffer, S. Ogino, J. Campbell, A. Bhimavarapu, S. Luikenhuis, R. de Cabo, C. Fuchs, W. C. Hahn, L. P. Guarente and D. A. Sinclair, The SIRT1 Deacetylase Suppresses Intestinal Tumorigenesis and Colon Cancer Growth, PLoS One, 2008, 3, e2020, DOI:10.1371/JOURNAL.PONE.0002020.
- R. E. Olson, Discovery of the Lipoproteins, Their Role in Fat Transport and Their Significance as Risk Factors, J. Nutr., 1998, 128, 439S–443S, DOI:10.1093/JN/128.2.439S.
- M. Craig, S. N. S. Yarrarapu and M. Dimri, Biochemistry, Cholesterol, StatPearls, 2022 Search PubMed.
- A. Kumari, Cholesterol Synthesis, in Sweet Biochem., Academic Press, 2018, pp. 27–31, DOI:10.1016/B978-0-12-814453-4.00007-8.
- E. Herrera and M. A. Lasunción, Maternal-Fetal Transfer of Lipid Metabolites, in Fetal Neonatal Physiol., W.B. Saunders, 2011, pp. 441–454, DOI:10.1016/B978-1-4160-3479-7.10041-2.
- C. Wu, M. Wang and H. Shi, Cholesterol Promotes Colorectal Cancer Growth by Activating the PI3K/AKT Pathway, J. Oncol., 2022, 2022 DOI:10.1155/2022/1515416.
- A. Chimento, I. Casaburi, P. Avena, F. Trotta, A. De Luca, V. Rago, V. Pezzi and R. Sirianni, Cholesterol and Its Metabolites in Tumor Growth: Therapeutic Potential of Statins in Cancer Treatment, Front. Endocrinol., 2019, 9, 807, DOI:10.3389/FENDO.2018.00807.
- R. Lin, R. Tao, X. Gao, T. Li, X. Zhou, K. L. Guan, Y. Xiong and Q. Y. Lei, Acetylation Stabilizes ATP-Citrate Lyase to Promote Lipid Biosynthesis and Tumor Growth, Mol. Cell, 2013, 51, 506–518, DOI:10.1016/J.MOLCEL.2013.07.002.
- X. Qian, J. Hu, J. Zhao and H. Chen, ATP citrate lyase expression is associated with advanced stage and prognosis in gastric adenocarcinoma, Int. J. Clin. Exp. Med., 2015, 8, 7855 Search PubMed.
- J. Wen, X. Min, M. Shen, Q. Hua, Y. Han, L. Zhao, L. Liu, G. Huang, J. Liu and X. Zhao, ACLY facilitates colon cancer cell metastasis by CTNNB1, J. Exp. Clin. Cancer Res., 2019, 38(1), 401, DOI:10.1186/S13046-019-1391-9.
- B. Huang, B. Liang Song and C. Xu, Cholesterol metabolism in cancer: mechanisms and therapeutic opportunities, Nat. Metab., 2020, 2(2), 132–141, DOI:10.1038/s42255-020-0174-0.
- V. N. Ayyagari, X. Wang, P. L. Diaz-Sylvester, K. Groesch and L. Brard, Assessment of acyl-CoA cholesterol acyltransferase (ACAT-1) role in ovarian cancer progression—An in vitro study, PLoS One, 2020, 15, e0228024, DOI:10.1371/JOURNAL.PONE.0228024.
- T. Y. Chang, B. L. Li, C. C. Y. Chang and Y. Urano, Acyl-coenzyme A: cholesterol acyltransferases, Am. J. Physiol.: Endocrinol. Metab., 2009, 297, 1–9, DOI:10.1152/AJPENDO.90926.2008/ASSET/IMAGES/LARGE/ZH10040956070003.JPEG.
- X. Ding, W. Zhang, S. Li and H. Yang, The role of cholesterol metabolism in cancer, Am. J. Cancer Res., 2019, 9, 219 CAS.
- A. Yan, Z. Jia, C. Qiao, M. Wang and X. Ding, Cholesterol metabolism in drug-resistant cancer (Review), Int. J. Oncol., 2020, 57, 1103–1115, DOI:10.3892/IJO.2020.5124.
- R. Mamtani, J. D. Lewis, F. I. Scott, T. Ahmad, D. S. Goldberg, J. Datta, Y. X. Yang and B. Boursi, Disentangling the Association between Statins, Cholesterol, and Colorectal Cancer: A Nested Case-Control Study, PLoS Med., 2016, 13(4) DOI:10.1371/JOURNAL.PMED.1002007.
- S. K. Park, J. S. Joo, D. H. Kim, Y. E. Kim, D. Kang and K. Y. Yoo, Association of serum lipids and glucose with the risk of colorectal adenomatous polyp in men: a case-control study in Korea, J. Korean Med. Sci., 2000, 15, 690–695, DOI:10.3346/JKMS.2000.15.6.690.
- T. Li, Y. Qian, H. Li and J. Deng, Combination of serum lipids and cancer antigens as a novel marker for colon cancer diagnosis, Lipids Health Dis., 2018, 17, 1–7, DOI:10.1186/S12944-018-0911-5/TABLES/3.
- S. A. Törnberg, L.-E. Holm, J. M. Carstensen and G. A. Eklund, Risks of Cancer of the Colon and Rectum in Relation to Serum Cholesterol and Beta-Lipoprotein, N. Engl. J. Med., 2009, 315, 1629–1633, DOI:10.1056/NEJM198612253152601.
- L. Poillet-Perez, G. Despouy, R. Delage-Mourroux and M. Boyer-Guittaut, Interplay between ROS and autophagy in cancer cells, from tumor initiation to cancer therapy, Redox Biol., 2015, 4, 184–192, DOI:10.1016/J.REDOX.2014.12.003.
- T. P. Szatrowski and C. F. Nathan, Production of Large Amounts of Hydrogen Peroxide by Human Tumor Cells, Cancer Res., 1991, 1(3), 794–798 Search PubMed.
- B. Sun, X. Hu, G. Liu, B. Ma, Y. Xu, T. Yang, J. Shi, F. Yang, H. Li, L. Zhang and Y. Zhao, Phosphatase Wip1 negatively regulates neutrophil migration and inflammation, J. Immunol., 2014, 192, 1184–1195, DOI:10.4049/JIMMUNOL.1300656.
- D. M. Van Reyk, A. J. Brown, M. Hult’en, R. T. Dean and W. Jessup, Oxysterols in biological systems: sources, metabolism and pathophysiological relevance, Redox Rep., 2006, 11(6), 255–262, DOI:10.1179/135100006X155003.
- Y. Yoshida, A. Umeno and M. Shichiri, Lipid peroxidation biomarkers for evaluating oxidative stress and assessing antioxidant capacity in vivo, J. Clin. Biochem. Nutr., 2013, 52, 9–16, DOI:10.3164/JCBN.12-112.
- W. Jiang, J. W. Hu, X. R. He, W. L. Jin and X. Y. He, Statins: a repurposed drug to fight cancer, J. Exp. Clin. Cancer Res., 2021, 40, 241, DOI:10.1186/S13046-021-02041-2.
- K. Pahan, Lipid-lowering drugs, Cell. Mol. Life Sci., 2006, 63, 1165, DOI:10.1007/S00018-005-5406-7.
- K. Beton and B. Brożek-Płuska, Biochemistry and Nanomechanical Properties of Human Colon Cells upon Simvastatin, Lovastatin, and Mevastatin Supplementations: Raman Imaging and AFM Studies, J. Phys. Chem. B, 2022, 126, 7088–7103, DOI:10.1021/ACS.JPCB.2C03724/ASSET/IMAGES/LARGE/JP2C03724_0018.JPEG.
- M. E. Mays and C. A. Dujovne, Pleiotropic effects: should statins be considered an essential component in the treatment of dyslipidemia?, Curr. Atheroscler. Rep., 2008, 10, 45–52, DOI:10.1007/S11883-008-0008-0.
- K. Beton, P. Wysocki and B. Brozek-Pluska, Mevastatin in colon cancer by spectroscopic and microscopic methods – Raman imaging and AFM studies, Spectrochim. Acta, Part A, 2022, 270, 120726, DOI:10.1016/J.SAA.2021.120726.
- T. J. Collins, ImageJ for microscopy, Biotechniques, 2018, 43(1), 25–30, DOI:10.2144/000112517.
- ImageJ, https://imagej.nih.gov/ij/images/, accessed June 14, 2020 Search PubMed.
- P. Hermanowicz, M. Sarna, K. Burda and H. Gabryś, AtomicJ: an open source software for analysis of force curves, Rev. Sci. Instrum., 2014, 85(6), 063703, DOI:10.1063/1.4881683.
- W. Jiang, J.-W. Hu, X.-R. He, W.-L. Jin and X.-Y. He, Statins: a repurposed drug to fight cancer, J. Exp. Clin. Cancer Res., 2021, 40(1), 1–33, DOI:10.1186/S13046-021-02041-2.
- A. F. Hassanabad, Current perspectives on statins as potential anti-cancer therapeutics: clinical outcomes and underlying molecular mechanisms, Transl. Lung Cancer Res., 2019, 8, 692, DOI:10.21037/TLCR.2019.09.08.
- M.-F. Demierre, P. D. R. Higgins, S. B. Gruber, E. Hawk and S. M. Lippman, Statins and cancer prevention, Nat. Rev. Cancer, 2005, 5(12), 930–942, DOI:10.1038/nrc1751.
- J. W. Clendening and L. Z. Penn, Targeting tumor cell metabolism with statins, Oncogene, 2012, 31, 4967–4978, DOI:10.1038/ONC.2012.6.
- K. Gauthaman, M. Richards, J. Wong and A. Bongso, Comparative evaluation of the effects of statins on human stem and cancer cells in vitro, Reprod. BioMed. Online, 2007, 15, 566–581, DOI:10.1016/S1472-6483(10)60390-2.
- M. J. Campbell, L. J. Esserman, Y. Zhou, M. Shoemaker, M. Lobo, E. Borman, F. Baehner, A. S. Kumar, K. Adduci, C. Marx, E. F. Petricoin, L. A. Liotta, M. Winters, S. Benz and C. C. Benz, Breast Cancer Growth Prevention by Statins, Cancer Res., 2006, 66, 8707–8714, DOI:10.1158/0008-5472.CAN-05-4061.
- H. Abramczyk, B. Brozek-Pluska and M. Kopeć, Double face of cytochrome c in cancers. New look into human breast ducts with Raman imaging, Sci. Rep., 2022, 2120, DOI:10.1038/s41598-022-04803-0.
- B. Brozek-Pluska, M. Kopec, J. Surmacki and H. Abramczyk, Raman microspectroscopy of noncancerous and cancerous human breast tissues. Identification and phase transitions of linoleic and oleic acids by Raman low-temperature studies, Analyst, 2015, 140, 2134–2143, 10.1039/c4an01877j.
- L. Chen, C.-S. Yang, S.-D. Chen, Q.-X. Zhou, G.-Q. Wang, S.-L. Cai, W.-H. Li and H.-Z. Luo, Multi-omics characterization of the unsaturated fatty acid biosynthesis pathway in colon cancer, Am. J. Cancer Res., 2022, 12, 3985 CAS.
- M. Chen and J. Huang, The expanded role of fatty acid metabolism in cancer: new aspects andtargets, Precis. Clin. Med., 2019, 2, 183, DOI:10.1093/PCMEDI/PBZ017.
- S. Beloribi-Djefaflia, S. Vasseur and F. Guillaumond, Lipid metabolic reprogramming in cancer cells, Oncogenesis, 2016, 5, e189, DOI:10.1038/ONCSIS.2015.49.
- A. Khwairakpam, M. Shyamananda, B. Sailo, S. Rathnakaram, G. Padmavathi, J. Kotoky and A. Kunnumakkara, ATP citrate lyase (ACLY): a promising target for cancer prevention and treatment, Curr. Drug Targets, 2015, 16, 156–163, DOI:10.2174/1389450115666141224125117.
- K. Mokhtari, M. Mahdevar, M. Hajipour, M. Esmaeili, M. Peymani, S. Mirzaei, M. H. Nasr-Esfahani, M. Hashemi, K. Hushmandi and K. Ghaedi, Involvement of unsaturated fatty acid biosynthesis in CRC progression based on in vitro and in silico studies, Biomed. Pharmacother., 2022, 153, 113338, DOI:10.1016/J.BIOPHA.2022.113338.
- J. Lin, S. M. Zhang, N. R. Cook, I. M. Lee and J. E. Buring, Dietary Fat and Fatty Acids and Risk of Colorectal Cancer in Women, Am. J. Epidemiol., 2004, 160, 1011–1022, DOI:10.1093/AJE/KWH319.
- M. L. Slattery, J. D. Potter, D. M. Duncan and T. Dennis, Dietary fats and colon cancer: assessment of risk associated with specific fatty acids, J. Cancer, 1997, 73, 670–677, DOI:10.1002/(SICI)1097-0215(19971127)73:5.
- K. Jing, T. Wu and K. Lim, Omega-3 polyunsaturated fatty acids and cancer, Anticancer Agents Med. Chem., 2013, 13, 1162–1177, DOI:10.2174/18715206113139990319.
- S. Shekari, S. Fathi, Z. Roumi, M. E. Akbari, S. Tajadod, M. Afsharfar, N. Hasanpour Ardekanizadeh, F. Bourbour, S. A. Keshavarz, M. Sotoudeh, M. Gholamalizadeh, S. Nemat Gorgani, H. Shafaei Kachaei, A. Alizadeh and S. Doaei, Association between dietary intake of fatty acids and colorectal cancer, a case-control study, Front. Nutr., 2022, 9 DOI:10.3389/FNUT.2022.856408.
- H. Abramczyk, B. Brozek-Pluska, J. Surmacki, J. Jablonska-Gajewicz and R. Kordek, Raman “optical biopsy” of human breast cancer, Prog. Biophys. Mol. Biol., 2012, 108, 74–81, DOI:10.1016/j.pbiomolbio.2011.10.004.
- A. F. G. Slater, C. Stefan, I. Nobel and S. Orrenius, The role of intracellular oxidants in apoptosis, Biochim. Biophys. Acta, Mol. Basis Dis., 1995, 1271, 59–62, DOI:10.1016/0925-4439(95)00010-2.
- H. Yanai and N. Tada, Effects of Consumption of Various Fatty Acids on Serum HDL-Cholesterol Levels, J. Endocrinol. Metab., 2018, 8, 94–99, DOI:10.14740/JEM.V8I5.534.
- W. Tartrakoon, T. Tartrakoon and N. Kitsupee, Effects of the ratio of unsaturated fatty acid to saturated fatty acid on the growth performance, carcass and meat quality of finishing pigs, Anim. Nutr., 2016, 2, 79, DOI:10.1016/J.ANINU.2016.03.004.
- S. Xu, H. Xu, W. Wang, S. Li, H. Li, T. Li, W. Zhang, X. Yu and L. Liu, The role of collagen in cancer: from bench to bedside, J. Transl. Med., 2019, 17(1), 1–22, DOI:10.1186/S12967-019-2058-1.
- Y. Xiang, H. Yang, X. Guo, Y. Wu, Y. Ying, Y. Wen and H. Yang, Surface enhanced Raman detection of the colon cancer biomarker cytidine by using magnetized nanoparticles of the type Fe3O4/Au/Ag, Microchim. Acta, 2018, 185, 1–7, DOI:10.1007/S00604-017-2666-5/TABLES/1.
- Y. Endo, H. Marusawa and T. Chiba, Involvement of activation-induced cytidine deaminase in the development of colitis-associated colorectal cancers, J. Gastroenterol., 2011, 46, 6–10, DOI:10.1007/S00535-010-0326-1/FIGURES/3.
- D. A. Ahlquist, D. B. Mcgill, S. Schwartz, W. F. Taylor and R. A. Owen, Fecal Blood Levels in Health and Disease: A Study Using HemoQuant, N. Engl. J. Med., 1985, 312, 1422–1428, DOI:10.1056/NEJM198505303122204.
- P. S. Frame and B. A. Kowulich, Stool occult blood screening for colorectal cancer, J. Fam. Pract., 1982, 15, 1071–1075 CAS.
- K. M. Bahrt, L. Y. Korman and D. J. Nashel, Significance of a positive test for occult blood in stools of patients taking anti-inflammatory drugs, Arch. Intern. Med., 1984, 144, 2165–2166, DOI:10.1001/archinte.144.11.2165.
- F. Tamanoi, M. Azizian, M. Ashrafi and S. Bathaie, Mevalonate Pathway and Human Cancers, Curr. Mol. Pharmacol., 2017, 10, 77–85, DOI:10.2174/1874467209666160112123205.
- H. Zhong and H. Yin, Role of lipid peroxidation derived 4-hydroxynonenal (4-HNE) in cancer: Focusing on mitochondria, Redox Biol., 2015, 4, 193, DOI:10.1016/J.REDOX.2014.12.011.
- K. Laka, L. Makgoo and Z. Mbita, Cholesterol-Lowering Phytochemicals: Targeting the Mevalonate Pathway for Anticancer Interventions, Front. Genet., 2022, 13, 628, DOI:10.3389/FGENE.2022.841639/BIBTEX.
- L. Henneman, A. G. Van Cruchten, W. Kulik and H. R. Waterham, Inhibition of the isoprenoid biosynthesis pathway; detection of intermediates by UPLC-MS/MS, Biochim. Biophys. Acta, Mol. Cell Biol. Lipids, 2011, 1811, 227–233, DOI:10.1016/J.BBALIP.2011.01.002.
- B. Yeganeh, E. Wiechec, S. R. Ande, P. Sharma, A. R. Moghadam, M. Post, D. H. Freed, M. Hashemi, S. Shojaei, A. A. Zeki and S. Ghavami, Targeting the Mevalonate Cascade as a New Therapeutic Approach in Heart Disease, Cancer and Pulmonary Disease, Pharmacol. Ther., 2014, 143, 87, DOI:10.1016/J.PHARMTHERA.2014.02.007.
- E. Chiarella, C. Nisticò, A. Di Vito, H. L. Morrone and M. Mesuraca, Targeting of Mevalonate-Isoprenoid Pathway in Acute Myeloid Leukemia Cells by Bisphosphonate Drugs, Biomedicines, 2022, 10(5), 1146, DOI:10.3390/BIOMEDICINES10051146.
- Z. Movasaghi, S. Rehman and I. U. Rehman, Raman spectroscopy of biological tissues, Appl. Spectrosc. Rev., 2007, 42, 493–541, DOI:10.1080/05704920701551530.
- W. W.-L. Wong, J. Dimitroulakos, M. Minden and L. Penn, HMG-CoA reductase inhibitors and the malignant cell: the statin family of drugs as triggers of tumor-specific apoptosis, Leuk, 2002, 16(4), 508–519, DOI:10.1038/sj.leu.2402476.
- B. Brozek-Pluska, Statistics assisted analysis of Raman spectra and imaging of human colon cell lines – Label free, spectroscopic diagnostics of colorectal cancer, J. Mol. Struct., 2020, 1218 DOI:10.1016/j.molstruc.2020.128524.
- B. Brozek-Pluska, A. Dziki and H. Abramczyk, Virtual spectral histopathology of colon cancer – biomedical applications of Raman spectroscopy and imaging, J. Mol. Liq., 2020, 303 DOI:10.1016/J.MOLLIQ.2020.112676.
- H. Abramczyk, A. Imiela, B. Brożek-Płuska, M. Kopeć, J. Surmacki and A. Śliwińska, Aberrant Protein Phosphorylation in Cancer by Using Raman Biomarkers, Cancers, 2019, 11, 2017, DOI:10.3390/cancers11122017.
- B. Brozek-Pluska, J. Musiał, R. Kordek and H. Abramczyk, Analysis of Human Colon by Raman Spectroscopy and Imaging-Elucidation of Biochemical Changes in Carcinogenesis, Int. J. Mol. Sci., 2019, 20, 3398, DOI:10.3390/ijms20143398.
- B. Brozek-Pluska, K. Miazek, J. Musiał and R. Kordek, Label-free diagnostics and cancer surgery Raman spectra guidance for the human colon at different excitation wavelengths, RSC Adv., 2019, 9, 40445–40454, 10.1039/c9ra06831g.
- P. Burda and M. Aebi, The dolichol pathway of N-linked glycosylation, Biochim. Biophys. Acta, 1999, 1426, 239–257, DOI:10.1016/S0304-4165(98)00127-5.
- X. Deng, F. Xiong, X. Li, B. Xiang, Z. Li, X. Wu, C. Guo, X. Li, Y. Li, G. Li, W. Xiong and Z. Zeng, Application of atomic force microscopy in cancer research, J. Nanobiotechnol., 2018, 16(1), 1–15, DOI:10.1186/S12951-018-0428-0.
- A. Stylianou, M. Lekka and T. Stylianopoulos, AFM assessing of nanomechanical fingerprints for cancer early diagnosis and classification: from single cell to tissue level, Nanoscale, 2018, 10, 20930–20945, 10.1039/C8NR06146G.
Footnote |
| † Electronic supplementary information (ESI) available. See DOI: https://doi.org/10.1039/d3ay01040f |
| This journal is © The Royal Society of Chemistry 2023 |