
 Open Access Article
 This Open Access Article is licensed under a Creative Commons Attribution-Non Commercial 3.0 Unported Licence
TEnvR: MATLAB-based toolbox for environmental research†
Aleksandar I.
Goranov
 *a,
Rachel L.
Sleighter
ab,
Dobromir A.
Yordanov
c and
Patrick G.
Hatcher
*a
*a,
Rachel L.
Sleighter
ab,
Dobromir A.
Yordanov
c and
Patrick G.
Hatcher
*a
aDepartment of Chemistry and Biochemistry, Old Dominion University, 4501 Elkhorn Avenue, Norfolk, VA 23529, USA. E-mail: aleksandar.i.goranov@gmail.com; phatcher@odu.edu
bFBSciences, Inc. R&D Laboratory, 349 Southport Circle, Suite 102, Virginia Beach, VA 23452, USA
cNeuralink Corp., 7400 Paseo Padre Pkwy, Fremont, CA 94555, USA
First published on 27th September 2023
Abstract
With the advancements in science and technology, datasets become larger and more multivariate, which warrants the need for programming tools for fast data processing and multivariate statistical analysis. Here, the MATLAB-based Toolbox for Environmental Research “TEnvR” (pronounced “ten-ver”) is introduced. This novel toolbox includes 44 open-source codes for automated data analysis from a multitude of techniques, such as ultraviolet-visible, fluorescence, and nuclear magnetic resonance spectroscopies, as well as from ultrahigh resolution mass spectrometry. Provided are codes for processing data (e.g., spectral corrections, formula assignment), visualization of figures, calculation of metrics, multivariate statistics, and automated work-up of large datasets. TEnvR allows for efficient data analysis with minimal "by-hand" manual work by the user, which allows scientists to do research more efficiently. This manuscript is supplemented with a detailed tutorial, example data, and screenshots, which collectively provide instructions on how to use all codes. TEnvR is novice-friendly and experience in programming with MATLAB is not required. TEnvR fulfills the need for a concise MATLAB-based toolbox for working with environmental data and will be updated annually to keep pace with the latest advances and needs for computational work in the environmental sciences.
Introduction
With the exponential development of technology, more and more advances in analytical chemistry occur, which in turn quickly translates into applications to various fields, including the environmental sciences. The development of ultrahigh resolution mass spectrometry (namely Fourier transform – ion cyclotron resonance – mass spectrometry, FT-ICR-MS) is an example of a ground-breaking technology that revolutionized the analysis of natural organic matter (NOM).1–4 Increasingly, institutions are purchasing these instruments, but it takes a significant amount of time for researchers to start effectively using them. This is largely because FT-ICR-MS data is challenging to work with: for example, there are various unintuitive stages of data processing to progress from raw instrumental output (peak list of m/z values and corresponding magnitude values) to the processed data (a list of molecular formula assignments). The resultant molecular catalogs are highly multivariate, and it often requires exploratory multivariate statistics, such as principal component analysis (PCA), for seeking trends across the dataset.5 Due to the high complexity of FT-ICR-MS data analysis, many of the computational steps are impractical to be done “by hand” in commercial software programs (e.g., Microsoft Excel). This complication introduced the need for computer scientists to develop software for the efficient processing of such multivariate data. Though independent software packages for analyzing FT-ICR-MS data already exist,6–9 these are based on other programming languages, which can be a significant obstacle for environmental researchers who use MATLAB, abbreviation of “matrix laboratory”, a commonly used programming platform with its own language.Additionally, it has become common for research projects to acquire data on large sets of samples. This can be troublesome, because even if a particular research project deals with relatively simple types of data (e.g., ultraviolet-visible absorption spectra), if there are many (100+) samples, it would be inefficient to process and evaluate each sample individually in Microsoft Excel or another commercial software. Thus, automation programs for analyzing large datasets must be developed.
The field of environmental research is overall at a point where new tools are needed, and they are more computational than instrumental. In this article, the MATLAB-based Toolbox for Environmental Research “TEnvR” (pronounced “ten-ver”) is introduced. It includes 44 tools (referred to as “scripts” or “codes”) that were developed for working with several different types of data: (1) ultraviolet-visible (UV-VIS) absorption spectra; (2) excitation–emission matrix (EEM) fluorescence spectra; (3) ultrahigh resolution mass spectrometry peak lists (from FT-ICR-MS or Orbitrap instruments); and (4) one-dimensional nuclear magnetic resonance (NMR) spectra. A toolbox with such multi-instrumental capabilities has not been available until now to environmental researchers who often need to employ a variety of advanced analytical platforms in order to understand the complexities inherent to environmental samples. This innovative open-source toolbox includes data processing codes, which involve various computational steps for converting raw data output from instruments into processed data files (also referred to as “final” data files). Then, these processed data can be visualized, mined for various metrics, and used in multivariate statistics. Several automation routines in TEnvR process samples and compile data reports in a time-efficient manner, eliminating the need for “by-hand” processing. Several scripts for performing exploratory multivariate statistics are also provided. The accompanying tutorial† of unprecedented detail (100+ single-spaced pages) is supported by 200+ screenshots showing the execution of each code. Researchers that successfully follow through the tutorial files will not only learn how to process, visualize, and evaluate data from different analytical techniques, but also will advance their knowledge and experience with MATLAB programming. Thus, using TEnvR will be particularly useful for researchers that are not experienced with a programming language and for young/uprising scientists who are just learning the workflows of environmental data analysis. The toolbox and its tutorial† are free of charge (for non-commercial purposes) and can be found as a supplement to this paper, downloaded from GitHub (https://github.com/alex-goranov/TEnvR), MathWorks File Exchange (https://www.mathworks.com/matlabcentral/fileexchange/136090-tenvr-toolbox-for-environmental-research), or from TEnvR's website (https://www.tenvr.net/). While TEnvR was developed for exploring NOM data, the codes herein can be useful to other analytical subfields (e.g., metabolomics) upon the appropriate code modifications.
Ultraviolet-visible (UV-VIS) absorption spectroscopy
Ultraviolet-visible (UV-VIS) absorption spectroscopy is fundamental for studies requiring quantitative information on light-absorptive DOM, operationally defined as chromophoric (or colored) dissolved organic matter (CDOM). There are 7 scripts in TEnvR for working with UV-VIS spectrophotometric data, and their capabilities are described below and depicted in Fig. 1. The raw data output from the instrument is generally a two-dimensional matrix (or in MATLAB language, a double array) of absorbance measurements at a range of wavelengths. The raw data is processed into final data using the UVVIS_Process script,‡ which performs blank-correction,10,11 rescales the spectrum to account for any dilution, and performs spectral corrections to eliminate effects from light scattering and deviations in baseline, temperature, and refractive index.12,13 Lastly, the code performs a cuvette-pathlength normalization. The code is versatile and can be altered by the user to enable or disable any of these steps.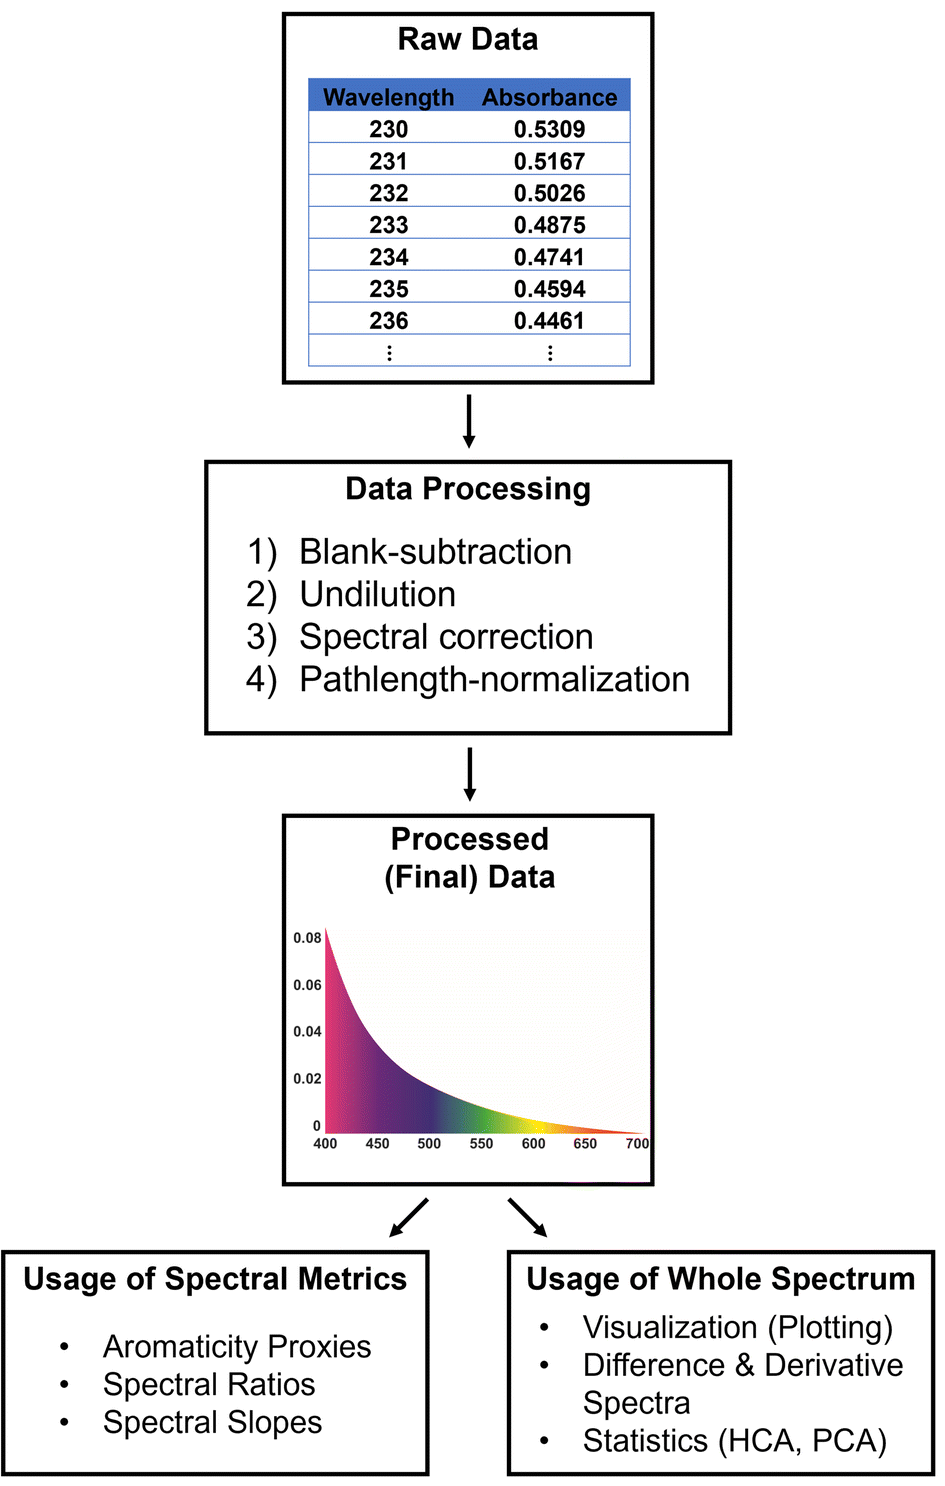 | ||
| Fig. 1 TEnvR pipeline for processing, visualizing, and data mining UV-VIS data. | ||
Once the UV-VIS data is processed, it can be used to calculate spectral parameters (hereafter referred to as metrics) for the characterization of CDOM, including: various proxies for CDOM quantity such as specific UV absorption at 254 nm (SUVA254)14 or the area under the spectrum in the range of 250–450 nm;13 spectral ratios (e.g., E2:E3)15 or spectral slopes (e.g., slope between 275–295 nm, S275–295) indicative of CDOM molecular weight.13 The script UVVIS_Metrics calculates these parameters and produces an Excel file reporting the results for an individual UV-VIS spectral file. In addition, the whole spectra can be used to calculate derivative and differential spectra (using the UVVIS_Derivative and UVVIS_Differentiation scripts, respectively). Derivative and differential spectra have utility in studying CDOM sourcing, fate after degradation (e.g., photochemical), binding between CDOM and metals, and other biogeochemical processes.16
Additionally, a simple script for rescaling UV-VIS spectra was developed (UVVIS_Dilution), which can be used to correct for a dilution factor or normalize the absorbance values to an external parameter (e.g., dissolved organic carbon content). A script for reformatting UV-VIS spectra specifically acquired on HORIBA Aqualog instruments is also provided (UVVIS_ReformatAqualog). Lastly, the UVVIS_Automation script is capable of processing, differentiating, and computing the metrics of a whole dataset of multiple UV-VIS spectra. The automation code will generate an Excel file containing a summary of all metrics for all samples, as well as all decadic, Napierian, and 1st derivative spectra aligned in a matrix that can be used for subsequent manual plotting and evaluation by the researcher in Excel. The code also creates a matrix of data normalized to total spectral intensity that can be further utilized in multivariate statistical analyses as described further below.
Fluorescence spectroscopy
Spectrofluorometry is another fundamental technique in environmental research. It is used for characterizing the fluorophoric (or fluorescent) DOM component (FDOM). Excitation–emission matrices (EEMs) are commonly acquired as they provide a representative three-dimensional spectrum of FDOM. EEMs are acquired by exciting the sample at a range of excitation wavelengths, and the corresponding emission is recorded at a gradient of emission wavelengths.The field of aquatic fluorescence was revolutionized by the development and publication of the N-way, DOMFluor, FDOMcorr, and drEEM MATLAB-based toolboxes.17–22 These tools are capable of fully processing raw EEM data into “final” spectra and then performing parallel factor analysis (PARAFAC), a powerful statistical technique for data deconvolution that allows for identification and quantification of multiple components in the complex FDOM mixture.23 Murphy et al.20 have kept up with the needs of the community by constantly improving the scripts and adding new functionalities, with the 6th version of the drEEM toolbox being released in 2020. Additionally, an online repository system for PARAFAC models was recently developed (OpenFluor), where researchers can upload their PARAFAC models and cross-reference their PARAFAC components with previously published models.24 After the publication of these toolboxes, many more research groups began using EEM data and utilizing PARAFAC in their research. Thus, Murphy and colleagues24 paved the way to sharing data and using programming scripts in the environmental research community. Recently, tools for EEM analysis have also been developed in R25–27 and Python.28 Because of the existing tools for EEMs data within the MATLAB-based drEEM toolbox, there were limited needs to further develop tools within TEnvR. Our developed scripts complement the drEEM toolbox, and their capabilities are described below and in Fig. 2.
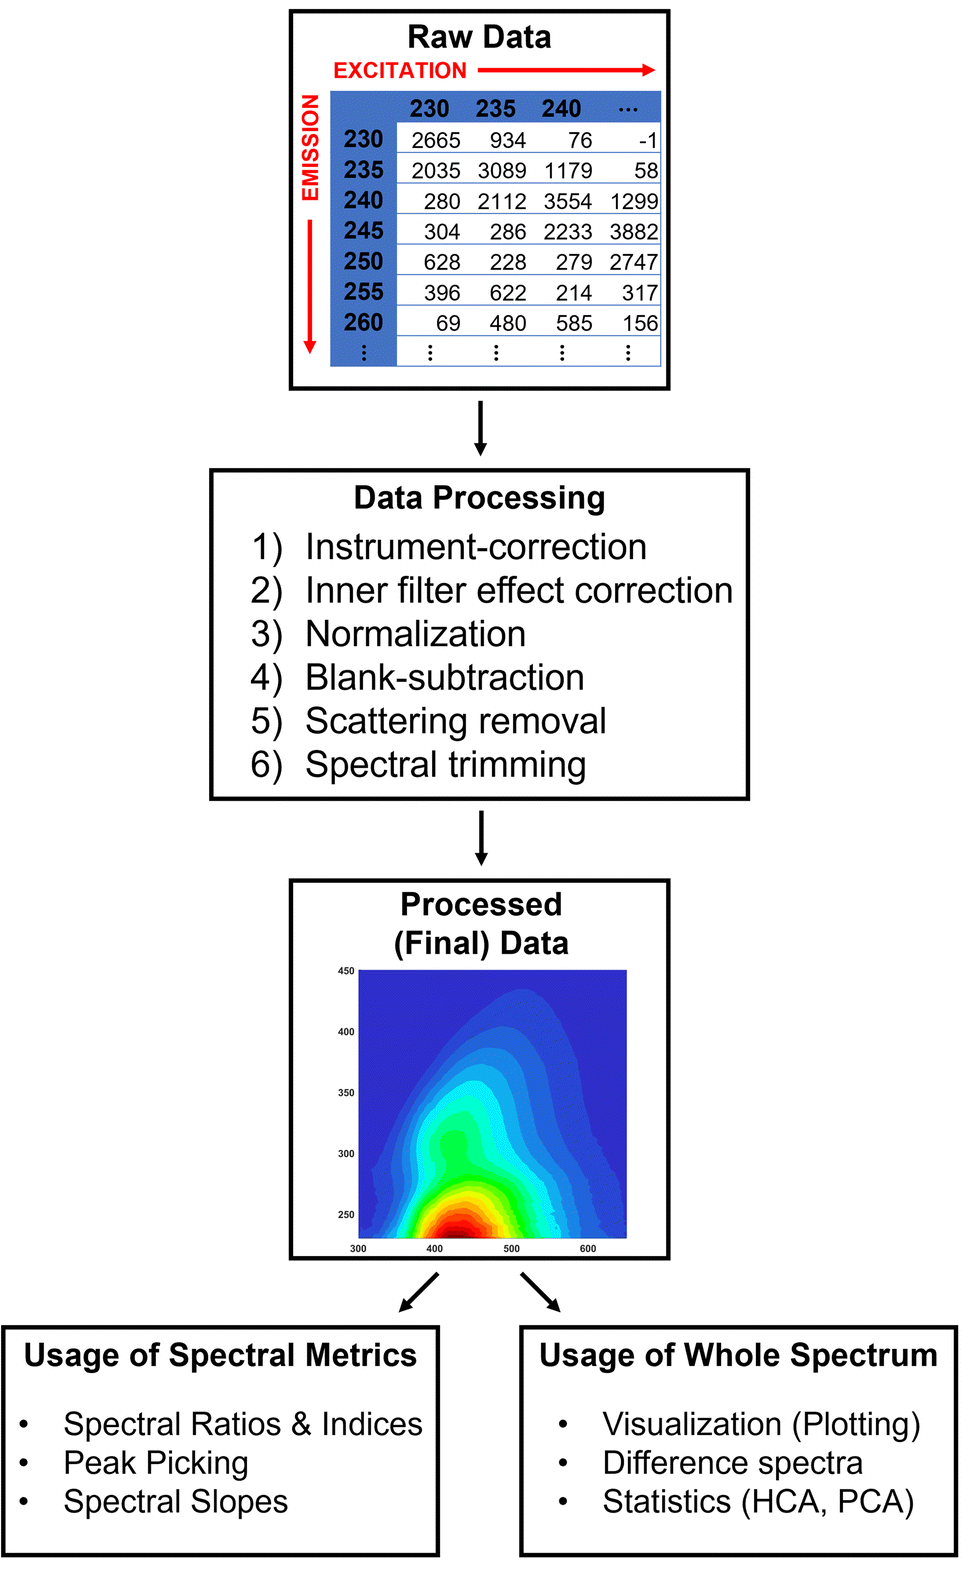 | ||
| Fig. 2 TEnvR pipeline for processing, visualizing, and data mining excitation–emission matrix (EEM) data. | ||
The first step for working with EEM data is the processing, where data are processed externally. We show an example using the codes in drEEM, but this could be also done by other software products. For example, certain spectrofluorometers, such as HORIBA Aqualogs, are able to perform these steps using their own software right after EEM acquisition. Briefly, data are imported into MATLAB using drEEM's readineems code. While this code is capable of importing EEMs from various instruments (HORIBA Jobin Yvon Fluoromax and Aqualog models, Varian, Hitachi, Shimadzu, etc.), data from the ThermoFisher Scientific Lumina 3 and Shimadzu RF-6000 spectrofluorometers that we have used in our research cannot be directly imported. Thus, the scripts EEM_ThermoReformat and EEM_ShimadzuReformat were developed to convert the instrument-output data from these instruments into a readable format by readineems. Once imported in MATLAB, spectra are aligned with a log file for organizational purposes, adjusted for instrument-specific responses,29 corrected for the inner-filter effect,30 normalized either to Raman (RU)31 or quinine sulfate (QSU)32 units, and blank-corrected using the FDOMcorrect code.19 After these corrections, EEM data have to be rescaled to account for pre-analysis dilution (e.g., using drEEM's undilute code). Rayleigh and Raman scattering removal (the smootheem code) and spectral trimming (using the subdataset and zap codes) for denoising purposes follow, after which the data is considered fully processed and can be exported. In TEnvR, two scripts for processing EEMs data are provided depending on the spectrofluorometer they were acquired on: HORIBA Aqualog (EEM_Process_Aqualog) and other (e.g., Thermo/Shimadzu) spectrofluorometers (EEM_Process_Generic). These scripts solely serve as examples and complement the already published tutorials on EEM data processing (Appendix A and tutorial script drEEM_demo_020 of Murphy et al.20). Once processed, EEMs can be further utilized in the drEEM pipeline for deconvolution by PARAFAC20 or used by the codes in TEnvR.
Once spectra are fully corrected and processed, they can be visualized using drEEM's visualization code eemview or using TEnvR's EEM_Visualize script. A differential spectrum can be obtained between two spectra using the EEM_Difference script, which is a useful approach for comparing EEMs of two different samples.33 Also provided here are scripts for transposing EEM data (EEM_Transposition); a scaling script (EEM_Dilution) that can be used to scale up (“undilute”), scale down (“dilute”), or normalize/denormalize EEM data to an external parameter (e.g., dissolved organic carbon content); a script for reformatting water Raman spectra acquired on HORIBA Aqualog spectrofluorometers (EEM_WaterRamanReformatAqualog); and a script for averaging replicate water Raman scans (EEM_WaterRamanAverage). Analogous to UV-VIS data, fluorescence data historically has been used for calculating various metrics, such as the humification (HIX),34,35 freshness (BIX),36,37 and fluorescence (FI)38,39 indices (and many others). This can be done with TEnvR's EEM_Metrics code.
The previously published MATLAB-based toolboxes for working with EEMs do not include scripts for other statistical analyses, such as hierarchical cluster analysis (HCA) and principal component analysis (PCA). While PARAFAC is a much more powerful statistical technique for evaluating EEMs,23 HCA and PCA can still be valuable in cases when a successful PARAFAC model cannot be built. Thus, the TEnvR script EEM_Fold takes multiple EEM files in .csv format, folds them (converts each 3D EEM into a two-dimensional double array), and collates the whole dataset into an alignment matrix that can be further used in the HCA and PCA scripts described below. After PCA analysis, the produced loadings in 2D format can be reformatted back to a 3D format by the EEM_Unfold script and then visualized by EEM_Visualize.
Ultrahigh resolution mass spectrometry
Ultrahigh resolution mass spectrometry, mainly Fourier transform – ion cyclotron resonance – mass spectrometry (FT-ICR-MS), has been revolutionary to the environmental sciences. This technique is capable of resolving the mass spectral signals corresponding to thousands of ionized molecules in complex environmental matrices and providing accurate and precise mass-to-charge measurements. Unique molecular formulas can be assigned to each of these detected ions allowing for the molecular characterization of NOM.4 The processing of FT-ICR-MS data is highly involved, includes many computational steps, the data itself is highly complex and multivariate, and overall FT-ICR-MS data can be overwhelming to a novice researcher. The different stages of data processing are listed in Fig. 3 and briefly described below. Once processed, the final data is of such high dimensionality that it is also often difficult to interpret and mine for trends, thus multivariate exploratory statistics must be involved.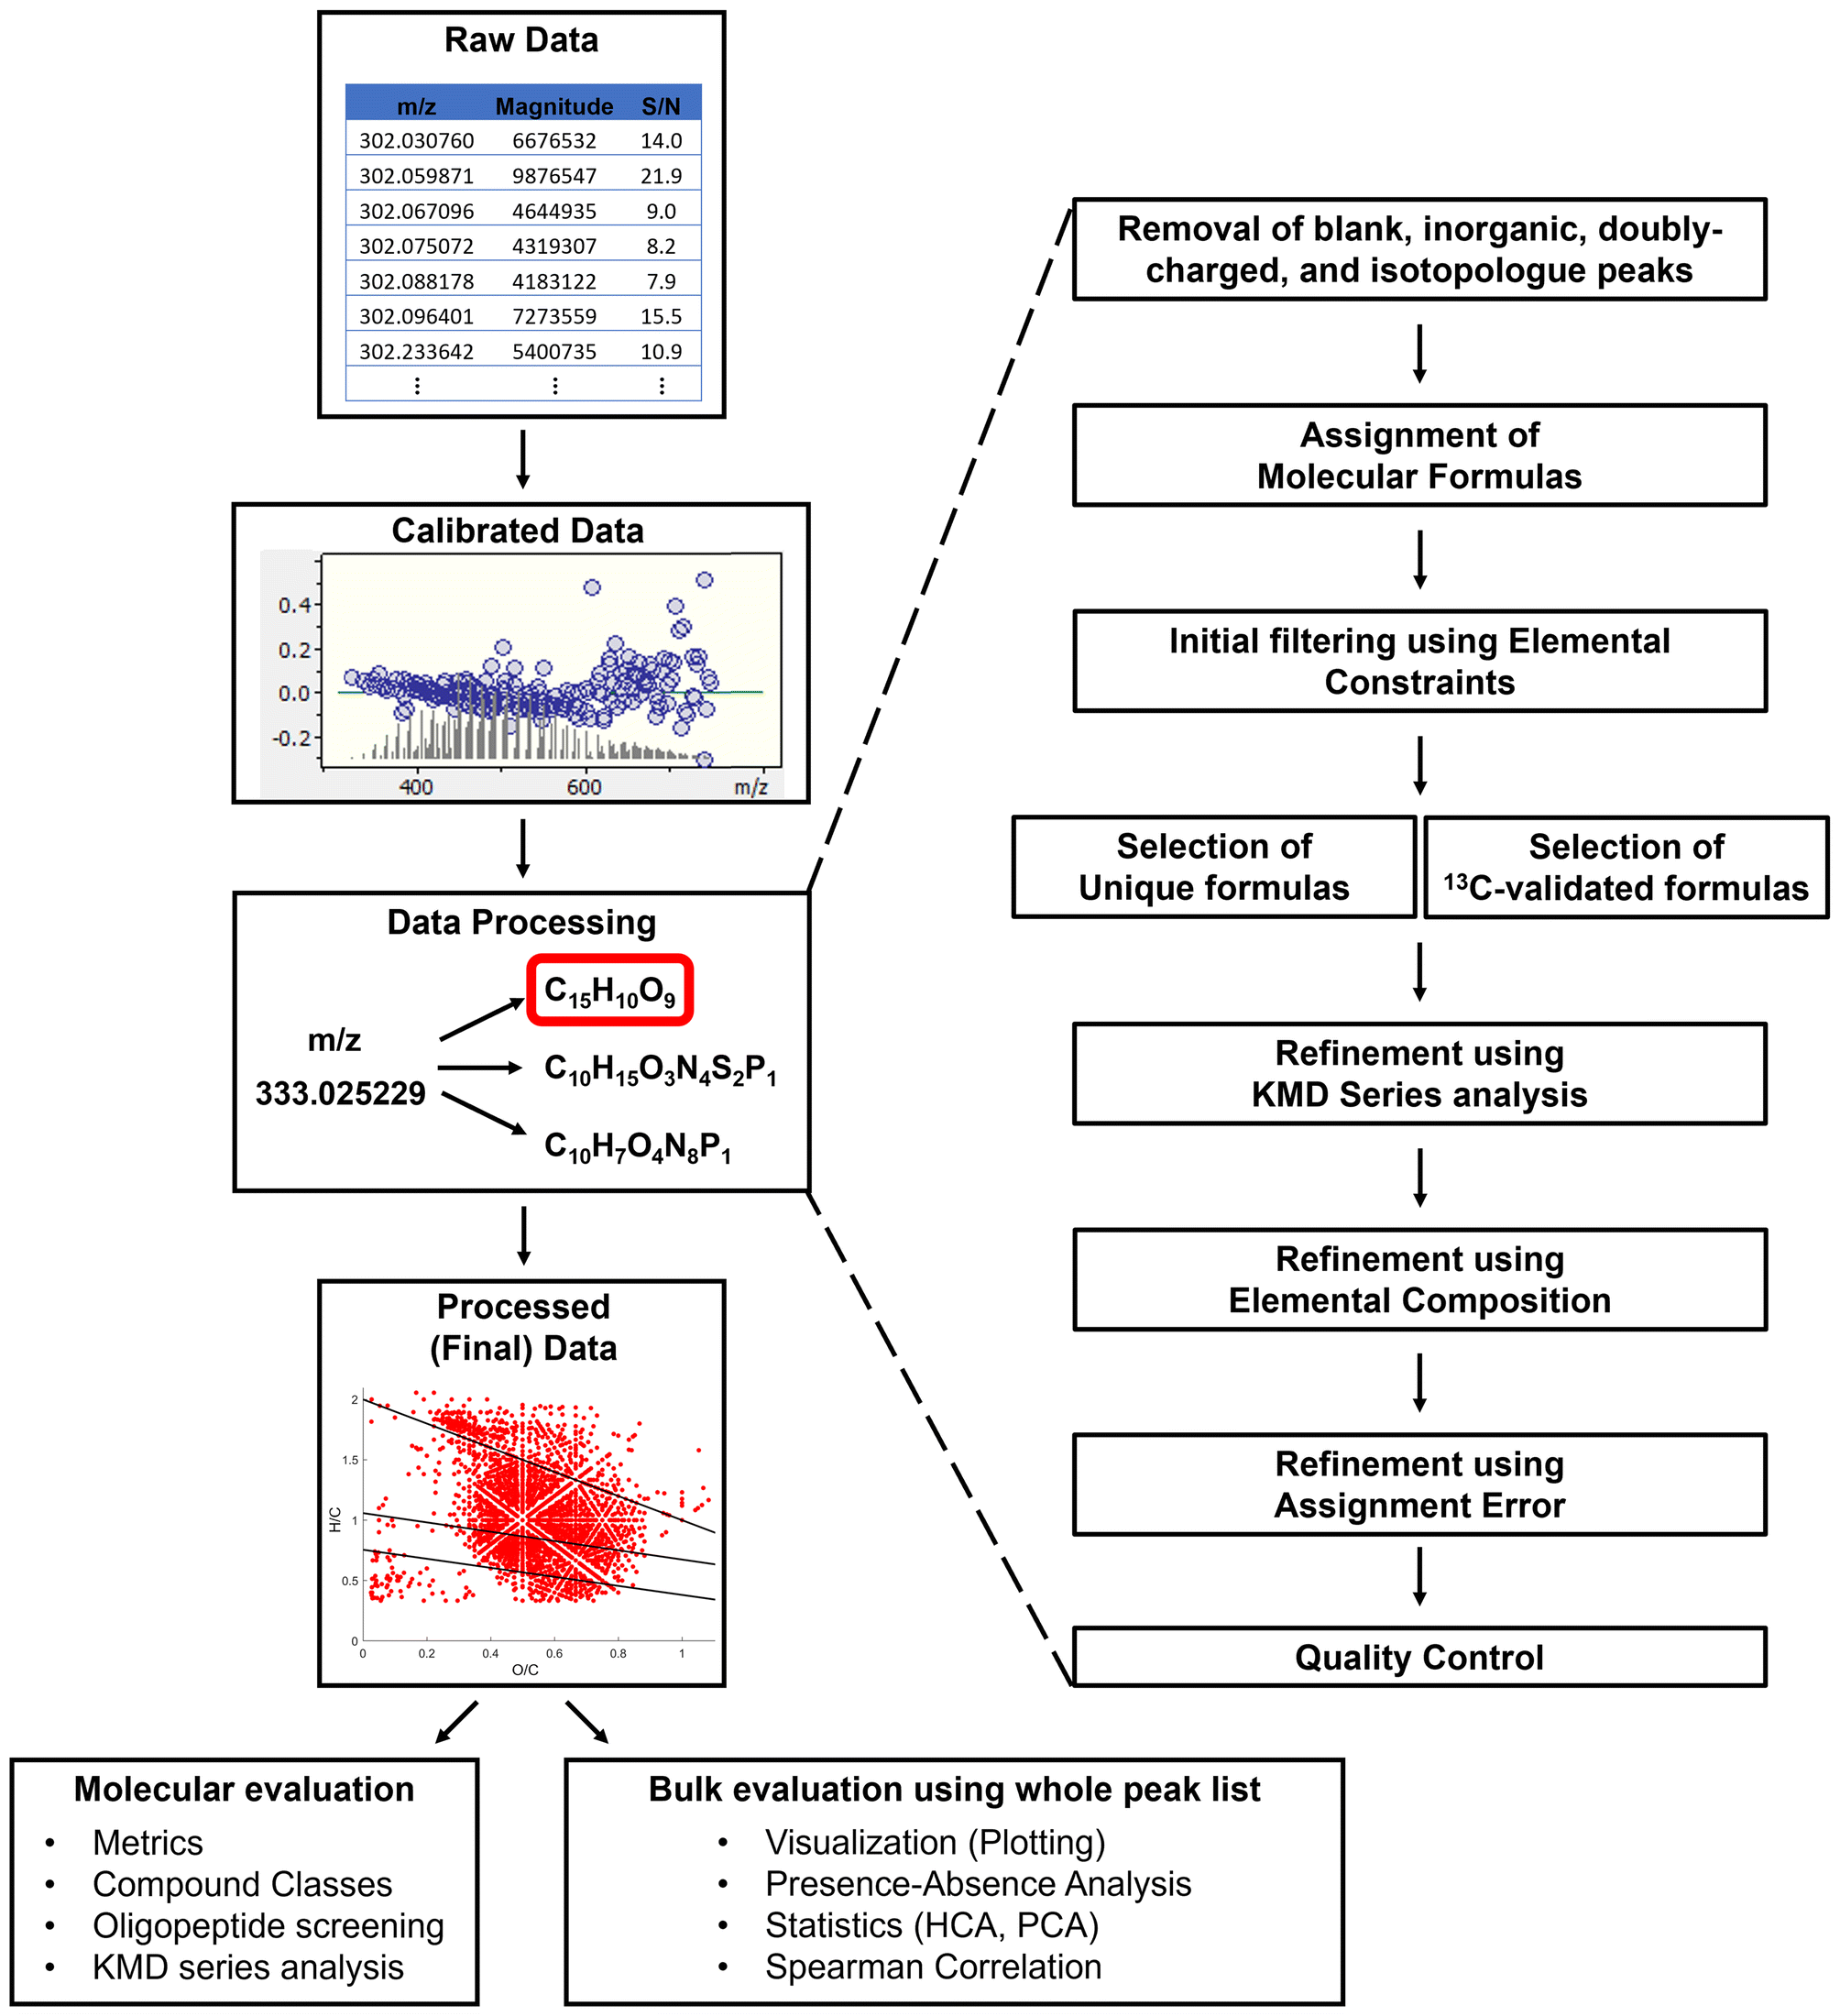 | ||
| Fig. 3 TEnvR pipeline for processing, visualizing, and data mining FT-ICR-MS data. | ||
The first stage for processing FT-ICR-MS data is peak picking and calibration. This can be done using Bruker's data-processing software (e.g., Bruker Compass DataAnalysis) or other open-source software.40 If this is done using DataAnalysis, peaks are picked based on a signal-to-noise (S/N) threshold, which is defined by the user and selected using approaches described previously.41 The picked peaks are then internally calibrated using a list of naturally present compounds (mainly fatty acids and compounds belonging to various CH2 homologous series), which are identified within the sample.42 Then, a peak list consisting of m/z, magnitude, and S/N values of the calibrated peaks is exported as a text (.txt) file.
Calibrated peak lists are first processed using the FTMS_RefinementPeaks script. This code identifies peaks present in a blank sample, peaks of inorganic origin (“salt” peaks),43,44 doubly-charged peaks,45 and isotopologue peaks (13C, 34S, 54Fe, 37Cl, 200Hg). The code removes these peaks and creates a mass list that is now refined and can be used for formula assignment. Optionally, the code can limit the peak list to a specific mass range (e.g., m/z 300–800) or trim peaks below a certain S/N threshold. The refined list is then loaded into the FTMS_FormulaAssignment code that generates candidate molecular formulas using a previously published algorithm from our research group.46 Formulas may contain C, H, O, N, S, and P, as well as one (optional) heteroelement such as 35Cl, 202Hg, or 15N depending on research project specifics.47,48 Assigning 23Na and 40K is also possible, as the inclusion of these elements is critical for samples analyzed in positive ionization mode.
During formula assignment, it is common that more than one molecular formula is computed for an individual m/z value. These ambiguous formula assignments must be refined to obtain a final formula list with unambiguous assignments (one molecular formula per peak). This is done using the FTMS_RefinementFormulas script employing several refinement approaches: (1) filters formulas using elemental constraints49 to remove molecular assignments that are chemically impossible or abnormal for NOM; (2) selects unambiguous assignments (also referred to as “unique” assignments), i.e., peaks that have only one possible assigned molecular formula within a given error range; (3) extracts molecular formulas using isotopic refinement50 (applicable only for peaks that have an associated 13C isotopologue peak); (4) refines ambiguous assignments based on Kendrick mass defect (KMD) homologous series;51,52 (5) refines remaining ambiguous assignments based on their composition (chooses simple type of formulas, i.e., CHO, CHON, CHOS, and CHOP preferably over complex types of formulas, i.e., CHONS, CHONP, CHONSP, etc.);51 and (6) refines any remaining ambiguous assignments based on assignment error by choosing the formula with the smallest error (the difference in parts per million, ppm, between the measured m/z value and the calculated m/z value for the formula candidate). It must be noted that these refinement steps can be controlled by the user, and the selection criteria can be fine-tuned and tailored per the sample/dataset specifics as needed. All refinement steps are explained in detail in the toolbox tutorial.†
The pipeline described above for processing FT-ICR-MS data in total involves the application of three codes for each individual sample. This “manual” pipeline has been specifically designed for “difficult” samples that need to be processed carefully, when the output of each processing step needs to be evaluated by the researcher as it occurs. In our experience, NOM from rainwater, aerosols, ice cores, marine oil snow, and biochar leachates have been shown to be problematic. For such samples, automation without manual checking at each stage is often not recommended. TEnvR includes a second, “automated” pipeline for processing FT-ICR-MS data that is generally successful for processing less problematic NOM samples, such as terrigenous (riverine, lake, swamp) and marine (estuarine, coastal, marine, deep ocean) DOM samples, as well as various soil extracts and their humic/fulvic fractions.
The automated pipeline for processing FT-ICR-MS data incorporates the three codes described above (FTMS_RefinementPeaks, FTMS_FormulaAssignment, and FTMS_RefinementFormulas). To employ this processing route, calibrated peak lists of the sample and blank are loaded using the FTMS_Process script, and it automatically performs all operations of the previously described scripts.
The final processed data consisting of assigned molecular formulas (i.e., formula lists) are exported into Microsoft Excel files. The FTMS_RefinementFormulas code (also part of FTMS_Process) exports a figure containing quality control information about the refinement of peaks and formulas (see slides 103 and 116 of the TEnvR Tutorial Slides file†). It is critical that the molecular formula assignments are assessed and validated by the user as the TEnvR pipeline is not universal for all kinds of NOM.
Once assigned and refined, formula catalogs are highly comparable to those obtained by other software products. This entire process of molecular formula assignment using TEnvR was validated in a recent publication53 by comparing data (from numerous acquisitions) obtained on Suwannee River fulvic acid to the formulas published by Hawkes et al.54 In addition, TEnvR was utilized on data published by Yi et al.,55 and the obtained molecular catalogs were very consistent with those obtained from other software products such as ICBM-OCEAN.8 A comprehensive description of these comparisons is provided in the tutorial within the ESI.†
Once the FT-ICR-MS data is processed into its final form, it is generally used in several ways (Fig. 3). First, various metrics can be calculated using the FTMS_Metrics script. This script calculates averages and standard deviations of various parameters, such as elemental ratios (e.g., oxygen- and hydrogen-to-carbon averages), various double-bond equivalency (DBE) parameters (e.g., H-normalized DBE), and others. In addition to averages of metrics computed from the molecular formula sets (also known as number-based averages), the code also produces magnitude-weighted averages, which allows for characterizing the molecular composition of the sample considering the spectral magnitude of the formula-assigned peaks.
Another common approach is to categorize formulas into different classes of compounds (e.g., condensed aromatic compounds, proteins, tannins, etc.). Due to the variety of possible structural isomers for each molecular formula,1,56 these classifications are not unambiguous but have been shown to be useful for interpreting FT-ICR-MS data.57–59 The script FTMS_CompoundClass evaluates the elemental composition of all formulas in a provided formula list and will assign them to a compound class defined by the user. It will provide several useful figures and an Excel report file with the different classes separated into different sheets.
The FTMS_Automation code has been developed to incorporate FTMS_Process, FTMS_Metrics, and FTMS_CompoundClass in an automated routine. The FTMS_Automation code takes multiple peak lists and applies the aforementioned codes to them.
Molecular formula catalogs can be evaluated in several other ways. Data can be visualized using FTMS_Figures, a code that produces various van Krevelen (vK) diagrams (hydrogen-to-carbon vs. oxygen-to-carbon ratio scatterplots),60,61 histograms, KMD series plots, as well as plots of various parameters against the number of carbon atoms per formula. We recognize that figure design can be highly individual, thus the employed features in these figures should serve as examples. Users are welcome to alter these figure scripts and tailor them for their specific needs. Another capability of TEnvR is the comparison codes FTMS_Compare, FTMS_Compare3, and FTMS_Compare4, which evaluate 2, 3, or 4 formula lists, respectively. These codes are based on the presence/absence approach, which identifies the common formulas among the samples being compared, as well as the unique formulas of each sample.41 The codes also evaluate the spectral magnitude changes of formulas common for the samples of interest, which has been determined to be superior to just presence/absence of unique formulas.5 The comparison codes output a variety of useful figures53,62,63 and Excel file reports, allowing custom data analysis of the unique and common pools of formulas.
For a more detailed assessment of molecular formulas, TEnvR includes codes for KMD analysis (FTMS_KMD, FTMS_KMD_Ox, FTMS_KMD2), which can be used to identify formulas aligning in different homologous series (e.g., CH2, COO). For samples suspected to contain high quantities of proteinaceous material, the FTMS_Peptides code can be used to evaluate if any of the formulas could correspond to simple oligomeric sequences.
As described earlier, FT-ICR-MS data is of high dimensionality, thus it is often necessary to perform exploratory statistics.64 The molecular formula catalogs first need to be aligned using the FTMS_AlignmentFormulas code, which examines each formula in each sample and determines if it is present in other samples in a designated dataset.65 The alignment code produces an alignment matrix, in which it is possible to evaluate the changes in spectral magnitude of each formula in the dataset, especially if it is present in all samples. This alignment matrix is sequentially used in statistical analyses as described below. Lastly, two configuration files (FTMS_ConfigurationAssignment and FTMS_ConfigurationToolbox) are provided that contain user-defined parameters (e.g., mass accuracy, precision, presence of heteroelement, etc.) for all FTMS codes.
Nuclear magnetic resonance (NMR) spectroscopy
NMR spectroscopy is another tool that is highly utilized in environmental research; however, we have not developed a significant number of scripts for processing NMR data. This is because NMR spectrometers typically come associated with software capable of a variety of data treatment and processing steps. Thus, it is easier to use the instrument software for data treatment (calibration, phasing, baseline-correction, integration, etc.) and data mining (integration, multiplet analysis, etc.). Automation of these processing steps is often not possible as the data treatment can be sample-specific. If users would like to explore possible computational routines for processing NMR data, there are various toolbox software packages that are already available.66,67 However, TEnvR does include an important script for automated 1D NMR data processing (NMR_Automation) into an alignment matrix that can be employed for figure preparation or in multivariate statistical analyses. The code first loads NMR spectra that are exported from the NMR software and interpolates the spectra to make them of equivalent size. Then, the code can denoise the spectra and remove resonances below a certain noise threshold.68 Then, the code uses a binning algorithm to average several intensity and chemical shift values across the entire spectrum, which reduces the size of the data and makes it simpler to plot or use further in Excel. Data binning can be useful in tandem with the denoising algorithm to improve the data prior multivariate statistical evaluation68 without a reduction in peak resolution for NOM samples.69 Then, the code aligns all spectra, normalizes them to total spectral intensity, and exports an alignment matrix that can be used subsequently for statistical analysis.70Multivariate statistics
Data of high dimensionality (such as FT-ICR-MS molecular formula catalogs) or large datasets can be difficult to explore even with the already provided tools in TEnvR. Employment of multivariate statistics is thus common and often necessary. TEnvR includes codes for hierarchical cluster analysis (HCA) and principal component analysis (PCA), tools that are extremely useful for dimensionality reduction in order to determine how samples in a dataset differ, as well as which variables from the provided data are responsible for the observed variance.5 HCA (Stats_HCA) and PCA (Stats_PCA) can be performed on the alignment matrices of UV-VIS, EEM, and NMR spectral data or FT-ICR-MS formula lists. HCA and PCA can be also performed on matrices of mixed variables from various instruments (organic carbon content, pH, salinity, UV-VIS or EEM metrics, etc.).47,71 Such matrices of mixed variables can be also analyzed by the Stats_CorrMatrix code, which generates Pearson, Kendall, or Spearman correlation matrices. Lastly, Spearman correlation has emerged as an important technique for mathematically coupling FT-ICR-MS data with external variables from other instruments, such as parameters from spectroscopic and chromatographic techniques.59,72,73 This statistical technique is essential for comprehensive analysis studies, where results from the different analytical platforms need to be statistically compared and correlated. This analysis is done using the FTMS_SpearmanCorrelation code that uses the alignment matrix produced by the FTMS_AlignmentFormulas script and an Excel sheet of external variables. For all statistical codes, in cases where p-values are calculated, we have incorporated a previously published p-value adjustment algorithm74 for controlling false discovery rates, i.e., the chance of a p-value determining a correlation to be significant when it is not, i.e., accounting for “false-positive” p-values. The user can change the p-value threshold (e.g., 90% confidence level for 0.01 p-value threshold, 95% for 0.05 p-value threshold), enable and disable the p-value correction, and even specify the type of correction algorhitm (Benjamini & Hochberg, Bonferroni, etc.) as described in the tutorial documentation.†Concluding remarks
The codes of TEnvR are available to use for free for non-commercial purposes. All codes are licensed under the GNU General Public License v3.0 or later (GPL-3.0-or-later), and TEnvR is registered with the U.S. Copyright Office. The codes of TEnvR can be further modified and open-source redistributed as long as the copyright statement (© Old Dominion University Research Foundation) is retained in the description section of the codes and the toolbox is cited accordingly using this publication's citation.The codes of TEnvR will be revisited yearly to include modifications, improvements of algorithms, enhancement of capabilities, and/or inclusion of new codes. Researchers are welcome to contact the corresponding authors with any feedback on the present codes or with any requests for new codes or capabilities to be included in future updates. Future versions of this toolbox as well as any related announcements will be published on GitHub (https://github.com/alex-goranov/TEnvR), MathWorks File Exchange (https://www.mathworks.com/matlabcentral/fileexchange/136090-tenvr-toolbox-for-environmental-research), and TEnvR's website (https://www.tenvr.net/).
Lastly, while TEnvR provides multiple “turn-key” tools for automated data analysis, we urge users to avoid viewing TEnvR as a “one-size-fits-all” black box. It is important to know and understand the underlying workflow and how the data is processed. Related to this is that environmental samples often deviate from normality, and computational routines may have to be adjusted for particular datasets and/or types of matrices. Thus, users should utilize appropriate caution and ensure they have robust quality assurance/quality control checks in place in order to evaluate results in a reliable fashion.
Author contributions
A. I. Goranov: conceptualization, investigation, software, visualization, writing – original draft, project administration. R. L. Sleighter: investigation, software, validation, writing – review & editing, D. A. Yordanov: conceptualization, software, validation, writing – review & editing, P. G. Hatcher: resources, supervision, funding acquisition, writing – review & editing, project administration.Conflicts of interest
There are no conflicts to declare.Acknowledgements
First and foremost, we would like to express our gratitude to Drs Kathleen Murphy, Colin Stedmon, Rasmus Bro, Daniel Graeber, and Urban Wünsch for their dedication to provide tools to the community for EEM analysis and PARAFAC modeling. The development of TEnvR and this manuscript were truly inspired by their numerous accomplishments and toolboxes. While most of TEnvR's codes were developed by the authors of this study, several scientists must be given credit for their advice and contributions to some of the codes. We thank all previous members of the Hatcher group, particularly Drs Elodie Salmon, Hongmei Chen, Wassim Obeid, Derek Waggoner, and Andrew Wozniak for their contributions to the FT-ICR-MS routines. We also thank Drs Jianhong Xue, Rose Cory, Collin Ward, Krista Longnecker, and Elizabeth Kujawinski for their contributions to the statistical routines. Funding for this project was acquired from the National Science Foundation (Geobiology and Low-Temperature Geochemistry Program, proposal number EAR-1451452) and the Frank Batten Endowment Fund to Dr Patrick Hatcher (Old Dominion University). We thank Old Dominion University for supporting Aleksandar I. Goranov through the Dominion Fellowship. Lastly, we thank Dr Sasha Wagner (Rensselaer Polytechnic Institute) for providing water Raman spectra as a testing dataset; Dr Shannon Robinson and Esqs. Monti Dutta and David Einfeldt for their assistance with obtaining the license and copyright registration of TEnvR; Nikolas Fike (Old Dominion University) for the design of the graphical abstract; and the Associate Editor Prof. Fiona Regan and the two anonymous referees for their time and feedback in improving this manuscript.References
- N. Hertkorn, C. Ruecker, M. Meringer, R. Gugisch, M. Frommberger, E. M. Perdue, M. Witt and P. Schmitt-Kopplin, High-precision frequency measurements: Indispensable tools at the core of the molecular-level analysis of complex systems, Anal. Bioanal. Chem., 2007, 389(5), 1311–1327 CrossRef CAS PubMed.
- N. Hertkorn, M. Frommberger, M. Witt, B. P. Koch, P. Schmitt-Kopplin and E. M. Perdue, Natural organic matter and the event horizon of mass spectrometry, Anal. Chem., 2008, 80(23), 8908–8919 CrossRef CAS PubMed.
- E. B. Kujawinski, M. A. Freitas, X. Zang, P. G. Hatcher, K. B. Green-Church and R. B. Jones, The application of electrospray ionization mass spectrometry (ESI MS) to the structural characterization of natural organic matter, Org. Geochem., 2002, 33(3), 171–180 CrossRef CAS.
- R. L. Sleighter and P. G. Hatcher, The application of electrospray ionization coupled to ultrahigh resolution mass spectrometry for the molecular characterization of natural organic matter, J. Mass Spectrom., 2007, 42(5), 559–574 CrossRef CAS PubMed.
- R. L. Sleighter, Z. Liu, J. Xue and P. G. Hatcher, Multivariate statistical approaches for the characterization of dissolved organic matter analyzed by ultrahigh resolution mass spectrometry, Environ. Sci. Technol., 2010, 44(19), 7576–7582 CrossRef CAS PubMed.
- N. Tolic, Y. Liu, A. Liyu, Y. Shen, M. M. Tfaily, E. B. Kujawinski, K. Longnecker, L. J. Kuo, E. W. Robinson, L. Pasa-Tolic and N. J. Hess, Formularity: Software for Automated Formula Assignment of Natural and Other Organic Matter from Ultrahigh-Resolution Mass Spectra, Anal. Chem., 2017, 89(23), 12659–12665 CrossRef CAS PubMed.
- T. Leefmann, S. Frickenhaus and B. P. Koch, UltraMassExplorer: a browser-based application for the evaluation of high-resolution mass spectrometric data, Rapid Commun. Mass Spectrom., 2019, 33(2), 193–202 CrossRef CAS PubMed.
- J. Merder, J. A. Freund, U. Feudel, C. T. Hansen, J. A. Hawkes, B. Jacob, K. Klaproth, J. Niggemann, B. E. Noriega-Ortega, H. Osterholz, P. E. Rossel, M. Seidel, G. Singer, A. Stubbins, H. Waska and T. Dittmar, ICBM-OCEAN: Processing Ultrahigh-Resolution Mass Spectrometry Data of Complex Molecular Mixtures, Anal. Chem., 2020, 92(10), 6832–6838 CrossRef CAS PubMed.
- E. Kitson, W. Kew, W. Ding and N. G. A. Bell, PyKrev: A Python Library for the Analysis of Complex Mixture FT-MS Data, J. Am. Soc. Mass Spectrom., 2021, 32(5), 1263–1267 CrossRef CAS PubMed.
- M. Peacock, C. D. Evans, N. Fenner, C. Freeman, R. Gough, T. G. Jones and I. Lebron, UV-visible absorbance spectroscopy as a proxy for peatland dissolved organic carbon (DOC) quantity and quality: considerations on wavelength and absorbance degradation, Environ. Sci.: Processes Impacts, 2014, 16(6), 1445–1461 RSC.
- J. H. Lu and L. Wu, Spectrophotometric determination of polyacrylamide in waters containing dissolved organic matter, J. Agric. Food Chem., 2001, 49(9), 4177–4182 CrossRef CAS PubMed.
- S. A. Green and N. V. Blough, Optical-Absorption and Fluorescence Properties of Chromophoric Dissolved Organic-Matter in Natural-Waters, Limnol. Oceanogr., 1994, 39(8), 1903–1916 CrossRef CAS.
- J. R. Helms, A. Stubbins, J. D. Ritchie, E. C. Minor, D. J. Kieber and K. Mopper, Absorption spectral slopes and slope ratios as indicators of molecular weight, source, and photobleaching of chromophoric dissolved organic matter, Limnol. Oceanogr., 2008, 53(3), 955–969 CrossRef.
- J. L. Weishaar, G. R. Aiken, B. A. Bergamaschi, M. S. Fram, R. Fujii and K. Mopper, Evaluation of specific ultraviolet absorbance as an indicator of the chemical composition and reactivity of dissolved organic carbon, Environ. Sci. Technol., 2003, 37(20), 4702–4708 CrossRef CAS PubMed.
- H. De Haan and T. De Boer, Applicability of light absorbance and fluorescence as measures of concentration and molecular size of dissolved organic carbon in humic Lake Tjeukemeer, Water Res., 1987, 21(6), 731–734 CrossRef CAS.
- P. H. Li and J. Hur, Utilization of UV-Vis spectroscopy and related data analyses for dissolved organic matter (DOM) studies: A review, Crit. Rev. Environ. Sci. Technol., 2017, 47(3), 131–154 CrossRef CAS.
- C. A. Stedmon and R. Bro, Characterizing dissolved organic matter fluorescence with parallel factor analysis: a tutorial, Limnol. Oceanogr.: Methods, 2008, 6(11), 572–579 CrossRef CAS.
- C. A. Andersson and R. Bro, The N-way Toolbox for MATLAB, Chemom. Intell. Lab. Syst., 2000, 52(1), 1–4 CrossRef CAS.
- K. R. Murphy, K. D. Butler, R. G. Spencer, C. A. Stedmon, J. R. Boehme and G. R. Aiken, Measurement of dissolved organic matter fluorescence in aquatic environments: an interlaboratory comparison, Environ. Sci. Technol., 2010, 44(24), 9405–9412 CrossRef CAS PubMed.
- K. R. Murphy, C. A. Stedmon, D. Graeber and R. Bro, Fluorescence spectroscopy and multi-way techniques. PARAFAC, Anal. Methods, 2013, 5(23), 6557–6566 RSC.
- K. R. Murphy, A Note on Determining the Extent of the Water Raman Peak in Fluorescence Spectroscopy, Appl. Spectrosc., 2011, 65(2), 233–236 CrossRef CAS.
- P. Micó, S. García-Ballesteros, M. Mora, R. Vicente, A. M. Amat and A. Arques, EEMlab: A graphical user-friendly interface for fluorimetry experiments based on the drEEM toolbox, Chemom. Intell. Lab. Syst., 2019, 188, 6–13 CrossRef.
- R. Bro, PARAFAC. Tutorial and applications, Chemom. Intell. Lab. Syst., 1997, 38(2), 149–171 CrossRef CAS.
- K. R. Murphy, C. A. Stedmon, P. Wenig and R. Bro, OpenFluor- an online spectral library of auto-fluorescence by organic compounds in the environment, Anal. Methods, 2014, 6(3), 658–661 RSC.
- M. Pucher, U. Wunsch, G. Weigelhofer, K. Murphy, T. Hein and D. Graeber, staRdom: Versatile Software for Analyzing Spectroscopic Data of Dissolved Organic Matter in R, Water, 2019, 11(11), 1–19 Search PubMed.
- V. Trivittayasil, EEM: Read and Preprocess Fluorescence Excitation–Emission Matrix (EEM) Data, 1.1.1; the Comprehensive R Archive Network, 2016 Search PubMed.
- P. Massicotte, eemR, 0.1.4, Zenodo, 2016 Search PubMed.
- N. M. Peleato, Applications of Principal Component Analysis of Fluorescence Excitation–Emission Matrices for Characterization of Natural Organic Matter in Water Treatment, Master's Thesis, University of Toronto, Toronto, Canada, 2013 Search PubMed.
- R. M. Cory, M. P. Miller, D. M. McKnight, J. J. Guerard and P. L. Miller, Effect of instrument-specific response on the analysis of fulvic acid fluorescence spectra, Limnol. Oceanogr.: Methods, 2010, 8, 67–78 CAS.
- D. N. Kothawala, K. R. Murphy, C. A. Stedmon, G. A. Weyhenmeyer and L. J. Tranvik, Inner filter correction of dissolved organic matter fluorescence, Limnol. Oceanogr.: Methods, 2013, 11(12), 616–630 CrossRef.
- A. J. Lawaetz and C. A. Stedmon, Fluorescence intensity calibration using the Raman scatter peak of water, Appl. Spectrosc., 2009, 63(8), 936–940 CrossRef CAS PubMed.
- P. G. Coble, C. A. Schultz and K. Mopper, Fluorescence Contouring Analysis of Doc Intercalibration Experiment Samples – a Comparison of Techniques, Mar. Chem., 1993, 41(1–3), 173–178 CrossRef CAS.
- D. Hemmler, M. Gonsior, L. C. Powers, J. W. Marshall, M. Rychlik, A. J. Taylor and P. Schmitt-Kopplin, Simulated Sunlight Selectively Modifies Maillard Reaction Products in a Wide Array of Chemical Reactions, Chem.—Eur. J., 2019, 25(57), 13208–13217 CrossRef CAS PubMed.
- K. Kalbitz, W. Geyer and S. Geyer, Spectroscopic properties of dissolved humic substances – a reflection of land use history in a fen area, Biogeochemistry, 1999, 47(2), 219–238 CAS.
- K. Kalbitz, S. Geyer and W. Geyer, A comparative characterization of dissolved organic matter by means of original aqueous samples and isolated humic substances, Chemosphere, 2000, 40(12), 1305–1312 CrossRef CAS PubMed.
- E. Parlanti, K. Worz, L. Geoffroy and M. Lamotte, Dissolved organic matter fluorescence spectroscopy as a tool to estimate biological activity in a coastal zone submitted to anthropogenic inputs, Org. Geochem., 2000, 31(12), 1765–1781 CrossRef CAS.
- H. F. Wilson and M. A. Xenopoulos, Effects of agricultural land use on the composition of fluvial dissolved organic matter, Nat. Geosci., 2008, 2(1), 37–41 CrossRef.
- D. M. McKnight, E. W. Boyer, P. K. Westerhoff, P. T. Doran, T. Kulbe and D. T. Andersen, Spectrofluorometric characterization of dissolved organic matter for indication of precursor organic material and aromaticity, Limnol. Oceanogr., 2001, 46(1), 38–48 CrossRef CAS.
- R. M. Cory and D. M. McKnight, Fluorescence spectroscopy reveals ubiquitous presence of oxidized and reduced quinones in dissolved organic matter, Environ. Sci. Technol., 2005, 39(21), 8142–8149 CrossRef CAS PubMed.
- Q. L. Fu, M. Fujii and E. Kwon, Development of an Internal Calibration Algorithm for Ultrahigh-Resolution Mass Spectra of Dissolved Organic Matter, Anal. Chem., 2022, 94(30), 10589–10594 CrossRef CAS PubMed.
- R. L. Sleighter, H. Chen, A. S. Wozniak, A. S. Willoughby, P. Caricasole and P. G. Hatcher, Establishing a measure of reproducibility of ultrahigh-resolution mass spectra for complex mixtures of natural organic matter, Anal. Chem., 2012, 84(21), 9184–9191 CrossRef CAS PubMed.
- R. L. Sleighter, G. A. McKee, Z. Liu and P. G. Hatcher, Naturally present fatty acids as internal calibrants for Fourier transform mass spectra of dissolved organic matter, Limnol. Oceanogr.: Methods, 2008, 6, 246–253 CrossRef CAS.
- A. C. Stenson, W. M. Landing, A. G. Marshall and W. T. Cooper, Ionization and fragmentation of humic substances in electrospray ionization Fourier transform-ion cyclotron resonance mass spectrometry, Anal. Chem., 2002, 74(17), 4397–4409 CrossRef CAS PubMed.
- T. L. Brown and J. A. Rice, Effect of experimental parameters on the ESI FT-ICR mass spectrum of fulvic acid, Anal. Chem., 2000, 72(2), 384–390 CrossRef CAS PubMed.
- C. Patriarca and J. A. Hawkes, High Molecular Weight Spectral Interferences in Mass Spectra of Dissolved Organic Matter, J. Am. Soc. Mass Spectrom., 2021, 32(1), 394–397 CrossRef CAS PubMed.
- W. A. Obeid, Investigation of the ootential for algaenan to produce hydrocarbon based fuels from algae by hydrous pyrolysis, Doctoral Dissertation, Old Dominion University, 2015.
- A. S. Wozniak, A. I. Goranov, S. Mitra, K. W. Bostick, A. R. Zimmerman, D. R. Schlesinger, S. Myneni and P. G. Hatcher, Molecular heterogeneity in pyrogenic dissolved organic matter from a thermal series of oak and grass chars, Org. Geochem., 2020, 148(1), 1–18 Search PubMed.
- H. M. Chen, R. C. Johnston, B. F. Mann, R. K. Chu, N. Tolic, J. M. Parks and B. H. Gu, Identification of Mercury and Dissolved Organic Matter Complexes Using Ultrahigh Resolution Mass Spectrometry, Environ. Sci. Technol. Lett., 2017, 4(2), 59–65 CrossRef CAS.
- A. Stubbins, R. G. M. Spencer, H. M. Chen, P. G. Hatcher, K. Mopper, P. J. Hernes, V. L. Mwamba, A. M. Mangangu, J. N. Wabakanghanzi and J. Six, Illuminated darkness: Molecular signatures of Congo River dissolved organic matter and its photochemical alteration as revealed by ultrahigh precision mass spectrometry, Limnol. Oceanogr., 2010, 55(4), 1467–1477 CrossRef CAS.
- T. Kind and O. Fiehn, Metabolomic database annotations via query of elemental compositions: mass accuracy is insufficient even at less than 1 ppm, BMC Bioinf., 2006, 7(1), 234 CrossRef PubMed.
- E. B. Kujawinski and M. D. Behn, Automated analysis of electrospray ionization Fourier transform ion cyclotron resonance mass spectra of natural organic matter, Anal. Chem., 2006, 78(13), 4363–4373 CrossRef CAS PubMed.
- B. P. Koch, T. Dittmar, M. Witt and G. Kattner, Fundamentals of molecular formula assignment to ultrahigh resolution mass data of natural organic matter, Anal. Chem., 2007, 79(4), 1758–1763 CrossRef CAS PubMed.
- A. I. Goranov, A. M. Tadini, L. Martin-Neto, A. C. C. Bernardi, P. P. A. Oliveira, J. R. M. Pezzopane, D. Milori, S. Mounier and P. G. Hatcher, Comparison of sample preparation techniques for the (-)ESI-FT-ICR-MS analysis of humic and fulvic acids, Environ. Sci. Technol., 2022, 56(17), 12688–12701 CrossRef CAS PubMed.
- J. A. Hawkes, J. D'Andrilli, J. N. Agar, M. P. Barrow, S. M. Berg, N. Catalán, H. Chen, R. K. Chu, R. B. Cole, T. Dittmar, R. Gavard, G. Gleixner, P. G. Hatcher, C. He, N. J. Hess, R. H. S. Hutchins, A. Ijaz, H. E. Jones, W. Kew, M. Khaksari, D. C. Palacio Lozano, J. Lv, L. R. Mazzoleni, B. E. Noriega-Ortega, H. Osterholz, N. Radoman, C. K. Remucal, N. D. Schmitt, S. K. Schum, Q. Shi, C. Simon, G. Singer, R. L. Sleighter, A. Stubbins, M. J. Thomas, N. Tolic, S. Zhang, P. Zito and D. C. Podgorski, An international laboratory comparison of dissolved organic matter composition by high resolution mass spectrometry: Are we getting the same answer?, Limnol. Oceanogr.: Methods, 2020, 18(6), 235–258 CrossRef CAS.
- Y. Yi, C. He, K. Klaproth, J. Merder, P. Li, Y. Qi, P. Fu, S. Li, T. Dittmar, Q. Shi and D. He, Will various interpretation strategies of the same ultrahigh-resolution mass spectrometry data tell different biogeochemical stories? A first assessment based on natural aquatic dissolved organic matter, Limnol. Oceanogr.: Methods, 2023, 1–14 Search PubMed.
- T. Wieland, A. Kerber and R. Laue, Principles of the generation of constitutional and configurational isomers, J. Chem. Inf. Comput. Sci., 1996, 36(3), 413–419 CrossRef CAS.
- W. C. Hockaday, J. M. Purcell, A. G. Marshall, J. A. Baldock and P. G. Hatcher, Electrospray and photoionization mass spectrometry for the characterization of organic matter in natural waters: A qualitative assessment, Limnol. Oceanogr.: Methods, 2009, 7, 81–95 CrossRef.
- T. Ohno, Z. He, R. L. Sleighter, C. W. Honeycutt and P. G. Hatcher, Ultrahigh resolution mass spectrometry and indicator species analysis to identify marker components of soil- and plant biomass- derived organic matter fractions, Environ. Sci. Technol., 2010, 44(22), 8594–8600 CrossRef CAS PubMed.
- R. L. Sleighter, R. M. Cory, L. A. Kaplan, H. A. N. Abdulla and P. G. Hatcher, A coupled geochemical and biogeochemical approach to characterize the bioreactivity of dissolved organic matter from a headwater stream, J. Geophys. Res.: Biogeosci., 2014, 119(8), 1520–1537 CrossRef CAS.
- D. W. Van Krevelen, Graphical-statistical method for the study of structure and reaction processes of coal, Fuel, 1950, 29, 269–284 CAS.
- S. Kim, R. W. Kramer and P. G. Hatcher, Graphical method for analysis of ultrahigh-resolution broadband mass spectra of natural organic matter, the van Krevelen diagram, Anal. Chem., 2003, 75(20), 5336–5344 CrossRef CAS PubMed.
- A. I. Goranov, A. S. Wozniak, K. W. Bostick, A. R. Zimmerman, S. Mitra and P. G. Hatcher, Photochemistry after fire: Structural transformations of pyrogenic dissolved organic matter elucidated by advanced analytical techniques, Geochim. Cosmochim. Acta, 2020, 290, 271–292 CrossRef CAS.
- A. I. Goranov, A. S. Wozniak, K. W. Bostick, A. R. Zimmerman, S. Mitra and P. G. Hatcher, Microbial labilization and diversification of pyrogenic dissolved organic matter, Biogeosciences, 2022, 19(5), 1491–1514 CrossRef CAS.
- T. Reemtsma, Determination of molecular formulas of natural organic matter molecules by (ultra-) high-resolution mass spectrometry: status and needs, J. Chromatogr. A, 2009, 1216(18), 3687–3701 CrossRef CAS PubMed.
- D. Mantini, F. Petrucci, D. Pieragostino, P. Del Boccio, M. Di Nicola, C. Di Ilio, G. Federici, P. Sacchetta, S. Comani and A. Urbani, LIMPIC: a computational method for the separation of protein MALDI-TOF-MS signals from noise, BMC Bioinf., 2007, 8(1), 101 CrossRef PubMed.
- C. Ludwig and U. L. Gunther, MetaboLab—advanced NMR data processing and analysis for metabolomics, BMC Bioinf., 2011, 12(1), 366 CrossRef CAS PubMed.
- U. L. Gunther, C. Ludwig and H. Ruterjans, NMRLAB-Advanced NMR data processing in matlab, J. Magn. Reson., 2000, 145(2), 201–208 CrossRef CAS PubMed.
- S. Halouska and R. Powers, Negative impact of noise on the principal component analysis of NMR data, J. Magn. Reson., 2006, 178(1), 88–95 CrossRef CAS PubMed.
- R. L. Sleighter, P. Caricasole, K. M. Richards, T. Hanson and P. G. Hatcher, Characterization of terrestrial dissolved organic matter fractionated by pH and polarity and their biological effects on plant growth, Chem. Biol. Technol. Agric., 2015, 2(1), 1–19 CrossRef.
- A. M. Tadini, L. Martin-Neto, A. I. Goranov, D. M. B. P. Milori, A. C. C. Bernardi, P. P. A. Oliveira, J. R. M. Pezzopane, L. A. Colnago and P. G. Hatcher, Chemical characteristics of soil organic matter from integrated agricultural systems in southeastern Brazil, Eur. J. Soil Sci., 2022, 73(1), 1–18 CrossRef.
- J. H. Xue, C. Lee, S. G. Wakeham and R. A. Armstrong, Using principal components analysis (PCA) with cluster analysis to study the organic geochemistry of sinking particles in the ocean, Org. Geochem., 2011, 42(4), 356–367 CrossRef CAS.
- A. Stubbins, J. F. Lapierre, M. Berggren, Y. T. Prairie, T. Dittmar and P. A. del Giorgio, What's in an EEM? Molecular signatures associated with dissolved organic fluorescence in boreal Canada, Environ. Sci. Technol., 2014, 48(18), 10598–10606 CrossRef CAS PubMed.
- S. M. Berg, Q. T. Whiting, J. A. Herrli, R. Winkels, K. H. Wammer and C. K. Remucal, The Role of Dissolved Organic Matter Composition in Determining Photochemical Reactivity at the Molecular Level, Environ. Sci. Technol., 2019, 53(20), 11725–11734 CrossRef CAS PubMed.
- N. Fachada and A. C. Rosa, micompm: A MATLAB/Octave toolbox for multivariate independent comparison of observations, J. Open Source Softw., 2018, 3(23), 430 CrossRef.
- K. W. Bostick, A. R. Zimmerman, A. I. Goranov, S. Mitra, P. G. Hatcher and A. S. Wozniak, Photolability of pyrogenic dissolved organic matter from a thermal series of laboratory-prepared chars, Sci. Total Environ., 2020, 724, 138198 CrossRef CAS PubMed.
Footnotes |
| † Electronic supplementary information (ESI) available: TEnvR tutorial provided as a .pdf file; TEnvR provided as a .zip file and includes: 44 primary codes, internal functions and supporting documentation, TEnvR tutorial (.pdf), and TEnvR tutorial screenshots provided as a Microsoft PowerPoint .pptx file. Included in the toolbox are also example raw data for testing: unpublished UV-VIS, EEM, and FT-ICR-MS spectra of fluvial NOM that had been irradiated by simulated sunlight; NMR spectra of biochars published by Wozniak,46 and UV-VIS/EEM spectra of biochar water extracts published by Bostick75 and Goranov.63 See DOI: https://doi.org/10.1039/d3ay00750b |
| ‡ Codes of TEnvR are in bold for clarity. |
| This journal is © The Royal Society of Chemistry 2023 |