
A novel metal–organic framework of Co-hemin for portable and visual colorimetric detection of 2,4-dichlorophenoxyacetic acid†
Jintao
Yi
 *a,
Xianqin
Han
a,
Qi
Zhu
a,
Lingli
Wu
a,
Youtan
Wang
a,
Jun
Xue
*a,
Xiaoqi
Lai
*a and
Hui
Zhou
*ab
*a,
Xianqin
Han
a,
Qi
Zhu
a,
Lingli
Wu
a,
Youtan
Wang
a,
Jun
Xue
*a,
Xiaoqi
Lai
*a and
Hui
Zhou
*ab
aKey Laboratory of Organo-Pharmaceutical Chemistry of Jiangxi Province, Gannan Normal University, Ganzhou 341000, P. R. China. E-mail: yistarthappy@163.com; Fax: +86-797-8393536; Tel: +86-797-8393536
bGuangdong Provincial Key Laboratory of Research and Development of Natural Drugs, School of Pharmacy, Guangdong Medical University, Dongguan 523808, P. R. China
First published on 21st November 2022
Abstract
On-site quantitative analysis of 2,4-dichlorophenoxyacetic acid (2,4-D) is of significant importance for addressing increasing concerns about public health and environmental quality. Here, a novel metal–organic framework (MOF) of Co-hemin is synthesized and first used for on-site colorimetric monitoring of 2,4-D. 2,4-D as an inhibitor of alkaline phosphatase could specifically suppress the production of ascorbic acid, which restrained in situ etching of Co-hemin and further triggered the colorimetric response. In the colorimetric assay, Co-hemin displayed good oxidase-like activity without addition of H2O2, which could avoid the shortcomings of H2O2 such as toxicity and instability. The Co-hemin biosensor exhibited a relatively low detection limit of 33 ng mL−1 for 2,4-D by the UV method. Moreover, a smartphone based RGB analysis system for the sensitive detection of 2,4-D was developed, and exhibited a good linear relationship between the RGB model parameter and the concentration of 2,4-D. The operability and accuracy of the Co-hemin biosensor were confirmed by the quantitative determination of 2,4-D in real samples, such as serum and tap water. Also, the Co-hemin based colorimetric biosensor showed good selectivity and specificity. Moreover, the developed assays displayed good application in constructing complex logic gates. This work not only provided a portable and visual platform for on-site monitoring of 2,4-D, but also expanded application prospects in the field of complex biological analysis.
1. Introduction
The extensive use of herbicides in agriculture production to meet food demand has a serious negative impact on living organisms and the environment. 2,4-Dichloropheoxyacetic acid (2,4-D) is an auxin-like herbicide which is widely used in controlling growth of broad-leaf weeds.1 Overuse of this herbicide often leads to its persistence in water sources due to its high solubility and nonbiodegradability in Nature.2,3 During their long-term exposure, 2,4-D and its derivatives may cause serious health effects such as endocrine disrupting activities, cancer and degenerative changes in the nervous system.4,5 This herbicide has been identified as a human carcinogen by the Environmental Protection Agency and a toxic pollutant by the International Agency for Research on Cancer.6,7 Keeping in view the hazardous nature of this organic contaminant, it is important to develop accurate, efficient and cost-effective techniques for 2,4-D detection in support of environment surveillance with increasing concerns for public health and environmental quality.Traditionally, methods based on large-scale instruments for detecting 2,4-D mainly include high performance liquid chromatography,8,9 gas chromatography,10,11 and mass spectrometry.12,13 Although these methods provide satisfactory and accurate results, they come with certain limitations such as high cost, complex pretreatment, time-consuming procedures, and the need for expertise to obtain accurate results. Therefore, they are not suitable for rapid on-site detection and screening samples in large numbers. Recently, novel detection methods such as immunoassay techniques,14 electrochemical methods15 and colorimetric methods,16 have been developed to detect 2,4-D in environmental samples. Despite its high efficiency and convenience, an enzyme-based immunoassay technique comes with certain operational limitations such as high cost, thermal instability, short lifetime and low reproducibility. Although electrochemical methods have gained more popularity due to their simplicity, low cost and rapid response time, electrochemical sensing faces challenges of electrode calibration and signal drift, which restrict its extensive application in complex environments. The colorimetric method is a visual analytical technique without expensive equipment, but colorimetry usually needs H2O2 which has some shortcomings of toxicity and instability. Therefore, it is still urgent to develop a suitable and rapid method for 2,4-D detection on site.
Nanoenzymes are nanomaterials with enzyme-like characteristics, with merits of high stability, low-cost and superior catalytic activity.17–19 Metal–organic frameworks (MOFs) are an emerging class of functional materials, which are formed by self-assembly of metal ions and organic linkers, with merits of high surface area, large pore volume and tunable shapes, and have been exploited for potential applications in gas storage, drug delivery, selective catalysis, electronic equipment and sensing.20 Hemin, as one of the iron porphyrin derivatives, could be used for mimicking the active site of various enzymes.21 Because hemin easily forms inactive catalytic dimers by molecular aggregation and is oxidized with self-destruction in aqueous solution,22 the direct application of hemin is still a challenge. Therefore, the development of novel materials based on hemin with enzyme-like activity is highly desired. Since hemin has a catalytic porphyrin with two carboxylate groups which can covalently bind to metal ions (such as Zn2+ and Ba2+),23,24 it is deduced that this organic ligand may be used as a bridge in the synthesis of MOFs with enzyme-like activities.
Herein, a novel Co-hemin MOF with oxidase-mimicking activity was synthesized and first used for on-site colorimetric detection of 2,4-D. In the colorimetric reaction, without addition of H2O2, Co-hemin could oxidize 3,3′,5,5′-tetramethylbenzidine (TMB) to oxTMB with the color changing from colorless to blue. However, in the presence of alkaline phosphatase (ALP), Co-hemin could be degraded by ascorbic acid (AA) that could be generated by the catalytic hydrolysis of ascorbic acid-2-phosphate trisodium salt (AAP). 2,4-D, as an inhibitor of ALP, could inhibit the activity of ALP to block the production of AA, which restrained in situ etching of Co-hemin and further triggered the colorimetric response of TMB from colorless to blue. Moreover, a smartphone based RGB analysis system for the sensitive detection of 2,4-D was developed. In addition, the expanded applications of constructing complex logic gates of 2,4-D were provided. The portable and visual platform based on Co-hemin had been utilized successfully for detecting 2,4-D on-site.
2. Experimental section
2.1 The synthesis of Co-hemin
According to the reported synthesis literature, Co-hemin was synthesized with some modification.25 Typically, hemin (0.5 mM, 500 μL), cobalt chloride hexahydrate (10 mM, 25 μL), sodium hydroxide (1 mM, 1 mL) and H2O (1.475 mL) were mixed under vigorous stirring at 25 °C for 2 h. The resulting solution was centrifuged at 7000 rpm for 5 min and washed twice with water. Next, the obtained precipitate was dried at 60 °C to obtain bulk Co-hemin particles. Finally, 1 mg of Co-hemin was dissolved in 1 mL of H2O to obtain 1 mg mL−1 of Co-hemin solution which was adequately sonicated before use.2.2 The detection of 2,4-D by Co-hemin
In the assay of 2,4-D detection, 5 μL of ALP (810 U L−1) and 6 μL of 2,4-D (6 g L−1) were reacted for 15 min, then 10 μL of AAP (10 mM) was added for another 20 min, next 10 μL of TMB solution (5 mM), 37 μL of HAc–NaAc buffer (0.4 M, pH 4.5), 15 μL of Co-hemin (1 mg mL−1) and 67 μL of sterile water were sequentially added, and the obtained solution mixture was incubated for 10 min at 25 °C. Then the absorbance at 652 nm was detected.In the assay of 2,4-D detection on test paper, a dried strip of absorbent paper was pretreated with TMB solution (0.33 mM). ALP (5 μL, 810 U L−1), 2,4-D (6 μL, 6 g L−1), AAP (10 μL, 10 mM), Co-hemin (15 μL, 1 mg mL−1), and HAc–NaAc buffer (37 μL, 0.4 M, pH 4.5) were mixed together and dropped on the absorbent paper.
2.3 The selectivity and specificity of Co-hemin
The selectivity of Co-hemin was evaluated by monitoring the absorbance peaks at 652 nm in the presence of different interferents. The concentrations of interferents were 2.5 times higher than that of 2,4-D in the reaction. Moreover, the specificity of Co-hemin was evaluated by measuring the absorbance at 652 nm in the presence of 2,4-D and one of the interferents.2.4 The practical detection of 2,4-D by Co-hemin
In a typical assay, two practical samples of tap water and serum were respectively diluted ten times. In a typical assay, ALP (5 μL, 810 U L−1) and 2,4-D (1 μL, 6 g L−1) were reacted for 15 min, AAP (10 μL, 10 mM) was added for another 20 min, and finally, 72 μL of the above diluted sample, TMB solution (10 μL, 5 mM), HAc–NaAc buffer (37 μL, 0.4 M, pH 4.5), and Co-hemin (15 μL, 1 mg mL−1) were mixed and incubated for 10 min at 25 °C. The absorbance at 652 nm was measured.Then, 2,4-D was detected in real rice and apple samples. First, rice and apple were ground into powder or paste, and then dichloromethane (2 mL g−1) was added under vigorous vibration for 30 min. After filtering with a 0.45 μm microfiltration membrane, the obtained extract was further used for 2,4-D detection.
2.5 The colorimetric analysis of 2,4-D
The colorimetric images were acquired using the camera of a smartphone. The RGB values based on the three basic primary colors of red, green and blue, were evaluated using smartphone software Photoshop. The total content of three primary colors was calculated using the following equation: PC = PR + PG + PB. The proportion of PB in the total content was calculated using the following equation: ratio = PB/PC = PB/(PR + PG + PB).2.6 The logic gates of 2,4-D and ALP
In the “IMPLICATION” logic gate, 2,4-D and ALP were used as inputs, and the absorption values of oxTMB at 652 nm acted as the output signal. In the presence of 2,4-D, a mixture of 2,4-D (6 μL, 6 g L−1), AAP (10 μL, 10 mM), TMB solution (10 μL, 5 mM), HAc–NaAc buffer (37 μL, 0.4 M, pH 4.5), Co-hemin (15 μL, 1 mg mL−1) and 72 μL of sterile water, was incubated at 25 °C for 10 min. Then the absorbance at 652 nm was detected.In the “NOR” logic gate, ALP and AA were used as inputs, and the absorbance peaks of oxTMB at 652 nm acted as the output signals. In the presence of ALP, ALP (5 μL, 810 U L−1) and AAP (10 μL, 10 mM) were reacted for 20 min first, and next TMB solution (10 μL, 5 mM), HAc–NaAc buffer (37 μL, 0.4 M, pH 4.5), Co-hemin (15 μL, 1 mg mL−1) and sterile water (73 μL) were sequentially added for 10 min at 25 °C before further detection. In the “INHIBIT” logic gate, ALP and Co-hemin were used as inputs, and the absorbance values of oxTMB at 652 nm acted as the output signals. In the presence of Co-hemin, AAP (10 μL, 10 mM), TMB solution (10 μL, 5 mM), HAc–NaAc buffer (37 μL, 0.4 M, pH 4.5), Co-hemin (15 μL, 1 mg mL−1) and sterile water (78 μL) were mixed and incubated for 10 min before further detection.
3. Results and discussion
3.1 Design and detection principle
In this work, as shown in Scheme 1a, a novel MOF named Co-hemin was synthesized using hemin and cobalt ions. The Co-hemin MOF with oxidase-like activity could oxidize TMB to oxTMB with the solution color changing from colorless into blue. In the presence of AAP and ALP, the TMB solution showed no color change, because Co-hemin was degraded by AA which could be generated by the catalytic hydrolysis of AAP. But, the inhibitor 2,4-D could specifically suppress the activity of ALP which blocked the generation of AA and further prohibited the degradation of Co-hemin, so TMB changed from colorless into blue. The colorimetric detection of 2,4-D could be observed by the naked eye and using a smartphone based on the RGB analysis system. Moreover, as shown in Scheme 1b, the expanded applications of constructing complex logic gates of 2,4-D were provided. An “IMPLICATION” logic gate was constructed on the basis of the oxidase-like activity of Co-hemin which was modulated by ALP and 2,4-D. In this logic gate, ALP and 2,4-D acted as inputs and the absorbance peaks of TMB at 652 nm acted as output signals. In the presence of ALP and 2,4-D, the state was defined as “1”, and Co-hemin maintained good integrity and oxidized TMB to oxTMB, due to the activity of ALP inhibited by 2,4-D. In the “NOR” logic gate, ALP and AA acted as inputs and the absorbance peaks of TMB at 652 nm acted as output signals. In the presence of ALP and AA, the state was defined as “0”, Co-hemin could be degraded by AA and TMB exhibited few changes. As far as we know, the novel Co-hemin MOF was first reported, which could be used for colorimetric detection without added H2O2. Also, the Co-hemin MOF was first used for on-site monitoring of 2,4-D.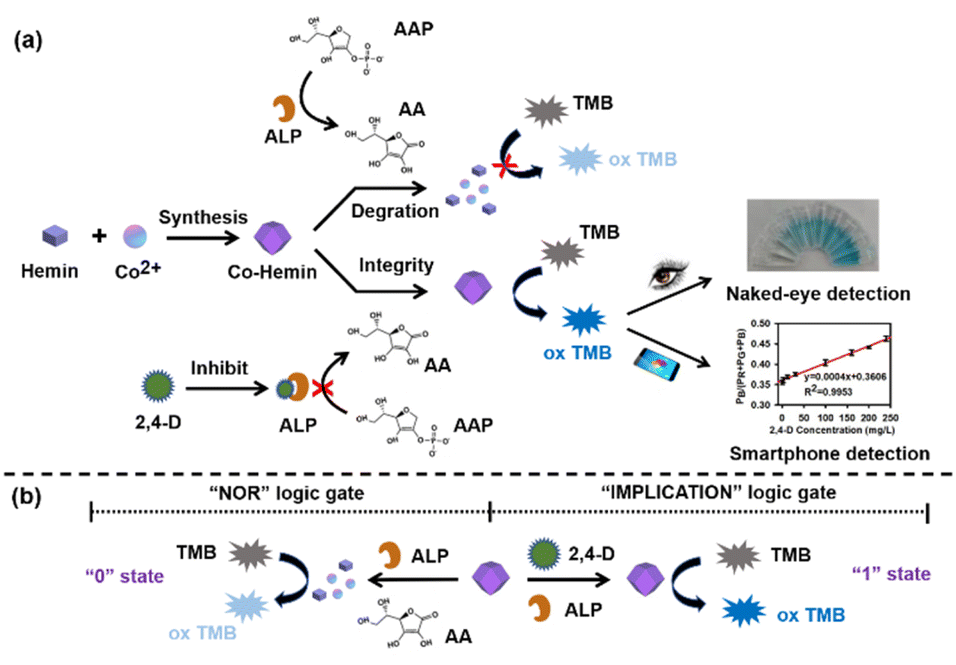 | ||
| Scheme 1 Illustration of Co-hemin for 2,4-D detection, (a) the visual colorimetric detection and (b) the applications of logic gates. | ||
3.2 Synthesis and characterization of Co-hemin
Co-hemin was prepared by mixing cobalt chloride and hemin. The morphology of Co-hemin was characterized by scanning electron microscopy (SEM). As shown in Fig. 1A, the morphology of Co-hemin displayed a regular sphere-like structure and the diameter was about 4 μm. The above Co-hemin MOFs were thought to be formed via a linkage between Co2+ and the carboxyl groups at hemin. To verify this, the crystalline structures of Co-hemin and hemin were detected by the X-ray diffraction (XRD) analysis (Fig. 1B). In contrast to the diffraction peaks of hemin, some diffraction peaks of Co-hemin solely appeared, suggesting that the sphere-like structure was a crystalline material. In the Fourier transform infrared (FT-IR) spectra (Fig. 1C), both hemin and Co-hemin exhibited obvious peaks for O–H at 3442 cm−1. For the peak at 1701 cm−1 which was ascribed to C![[double bond, length as m-dash]](https://www.rsc.org/images/entities/char_e001.gif) O stretching vibration (purple vertical line), the peak was smaller in the curve of Co-hemin due to the coordination between –COOH groups and Co2+ ions. Moreover, the UV-vis absorbance spectra of hemin, CoCl2 and Co-hemin were detected, as shown in Fig. S1,† and the adsorption peaks of hemin and CoCl2 respectively appeared at 395 nm and 510 nm. However, the absorption peak of Co-hemin exhibited a redshift with a wider absorption range between 400 and 800 nm, possibly due to the stronger conjugate interaction inside the Co-hemin MOF. In addition, the mapping analysis of energy dispersive X-ray spectroscopy (EDS) for C, N, O, Fe and Co elements showed that the element Fe was evenly distributed on the composites (Fig. S2†), indicating the successful synthesis of the Co-hemin MOF by combining hemin and Co ions.
O stretching vibration (purple vertical line), the peak was smaller in the curve of Co-hemin due to the coordination between –COOH groups and Co2+ ions. Moreover, the UV-vis absorbance spectra of hemin, CoCl2 and Co-hemin were detected, as shown in Fig. S1,† and the adsorption peaks of hemin and CoCl2 respectively appeared at 395 nm and 510 nm. However, the absorption peak of Co-hemin exhibited a redshift with a wider absorption range between 400 and 800 nm, possibly due to the stronger conjugate interaction inside the Co-hemin MOF. In addition, the mapping analysis of energy dispersive X-ray spectroscopy (EDS) for C, N, O, Fe and Co elements showed that the element Fe was evenly distributed on the composites (Fig. S2†), indicating the successful synthesis of the Co-hemin MOF by combining hemin and Co ions.
 | ||
| Fig. 1 Characterization of Co-hemin. (A) SEM images; (B) XRD patterns of hemin and Co-hemin; (C) FT-IR spectra of hemin and Co-hemin. | ||
Moreover, the chemical states of each element in Co-hemin were detected by X-ray photoelectron spectroscopy (XPS). The survey spectrum of the Co-hemin sample clearly demonstrated the existence of C, N, O, Fe and Co elements (Fig. S3A†). All the spectra were calibrated according to the binding energy of C 1s located at 284.8 eV (Fig. S3B†). The high resolution XPS spectrum of C 1s could be fitted into four peaks at binding energies of around 284.78 eV, 285.28 eV, 285.43 eV and 288.53 eV (Fig. S3B†), illustrating the coexistence of C–C, CN, C–OR and COOR, respectively. The main peak (398.48 eV) in the N 1s spectrum was assigned to the amino groups (Fig. S3C†). The main peak (530.13 eV) in the O 1s spectrum was assigned to the OH– species (Fig. S3D†). As shown in Fig. S3E,† the main peaks (712.53 eV and 724.58 eV) in the Fe 2p XPS spectrum were assigned to the Fe3+ ions, suggesting the successful synthesis of Co-hemin. As shown in Fig. S3F,† the main peaks (782.43 eV and 780.53 eV) in the Co 2p XPS spectrum were assigned to the Co3+ ions and Co2+ ions, implying the multi-valency of Co ions in the Co-hemin MOF. In addition, the thermal stability of Co-hemin was detected by TGA. The result showed that Co-hemin remained stable at 180 °C (Fig. S4,† red curve). Taken together, these results demonstrated that the method provided a facile, fast and consistent synthesis of Co-hemin.
3.3 The performance of Co-hemin for colorimetric assay
First, the changes in the oxidase-like activities of hemin before and after formation into the Co-hemin MOF were investigated. As shown in Fig. S5,† in the presence of hemin, the absorbance values of TMB at 652 nm exhibited few changes with the increased reaction time. However, when the same amount of hemin formed into Co-hemin, the absorbance values of TMB at 652 nm gradually increased with the increased reaction time. These results indicated that the oxidase-like activities of hemin enhanced after formation into the Co-hemin MOF, probably due to the large amounts of hemin gathered together.Furthermore, the potential use of Co-hemin for colorimetric assay was explored. As shown in Fig. 2A, the absorbance peaks of TMB at 652 nm increased with the varied concentrations of Co-hemin from 0 to 133 μg mL−1, due to the oxidase-like activity of Co-hemin which could oxidize TMB to oxTMB. Correspondingly, the color of Co-hemin–TMB reaction solution gradually changed from colorless to bright blue with the increasing concentrations of Co-hemin (image a in Fig. 2B), which could be intuitively observed by the naked eye. When the concentration of Co-hemin was 100 μg mL−1, the reaction solution exhibited good bright blue, so we selected 100 μg mL−1 of Co-hemin for follow-up experiments. To explore the availability of this colorimetric reaction on test paper, 100 μg mL−1 of Co-hemin was dropped on a dried strip of absorbent paper that was pretreated with TMB solution (0.33 mM). Compared with the colorless test strip containing only TMB or Co-hemin, the Co-hemin–TMB test strip exhibited blue color after 10 min (image b in Fig. 2B), suggesting the compatibility of the Co-hemin sensor based on paper.
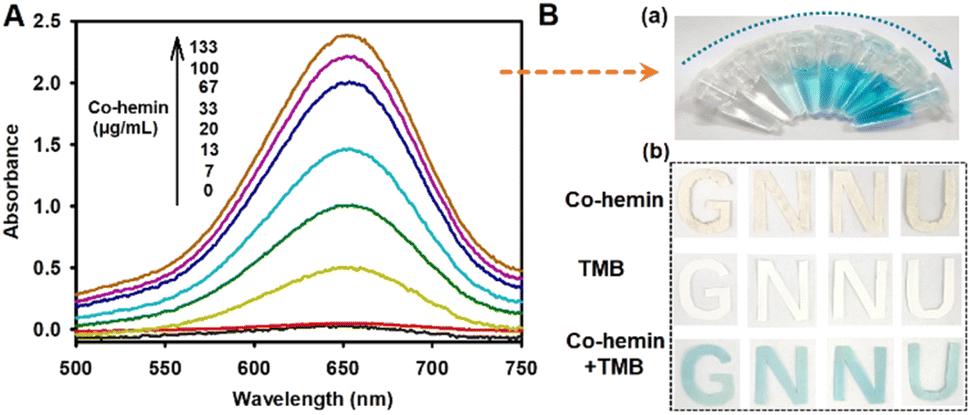 | ||
| Fig. 2 The enzyme-like activity of Co-hemin. (A) The UV-vis absorption spectra recording the Co-hemin concentration dependent oxidation of TMB. (B) Images of the corresponding Co-hemin concentration dependent color change (a) and the Co-hemin–TMB color reaction performed on “GNNU” shaped absorbent paper (b). | ||
3.4 Detection of AA using Co-hemin
Then, the feasibility of Co-hemin for AA detection was investigated. As depicted in Fig. S6,† the absorbance peak of Co-hemin at 400 nm gradually reduced with the increasing concentrations of AA, indicating that the Co-hemin MOF could be degraded by AA. Furthermore, the Co-hemin–TMB reaction system was used for the colorimetric detection of AA. As shown in Fig. S7A,† the absorbance peak of TMB at 652 nm gradually decreased with the varied concentrations of AA from 0 to 0.47 mM. The corresponding relationship between the UV absorbance and the concentrations of AA showed the same results (Fig. S7B†). The corresponding colorimetric reaction changed from bright blue to colorless with the increasing concentrations of AA (Fig. S7C†). The ratios of PB to Pc (the sum of PR, PG and PB) gradually decreased with the increasing concentrations of AA, which were consistent with the colorimetric images (Fig. S7C†). Taken together, these results indicated that the Co-hemin biosensor could be used for the colorimetric detection of AA.3.5 Detection of ALP using Co-hemin
As we know, alkaline phosphatase (ALP) could catalytically hydrolyze ascorbic acid-2-phosphate trisodium salt (AAP) into AA.26,27 To explore the compatibility of Co-hemin for ALP detection, the time optimization of ALP detection was first investigated. As can be seen in Fig. S8,† with the increasing reaction time, the absorbance peak of Co-hemin at 400 nm gradually decreased and reached the platform value at 20 min, so we selected 20 min as the optimal time. Then, the feasibility of Co-hemin for ALP detection was investigated. As shown in Fig. S9A,† with the increasing concentrations of ALP, the absorbance peak of TMB gradually decreased, due to the degradation of Co-hemin by AA which was generated from ALP catalytically decomposed AAP. The corresponding relationship between the UV absorbance values and the concentrations of ALP showed the same results (Fig. S9B†). When the concentration of ALP was 27 U L−1, the absorbance peak of TMB at 652 nm reached the platform value, so we selected 27 U L−1 of ALP as the optimal concentration for follow-up experiments. The corresponding colorimetric reaction changed from bright blue to colorless with the increasing concentrations of ALP (Fig. S9C†). The ratios of PB to Pc gradually decreased with the increasing concentrations of ALP, which were consistent with the colorimetric images (Fig. S9C†). Taken together, these results implied that the Co-hemin biosensor could be used for the colorimetric detection of ALP.3.6 Detection of 2,4-D using Co-hemin
Furthermore, the feasibility of 2,4-D detection by Co-hemin was investigated. As shown in Fig. 3A, with Co-hemin, the solution mixture exhibited high absorbance peak at 652 nm and changed from colorless to blue (blue curve). When AAP or ALP was solely added, there were few changes in the absorbance peak (light red curve and cyan curve), and also the solution maintained blue color. When we added AAP and ALP together, the TMB solution exhibited a low absorbance peak at 652 nm and showed colorless (purple curve). These results indicated that TMB could be oxidized by Co-hemin which could be degraded by AA generated from ALP decomposed AAP. When 2,4-D was solely added, the TMB solution showed a low absorbance peak at 652 nm and became colorless (blue curve), indicating that 2,4-D had no influence on the TMB colorimetric system. When ALP and 2,4-D were reacted for 30 min first, and then AAP and Co-hemin were added together, the solution exhibited a high absorbance peak at 652 nm and maintained blue (brown curve). Because 2,4-D served as an inhibitor of ALP,28 the result indicated that the activity of ALP had been inhibited by 2,4-D, which blocked the degradation of Co-hemin. The corresponding ratios of PB to Pc were consistent with the colorimetric images (Fig. 3B). Then the 2,4-D detection on absorbent paper was investigated. As shown in Fig. S10,† the Co-hemin test strip exhibited no color change in the presence of ALP and AAP, but the Co-hemin test strip exhibited blue color after ALP was treated with 2,4-D. These results were consistent with the similar sample results in Fig. 3A, indicating the feasibility of 2,4-D detection using the Co-hemin sensor on absorbent paper.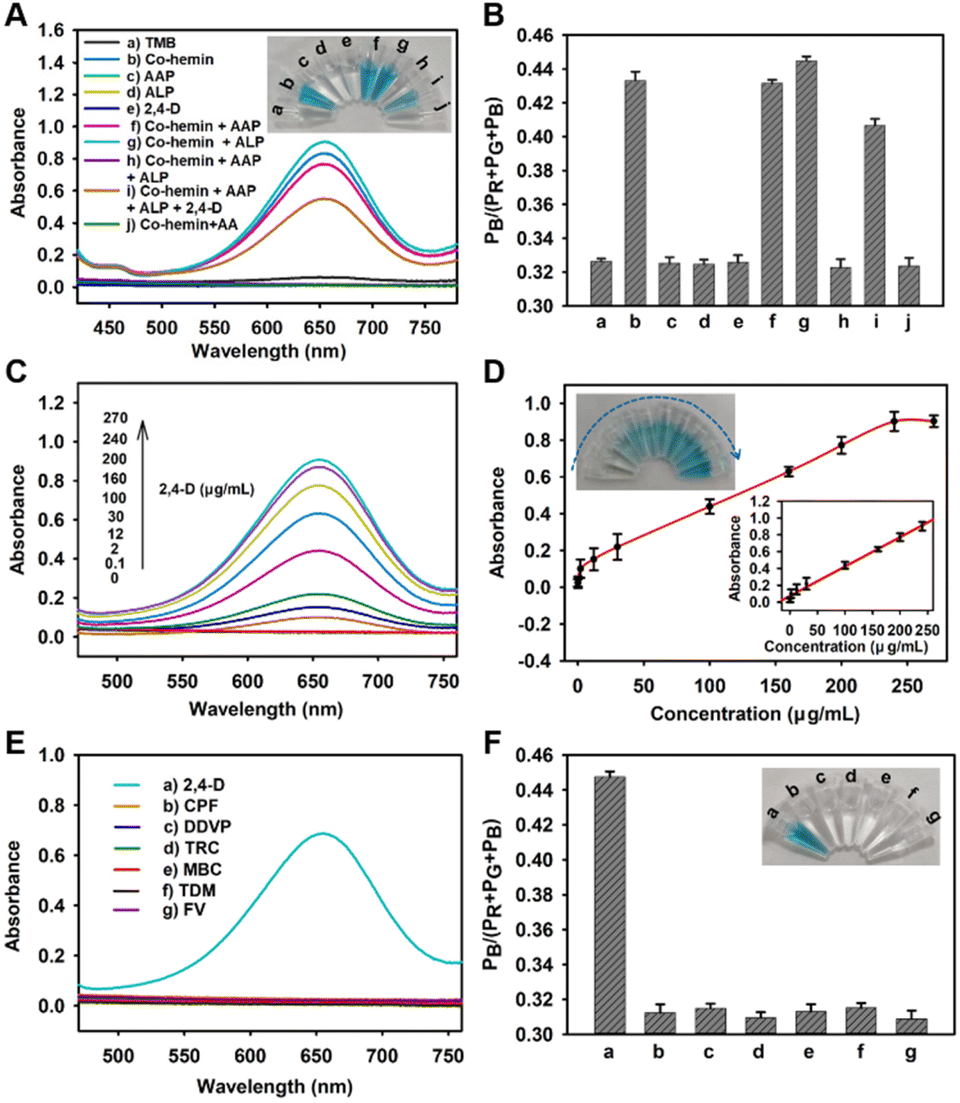 | ||
| Fig. 3 The 2,4-D detection by Co-hemin. (A) The feasibility, inset: the colorimetric image and (B) corresponding RGB calculations. (C) The 2,4-D detection with different concentrations and (D) the corresponding relationship between the UV absorbance and amount of 2,4-D, inset: the corresponding linear relationship and colorimetric image. (E) The selectivity and (F) corresponding RGB calculations, inset: the colorimetric image. Error bars represent the standard deviation of three parallel experiments. | ||
Moreover, the performance of Co-hemin for 2,4-D was investigated. With the concentrations of 2,4-D increasing from 0 to 270 μg mL−1, the absorbance of TMB increased gradually (Fig. 3C) and exhibited a linear range from 0.1 μg mL−1 to 240 μg mL−1 (Fig. 3D). Moreover, the detection limit was estimated to be 33 ng mL−1 (in terms of the rule of 3 times deviation over the blank response). The value was lower than that with the restricted concentration of 70 ng mL−1 of 2,4-D in drinking water which is regulated by the WHO.29 Moreover, a comparison with previous approaches showed that the proposed Co-hemin biosensor performed well with an acceptable LOD and a linear range (Table S1†). With the increasing concentrations of 2,4-D, the ratios of PB to Pc gradually increased and exhibited a detection limit of 66 ng mL−1 (Fig. S11†), suggesting that the Co-hemin biosensor could be used for portable and visual colorimetric detection of 2,4-D.
To evaluate the selectivity of the Co-hemin sensor, other common pesticides including chlorpyrifos (CPF), dichlorphos (DDVP), trichlorfon (TRC), carbendazim (MBC), triazolone (TDM) and fenvalerate (FV) were selected as interferents. As shown in Fig. 3E, even though the concentrations of other interferents were 2.5 times higher than that of 2,4-D, the absorbance values of other interferents at 652 nm were still lower than that of the 2,4-D sample. These results could be intuitively seen by the naked eye, as shown in Fig. 3F. Compared to other interferents, only the sample of 2,4-D exhibited bright blue, and these results were consistent with those of the RGB calculations, implying the good selectivity of Co-hemin for 2,4-D detection. Next, the specificity of 2,4-D detection was investigated. As can be seen in Fig. S12,† when 2,4-D and other interferents (such as CPF, DDVP, TRC, MBC, TDM and FV) were added together, the absorbance values at 652 nm exhibited few changes (Fig. S12A†), and also the solution exhibited bright blue with a slight difference (Fig. S12B†). These results were consistent with those of the RGB calculations (Fig. S12C†), indicating that the Co-hemin biosensor could be specially used for 2,4-D detection.
To further investigate the accuracy and practicability of the Co-hemin biosensor, the concentrations of 2,4-D in serum and tap water were detected by colorimetry and the HPLC method. Each sample was detected three times. As shown in Table S2,† the 2,4-D concentrations in serum and tap water with the Co-hemin biosensor were nearly consistent with the added 2,4-D concentrations, the recovery rate ranged from 89.4–113% and the experiment standard deviations ranged in 1.1–4.4% by colorimetry. Also the recovery rate ranged from 87.8–111.9% and the experiment standard deviations ranged from 1.5–3.3% by the HPLC method. The results obtained with the proposed colorimetric sensor were well consistent with those obtained with HPLC. These results proved that the Co-hemin colorimetric biosensor was suitable for 2,4-D detection in real samples.
To evaluate the applicability of the Co-hemin sensor in real food samples, 2,4-D in rice and apple samples was detected. To eliminate the interfering influence of water-soluble AA, we selected dichloromethane as the solvent for extracting 2,4-D. As shown in Table S3,† the spiked recovery rate ranged from 88–115% and the experiment standard deviations ranged from 1.2–3.2% by colorimetry; also the recovery rate ranged from 85–110% and the experiment standard deviations ranged from 1.3–2.8% by the HPLC method. Taken together, these results indicated the feasibility of 2,4-D detection in real samples.
3.7 The logic gates of the Co-hemin biosensor
In order to improve the application of the Co-hemin biosensor in biosensing and medical diagnostics, according to the reported logic gates of ALP based on a 2D-MOF,30 the molecular logic gates of 2,4-D based on Co-hemin were constructed. As depicted in Fig. 4C, an “IMPLICATION” logic gate was constructed on the basis of the oxidase-like activity of Co-hemin which was modulated by ALP and 2,4-D. In the logic gate, 2,4-D and ALP were used as inputs, and the absorption values of oxTMB at 652 nm acted as the output signals. For the input, for example, in the absence of 2,4-D, the state was defined as “0”, but in the presence of 2,4-D, the state was defined as “1”. For the output, an absorption value of less than 0.1 was defined as “0”, but more than 0.1 was defined as “1”. As shown in Fig. 4B, when ALP solely existed and the states were defined as (1, 0), the catalytic activity of Co-hemin could be efficiently inhibited and the output was “0”. But, in other cases, Co-hemin exhibited excellent oxidase-like activities and the output signals were “1”. In addition to an “IMPLICATION” logic gate, an “INHIBIT” logic gate and a “NOR” logic gate had been constructed. As shown in Fig. S13,† the “INHIBIT” logic gate was developed by using ALP and Co-hemin as inputs, and only in the presence of Co-hemin, the output signal was “1”. As shown in Fig. S14,† the “NOR” logic gate was constructed by using ALP and AA as inputs, and only in the absence of ALP and AA, the output signal was “1”. Taken together, these results demonstrated the potential application of the Co-hemin biosensor for constructing logic gates for colorimetric detection of 2,4-D. | ||
| Fig. 4 The “IMPLICATION” logic gate, (A) kinetics curves, and (B) the histogram of the “IMPLICATION” logic gate. Error bars represent the standard deviation of three parallel experiments. (C) The schematic diagram of the “IMPLICATION” logic gate. | ||
4. Conclusions
In summary, a novel Co-hemin MOF with oxidase-like activity, was synthesized and first used for 2,4-D colorimetric detection. In virtue of introducing ALP, the Co-hemin biosensor exhibited specific recognition capacity of 2,4-D, endowing it with high-performance in selectivity, and due to this ALP could hydrolyze AAP into AA that could on situ etch Co-hemin, and the activity of ALP could be inhibited by 2,4-D. Moreover, in the detection of 2,4-D, the Co-hemin biosensor exhibited a wide linear range from 0.1 μg mL−1 to 240 μg mL−1 and a relatively low detection limit of 33 ng mL−1. In addition, a portable smartphone based RGB analysis system provided a promising platform for the on-site colorimetric monitoring of 2,4-D and exhibited a detection limit of 66 ng mL−1 which could be observed by the naked eye. Moreover, the Co-hemin-based colorimetric biosensor was successfully applied to actual samples, such as serum, tap water, rice and apples. What's more, the extended assays were adopted to construct molecular logical gates and displayed good applications. As a result, the proposed method provides a portable and visual platform for on-site monitoring of 2,4-D and holds great potential in biomedical diagnosis, environmental estimation and health monitoring.Author contributions
Jintao Yi: methodology, writing-original draft, funding acquisition. Xianqin Han, Lingli Wu and Youtan Wang: project administration, data curation. Qi Zhu and Jun Xue: software, formal analysis. Xiaoqi Lai: methodology. Hui Zhou: writing-review & editing, funding acquisition. All authors have read and agreed to the published version of the manuscript.Conflicts of interest
The authors declare no competing financial interest.Acknowledgements
We are grateful to the National Natural Science Foundation of China (Grant No.21864004) and Fundamental Research Funds for the Education Department of Jiangxi Province (Grant No. GJJ201444 and GJJ201430) for their financial support.References
- D. H. Garabrant and M. A. Philbert, Crit. Rev. Toxicol., 2002, 32, 233–257 CrossRef.
- M. M. Ding, W. Chen, H. Xu, Z. Shen, T. Lin, K. Hu, Q. Kong, G. Yang and Z. L. Xie, Chem. Eng. J., 2019, 378, 122177–122187 CrossRef.
- K. Li, J. Q. Wu, L. L. Jiang, L. Z. Shen, J. Y. Li, Z. H. He, P. Wei, Z. Lv and M. F. He, Chemosphere, 2017, 171, 40–48 CrossRef.
- G. FuSco, F. Gallo, C. Tortolini, P. Bollella, F. Ietto, A. D. Mico, A. D'Annibale, R. Antiochia, G. Favero and F. Mazzei, Biosens. Bioelectron., 2017, 93, 52–56 CrossRef PubMed.
- J. J. Cai, M. H. Zhou, W. L. Yang, Y. W. Pan, X. Y. Lu and K. G. Serrano, Chemosphere, 2018, 212, 784–793 CrossRef PubMed.
- H. Chen, Z. L. Zhang, Z. L. Yang, Q. Yang, B. Li and Z. Y. Bai, Chem. Eng. J., 2015, 273, 481–489 CrossRef.
- M. Kermani, F. Mohammadi, B. Kakavandi, A. Esrafili and Z. Rostamifasih, J. Phys. Chem. Solids, 2018, 117, 49–59 CrossRef CAS.
- Y. Xu, F. Y. H. Kutsanedzie, Md. M. Hassan, J. J. Zhu, H. H. Li and Q. S. Chen, Sens. Actuators, B, 2020, 324, 128718–128726 CrossRef.
- K. G. Kim, D. W. Park, G. R. Kang, T. S. Kim, Y. Yang, S. J. Moon, E. A. Choi, D. R. Ha, E. S. Kim and B. S. Cho, Food Chem., 2016, 208, 239–244 CrossRef.
- X. X. Zhu, J. F. Li, B. Xie, D. Q. Feng and Y. M. Li, Chem. Eng. J., 2020, 391, 123605–123617 CrossRef.
- G. F. Qin, K. T. Zou, L. Tian and Y. B. Li, Food Anal. Methods, 2018, 11, 2628–2635 CrossRef.
- B. V. Goulart, B. D. C. Vizioli, E. L. G. Espindola and C. C. Montagner, Environ. Monit. Assess., 2020, 192, 797–809 CrossRef PubMed.
- O. Cakir, M. Bakhshpour, F. Yilmaz and Z. Baysal, Mater. Sci. Eng., C, 2019, 102, 483–491 CrossRef CAS PubMed.
- Z. F. Li, J. X. Dong, N. Vasylieva, Y. L. Cui, D. B. Wan, X. D. Hua, J. Q. Huo, D. C. Yang, S. J. Gee and B. D. Hammock, Sci. Total Environ., 2021, 753, 141950–1419959 CrossRef CAS PubMed.
- K. Skrzypczynska, K. Kuśmierek and A. Świątkowski, J. Electroanal. Chem., 2016, 766, 8–15 CrossRef CAS.
- X. Y. Ye, F. Zhang, L. Yang, W. J. Yang, L. Y. Zhang and Z. W. Wang, Talanta, 2022, 245, 123489–123497 CrossRef CAS PubMed.
- D. W. Jiang, D. L. Ni, Z. T. Rosenkrans, P. Huang, X. Y. Yan and W. B. Cai, Chem. Soc. Rev., 2019, 48, 3683–3704 RSC.
- Q. Li, J. Niu, M. L. Dou, Z. P. Zhang and F. Wang, Chin. Chem. Lett., 2021, 32, 1181–1185 CrossRef CAS.
- Y. Zhang, L. Jiao, W. Q. Xu, Y. F. Chen, Y. Wu, H. Y. Yan, W. L. Gu and C. Z. Zhu, Chin. Chem. Lett., 2022, 33, 1317–1320 CrossRef CAS.
- C. Wang, B. An and W. B. Lin, ACS Catal., 2019, 9, 130–146 CrossRef CAS.
- N. Alizadeh, A. Salimi, R. Hallaj, F. Fathi and F. Soleimani, J. Nanobiotechnol., 2018, 16, 93–97 CrossRef CAS PubMed.
- H. L. Zou, B. L. Li, H. Q. Luo and N. B. Li, Sens. Actuators, B, 2015, 207, 535–541 CrossRef CAS.
- L. Mi, Y. D. Sun, L. Shi and T. Li, ACS Appl. Mater. Interfaces, 2020, 12, 7879–7887 CrossRef.
- J. T. Yi, X. Q. Han, F. Y. Gao, L. Cai, Y. Chen, X. L. Deng, X. Li, J. Xun and H. Zhou, RSC Adv., 2022, 12, 20544–20549 RSC.
- H. S. Choi, X. G. Yang, G. C. Liu, D. S. Kim, J. H. Yang, J. H. Lee, S. O. Han, J. Y. Lee and S. W. Kim, J. Taiwan Inst. Chem. Eng., 2020, 113, 1–7 CrossRef.
- Y. X. Han, J. Chen, Z. Li, H. L. Chen and H. D. Qiu, Biosens. Bioelectron., 2020, 148, 111811–111822 CrossRef PubMed.
- H. B. Wang, B. B. Tao, N. N. Wu, H. D. Zhang and Y. M. Liu, Spectrochim. Acta, Part A, 2022, 271, 120948–120957 CrossRef PubMed.
- Y. Liu, M. Xiao, N. X. Xu, M. S. Yang and C. Q. Yi, Sens. Actuators, B, 2022, 367, 132083–132092 CrossRef CAS.
- D. Hamilton, A. Ambrus, R. Dieterle, A. Felsot, C. Harris, P. Holland, A. Katayama, N. Kurihara, J. Linders, J. Unsworth and S. Wong, Pure Appl. Chem., 2003, 75, 1123–1155 Search PubMed.
- X. Y. Wang, X. Q. Jiang and H. Wei, J. Mater. Chem. B, 2020, 8, 6905–6911 RSC.
Footnote |
| † Electronic supplementary information (ESI) available. See DOI: https://doi.org/10.1039/d2ay01694j |
| This journal is © The Royal Society of Chemistry 2023 |