 Open Access Article
Verification of exposure to chemical warfare agents through analysis of persistent biomarkers in plants†
Mirjam
de Bruin-Hoegée
 *ab,
Latifa
Lamriti
ab,
Jan P.
Langenberg
b,
René C. M.
Olivier
b,
Lai Fun
Chau
b,
Marcel J.
van der Schans
b,
Daan
Noort
b and
Arian C.
van Asten
ac
avan 't Hoff Institute for Molecular Sciences, Faculty of Science, University of Amsterdam, P.O. Box 94157, 1090GD Amsterdam, Netherlands
bTNO Defence, Safety and Security, Dep. CBRN Protection, Lange Kleiweg 137, 2288GJ Rijswijk, Netherlands. E-mail: mirjam.debruin@tno.nl
cCLHC, Amsterdam Center for Forensic Science and Medicine, University of Amsterdam, P.O. Box 94157, 1090GD Amsterdam, Netherlands
First published on 16th December 2022
Abstract
The continuing threats of military conflicts and terrorism may involve the misuse of chemical weapons. The present study aims to use environmental samples to find evidence of the release of such agents at an incident scene. A novel approach was developed for identifying protein adducts in plants. Basil (Ocimum basilicum), bay laurel leaf (Laurus nobilis) and stinging nettle (Urtica dioica) were exposed to 2.5 to 150 mg m−3 sulfur mustard, 2.5 to 250 mg m−3 sarin, and 0.5 to 25 g m−3 chlorine gas. The vapors of the selected chemicals were generated under controlled conditions in a dedicated set-up. After sample preparation and digestion, the samples were analyzed by liquid chromatography tandem mass spectrometry (LC-MS/MS) and liquid chromatography high resolution tandem mass spectrometry (LC-HRMS/MS), respectively. In the case of chlorine exposure, it was found that 3-chloro- and 3,5-dichlorotyrosine adducts were formed. As a result of sarin exposure, the o-isopropyl methylphosphonic acid adduct to tyrosine could be analyzed, and after sulfur mustard exposure the N1- and N3-HETE-histidine adducts were identified. The lowest vapor exposure levels for which these plant adducts could be detected, were 2.5 mg m−3 for sarin, 50 mg m−3 for chlorine and 12.5 mg m−3 for sulfur mustard. Additionally, protein adducts following a liquid exposure of only 2 nmol Novichock A-234, 0.4 nmol sarin and 0.2 nmol sulfur mustard could still be observed. For both vapor and liquid exposure, the amount of adduct formed increased with the level of exposure. In all cases synthetic reference standards were used for unambiguous identification. The window of opportunity for investigation of agent exposure through the analysis of plant material was found to be remarkably long. Even three months after the actual exposure, the biomarkers could still be detected in the living plants, as well as in dried leaves. An important benefit of the current method is that a relatively simple and generic sample work-up procedure can be applied for all agents studied. In conclusion, the presented work clearly demonstrates the possibility of analyzing chemical warfare agent biomarkers in plants, which is useful for forensic reconstructions, including the investigation into alleged use in conflict areas.
1. Introduction
The importance of the Chemical Weapons Convention is highlighted by recent concerns of potential chemical attacks in Ukraine.1 Over the last ten years, violations of the convention have taken place in the ongoing conflict in the Syrian Arab Republic, where the Organisation for the Prohibition of Chemical Weapons (OPCW) verified multiple attacks with sulfur mustard, sarin, and the toxic dual-use chemical chlorine.2–6 More recently, Alexei Navalny, Sergei Skripal and four other individuals were poisoned by different nerve agents belonging to the group of Novichocks.7,8 These chemical warfare agents (CWAs) exert the same mechanism of action as other organophosphate nerve agents, although they are expected to be even more potent.9,10 These incidents emphasize that there is a continued risk of the use of CWAs in both large-scale attacks as well as small scale deployment. Because of the high impact of these events, often extensive international investigations are being conducted to verify the use of chemical weapons.Analytical methods for the detection of chemical threat agents in matrices such as organic solvents, air samples,11–13 soil,14,15 wipe16,17 and other solid materials have been broadly investigated.18 However, detection of intact agents is often not possible due to the relatively high volatility and reactivity of these chemicals.19 In such cases, biomedical samples may provide evidence for a longer period of time, where persistent biomarkers can be used for verification.20,21 Nonetheless, it may be problematic to get access to human biological samples because of ethical, cultural and safety reasons. In addition, it might be difficult to link the victims to the actual exposure area. In contrast, environmental samples such as plant leaves are abundant, easy to collect and transport, and not subject to informed consent or ethic regulations as is the case with human biomedical samples. The use of plant evidence has been scarcely examined for the presence of the intact CWAs or associated degradation products.22–26 In addition, a news article reported that researchers at Lawrence Livermore National Laboratory identified small chlorine biomarkers and protein adducts in grass.27 However, to our knowledge, no research article has been published that specifically targets plant protein adducts to demonstrate CWA exposure. We hypothesize that combining the analysis of environmental samples with methods applied to biomedical samples could provide powerful new options to investigate CWA exposure at an incident site long after the alleged release of the agent.
Most CWAs and toxic industrial chemicals can form covalent, long-lasting adducts with proteins.28 This principle has formed the basis for analyzing biomedical samples for verification of exposure to such chemicals. Previous studies have shown that in case of human exposure to sulfur mustard, histidine protein adducts are formed.29 After exposure to nerve agents, such as sarin and Novichok A-234, phosphorylated serines or tyrosines are formed as specific biomarkers.30–32 Likewise, mono- and dichlorinated tyrosine adducts are the major protein markers for the presence of chlorine.33,34
Also, plants also contain a lot of proteins, with ribulose-1,5-bisphosphate carboxylase-oxygenase (rubisco) being the most abundant protein on earth.35 As a result, plant proteins could serve as potential scavengers for chemical threat agents and might form protein adducts in a similar way as unraveled for humans. Abundantly occurring plants, representing a wide range of vegetation, are bay laurel leaf (Laurus nobilis), basil (Ocimum basilicum) and stinging nettle (Urtica dioica), depicted in Fig. 1. Stinging nettle is a rapidly growing weed with a high protein content and is originally native to Europe.36,37 In contrast, basil thrives in tropical and subtropical climates and is an aromatic herb and medicinal plant.38 Bay laurel leaf is used as a herb in many traditional practices and recipes, originating from the Mediterranean region, Asia, South and North America, and the Balkans.39 It is expected that these species will be sufficiently representative to study CWA biomarker occurrence in plants in general. This will allow the use of the presented methodology for any type of vegetation encountered on the incident scene.
 | ||
| Fig. 1 Photo of leaves of selected plants. (A) Bay laurel leaf (Laurus nobilis), (B) Basil (Ocimum basilicum), (C) Stinging nettle (Urtica dioica). | ||
Consequently, the aim of the current study was to explore whether persistent biomarkers of various CWAs could be detected in plants after vapor and liquid exposure. A novel approach was developed for analyzing modified protein adducts in vegetation, a strategy that to our knowledge has not been reported in literature before. The model plants used in this study were exposed to sulfur mustard, sarin, chlorine or Novichok nerve agent A-234. After exposure, leaves were collected, cut into small pieces, and washed to remove excess of intact CWA. The plant material was dried, then digested by pronase or trypsin followed by analysis with liquid chromatography tandem mass spectrometry (LC-MS/MS) and liquid chromatography-high resolution tandem mass spectrometry (LC-HRMS/MS). The present work demonstrates for the first time that plant biomarkers are promising indicators of CWA exposure that can be used for forensic reconstruction long after the alleged agent release.
2. Experimental
2.1. Safety
The organophosphate nerve agents Novichok A-234 and sarin (GB) and the blister agent sulfur mustard (HD) are highly toxic chemicals. All experiments were performed by trained personnel in the dedicated High-Tox facility at TNO Rijswijk, which is allowed under the Chemical Weapons Convention to synthesize and handle chemical warfare agents. The experiments, including chlorine gas exposure, were performed in a fume hood by trained personnel. The chemicals were handled in a leak-tight containment and personal protection measures, such as lab coats, gloves and safety glasses were worn. In case of an accidental exposure, an autoinjector with atropine sulphate and obidoxime as well as a diazepam preparation were readily available for administration by a specialized first aid team, to reduce the symptoms of intoxication.2.2. Chemicals and materials
The chemicals A-234, GB, HD, o-isopropyl methylphosphonic acid adduct to tyrosine (GB-Tyr), N1-HETE-Histidine (N1-HETE-His), N3-HETE-Histidine (N3-HETE-His), A-234-Tyr and methylphosphonic acid (MPA)-Tyr were synthesized in the High-Tox facility at TNO, Rijswijk. The compounds were characterized by NMR, GC-MS and LC-MS. Purities of the synthesized agents, except for A-234-Tyr and MPA-Tyr which were only used for qualitative analysis, exceeded 95% (determined by NMR). 3,5-Di-chloro-L-tyrosine (di-Cl-Tyr) was purchased from BOC Sciences (London, UK) and 13C6-3-chloro-L-tyrosine was obtained from Cambridge Isotopic Laboratories (Andover MA, USA) Purities of the agents exceeded 97%. Acetic acid, ammonium bicarbonate (ABC), calcium hypochlorite, 3-chloro-L-tyrosine, dithiothreitol (DTT), formic acid, protease from Streptomyces griseus (pronase, ≥3.5 units per mg solid), sodium acetate trihydrate, sodium iodoacetate, trypsin from bovine pancreas (≥10![[thin space (1/6-em)]](https://www.rsc.org/images/entities/char_2009.gif) 000 BAEE units per mg protein) and urea were obtained from Sigma-Aldrich (Zwijndrecht, The Netherlands). Acetonitrile (ACN), acetone, ethanol and methanol (MeOH) were purchased from Biosolve (Valkenswaard, The Netherlands). Hydrochloric acid (HCl) was obtained from ThermoFisher Scientific (Landsmeer, The Netherlands). Additionally, MilliQ water (SimPak® 1) was used. Laurel (Prunus Lusitanica Angustifolia, Intratuin), Ocimum Basilicum (Aldi) and Nettle (local plant, Rijswijk) originated from the Netherlands.
000 BAEE units per mg protein) and urea were obtained from Sigma-Aldrich (Zwijndrecht, The Netherlands). Acetonitrile (ACN), acetone, ethanol and methanol (MeOH) were purchased from Biosolve (Valkenswaard, The Netherlands). Hydrochloric acid (HCl) was obtained from ThermoFisher Scientific (Landsmeer, The Netherlands). Additionally, MilliQ water (SimPak® 1) was used. Laurel (Prunus Lusitanica Angustifolia, Intratuin), Ocimum Basilicum (Aldi) and Nettle (local plant, Rijswijk) originated from the Netherlands.
2.3. Exposure of the plants
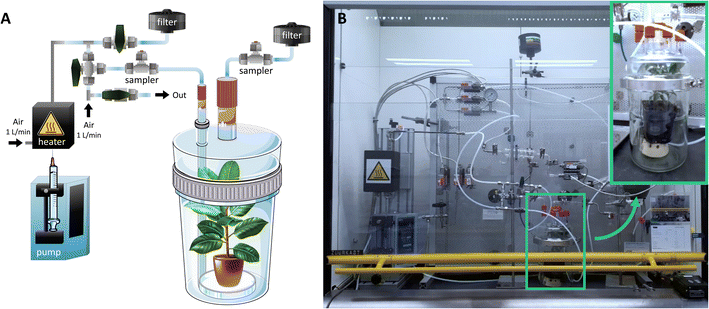 | ||
| Fig. 2 Dedicated vapor generation set-up for controlled exposure of plants to chemical warfare agents. (A) Schematic view. (B) Photo of vapor generation set-up. | ||
For chlorine exposure, the plants were placed in a closed 2 or 20 L vessel and chlorine was generated by the reaction of calcium hypochlorite and HCl, similar to the method applied by de Bruin-Hoegée et al.21 An 1.5 mL Eppendorf tube with 1, 10 and 50 mg calcium hypochlorite was placed in the vessel above the plant. A syringe was put through a septum and slowly, over a period of one minute, 1 mL of a 12 M HCl solution was added to the calcium hypochlorite, after which 50 mg m−3, 500 mg m−3, 5 g m−3 or 25 g m−3 chlorine gas was generated. The plants were left for 30 minutes in the closed vessel.
2.4. Protein precipitation and digestion
Fig. 3 summarizes the sample preparation steps. After exposure, two leaves of each plant species were collected and washed with methanol to remove potential intact CWAs. Also, two unexposed leaves were included. Subsequently, the leaf was placed in a 2 mL vial and cut into minuscule homogenous pieces using a small nail scissors. The sample was then transferred into a 15 mL centrifuge tube and washed with 10 mL acetone by centrifuging at 4000 rpm for 10 minutes (Megafuge 1.0 R centrifuge). The washing step was included to dehydrate and clean the sample, because the aim of the study was to find protein adducts. It should be noted that potential other, small molecule biomarkers could have been removed during this procedure. This was repeated three times for HD and chlorine. Subsequently, the plant material was dried overnight at ambient temperature. It should be noted that drying is not required if only qualitative analysis is necessary, since digestion can be performed with wet leaves as well. | ||
| Fig. 3 Schematic overview of the sample preparation steps. Figures adapted from https://www.smart.servier.com, CC BY 3.0. | ||
Afterwards, the samples were digested. The applied method was adapted from protocols originally described for the detection of CWAs in biomedical samples.4,21,40 For pronase digestion, 400 μL ABC buffer (50 mM) and 100 μL pronase (10 mg mL−1 in 50 mM ABC) were added to 10 mg of dried leaf. The digests after HD and chlorine exposure were incubated overnight at 37 °C and a rotational speed of 800 rpm. Subsequently, the samples were filtered through a 10 kDa Amicon ultra-centrifugal filter at 14![[thin space (1/6-em)]](https://www.rsc.org/images/entities/char_2009.gif) 000 rpm for 10 minutes in an Eppendorf centrifuge. The samples after sarin exposure were incubated with pronase for 90 minutes in a Thermoshaker (grant-bio PHMT) at 50 °C and 500 rpm. It turned out that both digestion methods, for either sulfur mustard and chlorine and the procedure for sarin, provided similar results and could be used interchangeably.
000 rpm for 10 minutes in an Eppendorf centrifuge. The samples after sarin exposure were incubated with pronase for 90 minutes in a Thermoshaker (grant-bio PHMT) at 50 °C and 500 rpm. It turned out that both digestion methods, for either sulfur mustard and chlorine and the procedure for sarin, provided similar results and could be used interchangeably.
The filtrates were purified with reversed phase solid phase extraction (SPE) using a C18 column (Bakerbond SPE™). To wet the sorbent bed and activate the nonpolar sorbents, 1 mL MeOH was percolated through the column and 1 mL water was used to equilibrate the column. Afterwards, the sample was loaded on the column and washed with 10% MeOH in water. The retained analytes were eluted with 1.5 mL MeOH and dried under nitrogen. The dried sample was then dissolved in 50 μL water with 0.2% v/v formic acid and analyzed as described in Section 2.5.
For trypsin digestion, 1 mL urea (8 M solution in 50 mM ABC) containing 5 μL of DTT (800 mM in water) was added to 10 mg of plant material. Subsequently, the sample was incubated for 45 minutes at 37 °C and 800 rpm. After the incubation, 100 μL sodium iodoacetate (150 mM in water) was added. Next, the sample was incubated for 30 minutes in the dark at 37 °C and 800 rpm. Thereafter, the sample was filtered through a 10 kDa Amicon ultra-centrifugal filter at 14![[thin space (1/6-em)]](https://www.rsc.org/images/entities/char_2009.gif) 000 rpm for 10 minutes in an Eppendorf centrifuge (5417 R). The residue was washed on the filter four times with 400 μL ABC buffer (50 mM) and afterwards 400 μL water and 30 μL trypsin solution (10 mg mL−1 in 50 mmol L−1 acetate buffer, pH = 3.55) were added. The sample was incubated overnight at 37 °C and 800 rpm. After digestion, the samples were filtered through a 10 kDa filter at 14
000 rpm for 10 minutes in an Eppendorf centrifuge (5417 R). The residue was washed on the filter four times with 400 μL ABC buffer (50 mM) and afterwards 400 μL water and 30 μL trypsin solution (10 mg mL−1 in 50 mmol L−1 acetate buffer, pH = 3.55) were added. The sample was incubated overnight at 37 °C and 800 rpm. After digestion, the samples were filtered through a 10 kDa filter at 14![[thin space (1/6-em)]](https://www.rsc.org/images/entities/char_2009.gif) 000 rpm for 10 minutes and analyzed as described in Section 2.5.
000 rpm for 10 minutes and analyzed as described in Section 2.5.
2.5. Chemical analysis
The collision energy was optimized for each compound. Table 1 shows the chromatographic and mass spectrometric parameters for the protein adducts and metabolites which were analyzed by LC-MS/MS. The identification of the adducts was confirmed by comparing their retention times, precursor ion and characteristic fragment ion m/z values with synthetic reference standards. GB-Tyr, Cl-Tyr, di-Cl-Tyr, N1-HETE-His, N3-HETE-His and 13C6–Cl-Tyr were quantitatively analyzed, while A-234-Tyr and MPA-Tyr were only utilized for qualitative analysis. For the limit of detection (LOD) a signal-to-noise (S/N) ratio of at least 5 was required. Further results of the optimization and validation of the corresponding targeted LC-MS/MS method can be found in Section S1 of the ESI.†
3. Results & discussion
3.1. Visual examination of vegetation
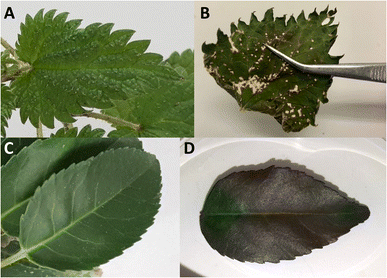
Any discoloration or other physical changes of the leaves were monitored to assess potential visual cues for plant and leave collection in the field. After chlorine exposure, typical yellow staining was immediately observed (Fig. 4B). Alternatively, leaves exposed to sulfur mustard (Fig. 4D), A-234 or sarin showed discoloration, turning the leaf from green to a brown color. However, this was only visible for relatively high vapor concentrations, whereas lower concentrations (<25 mg m−3) did not result in immediate physical changes. More pictures are included in Section S2 of the ESI.† Further knowledge of the physical state of the plant might be obtained by applying fluorescence detection before sample selection.413.2. Liquid exposure
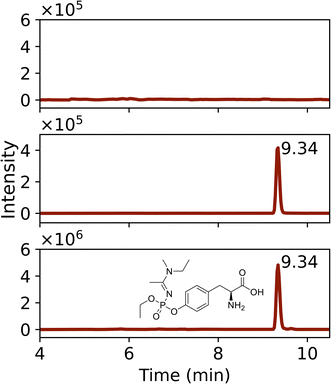
Protein adducts were formed in plants after exposure to various chemical threat agents. To the best of our knowledge, this is the first time that these biomarkers are detected in plants. After liquid exposure to A-234, phosphorylated tyrosine adducts were found. Fig. 5 shows representative extracted ion chromatograms of the sample preparation blank, a standard of tyrosine exposed to A-234, and nettle exposed to A-234. The retention time (tR) and fragmentation pattern of the unknown sample correspond to the standard. No peaks were visible in the blank runs even after a 10-fold expansion of the base line signal. In Fig. 6 the HRMS/MS spectrum of A-234-Tyr is presented with a mass error of only 0.22 ppm compared to the theoretical m/z value. The cleavage products with m/z 313.0949, 285.0635, 244.0734 and 74.0964 were clearly visible, which were only reported by one other study for the A-234 tyrosine adduct in biological fluids.42 This is the first study to identify the A-234 tyrosine adduct by comparing it to a synthetic reference standard. The lowest m/z of the adduct moiety diethylamine was observed in other studies for the nonapeptide fragmentation pattern as well.32 An increasing exposure concentration resulted in higher adduct formation in leaves exposed to liquid drops (Fig. 7A), with a limit of detection of 2 nmol (448 ng). | ||
| Fig. 6 HRMS/MS spectrum with fragmentation pattern of the tyrosine adduct of Novichock A-234 (m/z 386.1839). | ||
 | ||
| Fig. 7 Effect of concentration of added droplets on the average adduct formation in nettle plant per mg dried leaf (A) A-234, (B) GB and (C) HD exposure. | ||
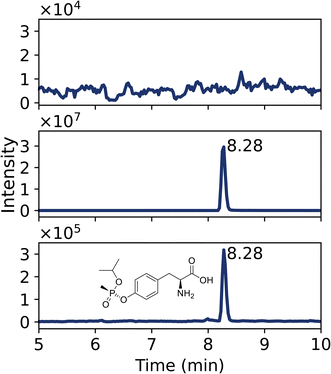
Furthermore, the o-isopropyl methylphosphonic acid adduct to tyrosine was also detected in vegetation after liquid exposure to sarin, confirmed by a reference standard. The MPA-Tyr adduct was not detected, indicating no aging of the adduct. A liquid exposure of 0.4 nmol sarin (56 ng) could still be observed in nettle leaves. When the exposure level was increased, a higher concentration of biomarkers was measured (Fig. 7B).
Third, the N1- and N3-HETE-His adducts were detected after liquid exposure of leaves to sulfur mustard. An exposure of a single nettle leaf to 0.2 nmol HD (32 ng) could still be detected. Both adducts were formed to a similar extent at each sulfur mustard concentration (Fig. 7C). The next section will describe the results of the exposure of plants to GB and HD vapor including the chromatograms.
3.3. Vapor and gas exposure
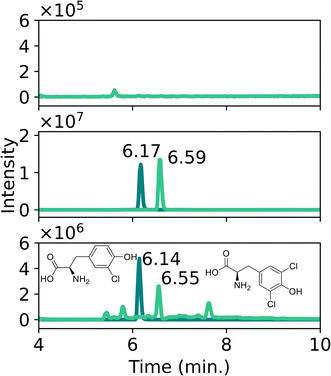
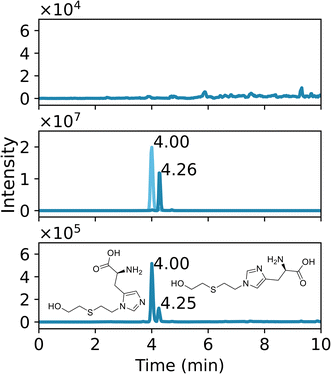
![[thin space (1/6-em)]](https://www.rsc.org/images/entities/char_2009.gif) 000.
000.
It should be noted that these tyrosine adducts do not immediately relate to a targeted attack with chlorine gas. Similar reactions can also occur when plants are exposed to accidental chlorine exposure for instance after contact with household bleach. Further research should be conducted to investigate whether it would be possible to differentiate between various exposure scenarios and the chemicals involved through detailed analysis of plant biomarkers. Possibly this will require the analysis of chlorinated peptides as was recently demonstrated for human biological samples.30 However, the context of a given case and the conditions at the incident scene might also provide insight into the nature of the chlorine source.
Further improvements in limit of detection might be obtained by processing more plant material. In this study only 10 mg of dried plant material was prepared for analysis, which was often less than the mass of a single leaf. Especially after large scale attacks, it is expected that much more vegetation has come into contact with the chemical agents and could hence be collected and processed for forensic investigations. Another potential advancement in sensitivity, which has remarkably decreased the detection limit for the analysis of nerve agents in biomedical samples, might be realized by isolating specific proteins using antibodies.46
Over time a slight increase in adduct concentration in the living plant was observed after sarin, chlorine, and sulfur mustard exposure, which might be due to accumulation in the soil or plant as is observed for free metabolites as well.25 However, given the small sample size, the results must be interpreted with caution as the variation in concentration observed in individual leaves was substantial, which might be due to the position relative to the vapor flow or the growth phase of the leaf.
3.4. Influence of plant exposure conditions
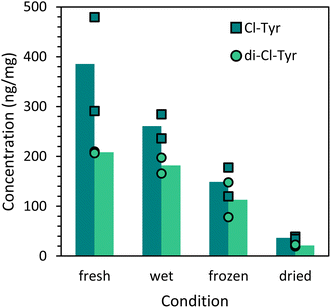
The conditions of the leaves were varied to mimic different weather conditions. Freshly picked leaves were compared with wetted, frozen, and dried leaves. After chlorine exposure, the concentration of Cl-Tyr and di-Cl-Tyr in the frozen and dried leaves was significantly lower than the adduct concentration detected in fresh leaves as shown in Fig. 11. Nevertheless, as described before, it was still possible to identify protein adducts in dried leaves after three months. The di-Cl-Tyr concentration of the wetted leaves was also slightly reduced, while the Cl-Tyr concentration did not show a significant difference. Additionally, during sarin and sulfur mustard exposure, the humidity in the vapor generation setup was increased from dry air to 60% relative humidity. However, the adduct concentration was not affected by these conditions. Finally, a doubled exposure time with GB and HD resulted in more adduct formation as expected. At even higher exposure levels and durations, the biomarker formation is expected to level out when all available amino acid sites have reacted with the CWA. However, such a high exposure concentration was not applied due to safety reasons.The observed biomarker concentration was considerably affected by the exposure area of the plant. An increase in biomarker formation with a factor of four was observed for a single leaf compared to a whole plant exposed to 5 or 25 g m−3 chlorine gas. This suggests that all the available chlorine fully reacts with an excess of biomaterial and that hence the biomarker formation is distributed over the various leaves of a full plant. As a result, the size of the plant and its surface area vs. mass indirectly affects the formed adducts. To improve the exposure design in future studies, it is recommended to precisely select the plant size and number of leaves to limit experimental variation. However, in real-life incidents CWA exposure will be uncontrolled and will vary greatly depending on the exposure conditions and the location of the vegetation at the scene.
In this study, no consistent differences in adduct concentration were observed for the various plant species. The variation within the individual experiments of one plant species was similar to the variation between different plant species. Nevertheless, all chemical warfare agent adducts were visible in all investigated plant species. A plausible explanation for this might be that green plants in general contain a lot of similar proteins consisting of amino acids that are accessible to chemical threat agents, as will be discussed in more detail in Section 3.5. It is therefore expected that these findings can be extrapolated to other vegetation as well.
3.5. Protein identification with high resolution mass spectrometry
To provide more insight in which plant proteins react with the threat agents, peptide identification was performed by LC-HRMS/MS after trypsin digestion. It was anticipated that a majority of the adducts would originate from the abundant plant protein rubisco. This protein was also mentioned in the news article about the research of Lawrence Livermore National Laboratory.27 However, the applied pronase digestion method is non-specific, and the monitored biomarkers can result from any plant protein containing tyrosine. Because of the lack of specific databases of nettle, laurel, and basil, only peptides that occur generically in plants could be identified. Consequently, this approach is generally applicable to a wider range of plant species.Table 2 shows the identified peptides that were present in two nettle samples exposed to chlorine gas. No chlorinated peptides were found in the blank. As expected, mono and di-chlorinated rubisco peptides were found. Besides this protein, various peptides from other proteins were detected, such as chlorinated chloroplastic ATP synthase, which are involved in the CO2 signalling pathway and control gas-exchange between plants and the atmosphere,47 chlorophyll binding protein and serine–glyoxylate aminotransferase. In one sample the peptide VGLTALTIAEY*FR was both mono chlorinated and dichlorinated.
| No. | Peptide | Protein | Accession | Exposure | Species |
|---|---|---|---|---|---|
| 1 | GYPGY(Cl)LYTDLATIYER | ATP synthase | B0K8E7|VATB_THEP3 | Cl | Nettle |
| 2 | EAQAVADDVFSLFISEEVDKVELLY(Cl)TK | ATP synthase, chloroplastic | Q01908|ATPG1_ARATH | Cl | Nettle |
| 3 | VGLTALTIAEY(Cl)FR | ATP synthase, chloroplastic | O03081|ATPB_PSINU | Cl | Nettle |
| 4 | H*NLTDDQLSEFK | Calmodulin | Q39752|CALM_FAGSY | HD | Laurel |
| 5 | Y(Cl)AGVGAAIEYAVLHLK | Carbonic anhydrase, chloroplastic | P42737|BCA2_ARATH | Cl | Nettle |
| 6 | GPLENLADHLADPVNNNAWAY(Cl)ATKLCPGK | Chlorophyll binding protein, chloroplastic | P09755|CB22_SOYBN | Cl | Nettle |
| 7 | Y*GELLHGR | Chlorophyll binding protein, chloroplastic | Q07473|CB4A_ARATH | GB | Basil |
| 8 | EVPYLH*LQFDLDSLDQNLAK | Chlorophyll binding protein, chloroplastic | Q9XF88|CB4B_ARATH | HD | Basil |
| 9 | EFLVLH*LQFELDSLDQGGLAK | Chlorophyll binding protein, chloroplastic | Q9XF88|CB4B_ARATH | HD | Basil |
| 10 | H*HLTFPLLSPDPTTK | Cytochrome | A6MMV7|CYF_ILLOL | HD | Basil |
| 11 | WSFAAEH*HPENLLFPEEVLPR | Photosystem II D2 | Q2MIA5|PSBD_SOLLC | HD | Basil |
| 12 | Y*TLPGHKKAFLPR | Putative beta-D-xylosidase | P83344|XYNB_PRUPE | GB | Laurel |
| 13 | GHYLNATAATC(Cl2)EEMLKR | RuBisCO | Q1KVV0|RBL_TETOB | Cl | Nettle |
| 14 | LTYYTPEY(Cl)ETK | RuBisCO | P48706|RBL_LACSA | Cl | Nettle |
| 15 | VAY(Cl)PIDLFEEGSVTNLFTSIVGNVFGFK | RuBisCO | P48711|RBL_PICAB | Cl | Nettle |
| 16 | WY*MVHSGTVVGQLEWR | RuBisCO | P19163|RBL_NEUMU | GB | Basil |
| 17 | Y(Cl)NLSLGLGLNK | Serine-glyoxylate aminotransferase | P84187|SGAT_MAIZE | Cl | Nettle |
| 18 | KNQY*LEAEWNAK | Transketolase, chloroplastic | O20250|TKTC_SPIOL | GB | Laurel |
After duplicate sulfur mustard exposure of laurel and basil, post-translational modifications were found as well (Table 2). Slightly different proteins were found in both samples of laurel and basil. The proteins calmodulin, cytochrome, photosystem II D2 and chloroplastic chlorophyll binding protein were modified. Of the latter protein, even two peptides were affected, which might indicate that this protein is an accessible target.
Additionally, Table 2 shows the phosphorylated peptides that were formed after sarin exposure. Also, in this case different proteins were found in laurel compared to basil. Modifications in chloroplastic chlorophyll binding protein, chloroplastic transketolase, putative beta-D-xylosidase and rubisco were identified. The finding of rubisco was consistent with data obtained after chlorine exposure of nettle. In addition, similar chloroplastic chlorophyll binding proteins were targeted by all three chemical threat agents. An overview of all the detected plant-based peptides, including those that were only detected once, can be found in Table of the ESI.† The comprehensive list of peptides showed that multiple proteins were modified by all studied chemicals, such as chloroplastic ATP synthase, ferredoxin-dependent glutamate synthase, oxygen-evolving enhancer protein 1, photosystem II CP47 reaction center protein, RuBisCO activase and RuBisCO. From these results, it can be concluded that many proteins are targeted by the various chemicals. Interestingly, some proteins showed modifications in all three plant species by all studied chemical threat agents. This indicates that a specific peptide biomarker approach as recently presented for human biological samples might also be feasible for plant-based evidence.
4. Conclusions
In this study a novel approach was developed for analyzing persistent biomarkers in vegetation for retrospective investigation of chemical warfare agent exposure. We demonstrate that these plant biomarkers are identical to the analytes that have been accepted as unequivocal biomarkers of exposure in biomedical samples of victims and that have been used by the designated laboratories of the OPCW to analyze samples associated with chemical weapons attacks. This finding was confirmed through the use of reference standards. The experience with complex matrices, protein isolation protocols and enzymatic digestion steps is a distinct advantage when implementing the method developed in this study in forensic investigations, guaranteeing rapid implementation of the technology. In addition, the focus on plant-based evidence can offer a number of distinct advantages. This work shows that CWA biomarkers formed in plants are very persistent and can be detected up to three months after exposure. It is also expected that these biomarkers will be formed generically in plants irrespective of the species and exposure conditions. Furthermore, plant-based evidence is relatively easy to sample, ship, store and process and typically is abundantly available at an incident scene. Finally, for perpetrators it will be difficult to remove or manipulate plant-based evidence after a CWA attack. Future research could focus on processing more plant material to further reduce the detection limit and thereby the minimum exposure concentration. The analysis of case-work samples is required to establish the applicability of the method for concentrations and conditions encountered after a CWA attack. Both in terms of verifying the presence of plant biomarkers after a confirmed CWA exposure and of showing the absence of these biomarkers in situations where no threat agent was released. In addition, the combination of various analytical techniques can provide complementary information or additional proof through the presence of specific biomarkers. In conclusion, the analysis of plant protein adducts can become a powerful tool to verify (or refute) the alleged use of chemical weapons.Author contributions
Mirjam de Bruin-Hoegée: methodology, validation, formal analysis, writing – original draft, visualization; Latifa Lamriti: methodology, validation, formal analysis; Jan Langenberg: conceptualization, funding acquisition; René C. M. Olivier: methodology, formal analysis; Lai Fun Chau: methodology, formal analysis; Marcel van der Schans: conceptualization, methodology, writing – review & editing, supervision, project administration; Daan Noort: conceptualization, methodology, writing – review & editing, supervision; Arian C. van Asten: writing – review & editing, supervision.Conflicts of interest
The authors declare that there is no conflict of interest.Acknowledgements
This research is partially funded by the European Union, through a research contract awarded by the Organisation for the Prohibition of Chemical Weapons (OPCW), in support of the Plant Biomarker Challenge. This work is part of the Forensic Attribution for CWA INtelliGence (FACING) project, a collaboration between the Van 't Hoff Institute for Molecular Sciences (HIMS) of the University of Amsterdam and TNO Defence, Safety & Security. The FACING project is financed by the DO-AIO fund of the Dutch Ministry of Defence.References
- Organisation for the Prohibition of Chemical Weapons, Compendium of Correspondence Shared by States Parties on Ukraine, 2022, https://www.opcw.org/sites/default/files/documents/2022/Compendium%<?pdb_no 20of?>20of<?pdb END?>%20correspondence%20shared%<?pdb_no 20by?>20by<?pdb END?>%20States%20Parties%<?pdb_no 20on?>20on<?pdb END?>%20Ukraine.pdf, accessed November 2022 Search PubMed.
- OPCW, Report of the OPCW fact-finding mission in Syria regarding the incidents of the alleged use of chemicals as a weapon in Marea, Syrian Arab Republic, on 1 and 3 September 2015, 2022, https://www.opcw.org/sites/default/files/documents/2022/01/s-2017-2022%2B%28e%29.pdf, accessed November 2022 Search PubMed.
- OPCW Investigation and Identification Team (IIT), First Report by the OPCW Investigation and Identification Team (IIT) Pursuant to Paragraph 10 of Decision C-SS-4/Dec.3 “Addressing the Threat From Chemical Weapons Use” Ltamenah (Syrian Arab Republic) 24, 25, and 30 March 2017, 2020, https://www.opcw.org/sites/default/files/documents/2020/04/s-1867-2020%28e%29.pdf, accessed November 2022 Search PubMed.
- H. John, M. J. van der Schans, M. Koller, H. E. T. Spruit, F. Worek, H. Thiermann, D. Noort and H. John, Fatal sarin poisoning in Syria 2013: forensic verification within an international laboratory network, Forensic Toxicol., 2018, 36, 61–71, DOI:10.1007/s11419-017-0376-7.
- OPCW Investigation and Identification Team (IIT), Second Report by the OPCW Investigation and Identification Team Pursuant to Paragraph 10 of Decision C-Ss-4/Dec.3 “Addressing the Threat from Chemical Weapons Use” Saraqib (Syrian Arab Republic) – 4 February 2018, 2021, https://www.opcw.org/sites/default/files/documents/2021/04/s-1943-2021%28e%29.pdf, accessed November 2022 Search PubMed.
- OPCW Fact-Finding Mission (FFM), Report of the OPCW Fact-Finding Mission in Syria Regarding the Incident of the Alleged Use of Chemicals as a Weapon in Kafr Zeita, Syrian Arab Republic 1 October 2016, 2022, https://www.opcw.org/sites/default/files/documents/2022/02/s-2020-2022%28e%29.pdf, accessed November 2022 Search PubMed.
- OPCW, Summary of the report on activities carried out in support of a request for technical assistance by Germany, 2020, https://www.opcw.org/sites/default/files/documents/2020/10/s-1906-2020%28e%29.pdf, accessed November 2022 Search PubMed.
- D. Castelvecchi, Novichok nerve agents banned by chemical-weapons treaty, Nature, 2019, https://www.nature.com/articles/d41586-019-03686-y, accessed November 2022 Search PubMed.
- S. Costanzi and G. D. Koblentz, Controlling Novichoks after Salisbury: revising the Chemical Weapons Convention schedules, Nonproliferation Rev., 2019, 26, 599–612, DOI:10.1080/10736700.2019.1662618.
- D. Steindl, W. Boehmerle, R. Körner, D. Praeger, M. Haug, J. Nee, A. Schreiber, F. Scheibe, K. Demin, P. Jacoby, R. Tauber, S. Hartwig, M. Endres and K. U. Eckardt, Novichok nerve agent poisoning, Lancet, 2021, 397, 249–252, DOI:10.1016/S0140-6736(20)32644-1.
- E. W. Hooijschuur, C. E. Kientz and U. ATh Brinkman, Analytical separation techniques for the determination of chemical warfare agents, J. Chromatogr. A, 2002, 982, 177–200, DOI:10.1016/S0021-9673(02)01426-7.
- K. Kim, O. G. Tsay, D. A. Atwood and D. G. Churchill, Destruction and detection of chemical warfare agents, Chem. Rev., 2011, 111, 5345–5403, DOI:10.1021/cr100193y.
- E. J. Pacsial-Ong and Z. P. Aguilar, Chemical warfare agent detection: a review of current trends and future perspective, Front. Biosci., 2013, 5, 516–543, DOI:10.2741/S387.
- S. Popiel and M. Sankowska, Determination of chemical warfare agents and related compounds in environmental samples by solid-phase microextraction with gas chromatography, J. Chromatogr. A, 2011, 1218, 8457–8479, DOI:10.1016/j.chroma.2011.09.066.
- O. Terzic, H. Gregg and P. De Voogt, Identification of chemicals relevant to the Chemical Weapons Convention using the novel sample-preparation methods and strategies of the Mobile Laboratory of the Organization for the Prohibition of Chemical Weapons, Trends Anal. Chem., 2015, 65, 151–166, DOI:10.1016/j.trac.2014.10.012.
- L. A. Hernon-Kenny, D. L. Behringer and M. D. Crenshaw, Comparison of latex body paint with wetted gauze wipes for sampling the chemical warfare agents VX and sulfur mustard from common indoor surfaces, Forensic Sci. Int., 2016, 262, 143–149, DOI:10.1016/j.forsciint.2016.02.036.
- S. A. Willison, Investigation of the persistence of nerve agent degradation analytes on surfaces through wipe sampling and detection with ultrahigh performance liquid chromatography-tandem mass spectrometry, Anal. Chem., 2015, 87, 1034–1041, DOI:10.1021/ac503777z.
- The Ministry for Foreign Affairs of Finland, Recommended Operating Procedures for Analysis in the Verification of Chemical Disarmament, University of Helsinki, Helsinki, 2017 Search PubMed.
- M. Enserink, U.N. taps special labs to investigate Syrian attack, Science, 2013, 341, 1050–1051, DOI:10.1126/science.341.6150.1050.
- R. W. Read, Verification of exposure to chemical warfare agents, Issues Toxicol., 2016, 179–218, 10.1039/9781782628071-00179.
- M. de Bruin-Hoegée, I. M. van Damme, T. van Groningen, D. van der Riet-van Oeveren, D. Noort and A. C. van Asten, Elucidation of in Vitro Chlorinated Tyrosine Adducts in Blood Plasma as Selective Biomarkers of Chlorine Exposure, Chem. Res. Toxicol., 2022, 35, 1070–1079, DOI:10.1021/acs.chemrestox.2c00053.
- M. R. Gravett, F. B. Hopkins, M. J. Main, A. J. Self, C. M. Timperley, A. J. Webb and M. J. Baker, Detection of the organophosphorus nerve agent VX and its hydrolysis products in white mustard plants grown in contaminated soil, Anal. Methods, 2013, 5, 50–53, 10.1039/c2ay25883h.
- X. Lian and B. Yan, Trace Detection of Organophosphorus Chemical Warfare Agents in Wastewater and Plants by Luminescent UIO-67(Hf) and Evaluating the Bioaccumulation of Organophosphorus Chemical Warfare Agents, ACS Appl. Mater. Interfaces, 2018, 10, 14869–14876, DOI:10.1021/acsami.8b00289.
- M. T. Kuska, J. Behmann and A. K. Mahlein, Potential of hyperspectral imaging to detect and identify the impact of chemical warfare compounds on plant tissue, Pure Appl. Chem., 2018, 90, 1615–1624, DOI:10.1515/pac-2018-0102.
- T. Baygildiev, M. Vokuev, A. Braun, I. Rybalchenko and I. Rodin, Monitoring of hydrolysis products of mustard gas, some sesqui- and oxy-mustards and other chemical warfare agents in a plant material by HPLC-MS/MS, J. Chromatogr. B, 2021, 1162, 122452, DOI:10.1016/j.jchromb.2020.122452.
- A. Vaezihir, A. Pirkhezranian, N. Sehati, M. R. Hosseinzadeh, S. Y. Salehi-Lisar and H. Sanderson, Investigation of long-term hazards of chemical weapon agents in the environment of Sardasht area, Iran, Environ. Sci. Pollut. Res., 2022, 29, 498–508, DOI:10.1007/s11356-021-15593-9.
- C. Henry Arnaud, Biomarkers of Exposure to Chlorine Gas Identified in Plant Tissue, Chemical & Engineering News, 2021, https://cen.acs.org/acs-news/acs-meeting-news/Biomarkers-exposure-chlorine-gas-identified/99/web/2021/04, accessed September 10, 2022 Search PubMed.
- F. Fu, F. Sun, X. Lu, T. Song, J. Ding, R. Gao, H. Wang and C. Pei, A Novel Potential Biomarker on Y263 Site in Human Serum Albumin Poisoned by Six Nerve Agents, J. Chromatogr. B, 2019, 1104, 168–175, DOI:10.1016/j.jchromb.2018.11.011.
- M. Hemme, A. Fidder, D. van der Riet-van Oeveren, M. J. van der Schans and D. Noort, Mass spectrometric analysis of adducts of sulfur mustard analogues to human plasma proteins: approach towards chemical provenancing in biomedical samples, Anal. Bioanal. Chem., 2021, 413, 4023–4036, DOI:10.1007/s00216-021-03354-z.
- A. Fidder, A. G. Hulst, D. Noort, R. de Ruiter, M. J. van der Schans, H. P. Benschop and J. P. Langenberg, Retrospective detection of exposure to organophosphorus anti-cholinesterases: Mass spectrometric analysis of phosphorylated human butyrylcholinesterase, Chem. Res. Toxicol., 2002, 15, 582–590, DOI:10.1021/tx0101806.
- H. John and H. Thiermann, Poisoning by organophosphorus nerve agents and pesticides: an overview of the principle strategies and current progress of mass spectrometry-based procedures for verification, J. Mass Spectrom. Adv. Clin. Lab, 2021, 19, 20–31, DOI:10.1016/j.jmsacl.2021.01.002.
- D. Noort, A. Fidder, D. Van Der Riet-Van Oeveren, R. Busker and M. J. Van Der Schans, Verification of Exposure to Novichok Nerve Agents Utilizing a Semitargeted Human Butyrylcholinesterase Nonapeptide Assay, Chem. Res. Toxicol., 2021, 34, 1926–1932, DOI:10.1021/acs.chemrestox.1c00198.
- M. A. Sochaski, A. M. Jarabek, J. Murphy and M. E. Andersen, 3-Chlorotyrosine and 3,5-dichlorotyrosine as biomarkers of respiratory tract exposure to chlorine gas, J. Anal. Toxicol., 2008, 32, 99–105, DOI:10.1093/jat/32.1.99.
- T. Nishio, Y. Toukairin, T. Hoshi, T. Arai and M. Nogami, Development of an LC-MS/MS method for quantification of 3-chloro-L-tyrosine as a candidate marker of chlorine poisoning, Leg. Med., 2021, 53, 101939, DOI:10.1016/j.legalmed.2021.101939.
- Y. M. Bar-On and R. Milo, The global mass and average rate of rubisco, Proc. Natl. Acad. Sci. U. S. A., 2019, 116, 4738–4743, DOI:10.1073/pnas.1816654116.
- B. M. Adhikari, A. Bajracharya and A. K. Shrestha, Comparison of nutritional properties of Stinging nettle (Urtica dioica) flour with wheat and barley flours, Food Sci. Nutr., 2016, 4, 119–124, DOI:10.1002/fsn3.259.
- T. Jeannin, L. Yung, P. Evon, L. Labonne, P. Ouagne, M. Lecourt, D. Cazaux, M. Chalot and V. Placet, Native stinging nettle (Urtica dioica L.) growing spontaneously under short rotation coppice for phytomanagement of trace element contaminated soils: Fibre yield, processability and quality, Ind. Crops Prod., 2020, 145, 111997, DOI:10.1016/j.indcrop.2019.111997.
- M. H. Shahrajabian, W. Sun and Q. Cheng, Chemical components and pharmacological benefits of Basil (Ocimum basilicum): a review, Int. J. Food Prop., 2020, 23, 1961–1970, DOI:10.1080/10942912.2020.1828456.
- S. Batool, R. A. Khera, M. A. Hanif,and M. A. Ayub, Bay leaf, in, Medicinal Plants of South Asia, Elsevier, 2020, pp. 63–74, DOI:10.1016/B978-0-08-102659-5.00005-7.
- F. Gandor, M. Gawlik, H. Thiermann and H. John, Evidence of sulfur mustard exposure in human plasma by LC-ESI-MS-MS detection of the albumin-derived alkylated HETE-CP dipeptide and chromatographic investigation of its cis/trans isomerism, J. Anal. Toxicol., 2015, 39, 270–279, DOI:10.1093/jat/bkv010.
- V. V. Singh, V. Kumar, U. Biswas, M. Boopathi, K. Ganesan and A. K. Gupta, Luminol-Based Turn-On Fluorescent Sensor for Selective and Sensitive Detection of Sulfur Mustard at Ambient Temperature, Anal. Chem., 2021, 93, 1193–1199, DOI:10.1021/acs.analchem.0c04464.
- F. Mirbabaei, A. Mohammad-Khah, M. T. Naseri, M. Babri, S. M. Faraz, S. E. Hosseini and D. Ashrafi, Unambiguous identification and determination of A234-Novichok nerve agent biomarkers in biological fluids using GCMS/MS and LC-MS/MS, Anal. Bioanal. Chem., 2022, 414, 3429–3442, DOI:10.1007/s00216-022-03964-1.
- T.N.I. for O.S. and H. (NIOSH), Sarin (GB): Nerve Agent, 2011, https://www.cdc.gov/niosh/ershdb/emergencyresponsecard_29750001.html, accessed June 12, 2022 Search PubMed.
- The National Institute for Occupational Safety and Health (NIOSH), Chlorine: Lung Damaging Agent, 2011, https://www.cdc.gov/niosh/ershdb/emergencyresponsecard_29750024.html, accessed June 12, 2022 Search PubMed.
- The National Institute for Occupational Safety and Health (NIOSH), Sulfur Mustard: Blister Agent, 2011, https://www.cdc.gov/niosh/ershdb/emergencyresponsecard_29750008.html, accessed June 12, 2022 Search PubMed.
- J. L. S. Sporty, S. W. Lemire, E. M. Jakubowski, J. A. Renner, R. A. Evans, R. F. Williams, J. G. Schmidt, M. J. van der Schans, D. Noort and R. C. Johnson, Immunomagnetic separation and quantification of butyrylcholinesterase nerve agent adducts in human serum, Anal. Chem., 2010, 82, 6593–6600, DOI:10.1021/ac101024z.
- H. Hu, A. Boisson-dernier, M. Israelsson-nordström, M. Böhmer, S. Xue, A. Ries, J. Godoski, J. M. Kuhn and J. I. Schroeder, Carbonic Anhydrases are Upstream Regulators in Guard Cells of CO2 -Controlled Stomatal Movements, Nat. Cell Biol., 2010, 12, 1–18, DOI:10.1038/ncb2009.
Footnote |
| † Electronic supplementary information (ESI) available. See DOI: https://doi.org/10.1039/d2ay01650h |
| This journal is © The Royal Society of Chemistry 2023 |


