Open Access Article
This Open Access Article is licensed under a
Creative Commons Attribution 3.0 Unported Licence

Correction: A fluorescent aptasensor for ATP based on functional DNAzyme/walker and terminal deoxynucleotidyl transferase-assisted formation of DNA-AgNCs

Shixin Cai , Xin Chen , Haohan Chen , Yuting Zhang , Xiaoli Wang and Nandi Zhou *
The Key Laboratory of Carbohydrate Chemistry and Biotechnology, Ministry of Education, School of Biotechnology, Jiangnan University, Wuxi 214122, China. E-mail: zhounandi@jiangnan.edu.cn

Received 14th February 2023 , Accepted 14th February 2023

First published on 22nd February 2023


Abstract

Correction for ‘A fluorescent aptasensor for ATP based on functional DNAzyme/walker and terminal deoxynucleotidyl transferase-assisted formation of DNA-AgNCs’ by Shixin Cai et al., Analyst, 2023, 148, 799–805, https://doi.org/10.1039/D2AN02006H.


The authors regret that incorrect versions of Fig. 2–4 were published. The correct figures and the corresponding figure legends are as follows:
image file: d3an90018e-f2.tif
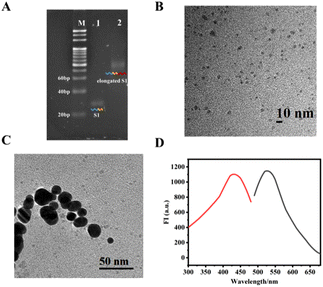
Fig. 2 (A) PAGE image for verification of the elongation of the S1 strand. Lane M: 20 bp DNA marker; lane 1: 1 μM S1 before elongation; lane 2: 1 μM S1 elongated by 280 U mL−1 TDT (elongated S1). (B) TEM image of DNA-AgNCs. (C) TEM image of Fe3O4@Au-AgNCs. (D) Fluorescence excitation spectrum (red) and emission spectrum (black) of Fe3O4@Au-AgNCs.

image file: d3an90018e-f3.tif
Fig. 3 Verification of the feasibility of the fluorescent aptasensor. (A) PAGE image for verification of the change of strands modified on Fe3O4@Au. Lane M: 20 bp DNA marker; lane 1: 1 μM S1; lane 2: 1 μM S2; lane 3: 0.5 μM S3; lane 4: the DNA strands released from Fe3O4@Au in the presence of 10 μM ATP; and lane 5: the DNA strands released from Fe3O4@Au in the absence of ATP. (B) Fluorescence emission spectra obtained under different conditions: Fe3O4@Au (black), Fe3O4@Au-poly(C) (red), Fe3O4@Au-AgNCs (blue) and Fe3O4@Au-AgNCs + 1 μM ATP (green).

image file: d3an90018e-f4.tif
Fig. 4 (A) The fluorescence emission spectra of the detection system recorded in the presence of different concentrations of ATP; (B) the relationship between the fluorescence intensity and the ATP concentration. Inset shows the linear relationship.

The Royal Society of Chemistry apologises for these errors and any consequent inconvenience to authors and readers.


This journal is © The Royal Society of Chemistry 2023
Click here to see how this site uses Cookies. View our privacy policy here.