
 Open Access Article
 This Open Access Article is licensed under a Creative Commons Attribution-Non Commercial 3.0 Unported Licence
A stationary phase with a positively charged surface allows for minimizing formic acid concentration in the mobile phase, enhancing electrospray ionization in LC-MS proteomic experiments†
Siddharth
Jadeja
a,
Rudolf
Kupcik
b,
Ivo
Fabrik
b,
Hana
Sklenářová
 a and
Juraj
Lenčo
*a
a and
Juraj
Lenčo
*a
aDepartment of Analytical Chemistry, Faculty of Pharmacy in Hradec Králové, Charles University, Heyrovského 1203/8, 500 03 Hradec Králové, Czech Republic. E-mail: lenco@faf.cuni.cz
bBiomedical Research Centre, University Hospital Hradec Králové, Sokolská 581, 500 05 Hradec Králové, Czech Republic
First published on 18th October 2023
Abstract
The default choice of mobile phase acidifier for bottom-up LC-MS proteomic analyses is 0.10% formic acid because of its decent acidity, decent ion pairing ability, and low suppression of electrospray ionization. In recent years, state-of-the-art columns have been designed specifically to provide efficient separation even when using an MS-friendly mobile phase of low ionic strength. Despite this, no attempts have been made to improve the sensitivity of the MS-based analytical methods by reducing the amount of formic acid in the mobile phase. In this study, we evaluated the effect of reduced formic acid concentration in the mobile phase on the chromatographic behavior and MS response of peptides when separated using columns packed with a C18 stationary phase with a positively charged surface. Using 0.01% formic acid in the mobile phase maintained excellent chromatographic performance and increased MS signal response compared to the standard of 0.10%. The enhanced MS response translated to about 50% improved peptide identifications depending on the complexity and amount of sample injected. The increased retention of peptides at a reduced formic acid concentration was directly proportional to the number of acidic residues in the peptide sequence. The study was carried out by covering a spectrum of protein samples with varied complexity using analytical flow, micro-, and nanoflow regimes to expand the applicability in routine practice.
1. Introduction
In proteomics, bottom-up refers to an analytical approach to characterizing protein samples via peptide analysis. Despite significant advancements in the field, the general methodology of this approach has not changed over the past two decades. The proteins are cleaved into peptides using sequence-specific proteases, then separated, usually using reversed-phase liquid chromatography, and analyzed with mass spectrometry online hyphenated via electrospray ionization (RPLC-ESI-MS).1–4The mobile phase used for bottom-up proteomic experiments has traditionally been acidic. Historically, strong acids such as trifluoroacetic acid (TFA, pKa = 0.3) were added in small concentrations to the mobile phase to attain desired acidic conditions. TFA at 0.1% concentration has a pH of 1.89 and keeps a majority of residual silanols of the C18 bonded stationary phase in an undissociated state. Furthermore, aqueous 0.1% TFA provides a high trifluoroacetate anion concentration of ∼12.7 mM, readily forming stable ion pairs with basic amino acid residues and N-termini of peptides. As a result, the retention of peptides increases, but more importantly, peptides are shielded from secondary interaction with a portion of the silanol groups that still dissociate.5 However, the advantages of using strong ion-pairing acidifiers in the mobile phase quickly become a disadvantage when the liquid chromatography is online hyphenated to ESI-MS. The stable trifluoroacetate–peptide ion pairs are difficult to break during electrospray ionization, inevitably leading to significant MS signal suppression.6–9 Because of its appealing effects in the RPLC of peptides, various efforts have been undertaken to make TFA suitable for LC-MS proteomic analyses.10–15
In combination with modern stationary phases with significantly reduced or even eliminated silanol activity, weaker acidifiers, such as formic acid (pKa = 3.75), have emerged as a suitable alternative for mobile phase acidifiers for peptide analysis as they provide efficient separation without considerably suppressing the ESI. Our research group recently surveyed 192 datasets on the ProteomeXchange repository for January–March 2022. It established that 99% of publications reportedly used formic acid as a mobile phase acidifier, of which 91% considered 0.10% the optimum concentration for their LC-MS-based proteomic analysis.3 The primary reason is the low ionic strength of formic acid of only about 2 mM at 0.10% concentration. The ability to form strong ion pairs with peptides at such low concentrations is sparse, potentially leading to more efficient ionization.
Despite very sensitive mass spectrometers being available, the field of proteomics is constantly striving to improve the detection efficiency of the LC-MS method. Many approaches have emerged as possible solutions, including adding supercharging agents such as DMSO and m-nitrobenzyl alcohol in the mobile phase,16–18 addition of ethylene glycol in the mobile phase,19 post-column addition of organic solvents,20 ESI in the presence of organic vapors,21,22 use of acetic acid as mobile phase additive,23etc. Despite all this research, very few efforts have been made to further decrease the mobile phase's ionic strength by reducing its formic acid concentration and obtaining a higher MS response via more efficient ESI. The main reason behind this is that the peak shapes of analytes with basic functional groups, including peptides, in such a low ionic strength mobile phase can exhibit signs of overloading.24,25
The peak distortions of basic analytes and peptides due to the overloading effect in low ionic strength acidic mobile phases in LC-MS analyses motivated the column manufacturers to focus on modifications of the stationary phase surface. In 2010, Waters introduced a C18 stationary phase with a positively charged surface. This charged variant of their ethylene-bridged hybrid (BEH) particles was specifically designed to provide optimal separation using an MS-friendly mobile phase with negligible ionic strength.26 Nováková et al. demonstrated that the marketed Charged Surface Hybrid (CSH) stationary phase separates small basic analytes even at a shallow concentration of acid additives, such as 0.01% formic acid and 0.01% acetic acid.27 We hypothesize that the CSH stationary phase could efficiently separate also peptides at much lower formic acid concentrations in the mobile phase than that of 0.10%, traditionally employed in bottom-up LC-MS analyses. The reduced formic acid concentration in the mobile phase should further decrease the number of anions capable of forming ion pairs with protonated peptides and, in turn, further alleviate ESI suppression. Besides, our research group recently revealed that a combination of low pH and high column temperature, often used for bottom-up proteomic experiments, induces unwanted changes in peptide bonds and amino acid residues.28 We hypothesize that lowering the formic acid concentration might also minimize the low pH-associated thermal in-column degradation and artificial modification of peptides.
This work was motivated to evaluate the effect of reduced formic acid concentration in the mobile phase on MS sensitivity and peptide separation using columns packed with a C18 stationary phase with a positively charged surface. In this study, we have derived the optimum minimal formic acid concentration that could be used as an additive in the mobile phase to obtain satisfactory chromatographic separation of peptides with maximum MS signal response in LC-MS bottom-up proteomic analyses. The impact of reducing the acidity of the mobile phase on in-column artificial modification of peptides was also investigated.
2. Experimental
2.1. Reagents and materials
Reagents and chemicals were purchased from Merck/Sigma-Aldrich in the best available grade. LC-MS grade solvents and mobile phase additives were purchased from Merck or Thermo Fisher Scientific. Peptides![[G with combining low line]](https://www.rsc.org/images/entities/char_0047_0332.gif)
![[A with combining low line]](https://www.rsc.org/images/entities/char_0041_0332.gif) SSEPVTGLDAK,
SSEPVTGLDAK, ![[Y with combining low line]](https://www.rsc.org/images/entities/char_0059_0332.gif)
![[I with combining low line]](https://www.rsc.org/images/entities/char_0049_0332.gif)
![[L with combining low line]](https://www.rsc.org/images/entities/char_004c_0332.gif) AGVENSK,
AGVENSK, ![[T with combining low line]](https://www.rsc.org/images/entities/char_0054_0332.gif)
![[P with combining low line]](https://www.rsc.org/images/entities/char_0050_0332.gif)
![[V with combining low line]](https://www.rsc.org/images/entities/char_0056_0332.gif) ITGAPYEYR,
ITGAPYEYR, ![[D with combining low line]](https://www.rsc.org/images/entities/char_0044_0332.gif) TPADFSEWSK, and
TPADFSEWSK, and ![[F with combining low line]](https://www.rsc.org/images/entities/char_0046_0332.gif) IIDPAAVIR from the well-characterized iRT set and standard peptides acetyl-LGGAGGLKG, acetyl-
IIDPAAVIR from the well-characterized iRT set and standard peptides acetyl-LGGAGGLKG, acetyl-![[K with combining low line]](https://www.rsc.org/images/entities/char_004b_0332.gif) LGGAGGLKG, acetyl-VKALKGLKG, and acetyl-LKALKGLKG with varied charges from the Alberta set were synthesized by Royobiotech (China).29,30 The first three letters of the peptide sequence is used to represent each peptide in graphs and tables henceforth. Unused leftovers of reconstituted trastuzumab (Herceptin®, Roche) were received from Multiscan Pharma (Czech Republic).
LGGAGGLKG, acetyl-VKALKGLKG, and acetyl-LKALKGLKG with varied charges from the Alberta set were synthesized by Royobiotech (China).29,30 The first three letters of the peptide sequence is used to represent each peptide in graphs and tables henceforth. Unused leftovers of reconstituted trastuzumab (Herceptin®, Roche) were received from Multiscan Pharma (Czech Republic).
2.2. Instrumentation and column
The separation columns used in the study were 2.1 × 150 mm Acquity UPLC BEH C18, 2.1 × 150 mm Acquity Premier CSH C18, and 1.0 × 150 mm Acquity UPLC CSH C18. All the separation columns were packed with 1.7 μm particles with 130 Å pore size and were procured from Waters. The mobile phase used during the entire study was mixed from components A (water) and B (acetonitrile), both acidified with varying concentrations of formic acid. Before initiating sample injections, the LC systems were purged, and the whole flow paths were conditioned with the desired concentration of formic acid for an hour, followed by at least three blank injections.
The MS1 settings and settings for the data-dependent acquisition (DDA) experiments are specified in the ESI (Table S1†).
2.3. Sample preparation
![[thin space (1/6-em)]](https://www.rsc.org/images/entities/char_2009.gif) :50 ratio at 37 °C overnight. The digest was acidified with TFA, and the precipitated deoxycholic acid was extracted using liquid–liquid extraction into ethyl acetate.33 The supernatant was desalted using the Pierce Peptide Desalting spin columns. The desalted peptides were vacuum-dried and reconstituted to a concentration of 1 μg μL−1 in 0.1% TFA.
:50 ratio at 37 °C overnight. The digest was acidified with TFA, and the precipitated deoxycholic acid was extracted using liquid–liquid extraction into ethyl acetate.33 The supernatant was desalted using the Pierce Peptide Desalting spin columns. The desalted peptides were vacuum-dried and reconstituted to a concentration of 1 μg μL−1 in 0.1% TFA.
2.4. Methods
All samples were injected as triplicates from the lowest to the highest concentration.With an aim to evaluate the effect of reduced formic acid concentration in the mobile phase on MS signal intensity, a mixture of iRT and Alberta peptides was separated on 2.1 × 150 mm ACQUITY UPLC CSH Premier column using a similar LC condition with mobile phase acidified with 0.10% and 0.01% formic acid. The peak height representing the MS signal intensity and peak area obtained from Skyline extracted chromatograms were used to assess the effect of formic acid concentration on the MS signal response of peptides.34
2.5. LC-MS data evaluation
The LC-MS data obtained from the trastuzumab were searched in Byonic v3.5 against the FASTA of trastuzumab downloaded from the Drug Bank.36,37 A fully specific search was chosen, and the mass tolerance was set to 5 ppm for precursors and 20 ppm for fragment ions. The peptides were screened for 57 N-glycans, typical for human plasma proteins. Methylthiolation of cysteine was set as a fixed modification, while methionine oxidation and cyclization of N-terminal glutamate and glutamine were selected as variable modifications. For quantitative evaluation, MS1 peak extraction was performed for the identified peptides stored in the prepared spectral library using Skyline v22.2.34 Maximum precursor peak and transition peak with the highest rank were filtered. We evaluated 56 peptides commonly identified in all conditions.The LC-MS data acquired from complex protein samples were searched using the Andromeda search engine38 in MaxQuant v 2.0.1.0.35 The FASTA database of Francisella tularensis (UP000076142) and a human FASTA database (UP000005640) downloaded from UniProt were used for respective LC-MS data. The search parameters were set to carbamidomethylation of cysteine as fixed modifications and methionine oxidation, cyclization of N-terminal glutamate and glutamine, N-terminal acetylation, dehydration of Asp and deamidation of Asn as variable modifications to assess in column-generated artificial modifications. The mass spectra were recalibrated with a peptide tolerance of 20 ppm first. The main search was carried out with a mass tolerance of 4.5 ppm. Fragment ion mass tolerance was set to 20 ppm. The results were filtered with a false discovery rate of 0.01.
GraphPad v9.4 was used to plot the graphs. The quantitative Venn diagrams were prepared using BioVenn and redrawn in GraphPad.39 Unless otherwise stated, all analyses were performed in triplicates, and the second replicate was used for representative demonstration.
The acquired LC-MS data files and output result data were deposited in the ProteomeXchange Consortium via the PRIDE partner repository with the dataset identifier PXD044781.40,41
3. Results and discussion
3.1. Effect of mobile phase with a reduced formic acid concentration on LC-MS performance using CSH separation column
First, it was essential to understand if a separation column with the CSH stationary phase can be used with a reduced formic acid concentration in the mobile phase without adverse effects on the chromatographic separation of peptides. To this end, we compared the chromatographic performance of the BEH column with the equivalent column packed with the CSH stationary phase by separating individual mixtures of iRT and Alberta peptides using mobile phase acidified with different concentrations of formic acid ranging from 0.10% to 0.01%. iRT peptides are well-characterized peptides used as standards to estimate the retention times for other peptides in a relative manner.29 The four Alberta peptides contain 1–4 lysine residues, which protonate in an acidic mobile phase and bear the charge from +1 to +4. The N-terminals are acetylated; hence, no charge develops on them. These Alberta peptides are synthetically alike, making them ideal candidates to evaluate the effect of formic acid concentration in the mobile phase on peptides with diverse charge states.30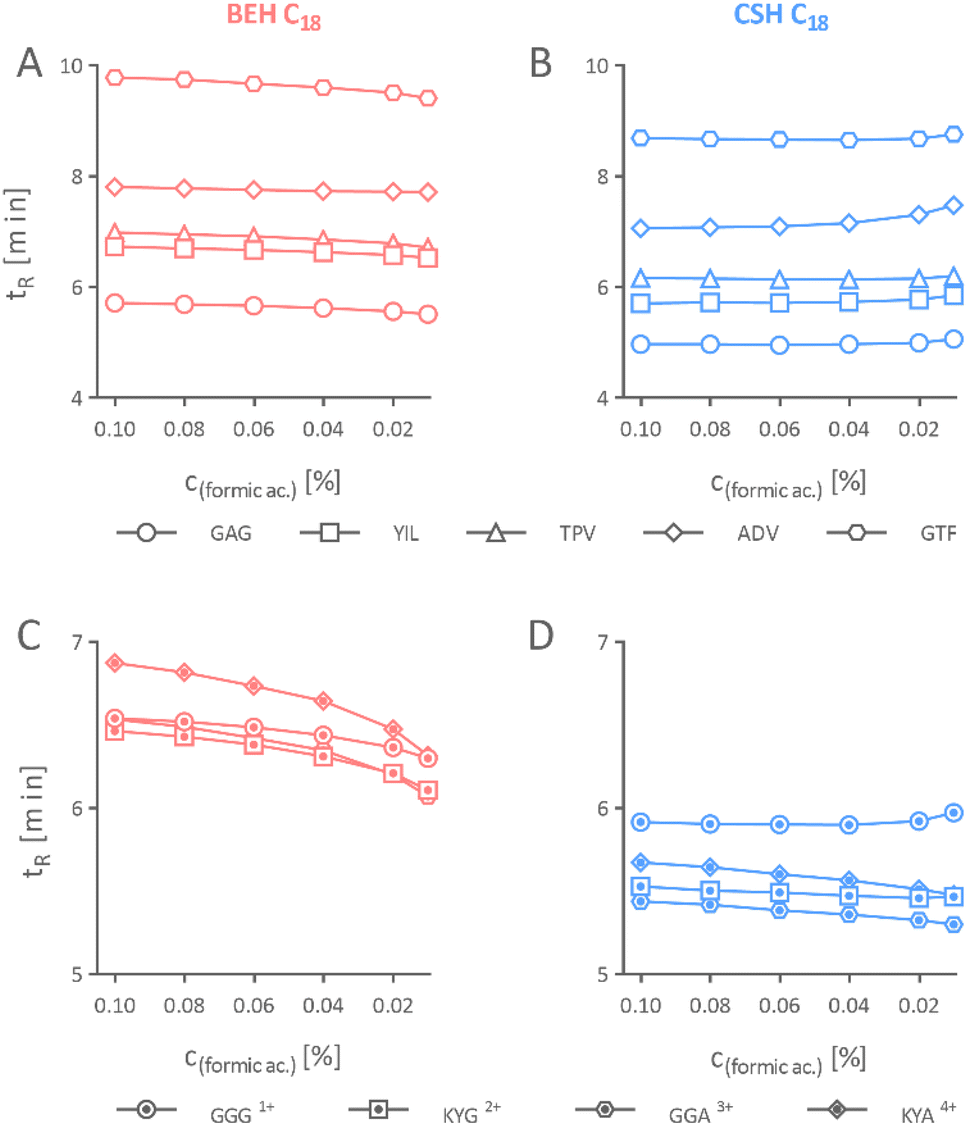 | ||
| Fig. 1 Effect of varied formic acid concentration in the mobile phase on retention time (tR) of peptides. The retention time of iRT peptides on 2.1 × 150 mm BEH (A) and CSH column (B). The retention time of Alberta peptides separated on 2.1 × 150 mm BEH (C) and CSH column (D). | ||
| Peptide | ΔtR, BEH | ΔtR, CSH |
|---|---|---|
| GAG | −0.203 | 0.095 |
| YIL | −0.207 | 0.140 |
| ADV | −0.090 | 0.420 |
| GTF | −0.370 | 0.070 |
| TPV | −0.270 | 0.037 |
| ac-GGG+1 | −0.240 | 0.057 |
| ac-KYG+2 | −0.353 | −0.063 |
| ac-GGA+3 | −0.463 | −0.140 |
| ac-KYA+4 | −0.557 | −0.193 |
 | ||
| Fig. 2 Effect of varied formic acid concentration in the mobile phase on the symmetry factor (As) of separated peptides. The symmetry factor of iRT peptide peaks on 2.1 × 150 mm BEH (A) and CSH column (B). The symmetry factor of the Alberta peptide peaks separated on 2.1 × 150 mm BEH (C) and CSH column (D). | ||
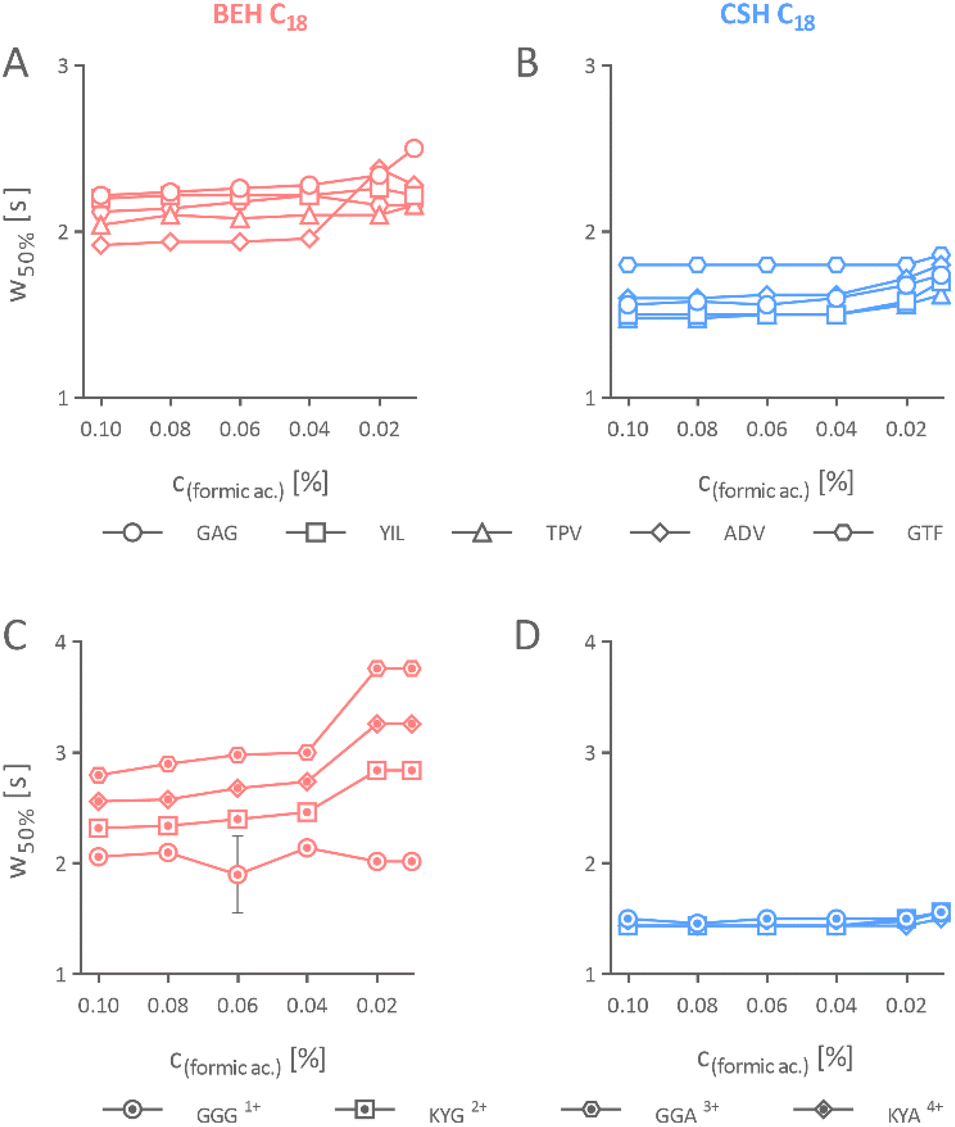 | ||
| Fig. 3 Effect on the separation performance of peptides separated using a varied formic acid concentration in the mobile phase. The peak width (w50%) of iRT peptide peaks on 2.1 × 150 mm BEH (A) and CSH column (B). The peak width of the Alberta peptide peaks separated on 2.1 × 150 mm BEH (C) and ACQUITY UPLC CSH column (D). | ||
Our result concluded that the peptides could be effectively separated on separation columns packed with the CSH stationary phase using mobile phase acidified even with a mere 0.01% formic acid, which is not possible when using an equivalent uncharged stationary phase of identical properties. Nevertheless, we do not recommend further reducing the concentration of formic acid as signs of peak broadening, yet still acceptable, appeared in the CSH stationary phase when it was 0.01% (Fig. 3B and D).
 | ||
| Fig. 4 The MS signal intensity (A) and peak area (B) of peptides separated using mobile phase acidified with 0.10% and 0.01% formic acid on 2.1 × 150 mm CSH column. The values above each bar represent the percentage change. | ||
3.2. Effect of mobile phase with a reduced formic acid concentration in analysis of protein sample with low complexity
Inspired by the appealing results from the first set of experiments using a simple mixture of standard peptides, we sought to confirm the hypothesis independently using a more complex sample. Separating the tryptic peptides derived from trastuzumab using 0.01% formic acid as an acidifier, we observed a 68% increase in the averaged total MS signal intensity of all 56 identified peptides (Fig. 5A–C). However, this led to only a marginal increase of 5% in number of identified peptides. The reason behind this was assumed to be the low complexity of the sample with fewer peptides to identify, sufficient injected amount, and sensitive MS instrument that led to almost 98% sequence coverage already in the control condition. Hence, the further gain in MS signal could not be translated into a significant improvement in the number of identified peptides. | ||
| Fig. 5 Base peak chromatogram of 0.5 μg of tryptic peptides of trastuzumab separated on 2.1 × 150 mm CSH column using mobile phase acidified with 0.10% (A) and 0.01% (B) formic acid in the mobile phase. The total peptide intensity of all identified peptides when using the mobile phase with a reduced formic acid (0.03%, 0.02%, and 0.01%) concentration compared to the control (0.10% in red); the numeric value represents the percentage gain (C). Correlations between retention time of peptides separated using mobile phase acidified with 0.10% and 0.01% formic acid (D). Retention time shifts (ΔtR) depending on the number of acidic residues in the peptide sequence (E). The peak width (w50%) for the identified peptides when separated using mobile phase acidified with 0.10% (red) and 0.01% (blue) formic acid with the numeric value and line representing the mean (F). | ||
To confirm if the improvement in the MS signal response obtained from the previous experiment is indeed associated with the formic acid concentration in the mobile phase, a similar experiment using mobile phase acidified with different concentrations of formic acid, yet significantly lower (0.03% and 0.02%) than the control, was performed. We observed a clear improvement in the MS signal intensity when using a lower formic acid concentration. However, the average total MS signal intensity increase of all 56 identified peptides was calculated to be 53% and 29% for 0.02% and 0.03% formic acid, respectively. This proves that the MS signal intensity is inversely proportional to the concentration of formic acid in the mobile phase (Fig. 5C).
When tryptic peptides of trastuzumab were separated with a mobile phase containing 0.01% formic acid, their elution order was practically identical to the control condition of 0.10% formic acid (Fig. 5D). An average increase in retention of 0.26 min was observed for all identified peptides upon reducing the acidifier concentration to 0.01%. Further investigation confirmed our findings that the increase in pH of the mobile phase caused by the reduction of formic acid concentration leads to a disproportional positive shift in retention, favoring peptides with a higher number of aspartic acid and glutamic acid (Fig. 5E). The peak width of the peptide peaks separated using the mobile phase with 0.01% formic acid was almost identical to those separated with 0.10% formic acid in the mobile phase (Fig. 5F).
We believe this simple approach may enable the detection of some low-abundant modifications without increasing the injection load in the analysis of biopharmaceuticals using ever-more popular multi-attribute methods.46,47
3.3. Effect of mobile phase with a reduced formic acid concentration in analysis of protein sample with moderate complexity
The samples used for bottom-up proteomic analysis are generally of high complexity and not just one protein. Hence, we decided to test the optimized method on more complex protein samples.Our next aim was to ascertain the optimum minimum formic acid concentration in the mobile phase for bottom-up analysis of complex protein samples. Lenčo et al. successfully demonstrated that under optimized conditions and with sufficient sample amount, separation columns with an inner diameter of 1.0 mm could provide a number of identifications comparable to a nanoflow column.48 Since then, the microflow LC-MS regime using a 1.0 mm inner diameter for protein analysis has been gaining popularity.49
In line with our previous findings, one microgram of F. tularensis LVS tryptic digest, when separated using mobile phase with 0.01% formic acid on a CSH column with 1.0 mm inner diameter, provided 63% improved total peptide intensity compared to the control condition of 0.10% formic acid. This intensity gain was relatively low, 13% and 35%, when 0.03% and 0.02% formic acid were employed as mobile phase acidifiers and compared with the control condition of 0.10% formic acid (Fig. 6A). Despite these gains in intensity, the effect of reducing the formic acid concentration sparsely translated to an increase in the extent of identification, 3.8%, 3.4%, and 3.2% for 0.03%, 0.02%, and 0.01% formic acid, respectively. We strongly believe this was because of the superior sensitivity of the MS instrument and the DDA mode. At the mass load of one microgram, most peptide peaks were likely above the DDA threshold and were selected for fragmentation. Hence, an additional increase in the MS signal intensity did not significantly increase the number of fragmented precursors and thereby identified peptides. To confirm this, we evaluated the effect of reduced formic acid concentration in the mobile phase when the sample with different sample loads was analyzed.
 | ||
| Fig. 6 Total MS intensity of all identified peptides when separated on 1.0 × 150 mm CSH column using mobile phase acidified with low formic acid concentrations of 0.03%, 0.02%, and 0.01% compared to control 0.10% formic acid (A). Peptide identification using mobile phase acidified with 0.10% formic acid and 0.01% formic acid (B). | ||
Our hypothesis was strongly supported by the dilution experiment of the F. tularensis LVS tryptic digest, which revealed a disproportional advantage of using a mobile phase with low formic acid concentrations for samples with low quantity (Fig. 6B).
Tryptic digest of F. tularensis LVS of amounts varied between 50 ng up to 2.5 μg was separated using identical LC-MS conditions. For a 2.5 μg sample injected, a 62% gain in total peptide intensity translated to only a 2% increase in identification, whereas an 85% gain in total peptide intensity led to a 56% increase in peptides identified for a 50 ng of the digest on using 0.01% formic acid as mobile phase acidifier compared to 0.10% formic acid (Fig. 6B). The results confirmed that using the mobile phase with low formic acid concentration provides a disproportional advantage, specifically for samples injected in low quantities.
Sample carryover has been a problem that has troubled researchers performing LC-MS analysis of protein samples. Due to the increased sensitivity of mass spectrometers, even the smallest sample carryover could influence the result. As the affinity of most peptides towards the C18 stationary phase increases with a decrease in formic acid concentration in the mobile phase when separated on the CSH column, we evaluated its impact on carryover. We did not observe any significant influence of reducing the formic acid concentration in the mobile phase on sample carryover. Total peptide intensity in the blank after injecting triplicate injections of 1 μg F. tularensis LVS tryptic digest was found to be just 0.030% and 0.026% for 0.01% formic acid and 0.10% formic acid containing mobile phase, respectively, which further dropped to 0.004% and 0.002% in the following blank injections. The study clearly demonstrated the advantage of using a mobile phase with low formic acid concentration to analyze bacterial whole-cell lysate with minimal adaptation to existing workflow.
3.4. Effect of mobile phase with a reduced formic acid concentration in analysis of protein sample with high complexity
In bottom-up proteomics, researchers often use extended gradients to separate the complex samples in the LC column to obtain improved protein coverage. Hence, to further strengthen the impact of our study, we decided to evaluate the effect of reduced formic acid concentration in the mobile phase for analysis of a complex protein digest separated over an extended LC gradient.An increase of total peptide intensity of 90% was observed when the tryptic digest of Jurkat cells proteins was separated on the 1.0 × 150 mm CSH column using mobile phase acidified with 0.01% formic acid as an acidifier (Fig. 7A–C). This increase in intensity translated to a 26% enhancement in the total number of peptides identified (Fig. 7D). The additional peptides identified exclusively in the low formic acid condition had lower median intensity in comparison to peptides identified in both conditions (median of 4.2 × 10⁶ for additional unique peptides versus a median of 9.0 × 10⁶ for common peptides) as presented in Fig. S2 of ESI,† rationalizing that the additional peptides identified are relatively low in intensity and might not have crossed the MS1 intensity threshold for triggering a DDA scan when analyzed using mobile phase with 0.10% formic acid which is now possible to identify in low formic acid conditions.
 | ||
| Fig. 7 Base peak chromatogram of 10 μg of tryptic peptides of Jurkat cells separated on 1.0 × 150 mm CSH column using 0.10% (A) and 0.01% (B) formic acid as mobile phase acidifiers. Total MS intensity of all identified peptides (C) and numbers of peptides (D) identified for Jurkat cells digest when separated using mobile phase acidified with 0.10% and 0.01% formic acid as mobile phase additive. Quantitative Venn diagram of unique peptide sequence identified across all triplicates for both conditions (E). Correlations between retention time (tR) of Jurkat cells peptides separated using mobile phase acidified with 0.10% and 0.01% formic acid (F). | ||
An average positive retention time shift of approximately 0.2% was observed for the peptides identified using 0.01% formic acid compared to 0.10% formic acid. However, the elution pattern for the peptides was practically comparable for both conditions (Fig. 7F).
To understand the effect of reduced formic acid concentration on in-column artificial modification of peptides, we inspected the occurrence of modifications routinely examined in LC-MS proteomic data evaluation. There was a slight but not significant increase in the number of modified peptides identified when using a low concentration of formic acid as an acidifier (Fig. S3 in ESI†). However, this is likely the result of improved intensity that led to increased identification of these modified peptides.
3.5. Effect of formic acid concentration on nanoLC system for bottom-up proteomics
Despite published studies demonstrating the efficiency of higher flow regimes for bottom-up proteomic application, nanoLC systems are still a workhorse in the majority of research labs for their sensitivity.3 Considering this, we evaluated the effect of reduced formic acid in the mobile phase for bottom-up proteomic application on nanoflow chromatographic systems hyphenated to MS.We observed an improvement in the number of identified peptides using mobile phase acidified with 0.01% formic acid compared to 0.10%. Reduced formic acid as a mobile phase acidifier proved advantageous for protein digest analysis, particularly in very low amounts of 2.5 and 5 ng, with 41% and 21% improvement in the number of identified peptides (Fig. 8). The exact reason for this over-proportional benefit of using low concentrations of formic acid for samples with low amounts is not apparent to us yet. However, a similar observation was documented by Hahne et al. when using DMSO as a mobile phase additive to enhance the ESI-MS response.16
 | ||
| Fig. 8 Peptides identified (A) and total peptide intensity (B) for tryptic HeLa digest, when separated on 75 μm × 250 mm nanoEase M/Z Peptide CSH column using mobile phase, acidified with 0.10% and 0.01% formic acid on a nanoLC system. | ||
4. Conclusions
In this study, we evaluated the effect of reduced formic acid concentration as a mobile phase acidifier on chromatographic separation and MS performance using columns packed with the C18-bonded reversed-phase particles with a positively charged surface. When using the CSH stationary phase, peptides can be efficiently separated even using a mobile phase acidified with a mere 0.01% formic acid. The results further demonstrate that using 0.01% formic acid as a mobile phase acidifier instead of the standard 0.10% combined with the separation columns with CSH stationary phase improves MS sensitivity with comparable chromatographic separation performance. The maximum benefit of this approach is when the sample analyzed is less in amount and hence is worth considering for sample analysis with sparse quantities. Furthermore, this method can be incorporated at minimal additional cost or modification in the existing instrument setup, and no other chemicals are needed. The study further confirms the efficiency of the CSH stationary phase in the bottom-up proteomic application using a low ionic strength mobile phase. As some analysts are interested in using weaker ion pairing additives to improve the MS signal response for their bottom-up proteomic application, we believe that the result findings will encourage them to use such modified stationary phase columns for better chromatographic performance in their required conditions. For existing CSH separation column users, reducing the concentration of formic acid in the mobile phase will improve peptide retention, thereby reducing the loss of some hydrophilic species during the injection. The pH change caused by reducing the formic acid concentration to 0.01% seems to be minuscule, and, unfortunately, it does not benefit in minimizing the low pH-based in-column degradation and artificial modification of peptides.To expand the applicability of the presented approach, we tested this concept on samples with varied complexity, separation columns with different dimensions, and using both microflow and nanoflow setups. We strongly believe that the findings of this study will encourage analysts performing bottom-up proteomics and aiming for improved MS intensity to implement this simple approach before resorting to complicated and expensive alternatives.
Author contributions
Siddharth Jadeja: Experiment, methodology, data analysis, writing – original draft, Review & editing, Rudolf Kupcik: Investigation, writing – review & editing, Ivo Fabrik: Investigation, writing – review & editing, Hana Sklenářová: Conceptualization, writing – review & editing, Juraj Lenčo: Conceptualization, funding acquisition, supervision, formal analysis, writing – review & editing.Conflicts of interest
There are no conflicts to declare.Acknowledgements
The authors gratefully acknowledge the financial support of the Project of the Czech Science Foundation (GAČR No. 22-21620S), the Project of the Charles University Grant Agency (GAUK No. 370522), and the SVV Project No. 260662.References
- Y. Zhang, B. R. Fonslow, B. Shan, M. C. Baek and J. R. Yates 3rd, Chem. Rev., 2013, 113, 2343–2394 CrossRef CAS PubMed
.
- P. Mallick and B. Kuster, Nat. Biotechnol., 2010, 28, 695–709 CrossRef CAS PubMed
- J. Lenčo, S. Jadeja, D. K. Naplekov, O. V. Krokhin, M. A. Khalikova, P. Chocholouš, J. Urban, K. Broeckhoven, L. Nováková and F. Švec, J. Proteome Res., 2022, 21, 2846–2892 CrossRef PubMed
- S. R. Shuken, J. Proteome Res., 2023, 22, 2151–2171 CrossRef CAS PubMed
- D. C. Guo, C. T. Mant and R. S. Hodges, J. Chromatogr., 1987, 386, 205–222 CrossRef CAS PubMed
- M. C. Garcia, J. Chromatogr. B: Anal. Technol. Biomed. Life Sci., 2005, 825, 111–123 CrossRef CAS PubMed
- A. Apffel, S. Fischer, G. Goldberg, P. C. Goodley and F. E. Kuhlmann, J. Chromatogr. A, 1995, 712, 177–190 CrossRef CAS PubMed
- S. A. Gustavsson, J. Samskog, K. E. Markides and B. Langstrom, J. Chromatogr. A, 2001, 937, 41–47 CrossRef CAS PubMed
- S. L. Zhou and M. Hamburger, Rapid Commun. Mass Spectrom., 1995, 9, 1516–1521 CrossRef CAS
- S. Wang, T. Xing, A. P. Liu, Z. He, Y. Yan, T. J. Daly and N. Li, Anal. Chem., 2019, 91, 3156–3162 CrossRef CAS PubMed
- F. E. Kuhlmann, A. Apffel, S. M. Fischer, G. Goldberg and P. C. Goodley, J. Am. Soc. Mass Spectrom., 1995, 6, 1221–1225 CrossRef CAS PubMed
- Z. G. Zhou, J. L. Zhang, J. W. Xing, Y. Bai, Y. P. Liao and H. W. Liu, J. Am. Soc. Mass Spectrom., 2012, 23, 1289–1292 CrossRef CAS PubMed
- C. C. Chan, M. S. Bolgar, D. Dalpathado and D. K. Lloyd, Rapid Commun. Mass Spectrom., 2012, 26, 1507–1514 CrossRef CAS PubMed
- Y. Mao, A. Kleinberg, Y. L. Zhao, S. Raidas and N. Li, Anal. Chem., 2020, 92, 8691–8696 CrossRef CAS PubMed
- M. A. Khalikova, L. Skarbalius, D. K. Naplekov, S. Jadeja, F. Švec and J. Lenčo, Talanta, 2021, 233, 122512 CrossRef CAS PubMed
- H. Hahne, F. Pachl, B. Ruprecht, S. K. Maier, S. Klaeger, D. Helm, G. Medard, M. Wilm, S. Lemeer and B. Kuster, Nat. Methods, 2013, 10, 989–991 CrossRef CAS PubMed
- J. G. Meyer and E. A. Komives, J. Am. Soc. Mass Spectrom., 2012, 23, 1390–1399 CrossRef CAS PubMed
- A. T. Iavarone and E. R. Williams, J. Am. Chem. Soc., 2003, 125, 2319–2327 CrossRef CAS PubMed
- P. Yu, H. Hahne, M. Wilhelm and B. Kuster, Anal. Bioanal. Chem., 2017, 409, 1049–1057 CrossRef CAS PubMed
- U. Distler, M. K. Łącki, S. Schumann, M. Wanninger and S. Tenzer, Anal. Chem., 2019, 91, 7510–7515 CrossRef CAS PubMed
- Z. Li and L. Li, Anal. Chem., 2014, 86, 331–335 CrossRef CAS PubMed
- J. Chen, F. J. Wang, Z. Y. Liu, J. Liu, Y. X. Zhu, Y. K. Zhang and H. F. Zou, J. Chromatogr. A, 2017, 1483, 101–109 CrossRef CAS PubMed
- T. Battellino, K. Ogata, V. Spicer, Y. Ishihama and O. Krokhin, J. Proteome Res., 2023, 22, 272–278 CrossRef CAS PubMed
- D. V. McCalley, Anal. Chem., 2006, 78, 2532–2538 CrossRef CAS PubMed
- D. V. McCalley, J. Chromatogr. A, 2005, 1075, 57–64 CrossRef CAS PubMed
- M. A. Lauber, S. M. Koza, S. A. McCall, B. A. Alden, P. C. Iraneta and K. J. Fountain, Anal. Chem., 2013, 85, 6936–6944 CrossRef CAS PubMed
- L. Nováková, H. Vlčková and P. Solich, Talanta, 2012, 93, 99–105 CrossRef PubMed
- J. Lenčo, T. Šemlej, M. A. Khalikova, I. Fabrik and F. Švec, J. Proteome Res., 2021, 20, 420–432 CrossRef PubMed
- C. Escher, L. Reiter, B. MacLean, R. Ossola, F. Herzog, J. Chilton, M. J. MacCoss and O. Rinner, Proteomics, 2012, 12, 1111–1121 CrossRef CAS PubMed
- D. V. McCalley, J. Chromatogr. A, 2004, 1038, 77–84 CrossRef CAS PubMed
-
T. F. Scientific, SMART Digest Kit User Manual, 2017, p. 2 Search PubMed
- J. Lenčo, M. A. Khalikova and F. Švec, J. Proteome Res., 2020, 19, 993–999 CrossRef PubMed
- Y. G. Yeung and E. R. Stanley, Curr. Protoc. Protein Sci., 2010 Search PubMed
- B. MacLean, D. M. Tomazela, N. Shulman, M. Chambers, G. L. Finney, B. Frewen, R. Kern, D. L. Tabb, D. C. Liebler and M. J. MacCoss, Bioinformatics, 2010, 26, 966–968 CrossRef CAS PubMed
- S. Tyanova, T. Temu and J. Cox, Nat. Protoc., 2016, 11, 2301–2319 CrossRef CAS PubMed
- M. Bern, Y. J. Kil and C. Becker, Curr. Protoc. Bioinformatics, 2012 Search PubMed
- D. S. Wishart, Y. D. Feunang, A. C. Guo, E. J. Lo, A. Marcu, J. R. Grant, T. Sajed, D. Johnson, C. Li, Z. Sayeeda, N. Assempour, I. Iynkkaran, Y. F. Liu, A. Maciejewski, N. Gale, A. Wilson, L. Chin, R. Cummings, D. Le, A. Pon, C. Knox and M. Wilson, Nucleic Acids Res., 2018, 46, D1074–D1082 CrossRef CAS PubMed
- J. Cox, N. Neuhauser, A. Michalski, R. A. Scheltema, J. V. Olsen and M. Mann, J. Proteome Res., 2011, 10, 1794–1805 CrossRef CAS PubMed
- T. Hulsen, J. de Vlieg and W. Alkema, BMC Genomics, 2008, 9, 488 CrossRef PubMed
- Y. Perez-Riverol, J. Bai, C. Bandla, D. Garcia-Seisdedos, S. Hewapathirana, S. Kamatchinathan, D. J. Kundu, A. Prakash, A. Frericks-Zipper, M. Eisenacher, M. Walzer, S. Wang, A. Brazma and J. A. Vizcaino, Nucleic Acids Res., 2022, 50, D543–D552 CrossRef CAS PubMed
- E. W. Deutsch, N. Bandeira, Y. Perez-Riverol, V. Sharma, J. J. Carver, L. Mendoza, D. J. Kundu, S. Wang, C. Bandla, S. Kamatchinathan, S. Hewapathirana, B. S. Pullman, J. Wertz, Z. Sun, S. Kawano, S. Okuda, Y. Watanabe, B. MacLean, M. J. MacCoss, Y. Zhu, Y. Ishihama and J. A. Vizcaino, Nucleic Acids Res., 2023, 51, D1539–D1548 CrossRef PubMed
- R. Nogueira, M. Lammerhofer and W. Lindner, J. Chromatogr. A, 2005, 1089, 158–169 CrossRef CAS PubMed
- C. T. Mant and R. S. Hodges, J. Chromatogr. A, 2006, 1125, 211–219 CrossRef CAS PubMed
- T. Nagayasu, C. Yoshioka, K. Imamura and K. Nakanishi, J. Colloid Interface Sci., 2004, 279, 296–306 CrossRef CAS PubMed
- R. E. Birdsall, J. Kellett, S. Ippoliti, N. Ranbaduge, M. A. Lauber, Y. Q. Yu and W. B. Chen, J. Chromatogr. B: Anal. Technol. Biomed. Life Sci., 2021, 1179, 122700 CrossRef CAS PubMed
- I. Sokolowska, J. Mo, F. Rahimi Pirkolachahi, C. McVean, L. A. T. Meijer, L. Switzar, C. Balog, M. J. Lewis and P. Hu, Anal. Chem., 2020, 92, 2369–2373 CrossRef CAS PubMed
- R. S. Rogers, N. S. Nightlinger, B. Livingston, P. Campbell, R. Bailey and A. Balland, mAbs, 2015, 7, 881–890 CrossRef CAS PubMed
- J. Lenčo, M. Vajrychová, K. Pimková, M. Prokšová, M. Benková, J. Klimentová, V. Tambor and O. Soukup, Anal. Chem., 2018, 90, 5381–5389 CrossRef PubMed
- Y. Y. Bian, C. L. Gao and B. Kuster, Expert Rev. Proteomics, 2022, 19, 153–164 CrossRef CAS PubMed
Footnote |
| † Electronic supplementary information (ESI) available. See DOI: https://doi.org/10.1039/d3an01508d |
| This journal is © The Royal Society of Chemistry 2023 |