 Open Access Article
Creative Commons Attribution 3.0 Unported Licence
Method for determining resin cure kinetics with low-frequency Raman spectroscopy†
Robert V.
Chimenti
 *ab,
Alexandra M.
Lehman-Chong
 bc,
Alyssa M.
Sepcic
 d,
Jamison D.
Engelhardt
 ab,
James T.
Carriere
 e,
Kayla A.
Bensley
 a,
Adam
Markashevsky
 d,
Jianwei
Tu
 b,
Joseph F.
Stanzione
III
 bc and
Samuel E.
Lofland
 ab
ab
aDepartment of Physics & Astronomy, Rowan University, 201 Mullica Hill Rd., Glassboro, NJ 08028, USA. E-mail: chimenti@rowan.edu
bAdvanced Materials & Manufacturing Institute (AMMI), Rowan University, 201 Mullica Hill Rd., Glassboro, NJ 08028, USA
cDepartment of Chemical Engineering, Rowan University, 201 Mullica Hill Rd., Glassboro, NJ 08028, USA
dDepartment of Mechanical Engineering, Rowan University, 201 Mullica Hill Rd., Glassboro, NJ 08028, USA
eCoherent Inc., 850 East Duarte Road, Monrovia, California 91016, USA
First published on 12th October 2023
Abstract
Characterizing resin extent of cure kinetics is critical to understanding the structure–property-processing relationships of polymers. The disorder band present in the low-frequency region of the Raman spectrum is directly related to conformational entropy and the modulus of amorphous materials, both of which change as the resin polymerizes. Normalizing the disorder band to its shoulder (∼85 cm−1) provides structural conversion kinetics, which we can directly correlate to chemical conversion kinetics for methacrylate and epoxy–amine based resin systems. In addition to fitting both the structural and chemical conversion data to a phenomenological kinetic rate equation, we also demonstrate a relationship between the chemical and structural kinetics which appears to relate to the softness of the material. Lastly, we use the method to investigate a methacrylate/epoxy interpenetrating polymer network resin system. We find that the structural and chemical conversions occur simultaneously during the formation of the primary (methacrylate) network, but there is a lag between the two during the formation of the secondary (epoxy–amine) network.
1. Introduction
Resin kinetics inform polymerization extent of cure and processing conditions, which are central to polymer network formation. How the polymer network is formed influences the final physical and mechanical properties of the material, and insufficient curing can be detrimental to the material's performance.1–5 Thus, characterization of the kinetics is important for understanding the structure–property–processing relationships of polymers, which is essential for industrial process development and quality control.6 Additionally, ensuring sufficient curing mitigates safety risks as unreacted monomers and other low molecular weight components could diffuse out of the material, causing adverse health effects. Cure kinetics are also important for determining adequate manufacturing times and establishing safe processing and storage conditions, especially in formulations that contain multicomponent reagents and initiators.7 Because of the complexity of multicomponent resin systems, there is a need for chemically independent techniques that can be implemented in situ into manufacturing processes.Many experimental techniques are used to monitor resin cure kinetics including changes in refractive index,8–10 rheology,11,12 and dielectric analysis13–15 although differential scanning calorimetry (DSC) and Fourier transform infrared (FTIR) spectroscopy are perhaps the most widely implemented. DSC exposes a sample to a thermal profile and measures the heat flow during the curing process.16–20 Monitoring kinetics with DSC assumes that the heat evolved is proportional to the extent of cure of reactive groups and that the reaction rate is proportional to the measured heat flow.17 Similarly, photo-DSC monitors the heat release of photocurable resins after being irradiated with UV or visible light.6,7,21,22 In both DSC and photo-DSC, factors such as the method of sample preparation, the heating rate of the DSC test, and specificity of temperature integral approximation can have effects on the calculations and results.17,23 Photo-DSC is also limited by the relatively long delay times due to the required low-intensity light.6
FTIR is used for monitoring the kinetics of both thermal and photocurable systems and provides chemical information about the resin as the absorption band is proportional to the bond concentration.6,7,24 In many cases, FTIR involves attenuated total reflection (ATR), which requires direct sample contact.5,25–27 This technique is useful for surface measurements but cannot provide information of a sample's interior nor is it suitable for in situ monitoring applications. Alternatively, conversion of the bulk polymer can be monitored in the near-IR range through transmission measurements, which can be adapted for in-line process monitoring.28–31 While effective for monitoring both physical and chemical properties of polymers, near-IR spectra contain overlapping overtones and combinations of bands from the mid-IR that often require nontrivial post-processing and chemometric data analysis.32,33
Raman spectroscopy has been used to study the real-time kinetics of different polymerization reactions such as those of microemulsions and epoxy resin systems.4,34–36 Raman is a sensitive probe of nonpolar molecules, and as a noncontact, non-destructive technique, it is suitable for in situ monitoring of cure kinetics. Raman spectra can be subdivided into three main regions known as the stretch region (>2000 cm−1), the chemical fingerprint region (∼500 cm−1–∼2000 cm−1), and the structural region (<500 cm−1). However, thus far, Raman-based polymerization kinetics studies have focused exclusively on signals in the chemical fingerprint region,4,34,35 such as the methacrylate (C![[double bond, length as m-dash]](https://www.rsc.org/images/entities/char_e001.gif) C) band at ∼1640 cm−1 and the epoxy band (–CH–O–CH2) at ∼1250 cm−1.
C) band at ∼1640 cm−1 and the epoxy band (–CH–O–CH2) at ∼1250 cm−1.
Raman scattering in the low-frequency (terahertz) region, which is a subset of the structural region, is directly related to the phonon density of states g(ν).37–40 In highly ordered crystalline materials, acoustic phonon modes produce sharp bands in the Raman spectrum, but as the material becomes less ordered, these modes tend to broaden and redshift simultaneously. For soft amorphous materials, g(ν) is dominated by two main features – the Boson and van Hove peaks.40–50 In amorphous polymers, the Raman scattering intensity IR(ν) can be directly related to g(ν) by
 | (1) |
We have previously shown that these phonon modes result in a broad (∼150 cm−1 wide) disorder band in polymers with an apparent peak near 15 cm−1 and a well-defined shoulder dominated by the Boson and van Hove peaks, respectively.37 In that work, we showed that by normalizing the disorder band to the shoulder, the integrated intensity near the peak of the disorder band could be used to measure the effective change in conformational entropy as a polymer goes through the glass transition, without the need for advanced spectral processing or peak fitting.
In this work, we describe how this same methodology can be applied to measure polymerization kinetics by monitoring the decrease in the normalized disorder band as a resin polymerizes. Since the disorder band in soft amorphous materials is a universal feature, this approach benefits from combining the “chemically agnostic” nature of traditional thermal-mechanical analysis methods with the non-contact, non-destructive nature of laser-based vibrational spectroscopy. Herein, we demonstrate the universality of this technique by detecting transient structural changes during the curing process of methacrylate, epoxy–amine, and dual-cure methacrylate/epoxy interpenetrating polymer network (IPN) resins.
2. Materials and methods
2.1. Materials and sample preparation
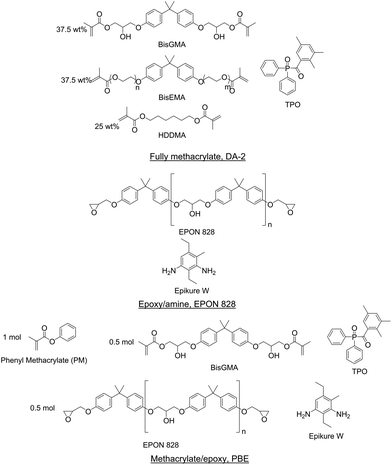
Three resins were formulated for this study to represent a wide array of materials: fully methacrylate, epoxy–amine, and methacrylate/epoxy. Resins were prepared such that the methacrylate functionalities polymerized via photoinitiated free radical polymerization and the epoxy–amine components cured thermally. Fig. 1 shows the components of each resin formulation. All components were used as received in this study.A fully methacrylate resin (DA-2) was prepared from 37.5 wt% bisphenol A glycerolate dimethacrylate (BisGMA, Esstech), 37.5 wt% ethoxylated bisphenol A dimethacrylate (BisEMA, Esstech), and 25 wt% 1,6-hexanediol (HDDMA, Esstech) according to Tu et al.54 Diphenyl(2,4,6-trimethylbenzoyl)phosphine oxide (TPO, TCI America) was added as a photoinitiator at 2 wt% based on the total mass of resin.
An epoxy–amine resin was prepared from a diglycidyl ether of bisphenol A resin (EPON 828, Hexion) and a diethylmethylbenzenediamine resin (Epikure W, Hexion). The epoxy equivalent weight (EEW) for EPON 828 was 186.1 g eq.−1 and the amine hydrogen equivalent weight (AHEW) of Epikure W was 44.6 g eq.−1. These components were formulated with 1![[thin space (1/6-em)]](https://www.rsc.org/images/entities/char_2009.gif) :
:![[thin space (1/6-em)]](https://www.rsc.org/images/entities/char_2009.gif) 1 equivalents of epoxide to amine hydrogen. The epoxy–amine resin is herein referred to as EPON 828.
1 equivalents of epoxide to amine hydrogen. The epoxy–amine resin is herein referred to as EPON 828.
A dual-cure methacrylate/epoxy IPN resin was prepared by combining methacrylate and epoxy–amine resin components. The epoxy–amine component was prepared with EPON 828 and Epikure W with 1![[thin space (1/6-em)]](https://www.rsc.org/images/entities/char_2009.gif) :
:![[thin space (1/6-em)]](https://www.rsc.org/images/entities/char_2009.gif) 1 equivalents of epoxide to amine hydrogen. Phenyl methacrylate (inhibited with 100 ppm of hydroquinone, Scientific Polymer Products), BisGMA, and the epoxy–amine were formulated based on 1
1 equivalents of epoxide to amine hydrogen. Phenyl methacrylate (inhibited with 100 ppm of hydroquinone, Scientific Polymer Products), BisGMA, and the epoxy–amine were formulated based on 1![[thin space (1/6-em)]](https://www.rsc.org/images/entities/char_2009.gif) :
:![[thin space (1/6-em)]](https://www.rsc.org/images/entities/char_2009.gif) 0.5
0.5![[thin space (1/6-em)]](https://www.rsc.org/images/entities/char_2009.gif) :
:![[thin space (1/6-em)]](https://www.rsc.org/images/entities/char_2009.gif) 0.5 molar equivalents, respectively. This resin formulation is denoted as PBE. TPO was added as the photoinitiator at 2 wt% based on the total resin.
0.5 molar equivalents, respectively. This resin formulation is denoted as PBE. TPO was added as the photoinitiator at 2 wt% based on the total resin.
All resin formulations were mixed with an ARE-310 planetary mixer (Thinky) programmed for 10 min at 2000 rpm to mix and 5 min at 2200 rpm to defoam. This mixing cycle was repeated until all components were fully dispersed homogenously (2–3 cycles). After mixing a given formulation, resin was applied onto a 4 × 6 × 0.020 in3 steel test panel and spread with an adjustable film coater set to a thickness of 500 μm. A 25 × 25 × 0.15 mm3 glass cover slip was then placed on top of the resin to mitigate oxygen inhibition at the surface, and the excess resin was removed.
2.2. Experimental setup
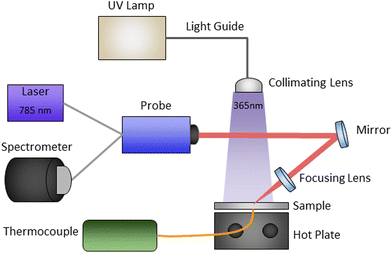
The experimental setup, shown schematically in Fig. 2, enabled in situ real-time polymerization kinetics monitoring of photo, thermal, and sequential photo-thermal cure. This was accomplished with a 0.25-in thick aluminium plate with an embedded thermocouple seated on top of a hot plate as the sample platform. Light from an Omnicure Series 2000 high-power xenon source (Excelitas Technologies) was passed through a 365 nm bandpass filter, fiber-coupled to a large core “light pipe”, and then collimated directly above the sample platform to allow for relatively uniform illumination of the resins. The Raman scattering measurements were done with a 785 nm CleanLine laser and TR-PROBE from Coherent Inc. with a 37.5 mm focal length aspheric lens for both excitation and collection. The TR-PROBE can filter both Stokes and anti-Stokes Raman scattering to within approximately ±7 cm−1 of the Rayleigh line. The scattered light was then fiber-coupled directly into an EAGLE Raman-S (Ibsen Photonics) high-throughput transmission (f/1.6) spectrograph. Raman scattered light was collected with a deep depleted back-illuminated thermoelectrically cooled (−60 °C) CCD camera (Andor Instruments) with a 950 ms integration time. The UV illumination intensity was controlled by a combination of lamp settings and adjustments to the height between the collimating lens and the sample platform, and the light intensities were measured with a Thorlabs power meter.2.3. Data processing and analysis
All Raman spectra were analyzed with custom MATLAB code, which included an adaptive, iteratively reweighted Penalized Least Squares algorithm for baseline correction for data in the chemical fingerprint region. No baseline correction was needed in the structural region. Cosmic rays and other anomalous spikes in the spectra were removed with a custom 6-sigma algorithm. The conversion α was calculated from the following relationship, | (2) |
![[double bond, length as m-dash]](https://www.rsc.org/images/entities/char_e001.gif) C stretch (∼1637 cm−1), respectively.55 For epoxy–amine kinetics, the variable and reference peaks were the epoxy ring breathing mode (∼1250 cm−1) and the phenyl band (∼1109 cm−1), respectively.35 All integrated intensities were determined with bounds of ±7 cm−1 of the line center.
C stretch (∼1637 cm−1), respectively.55 For epoxy–amine kinetics, the variable and reference peaks were the epoxy ring breathing mode (∼1250 cm−1) and the phenyl band (∼1109 cm−1), respectively.35 All integrated intensities were determined with bounds of ±7 cm−1 of the line center.
Conversion data were fit with linear least squares regression to the integrated form of the following kinetic rate equation,
 | (3) |
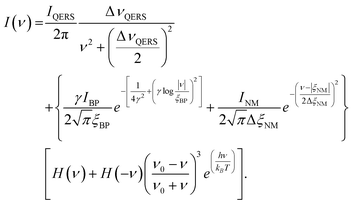
When performing Raman spectral band fitting, the data were corrected for filter and spectrometer roll-off by calibration with a broadband white light source in the region between ±200 cm−1. Then the spectra were normalized for Stokes scattering and fitted to the following first principles model,37
 | (4) |
3. Results and discussion
3.1. UV cured methacrylate resin
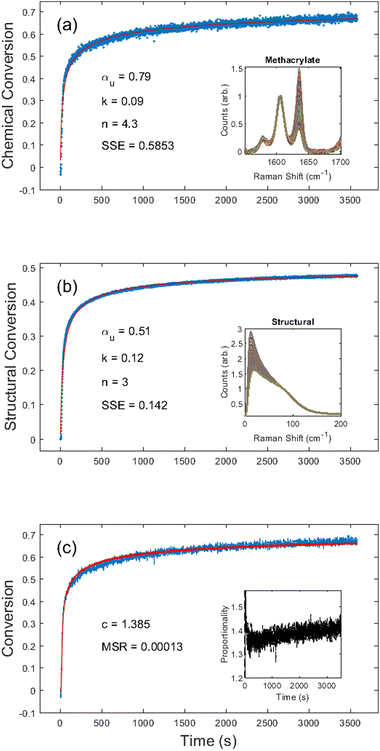
First, we chose to look at the cure kinetics of the DA-2 formulation since it had been previously studied with ATR-FTIR by Tu et al.5Fig. 3(a) shows the methacrylate conversion based on the Raman results from the chemical region for measurements done with a 365 nm light source with an illumination intensity of 0.76 mW cm−2. An unconstrained fit of the chemical conversion data resulted in αu = 0.79, k = 0.09, and n = 4.3 with a sum square error, SSE, of 0.59. The previous FTIR analysis of DA-2 with 0.7 wt% phenylbis(2,4,6-trimethylbenzoyl)phosphine oxide as the photoinitiator, under various illumination intensities at a wavelength of 405 nm yielded αu = 0.74 and n = 4.4. The k values cannot be compared as the previous analysis modified the rate constant by including an intensity dependent prefactor in the kinetic rate equation: , where IE is the light intensity and ω the dose rate exponent with a reported value of 0.71.5
Visual inspection of the structural kinetics data (Fig. 3b) clearly shows the same general shape of the curve, with an improved signal-to-noise ratio. It should be noted that an unconstrained fit produced kinetic constants of αu = 0.51, n = 3.0, and k = 0.12 with an SSE of 0.14, which do not match the chemical kinetics values. This is not unexpected since chemical conversion is a direct measure of monomer polymerization whereas structural conversion reflects the change in phonon dispersion. Therefore, the conversion values do not have the same physical meaning in structural kinetics as they do in chemical kinetics. However, as shown in Fig. 3c, there is a scaling factor c = 1.39 between the chemical and structural conversion curves of DA-2 with a mean square residual, MSR, of 0.0001. Over the course of 12 different DA-2 experiments (see ESI Table S.1†) with light intensities ranging from 0.22–1.08 mW cm−2 we found the scaling constant was robust with a value of c = 1.40 ± 0.02. That is, while the kinetic constants appear to be significantly different, the curves actually only differ by a scaling factor due to the differences in what is being probed.
3.2. Thermally cured epoxy–amine resin
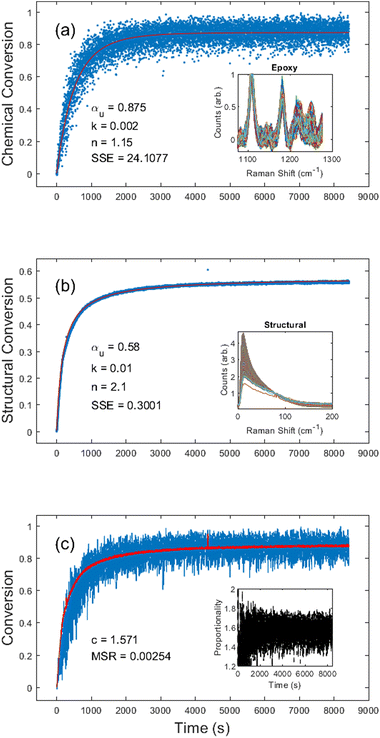
Next, we investigated the EPON 828 thermally cured at 180 °C. Results shown in Fig. 4 clearly demonstrate the ability to generate both chemical and structural conversion curves. Unconstrained fitting produced kinetic constants of αu = 0.88, k = 0.002, and n = 1.2 for the chemical conversion, and αu = 0.58, k = 0.01, and n = 2.1 for the structural conversion. Due to the combination of low Raman scattering efficiency and the broad overlapping shape of peaks in this region, the chemical conversion is inherently noisy (Fig. 4a) with a large SSE of 24.11. By contrast, the noise in the structural conversion data (Fig. 4b) is comparable to that of the data of the UV-cured resin system. Fig. 4c gives c = 1.57 for the two curves with an MSR of 0.0025, further demonstrating the self-consistency between the chemical and structural kinetics. It should be noted that, unlike the DA-2 resin where the proportionality constant settled in under 1 min, the EPON 828 took nearly 15 min before the proportionality constant stabilized. Over the course of 10 different experiments (see ESI Table S.2†) with the EPON 828 system with ∼180 °C cure temperature, the average proportionality constant was c = 1.71 ± 0.26.It should also be noted that in some of the EPON 828 experiments there was an apparent initial dip in the structural conversion, likely due to a transient drop in viscosity prior to gelation. For the purposes of calculating the c values, the conversion curves were truncated to remove any such initial drops, if necessary (see ESI†).
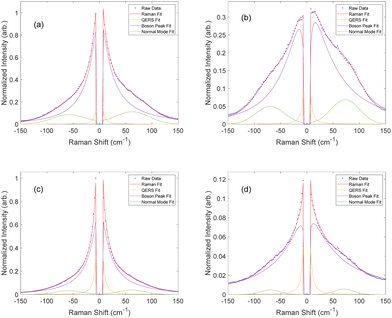
Upon peak fitting, we determined the relative contributions to the disorder band from the quasi-elastic Rayleigh scattering, Boson peak, and normal mode dominated by the van Hove peak.37,57Fig. 5 shows the fitted results at the end of the cure for both resin formulations, clearly demonstrating the simultaneous blueshift and decrease in the Boson peak after cure. It is important to note that EPON 828 is softer than the DA-2, with the two polymers having reported storage moduli of 2.1 GPa and 3.0 GPa, respectively54,58 and EPON 828 is cured at elevated temperatures, further softening it which accounts for the difference in the final Boson peak locations: 12 cm−1 for EPON 828 and 16 cm−1 for DA-2. Nonetheless, these differences in the phonon dispersion have no noticeable impact on the applicability of this method to measure the polymerization of the two resin systems, but the difference in moduli likely contributes to the difference in the c values between the two resin systems.
3.3. Dual-cure IPN resin
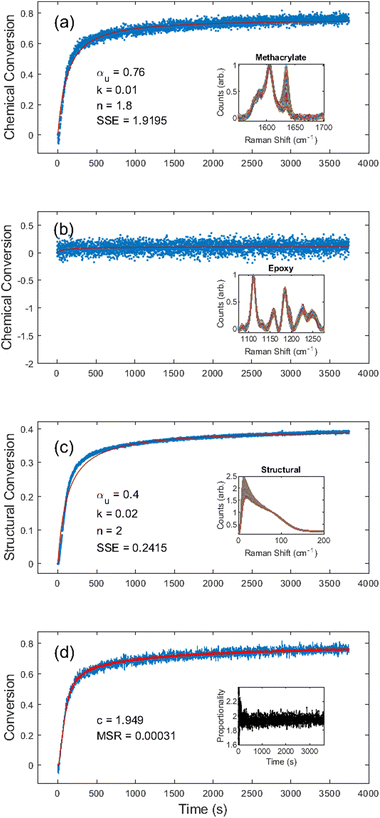
Lastly, to investigate the universality of the method, we analyzed the PBE dual-functional IPN resin system. Fig. 6 shows the results of both the methacrylate, epoxy, and structural conversions at room temperature over a 1 h exposure to 365 nm light with an intensity of 1.01 mW cm−2. Using the same methodology as the previous resin, we were able to measure both chemical (methacrylate and epoxy) and structural conversion. Unconstrained fitting produced kinetic constants of αu = 0.76, k = 0.01, and n = 1.8 for the methacrylate chemical conversion, and αu = 0.40, k = 0.02, and n = 2.0 for the structural conversion. As expected, there was no observable epoxy chemical conversion (Fig. 6b). Both the methacrylate chemical and structural conversion fits had a relatively low SSE of 1.92 and 0.24, respectively. However, upon visual inspection of Fig. 6a and c, it is obvious that below 500 s, the fit is not as good as those in the other two resin systems, resulting from the relatively long inhibition time (higher activation energy) of the PBE resin. Both fits could have been improved by accounting for inhibition, but that was beyond the scope of this study.Fig. 6d shows that for the methacrylate fingerprint and structural conversion curves c = 1.95 with an MSR of 0.0003. Over the course of 14 different PBE experiments (see ESI Table S.3†) with light intensities ranging from 0.21–1.03 mW cm−2, we found c = 1.98 ± 0.02. In addition to further validating the self-consistency between the chemical and structural conversions, this is also in accord with our hypothesis regarding the correlation between the modulus and the proportionality constant. Since the PBE resin was not thermally post-cured, the epoxy–amine network was not able to form, resulting in a significantly softer material and, therefore, a higher proportionality constant. Upon peak fitting, the final Boson peak position of the photocured PBE resin was determined to be 16 cm−1, which is identical to the results of the fully methacrylate DA-2 resin.
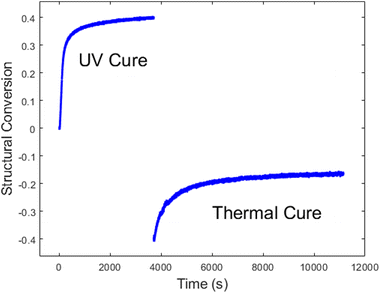
Lastly, we evaluated the PBE resin through the entire dual cure process. First it was photocured with an illumination intensity of 1.02 mW cm−2 for 1 h, at which time the UV lamp was turned off, and data collection was paused. The sample was removed while the stage was heated to 180 °C. The sample was then placed back on the temperature stage, and data collection was resumed for 2 h, simulating a traditional post-cure in a preheated oven. Fig. 7 shows the change in the spectral weight of the disorder band, which reflect the kinetics of both the UV and thermal cures. The sizeable negative step discontinuity in the data is due primarily to the temperature dependence of the low-frequency Raman signal, as shown in eqn (1) and (4). However, there may also be additional contributions due to uncertainty in sample placement during the thermal cure.
We independently analysed the UV and thermal cure regions to gain a deeper insight into the cure kinetics. During the photocure, no measurable conversion was present from the epoxy. The kinetic constants from the methacrylate chemical conversion were αu = 0.79, k = 0.010, and n = 1.83 with an SSE of 1.72, and the kinetic constants from the structural conversion were αu = 0.39, k = 0.010, and n = 1.4 with an SSE of 0.34. We also determined that the methacrylate-to-structural proportionality constant was c = 1.97. As expected, these results are extremely close to those shown in Fig. 6.
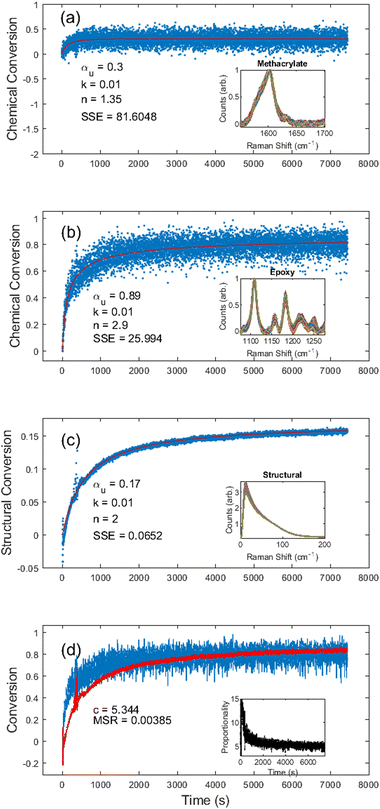
The thermal cure kinetics unveiled several interesting kinetic processes beyond simple epoxy–amine polymerization. One interesting observation is additional methacrylate polymerization during the first 500 s of the thermal cure (Fig. 8a). We believe this may result from increased chain mobility above the glass transition temperature and increased internal energy allowing the release of trapped free radicals from dissolved oxygen. We were able to determine kinetic constants for the additional methacrylate conversion of αu = 0.3, k = 0.010, and n = 1.35; although it should be noted that the data were quite noisy, resulting in an SSE of 81.6. Still, an additional cure of 0.3 indicates a 30% increase over the photocure, which had an ultimate cure of 0.79, implying complete methacrylate conversion after thermal processing.
During the thermal cure, the epoxy chemical conversion was given by kinetic constants αu = 0.89, k = 0.010, and n = 2 with an SSE of 25.99 (Fig. 8b), and the kinetic constants from the structural conversion were αu = 0.17, k = 0.010, and n = 2 with an SSE of 0.07 (Fig. 8c). As illustrated in Fig. 8d, the structural conversion appears to lag the chemical conversion for the first half hour of the thermal cure. We hypothesize this is an indication that during the initial polymerization of the secondary network (epoxy–amine), the modulus is still dominated by the primary network (methacrylate), resulting in slower structural kinetics. However, since both curves tend to overlap after approximately 70% conversion, it seems that once the secondary network has sufficiently percolated through the primary network, the epoxy polymerization eventually begins to correlate directly with changes in the modulus.
4. Conclusion
These results demonstrate the applicability of utilizing the disorder band present in the low-frequency region of the Raman spectra as a measure of the polymer extent of cure. This band is a universal feature of amorphous materials, providing a noncontact and chemically agnostic methodology for determining polymerization kinetics. Through the use of the structural-to-chemical proportionality constant, we have demonstrated the ability to correlate the decrease in the overall disorder of the material and the reduction in the bond concentration of polymerization reactive functional groups. The large Raman scattering efficiency in the low-frequency provides a noticeable improvement in the signal-to-noise ratio. Although the effects of curing at elevated temperature (e.g., changes in viscosity and low-frequency Raman scattering intensity) require additional exploration, the improved signal-to-noise and chemically agnostic nature of structural cure kinetics is particularly promising for epoxy systems which have been historically difficult to measure with traditional vibrational spectroscopy.59 Analysis of a dual-cure IPN has shown a discrepancy between the structural and chemical conversion kinetics, indicating a different relationship between polymerization and modulus as the secondary network forms in the presence of the primary network. Further rheological studies are needed to test this hypothesis.Author contributions
Robert V. Chimenti: conceptualization, data curation, formal analysis, investigation, methodology, project administration, resources, software, supervision, validation, visualization, and writing – original draft. Alexandra M. Lehman-Chong: data curation, investigation, methodology, resources, supervision, writing – original draft. Alyssa M. Sepcic: data curation, formal analysis, investigation, visualization, writing – review & editing. Jamison Engelhardt: data curation, investigation, resources, supervision, writing – review & editing. James T. Carriere: conceptualization, resources. Kayla A. Bensley: data curation, formal analysis, investigation, writing – review & editing. Adam Markashevsky: data curation, formal analysis, investigation. Jianwei Tu: methodology, resources, software, validation, and writing – review & editing. Joseph F. Stanzione, III: funding acquisition, resources, supervision. Samuel E. Lofland: formal analysis, methodology, supervision, validation, and writing – original draft.Conflicts of interest
There are no conflicts to declare.Acknowledgements
We thank the U.S. Army Research Laboratory for the financial support through the cooperative agreement number W911NF-17-2-0227. We would also like to thank Seamus Fullerton for his assistance in tabulating the supplemental data tables.References
- S. Sourour and M. Kamal, Thermochim. Acta, 1976, 14, 41–59 CrossRef CAS.
- M. Ivankovic, L. Incarnato, J. M. Kenny and L. Nicolais, J. Appl. Polym. Sci., 2003, 90, 3012–3019 CrossRef CAS.
- N. Davidenko, O. García and R. Sastre, J. Appl. Polym. Sci., 2005, 97, 1016–1023 CrossRef CAS.
- R. Hardis, J. L. P. Jessop, F. E. Peters and M. R. Kessler, Composites, Part A, 2013, 49, 100–108 CrossRef CAS.
- J. Tu, Y. Kashcooli, N. J. Alvarez and G. R. Palmese, Addit. Manuf., 2022, 59, 103102 CAS.
- M. Lang, S. Hirner, F. Wiesbrock and P. Fuchs, Polymers, 2022, 14, 2074 CrossRef CAS PubMed.
- O. Konuray, J. M. Salla, J. M. Morancho, X. Fernández-Francos, M. García-Alvarez and X. Ramis, Thermochim. Acta, 2020, 692, 178754 CrossRef CAS.
- P. Huang, Y. Lin, Y. Bai, Z. Ni, S. Xie and B. Dong, Measurement, 2022, 205, 112184 CrossRef.
- B. Dong and B. Pan, Appl. Phys. Lett., 2020, 116, 054103 CrossRef CAS.
- A. Cusano, G. Breglio, M. Giordano, A. Calabrò, A. Cutolo and L. Nicolais, Sens. Actuators, A, 2000, 84, 270–275 CrossRef CAS.
- M. H. Karami, M. R. Kalaee, S. Mazinani, M. Shakiba, S. Shafiei Navid, M. Abdouss, A. Beig Mohammadi, W. Zhao, M. Koosha, Z. Song and T. Li, Molecules, 2022, 27, 2870 CrossRef CAS PubMed.
- S. K. Romberg and A. P. Kotula, Addit. Manuf., 2023, 71, 103589 CAS.
- Z. Wu, Q. Chen, D. Liu, J. Fan, Q. Zhang and W. Chen, Polym. Test., 2023, 117, 107871 CrossRef CAS.
- U. Müller, C. Pretschuh, R. Mitter and S. Knappe, Int. J. Adhes. Adhes., 2017, 73, 45–50 CrossRef.
- D. G. Lee and H. G. Kim, J. Compos. Mater., 2004, 38, 977–993 CrossRef CAS.
- TA Instiments, A Review of DSC Kinetics Methods, TA073, 2010, https://www.tainstruments.com/pdf/literature/TA073.pdf.
- F. Wu, X. Zhou and X. Yu, RSC Adv., 2018, 8, 8248–8258 RSC.
- K. Mphahlele, S. S. Ray and A. Kolesnikov, Composites, Part B, 2019, 176, 107300 CrossRef CAS.
- ASTM E698-18, Standard Test Method for Kinetic Parameters for Thermally Unstable Materials Using Differential Scanning Calorimetry and the Flynn/Wall/Ozawa Method, Last Updated: Aug 15, 2023 https://www.astm.org/e0698-18.html.
- G. Mashouf Roudsari, A. K. Mohanty and M. Misra, ACS Sustainable Chem. Eng., 2014, 2, 2111–2116 CrossRef CAS.
- J. W. Kopatz, J. Unangst, A. W. Cook and L. N. Appelhans, Addit. Manuf., 2021, 46, 102159 CAS.
- F. Jiang and D. Drummer, Polymers, 2020, 12, 1080 CrossRef CAS PubMed.
- J. Bachmann, E. Gleis, S. Schmölzer, G. Fruhmann and O. Hinrichsen, Anal. Chim. Acta, 2021, 1153, 338268 CrossRef CAS PubMed.
- T. Chartier, C. Dupas, P.-M. Geffroy, V. Pateloup, M. Colas, J. Cornette and S. Guillemet-Fritsch, J. Eur. Ceram. Soc., 2017, 37, 4431–4436 CrossRef CAS.
- J. Wu, Z. Zhao, C. M. Hamel, X. Mu, X. Kuang, Z. Guo and H. J. Qi, J. Mech. Phys. Solids, 2018, 112, 25–49 CrossRef CAS.
- L. H. J. Jeewantha, K. D. C. Emmanuel, H. M. C. M. Herath, J. A. Epaarachchi, M. M. Islam and J. Leng, Materialia, 2022, 21, 101264 CrossRef CAS.
- T. Ishida, R. Watanabe, H. Shinzawa, J. Mizukado, H. Hagihara, R. Kitagaki and Y. Elakneswaran, Polym. Test., 2022, 112, 107587 CrossRef CAS.
- A. C. Uzcategui, C. I. Higgins, J. E. Hergert, A. E. Tomaschke, V. Crespo-Cuevas, V. L. Ferguson, S. J. Bryant, R. R. McLeod and J. P. Killgore, Small Sci., 2021, 1, 2000017 CrossRef CAS PubMed.
- Y. Zhang, D. E. Kranbuehl, H. Sautereau, G. Seytre and J. Dupuy, Macromolecules, 2008, 41, 708–715 CrossRef CAS.
- A. P. Nowak, A. F. Gross, K. Drummey, A. M. Nelson, A. Hocken, C. Q. Pritchard, R. Mott, M. Ventuleth and J. Graetz, ACS Appl. Polym. Mater., 2022, 4, 5027–5034 CrossRef CAS.
- E. Matušková, J. Vinklárek and J. Honzíček, Ind. Eng. Chem. Res., 2021, 60, 14143–14153 CrossRef.
- J. C. Bart, E. Gucciardi and S. Cavallaro, Biolubricants: science and technology, Elsevier, 2012 Search PubMed.
- N. Heigl, A. Greiderer, C. H. Petter, O. Kolomiets, H. W. Siesler, M. Ulbricht, G. K. Bonn and C. W. Huck, Anal. Chem., 2008, 80, 8493–8500 CrossRef CAS PubMed.
- L. Feng and K. Y. S. Ng, Macromolecules, 1990, 23, 1048–1053 CrossRef CAS.
- B. Martin, J. Puentes, L. Wruck and T. A. Osswald, Polym. Eng. Sci., 2018, 58, 228–237 CrossRef CAS.
- A. P. Kotula, J. W. Woodcock, J. W. Gilman and G. A. Holmes, Polymer, 2023, 278, 125967 CrossRef CAS.
- R. V. Chimenti, J. T. Carriere, D. M. D’Ascoli and J. D. Engelhardt, Appl. Phys. Lett., 2023, 122, 264101 CrossRef CAS.
- A. P. Sokolov, U. Buchenau, W. Steffen, B. Frick and A. Wischnewski, Phys. Rev. B: Condens. Matter Mater. Phys., 1995, 52, R9815–R9818 CrossRef CAS PubMed.
- N. V. Surovtsev and A. P. Sokolov, Phys. Rev. B: Condens. Matter Mater. Phys., 2002, 66, 054205 CrossRef.
- S. A. Kirillov and O. F. Nielsen, J. Mol. Struct., 2000, 526, 317–321 CrossRef CAS.
- M. Baggioli and A. Zaccone, Phys. Rev. Res., 2020, 2, 013267 CrossRef CAS.
- D. Marlina, H. Hoshina, Y. Ozaki and H. Sato, Polymer, 2019, 181, 121790 CrossRef.
- P. J. Larkin, J. Wasylyk and M. Raglione, Appl. Spectrosc., 2015, 69, 1217–1228 CrossRef CAS PubMed.
- T. Koide, T. Fukami, H. Hisada, M. Inoue, J. Carriere, R. Heyler, N. Katori, H. Okuda and Y. Goda, Org. Process Res. Dev., 2016, 20, 1906–1910 CrossRef CAS.
- S. A. Kirillov and T. M. Kolomiyets, J. Phys. Chem. B, 2001, 105, 3168–3173 CrossRef CAS.
- K. Gato, M. Y. Fujii, H. Hisada, J. Carriere, T. Koide and T. Fukami, J. Drug Delivery Sci. Technol., 2020, 58, 101800 CrossRef CAS.
- J. El Haddad, B. Bousquet, L. Canioni and P. Mounaix, TrAC, Trends Anal. Chem., 2013, 44, 98–105 CrossRef CAS.
- P. Chen, C. Holbrook, P. Boolchand, D. G. Georgiev, K. A. Jackson and M. Micoulaut, Phys. Rev. B: Condens. Matter Mater. Phys., 2008, 78, 224208 CrossRef.
- L. Casella, M. Baggioli, T. Mori and A. Zaccone, J. Chem. Phys., 2021, 154, 014501 CrossRef CAS PubMed.
- M. Grimsditch, A. Polian and R. Vogelgesang, J. Phys.: Condens. Matter, 2003, 15, S2335 CrossRef CAS.
- R. Shuker and R. W. Gammon, Phys. Rev. Lett., 1970, 25, 222–225 CrossRef CAS.
- B. Hehlen, E. Courtens, R. Vacher, A. Yamanaka, M. Kataoka and K. Inoue, Phys. Rev. Lett., 2000, 84, 5355–5358 CrossRef CAS PubMed.
- M. F. Ando, O. Benzine, Z. Pan, J.-L. Garden, K. Wondraczek, S. Grimm, K. Schuster and L. Wondraczek, Sci. Rep., 2018, 8, 5394 CrossRef PubMed.
- J. Tu, K. Makarian, N. J. Alvarez and G. R. Palmese, Materials, 2020, 13, 4109 CrossRef CAS PubMed.
- D. B. Menezes, A. Reyer, A. Marletta and M. Musso, Mater. Res. Express, 2017, 4, 015303 CrossRef.
- J. A. Ramos, N. Pagani, C. C. Riccardi, J. Borrajo, S. N. Goyanes and I. Mondragon, Polymer, 2005, 46, 3323–3328 CrossRef CAS.
- T. A. Lima, V. H. Paschoal, R. S. Freitas, L. F. O. Faria, Z. Li, M. Tyagi, Y. Z and M. C. C. Ribeiro, Phys. Chem. Chem. Phys., 2020, 22, 9074–9085 RSC.
- K. M. Hambleton and J. F. Stanzione, ACS Omega, 2021, 6, 23855–23861 CrossRef CAS PubMed.
- M. C. Celina, N. H. Giron and A. Quintana, Cure Chemistry Kinetics in Epoxy Materials, Sandia National Lab.(SNL-NM), Albuquerque, NM (United States), 2015 Search PubMed.
Footnote |
| † Electronic supplementary information (ESI) available. See DOI: https://doi.org/10.1039/d3an01099f |
| This journal is © The Royal Society of Chemistry 2023 |

