
 Open Access Article
 This Open Access Article is licensed under a
 Creative Commons Attribution 3.0 Unported Licence
An optical sensor for the sensitive determination of formaldehyde gas based on chromotropic acid and 4-aminoazobenzene immobilized in a hydrophilic membrane†
M. D. Fernández-Ramos *ab,
A. Moraga-Cabezasa,
Antonio L. Medina-Castillo*ab and
L. F. Capitán-Vallveyab
*ab,
A. Moraga-Cabezasa,
Antonio L. Medina-Castillo*ab and
L. F. Capitán-Vallveyab
aECsens, Department of Analytical Chemistry, University of Granada, Granada 18071, Spain. E-mail: mdframos@ugr.es; antonioluismedina@ugr.es
bUnit of Excellence in Chemistry applied to Biomedicine and the Environment of the University of Granada, Spain
First published on 28th July 2023
Abstract
Formaldehyde is a common contaminant in occupational and environmental atmospheres, prolonged exposure leads to health risks, and its determination is necessary to protect health. There is a great demand for portable, rapid, and sensitive methods that can be used in resource-limited settings. In this respect, a colorimetric sensor has been developed based on the colour change from pink to purple of co-immobilized chromotropic acid and 4-aminoazobenzene in hydroxypropyl methylcellulose when it is exposed to different concentrations of formaldehyde. The concentration of formaldehyde in the gas phase was quantified by measuring the change of the appropriate colour coordinates in response to the concentration of formaldehyde. A calibration curve was obtained for formaldehyde, with a useful concentration range from 0.08 to 0.6 ppmv. The detection limit was 0.016 ppmv, which is lower than the maximum exposure concentrations recommended by both the World Health Organization (WHO) and the Occupational Safety and Health Administration (OSHA). The optical sensor was found to have good reproducibility, with a relative standard deviation of 2.3 and 1.7% at 0.08 and 0.25 ppmv, respectively. The sensor can operate at room temperature and environmental humidity, 25 °C, and 50% RH, respectively. In addition, a study of interferents (acetaldehyde, toluene, methanol, ethyl acetate, acetone, acetic acid, carbon dioxide and ammonia) showed high selectivity for formaldehyde, which indicates that this membrane is a simple, fast, and economical alternative for quantifying the concentration of formaldehyde in different environments.
1. Introduction
Formaldehyde (FA) is a highly flammable, colorless, strong-smelling, and readily polymerizable gas at room temperature. This gas is the most widespread aldehyde in the environment. It is found in the natural structure of organisms and is used to manufacture synthetic resins and chemical compounds, including plywood, chipboard, insulation materials, paint and plastic materials, textiles, carpets, furniture, wall coverings, and household cleaning products. As a result, it can be easily released into the indoor environment,1 making it gain interest for biomedical analysis, pharmaceuticals, and the food industry.2 FA is very harmful to human health and can cause irritation of the mucosa in the eyes and upper respiratory tract, central nervous system damage, and immune system disorders. FA is even reported to contribute to the development of cancer of the nose and upper respiratory tract as well as skin cancer.3,4Regulatory agencies in many countries have established guideline values for concentrations of FA in indoor air where its detection at a very low concentration is critical. The World Health Organization (WHO)5 has established limits of exposure to FA at a maximum of 0.08 ppm averaged over 30 min. The US Occupational Safety and Health Administration (OSHA)6 has set a permissible exposure limit (PEL) of 0.75 ppmv for an 8 h time-weighted average (TWA) and PEL of 2 ppmv for short-term exposure (15 min: STEL). European Regulations7 have established short- and long-term occupational exposure limits of 0.6 ppmv and 0.3 ppmv, respectively. Traditionally, FA gas has been determined by gas chromatography,8 capillary electrophoresis,9 and spectrophotometry.10 These methods require offline instrumentation with long operation times and trained operators. However, efforts have been made to develop analysis methods that allow online responses and the in situ determination of FA with high sensitivity, selectivity, low cost, and portability.11
Chemical sensors are a good alternative to obtain these objectives. Electrochemical and chemoresistive sensors have been used to determine FA gas with short response times and low cost, but they lack sensitivity and have low selectivity. Moreover, chemoresistive sensors have serious limitations due to the high optimum working temperatures that they require.11 On the other hand, enzyme-based biosensors limit the lifetime of the enzymes.12
In contrast, colorimetric and fluorometric methods are very popular for the determination of FA with good results. Colorimetric methods are desirable because they can be quantitatively estimated with the naked eye without the need for instrumentation to detect FA in indoor and outdoor environments.13 There are many colorimetric methods for the determination of formaldehyde based on different reagents, such as chromotropic acid,14 Schiff reagents such as pararosaniline15 or sulfanilic acid,16 4-aminoazobenzene,15 4-amino-5-hydrazino-3-mercapto-1,2,4-triazole (AHMT)17 or something similar based on a derivative reaction with fluoral-P (4-amino-3-penten-2-one)18 and the Hantzsch reaction.19 Of all these reagents, very few have been used to develop optical sensors.20 Examples include FA determination based on the nucleophilic addition of an amine through a reaction with an aldehyde by a dehydration reaction that induces a change in the chromophores of the dyes21 or using Leuco Fuchsin immobilized in a Nafion® polymer in a fibre optic, which has good selectivity and reproducibility, although it is very sensitive to variations in humidity.22 The reason for the low number of colorimetric sensors could lie in the interactions that occur between the colorimetric indicator and the polymeric matrix that involves recognition chemistry, which considerably reduces the interaction with FA.23
This study is based on a hydrophilic membrane that allows the solubility of the reagents used to prepare the sensor: chromotropic acid and 4-aminoazobenzene. It is shown that both must be present in the membrane for a pink to purple colour change to take place when in contact with FA. The sensor has been characterized and the influence of temperature, humidity and possible interferents has been established.
2. Experimental section
2.1. Reagents and materials
Hydroxypropyl methylcellulose (HPMC, Methocel E-5, LV USP/EP premium grade) (Dow Chemical Iberica S.L., Tarragona, Spain) was used as the membrane polymer. The reagents used were chromotropic acid (CA), 4-aminoazobenzene (AAB), Tween 20, absolute ethanol, sulfuric acid, formaldehyde (36.5–38%), acetaldehyde, toluene, methanol, ethyl acetate, acetone, and acetic acid, all obtained from Sigma-Aldrich (Madrid, Spain). Sheets of Mylar-type polyester from Goodfellow (Cambridge, UK) were used as a support for the membranes.2.2. Instrumentation
To perform the measurements, a homemade climate chamber made of an opaque glass, 4.4 cm high, 1.2 cm wide, and 3.0 cm long with an upper inlet was used to put the sensor in contact with the gas and a small hole in the bottom to prevent overpressure. The atmospheres of different concentrations of formaldehyde were produced using a Controlled Evaporator Mixer (CEM) system. It consists of a mass flow controller for measurement and control of the carrier gas flow (synthetic air) and a mass flow meter for liquids (Mini CORI-FLOW). A 3-way CEM mixing valve and an evaporator controlled the liquid flow and the liquid mixing with the carrier gas flow. The different liquids tested were deposited in the glass container for solvents located in the CEM. To study the FA, 5.2 mmol L−1 aqueous FA solution was prepared by dilution of a standard FA solution (36–38%) in purified water. In addition, a temperature-controlled heat exchanger heated the mixture and completely evaporated the different liquids studied (96 °C for formaldehyde; 20.2 °C for acetaldehyde; 101.3 °C for toluene; 77.1 °C for ethyl acetate; 56 °C for acetone; 118 °C for acetic acid; 64.7 °C for methanol and 100 °C for water in order to prepare gas mixtures with different humidity levels).Standard mixtures of CO2 (up to 5000 ppmv) and NH3 (up to 100 ppmv) were prepared by taking variable amounts of the corresponding gas bullets and diluting them in synthetic air, controlling the gas flows that entered the mixing chamber using a computer-controlled mass flow controller (Air Liquid España S.A., Madrid, Spain) operating at a total pressure of 760 Torr and a flow rate between 100 and 500 cm3 min−1. Fig. 1S, ESI,† shows the measurement system.
All the measurements were carried out at room temperature, 25 °C, and 55 RH% and in triplicate, except when stated otherwise, to check for experimental errors.
2.3. Preparation of the formaldehyde sensing membrane
The FA sensing membranes were prepared from a cocktail containing 2.6 wt% chromotropic acid (1,8-dihydroxynaphthalene-3,6-disulfonic acid disodium salt) in 1 ml of hydroxypropyl methyl cellulose (HPMC) 4 wt% in an aqueous solution, 0.01 wt% AAB in ethanol, 12 wt% Tween 20 and 60 wt% concentrated sulfuric acid. The mixture was stirred for a few minutes to homogenize the solution. Then, 10 μL of this cocktail was dropped on sheets of Mylar polyester on a spin-on device at 100 rpm. The sensor membranes were stored in an airtight box in the absence of light and at room temperature until the solvent evaporated completely to obtain homogeneous and pink membranes.2.4. Image capture and processing
The sensing membrane was imaged using a Canon Powershot G12 digital camera (Japan) placed inside a homemade wooden enclosure24 illuminated with two LED lamps (4.6 W, 6000 K, illumination inside the box, 9680 Lx) placed at 45° with respect to the digital camera to minimize any interference from external light. The optimized settings used to photograph the sensing membrane were ISO 80, F: 5.6, shutter speed: 1/1600 s, aperture value: f/8, focal distance: 11 mm; white balance, automatic; resolution, 3648 × 2432; and mode, macro. To evaluate the colour change of the sensor, a photograph was taken in JPEG format. RGB and HSV colour coordinates were obtained from the region of interest (ROI) of the digitized membrane using ImageJ software (National Institutes of Health). To evaluate the colour change of the sensor, a photograph was taken and stored in JPEG format. The analysis of the region of interest (ROI) of the images was performed using ImageJ software. The analytical parameter used was the difference between the colour coordinates after (CCg) and before (CC0) the reaction with the analyte (CCg − CC0).3. Results and discussion
3.1. Composition and optimization of the formaldehyde sensor
Based on the classical methods of FA determination in solution, the reaction with chromotropic acid25 was selected as a starting point to prepare the colorimetric detection phase of FA. No color change was observed when the sensor containing that reagent was put in contact with the FA atmosphere, even though the amount of sulfuric acid was very high.This may be due to the fact that twice as many reagent molecules are needed compared to gas molecules to form the adduct between formaldehyde and chromotropic acid. However, this amount of reagent cannot be included in the sensing film while maintaining good physical properties (transparency, homogeneity, and good adhesion to the Mylar support).
Therefore, another reagent was tested to prepare the FA sensor phase, and the colorimetric reaction was based on the reaction of formaldehyde with 4-aminoazobenzene (AAB) in a slightly acidic solution.15 In this case, the formaldehyde detection was based on the colour change produced by the nucleophilic addition of an amine to the aldehyde in a solution (pH = 4.5), forming the corresponding imine via a carbinolamine intermediate. However, when AAB was immobilized in a polymer matrix (HMPC), together with sulfuric acid, no colour change was observed when the membrane was exposed to FA vapours. The different experimental behaviour observed in aqueous solution and in the gas phase may be due to the absence of acidic medium in the membrane. Surprisingly, when AAB was co-immobilized in the presence of both sulfuric acid and chromotropic acid a colour change from pink to purple occurred when the membrane was exposed to FA atmospheres. The reaction between the FA and AAB occurred only in slightly acidic media because it is an acid-catalysed reaction. Thus, the gas-phase FA has to diffuse and dissolve in the HMPC hydrogel membrane, which contains a high percentage of water, and then react with AAB in the presence of protons. However, considering that AAB is very poorly soluble in water (≈30 mg l−1), there is a possibility that it is also poorly soluble in the high-water content hydrogel membrane of HMPC. Thus, after evaporating the ethanol during the membrane formation, the aggregation of AAB occurs, and it becomes isolated and inaccessible to protons and FA. However, when AAB was co-immobilized with chromotropic acid, the formation of an adduct by electrostatic interactions between the amine groups of AAB and the sulfonic groups of chromotropic acid improved the solubility of AAB in the HMPC hydrogel membrane, preventing aggregation, and thus improving its accessibility to protons and FA.
To verify our hypothesis, it was decided to replace the chromotropic acid (CT) which contains two sulfonate groups and two hydroxyl groups in its structure, by a much less polar acid, such as benzene-sulfonic acid (BS) which contains only one sulfonate group in its structure. Based on our hypothesis, the solubility of AAB in the hydrogel membrane is drastically increased by the formation of a highly polar adduct between AAB and chromotropic acid (AAB-CT) through electrostatic interactions between the ammonium group of AAB in acidic medium and the sulfonate groups of chromotropic acid. Therefore, taking into account that the adduct formed by AAB and BS(AAB-BS) is much less polar than the AAB-CT adduct, the solubility of the AAB-BS adduct in the hydrogel membrane should also be much lower than that of the AAB-CT adduct. Thus, co-immobilization of AAB and BS on the hydrogel membrane gives a much lower response to formaldehyde than the co-immobilization of AAB and chromotropic acid.
In a first step, a hydrogel membrane containing only BS was prepared. This membrane did not show any colour change when exposed to FA vapours. Subsequently, a second membrane containing AAB and BS-acid was prepared, and upon exposure to FA vapours a slight pink coloration was observed. This assay supports our hypothesis that AAB alone is insoluble in the hydrogel membrane, so it is necessary to form a highly polar adduct to solubilize it.
To select the most appropriate analytical parameter, the coordinates from the RGB and HSV colour spaces were studied, obtaining the response observed in Fig. 2S.† As can be seen, the H, S and V coordinates responded to FA with less intensity than the R and G coordinates. On the other hand, B did not respond to FA. The variation observed in the R coordinate is much larger than for the G coordinate and is more sensitive to variations in the FA concentration. For this reason, the R coordinate was selected as the analytical parameter.
The optimization of the sensing membrane composition was studied varying the composition of each one individually in the following concentration ranges: AAB from 0.005 to 0.017 wt%; H2SO4 from 47 to 71 wt%; Tween 20 from 4.5% to 27.3 wt%; HPMC from 2 to 4 wt% and chromotropic acid from 0.7 to 4 wt%. Fig. 1 presents the results. The concentrations for each reagent that gave the best results and, therefore, those selected as the optimal composition for the sensor were AAB 0.014 wt%; H2SO4 60 wt%; Tween 20 12 wt%; HPMC 4 wt% and chromotropic acid 2.6 wt%.
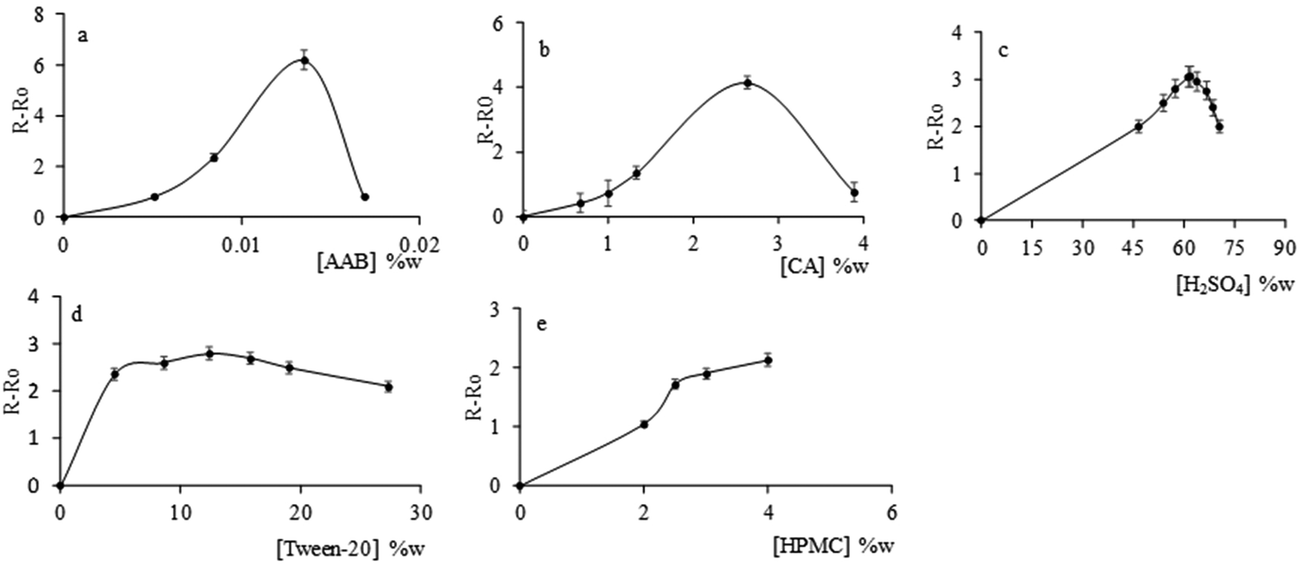 | ||
| Fig. 1 Optimization of all reagents in the sensor, a: AAB; b: CA; c: H2SO4; d: Tween 20; and e: HPMC. | ||
The contact time between the sensor and the formaldehyde gas is a very important factor; if it is too short, sensor sensitivity can be lost, and if it is too long, effectiveness can be lost.25 To find the optimal contact time between the sensor and the FA gas, the sensor was subjected to different concentrations of FA, varying the contact time from 5 to 30 minutes. Fig. 3S† shows the increase in the analytical signal over time, with the aim of obtaining a quantifiable signal in the shortest possible time. 5 minutes was selected since the signal obtained was high enough to be able to distinguish it from the target. The signals from contact times less than 5 minutes were too low.
With gas sensors, there are two important factors to consider: temperature and relative humidity. The influence of temperature was evaluated at different values: 10 °C, 20 °C, 30 °C and 40 °C. To do this, the membrane was placed in a thermal chamber with a humidity of 55% RH and images were taken every 15 min.
Fig. 2A shows that the temperature influenced the sensor response, increasing with the temperature, which is normal behaviour with optical sensors.26,27 For temperatures above 40 °C, a change in the colour sensor was observed and the signal decreased, reaching negative values, meaning that the sensor would not be operational for temperature values above 40 °C.
 | ||
| Fig. 2 Influence of the response sensor on experimental variables: A: influence of temperature a: 10 °C, b: 20 °C, c: 30 °C and d: 40 °C; B: influence of % RH a: 10% RH, b: 30% RH; c: 55% RH; and d: 100% RH; in both cases R0 refers to the image of the initial sensor. | ||
To study the influence of humidity, the sensor was monitored under different % RH, taking a photograph after 15 min exposure at each RH studied. Fig. 2B shows the results, with a linear dependence with the rate increasing 5.2 times over the 10–100% RH range, increasing the sensitivity of the sensor at high % RH. The humidity-enhanced response is attributed to the colorimetric reaction between chromotropic acid and AAB with FA, similar to that with the Schiff reagent.11
3.2. Sensing membrane characterization
The FA sensing membrane was characterized by exposing it to different FA levels between 0.08 and 0.6 ppmv FA for 5 min (seven standards, three replicates each) at ambient temperature and humidity (25 °C and 55% RH), as seen in Fig. 4S.†Table 1 shows the analytical parameters found for the proposed FA sensor.| Analytical parameter | Value |
|---|---|
| Measurement range (ppmv) | 0.08–0.6 |
| Slope (b) | 5.11 ± 0.05 |
| Intercept (a) | 0.47 ± 0.02 |
| LOD (ppmv) | 0.016 |
| LQD (ppmv) | 0.053 |
| Precision 0.08 ppmv/0.25 ppmv (% RSD) | 2.3/1.7 |
| Response time (min) | 5 |
| Lifetime (days) | 4 |
The limits of detection and quantification were calculated according to the methodology established by IUPAC,28 obtaining a detection limit of 0.016 ppmv and a quantification limit of 0.053 ppmv.
The precision in the measurement of FA with the proposed sensing membrane was evaluated using ten different membranes (n = 10) exposed to two different concentrations of FA, 0.08 ppmv and 0.6 ppmv, at the lowest and highest levels of the concentration range tested. In all cases, the relative standard deviation (RSD) found was lower than 5% (Table 1).
To check the reversibility, the sensor was exposed to alternate cycles of a constant concentration of 0.12 ppmv FA, followed by normal air atmosphere at 55% RH for 10 min. Fig. 5S† shows that the sensor only supported one response cycle, meaning that the sensor is irreversible.
The lifetime of the sensor was studied by storing three sensor membranes in an airtight box at room temperature and humidity and in the dark. These sensors were regularly monitored to check their signal variation versus the time at a constant concentration of 0.12 ppmv FA. The lifetime of the membranes for FA sensing was longer than 4 days. The measurement of the color coordinates was constant during the first four days, after which the signal quickly decreased and after 10 days, the signal disappeared completely, as seen in Fig. 6S in the ESI.†
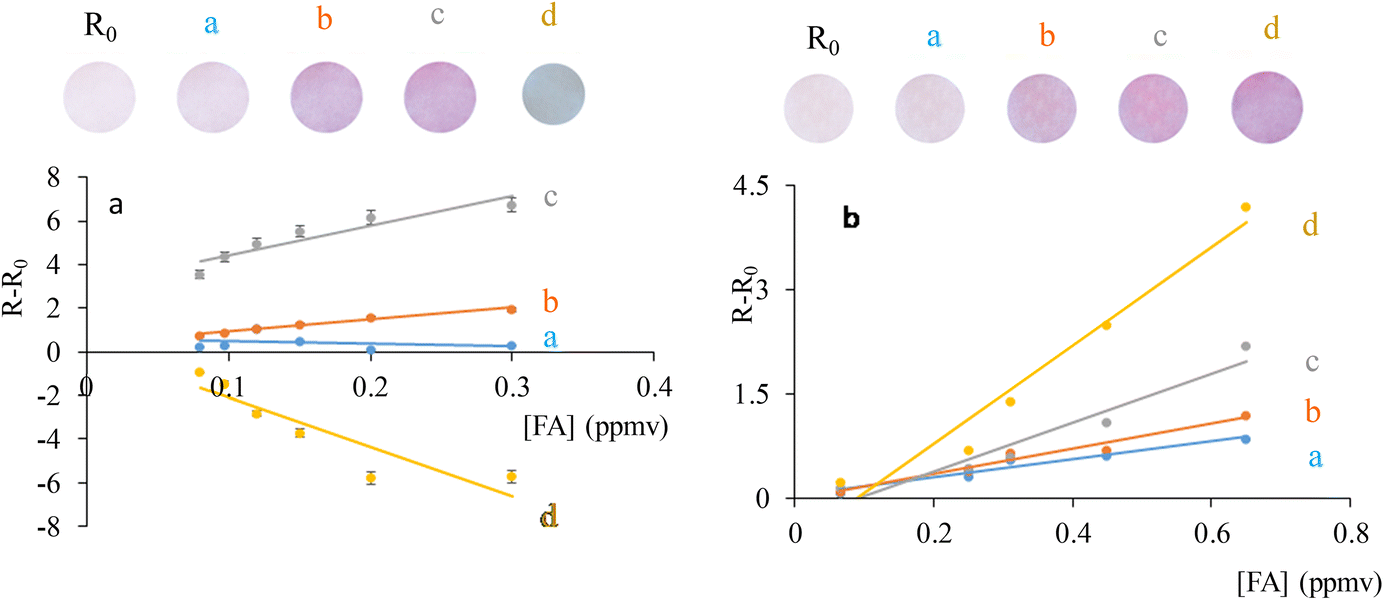
To study the selectivity of the sensor, its response to different volatile organic compounds and gases was evaluated (Fig. 3). The response of the FA was evaluated at high levels of the following potential interferences at 25 °C and 50% RH: formaldehyde (0.12 ppmv), acetaldehyde (3.5 ppmv), toluene (130.0 ppmv), methanol (150.0 ppmv), ethyl acetate (22.0 ppmv), acetone (50.0 ppmv) and acetic acid (24.0 ppmv), carbon dioxide (200.0 ppmv), and ammonia (4.0 ppmv).
 | ||
| Fig. 3 Selectivity of the sensor: a: formaldehyde; b: acetaldehyde; c: acetone; d: toluene; e: methanol; f: ethyl acetate; g: acetic acid; h: ammonium; and i: carbon dioxide. | ||
Table 2 compares the results obtained in this study with other optical sensors for formaldehyde gas determination in the literature. The best characteristics were found for this sensor, although it is not reversible. It has a fast response time, higher sensitivity and accuracy and a lower detection limit compared to the other optical sensors, which make it suitable for use under normal environmental conditions.
| Sensing chemistry | Measurement range (ppmv) | Precision (% RSD) | Reversibility | Response time (min) | LOD (ppmv) | Ref. |
|---|---|---|---|---|---|---|
| TB: thymol blue. | ||||||
| β-Diketones/sol–gel | 0.05–1.2 | 6.3–4.6 | — | 360 | 0.03 | 13 |
| Hydroxylamine sulfate-TB/silica paper | 0–0.75 | — | Yes | 2 | 0.03 | 29 |
| Pararosaniline/electrospum cellulose nanofibres | 0.01–5 | — | Yes | 5 | 0.05 | 30 |
| Leuco Fuchsin/Nafion, Fibre optic | 0.6–5.5 | 0.1–7 | Yes | 15 | 0.03 | 22 |
| Chromotropic acid + AAB/HPMC | 0.08–0.6 | 2.3–1.7 | — | 5 | 0.016 | Current study |
4. Conclusion
A colorimetric sensor based on the co-immobilization of chromotropic acid and 4-aminoazobenzene in hydroxypropyl methylcellulose as a hydrophilic polymeric matrix was developed for the selective determination of formaldehyde gas. The irreversible colour change of the sensor from pink to purple when the sensor is in contact with formaldehyde gas serves as an analytical signal, which is measured using a camera by quantifying the appropriate colour coordinates. The influence of both temperature and humidity on the response of the sensor was studied, with the sensor operating under room temperature and environmental humidity conditions (25 °C and 55% RH). A calibration curve was obtained for formaldehyde, with a useful concentration range from 0.08 to 0.6 ppmv. The detection limit was 0.016 ppmv, which is lower than the maximum exposure concentrations recommended by both the WHO and OSHA. The sensor was found to have good reproducibility, with the relative standard deviation of 0.08 and 0.25 ppmv being 2.3 and 1.7%, respectively, and with only a 5 min response time. In addition, the study of interferences showed that the sensor did not suffer from potential interferent gases. Although it does not produce a reversible response, this sensor can be considered an interesting proposal that in the future may be improved in order to carry out portable real-time measurements of FA gas in environments.Author contributions
Conceptualization, M. D. F.-R.; methodology, M. D. F.-R. and A. M.-C.; formal analysis, M. D. F.-R. and A. M.-C.; investigation, M. D. F.-R., A. M.-C., and A. L. M.-C.; resources, M. D. F.-R., A. M.-C., A. L. M.-C., and L. F. C.-V.; data curation, M. D. F.-R. and A. L. M.-C.; writing – original draft preparation, M. D. F.-R. and L. F. C.-V.; writing – review and editing, M. D. F.-R., A. L. M.-C., and L. F. C.-V.; visualization, M. D. F.-R.; supervision, M. D. F.-R. and A. L. M.-C.; project administration, L. F. C.-V.; funding acquisition, L. F. C.-V. All authors have read and agreed to the published version of the manuscript.Conflicts of interest
The authors declare no conflict of interest.Acknowledgements
This study was supported by Spanish “Ministerio de Ciencia e Innovación/Agencia Estatal de Innovación” (Projects PID2019-103938RB-I00 and PID 2021-126579OB-C31) and Junta de Andalucía (Projects B-FQM-243-UGR18 and P18-RT-2961). The projects were partially supported by European Regional Development Funds (ERDF). The authors would like to acknowledge Dr Francisco Santoyo González for his help in discussing the results.References
- N. T. Subasi, Formaldehyde Advantages and Disadvantages: Usage Areas and Harmful Effects on Human Beings, IntechOpen, 2020 DOI:10.5772/intechopen.89299.
- M. I. S. Veríssimo, J. A. F. Gamelas, A. J. S. Fernandes, D. V. Evtuguin and M. T. S. R. Gomes, Food Chem., 2020, 318, 126461 CrossRef PubMed.
- G. D. Nielsen and P. Wolkoff, Arch. Toxicol., 2010, 84, 423–446 CrossRef CAS PubMed.
- J. J. Morales, K. P. Díaz and C. A. S. Sierra, Cienc. Salud Virtual, 2014, 6, 141–152 CrossRef.
- W. H. O. 2010, WHO Guidelines for Indoor Air Quality: Selected Pollutants, Geneva, 2010 Search PubMed.
- O. S. a. H. A. U.S., OSHA Occupational Chemical Database, Formaldehyde, 2002.
- Directive (EU) 2019/983 amending Directive 2004/37/EC on the protection of workers from the risks related to exposure to carcinogens or mutagens at work, 2019.
- S. Dugheri, A. Bonari, I. Pompilio, M. Colpo, N. Mucci, M. Montalti and G. Arcangeli, Acta Chromatogr., 2017, 29, 511–514 CrossRef CAS.
- F. R. Rocha, L. H. G. Coelho, M. L. A. Lopes, L. R. F. Carvalho, J. A. Fracassi da Silva, C. L. do Lago and I. G. R. Gutz, Talanta, 2008, 76, 271–275 CrossRef CAS PubMed.
- H. y. Yuan, S. e. Wang and D. Xiao, Spectrosc. Lett., 2005, 38, 121–130 CrossRef CAS.
- C. Liao, J. Shi, M. Zhang, R. Dalapati, Q. Tian, S. Chen, C. Wang and L. Zang, Mater. Adv., 2021, 2, 6213–6245 RSC.
- X. Sun, H. Zhang, L. Huang, S. Hao, J. Zhai and S. Dong, Biosens. Bioelectron., 2021, 177, 112975 CrossRef CAS PubMed.
- O. Bunkoed, F. Davis, P. Kanatharana, P. Thavarungkul and S. P. J. Higson, Anal. Chim. Acta, 2010, 659, 251–257 CrossRef CAS PubMed.
- A. Dar, U. Shafique, J. Anwar, W. -uz-Zaman and A. Naseer, J. Saudi Chem. Soc., 2016, 20, S352–S356 CrossRef CAS.
- P. Verma and V. K. Gupta, Talanta, 1983, 30, 443–445 CrossRef CAS PubMed.
- M. Hladová, J. Martinka, P. Rantuch and A. Nečas, Research Papers Faculty of Materials Science and Technology Slovak University of Technology, 2019, vol. 27, pp. 105–120 Search PubMed.
- P. Ma, F. Liang, D. Wang, Q. Yang, Y. Ding, Y. Yu, D. Gao, D. Song and X. Wang, Microchim. Acta, 2015, 182, 863–869 CrossRef CAS.
- R. Rapoport, I. Hanukoglu and D. Sklan, Anal. Biochem., 1994, 218, 309–313 CrossRef CAS PubMed.
- T. Salthammer, S. Mentese and R. Marutzky, Chem. Rev., 2010, 110, 2536–2572 CrossRef CAS PubMed.
- A. Gani, M. Yuwono and B. Kuswandi, Am. J. Anal. Chem., 2013, 4, 661–667 CrossRef.
- L. Engel, I. Benito-Altamirano, K. R. Tarantik, C. Pannek, M. Dold, J. D. Prades and J. Wöllenstein, Sens. Actuators, B, 2021, 330, 129281 CrossRef CAS.
- M. d. M. Darder, M. Bedoya, L. A. Serrano, M. Á. Alba and G. Orellana, Sens. Actuators, B, 2022, 353, 131099 CrossRef CAS.
- Y. Min, Ch. Yuan, D. Fu and J. Liu, Chemosensors, 2023, 11, 134 CrossRef CAS.
- A. M. Jiménez-Carvelo, K. D. Salloum-Llergo, L. Cuadros-Rodríguez, L. F. Capitán-Vallvey and M. D. Fernández-Ramos, Microchem. J., 2020, 157, 104930 CrossRef.
- A. Pretto, M. R. Milani and A. A. Cardoso, J. Environ. Monit., 2000, 2, 566–570 RSC.
- K. Zhou, X. Ji, N. Zhang and X. Zhang, Sens. Actuators, B, 2006, 119, 392–397 CrossRef CAS.
- A. D. Pockard and E. R. Clark, Talanta, 1984, 31, 763–771 CrossRef CAS PubMed.
- L. A. Currie, Pure Appl. Chem., 1995, 67, 1699–1723 CrossRef CAS.
- X. Qin, R. Wang, F. Tsow, E. Forzani, X. Xian and N. Tao, IEEE Sens. J., 2015, 15, 1545–1551 CAS.
- X. Wang, Y. Li, X. Li, J. Yu, S. S. Al-Deyab and B. Ding, Sens. Actuators, B, 2014, 203, 333–339 CrossRef CAS.
Footnote |
| † Electronic supplementary information (ESI) available. See DOI: https://doi.org/10.1039/d3an01056b |
| This journal is © The Royal Society of Chemistry 2023 |