
 Open Access Article
 This Open Access Article is licensed under a
 Creative Commons Attribution 3.0 Unported Licence
Focusing ion funnel-assisted ambient electrospray enables high-density and uniform deposition of non-spherical gold nanoparticles for highly sensitive surface-enhanced Raman scattering†
Baris
Akbali
ab,
Cedric
Boisdon
a,
Barry L.
Smith
a,
Boonphop
Chaisrikhwun
c,
Kanet
Wongravee
d,
Tirayut
Vilaivan
d,
Cassio
Lima
 e,
Chen-Han
Huang
f,
Tsan-Yao
Chen
b,
Royston
Goodacre
e and
Simon
Maher
*a
e,
Chen-Han
Huang
f,
Tsan-Yao
Chen
b,
Royston
Goodacre
e and
Simon
Maher
*a
aDepartment of Electrical Engineering and Electronics, University of Liverpool, Brownlow Hill, Liverpool L69 3GJ, UK. E-mail: s.maher@liverpool.ac.uk
bDepartment of Engineering and System Science, National Tsing Hua University, Hsinchu 30013, Taiwan
cProgram in Petrochemistry and Polymer Science, Faculty of Science, Chulalongkorn University, Bangkok 10330, Thailand
dDepartment of Chemistry, Faculty of Science, Chulalongkorn University, Bangkok 10330, Thailand
eCentre for Metabolomics Research, Department of Biochemistry, Cell and Systems Biology, Institute of Systems, Molecular and Integrative Biology, University of Liverpool, Biosciences Building, Crown Street, Liverpool, L69 7ZB, UK
fDepartment of Biomedical Engineering, National Central University, Zhongli 10608, Taiwan
First published on 26th August 2023
Abstract
Surface-enhanced Raman scattering (SERS) is a powerful technique for detecting trace amounts of analytes. However, the performance of SERS substrates depends on many variables including the enhancement factor, morphology, consistency, and interaction with target analytes. In this study, we investigated, for the first time, the use of electrospray deposition (ESD) combined with a novel ambient focusing DC ion funnel to deposit a high density of gold nanoparticles (AuNPs) to generate large-area, uniform substrates for highly sensitive SERS analysis. We found that the combination of ambient ion focusing with ESD facilitated high-density and intact deposition of non-spherical NPs. This also allowed us to take advantage of a polydisperse colloidal solution of AuNPs (consisting of nanospheres and nanorods), as confirmed by finite-difference time domain (FDTD) simulations. Our SERS substrate exhibited excellent capture capacity for model analyte molecules, namely 4-aminothiophenol (4-ATP) and Rhodamine 6G (R6G), with detection limits in the region of 10−11 M and a relative standard deviation of <6% over a large area (∼500 × 500 μm2). Additionally, we assessed the quantitative performance of our SERS substrate using the R6G probe molecule. The results demonstrated excellent linearity (R2 > 0.99) over a wide concentration range (10−4 M to 10−10 M) with a detection limit of 80 pM.
Introduction
Noble metal nanoparticles (NPs) sustain a dipole-like surface plasmon resonance (SPR) through collective excitation of conduction electrons creating a significant and highly localised amplification of the incident electromagnetic field close to the metal NP.1–3 Surface-enhanced Raman scattering (SERS) is a well-known optical phenomena caused by localised SPR (LSPR).4,5 Coupling of plasmonic dipoles produces highly concentrated, localised electromagnetic hot spots and is therefore considered a major source of the SERS phenomenon.6–9 Plasmonic materials permit and encourage complementary spectroscopic techniques when used as sensors, enabling the detection of chemical species at very low concentrations based on their vibrational ‘fingerprint’.10–12Typically, manufacturing SERS substrates involves mixing plasmonic NPs with analytes, spin/drop-casting analyte solutions on solid surfaces, or incubating particles with analyte solutions.13,14 While drop-casting has proven to be effective in producing a satisfactory SERS substrate, it is susceptible to the undesirable coffee-ring effect whereby suspended particles are deposited mainly at the periphery of the drop following solvent evaporation. This effect can have a detrimental impact on the method's reproducibility and sensitivity.15 One way to address this issue is to treat the surface of the substrate prior to drop-casting, which can effectively mitigate the coffee-ring effect.16,17 For example, a method introduced by Dabodiya et al.,18 relies on the evaporation of self-lubricating drops of noble metal NPs and has achieved a remarkable detection limit of 10−16 M with R6G dye-molecule. However, such approaches require additional, and sometimes complex or time consuming, preparative steps. Nevertheless, reproducibility of SERS experiments still needs to be carefully considered,10,12 especially when the aim is to achieve highly accurate quantitative results.19,20
In order to enhance the uniformity of the SERS signal, various substrates composed of long-range ordered noble metal nanostructure arrays have also been developed utilising template-assisted techniques,21,22 electron beam lithography,23 droplet-based biphasic reactions in microfluidic devices,24,25 and nanoimprint lithography.26,27 Recently Kanike et al. developed a droplet-based microfluidic approach to fabricate ordered silver nanostructures over a surface area >60 cm2.28 They achieved a limit of detection with R6G of 10−12 M. Whilst these approaches have shown promise, they are often associated with high cost and complexity. Furthermore, they may not be suitable for mass production, particularly when achieving a consistent SERS signal across a large area is necessary.
Ambient electrospray deposition is a viable alternate method for making SERS substrates.29–32 By applying a high DC voltage (of a few kV) to liquids contained in a micro-capillary, ambient electrospray can ensue leading to the generation of charged micro and nano-droplets capable of direct deposition of polyatomic ions onto a targeted area with very small kinetic energies (close to zero).30 Several interesting studies have reported on the deposition of NPs on conductive surfaces by combining ambient electrospray and ion soft landing.31,33–36 This approach also offers tremendous potential to deposit bespoke NP geometries (i.e., non-spherical) with peculiar properties, whilst preserving their distinctive shapes – which to the best of our knowledge remains unexplored. In any case, despite successes in utilising electrospray to deposit NPs, the process has inherent drawbacks. In particular, the applied electric field and subsequent coulombic expansion that occurs during Taylor cone formation leads to a spray plume that is many times larger than the capillary diameter. Furthermore, the distribution of charge within the plume is non-uniform leading to a non-homogenous distribution of NPs. In a bid to overcome these disadvantages some strategies have been employed. For instance, Li et al.31 implemented an electrically floating metallic mask to elicit charge-induced focusing of an ESI spray plume containing AgNPs. The mask was manufactured with a series of holes creating a pattern of circular, highly active areas on the SERS substrate located behind the mask. In another study, Ahuja and co-workers electrosprayed silver nanoparticles on to a dropcast film of analyte for detection of Escherichia coli bacteria achieving a SERS signal enhancement factor of 108 and a detection limit of 102 CFU mL−1.27
The main bottleneck for homogeneous deposition of AuNPs on SERS substrates is the capacity to focus high intensity plumes of NPs at atmospheric pressure. In moderate vacuum (<30 Torr) this would generally be accomplished by using radio frequency (RF) voltages with either an ion funnel electrode arrangement37 or multipole guide structure.38 At atmospheric pressure the RF voltage required to focus ions is impractically large and available approaches are limited.39 Recently, Hollerbach et al.40 reported a novel method for focusing ions at atmospheric pressure using non-linear DC voltage gradients applied across a conventional stacked ring ion guide. They employed quadratic and exponential voltage gradients to define a field curvature within the ion guide that forces ions radially inward as they traverse its length. Independently and prior to the interesting publication of Hollerbach et al.,40 we designed and built an ambient ion focusing array that operates on a similar principle, using a non-linear (exponential) DC potential gradient. We hypothesised that ambient ion focusing in this way can augment high density deposition of NPs, including non-spherical NP geometries, enabling fabrication of high-performance SERS substrates.
In this study we have designed, built, and optimised a novel ambient focusing ion funnel, using a non-linear DC-only field, which can focus ions onto a spot size of ≲6 mm2. Two model compounds were chosen for testing, 4-aminothiophenol (4-ATP) and Rhodamine 6G (R6G), as well-studied molecules to assess the performance of the SERS substrate, specifically: the enhancement factor, signal uniformity across the substrate, and standard analytical figures of merit. Moreover, the performance of the focusing ion funnel electrospray setup was carried out with both spherical and non-spherical (i.e., rod shaped) AuNPs to demonstrate that a diversity of SERS substrates can be generated by this general approach.
Experimental
Materials and sample preparation
Gold(III) chloride solution (99.9% – HAuCl4), sodium borohydride (99% – NaBH4), hexadecyltrimethylammonium bromide (CTAB), silver nitrate (99.9% – AgNO3), 4-aminothiophenol (97% – 4-ATP), Rhodamine 6G (95% – R6G) and CuCl2 were purchased from Sigma Aldrich. Other reagents were of analytical grade and used without any further purification or treatment. Deionised water (DI) (∼18.2 MΩ) was purified using a Milli-Q Advantage A10 water purification system (Millipore, MA, USA) before use in this study. Stainless steel sheets with a thickness of 100 μm were purchased from RS Components Ltd (Northants, UK).Preparation of gold nanorods (AuNRs)
The synthesis of AuNRs was performed based on a modified seed-mediation growth technique.41–43 Briefly, 10 mL of 0.2 M CTAB (stabiliser template) was combined with 10 mL of 0.5 mM HAuCl4 (gold precursor). Subsequently, 1.2 mL of 0.01 M NaBH4 as a strong reducing agent was injected which results in a transformation from yellow to brown colour. The obtained colloidal mixture was sonicated and successively utilised as the seed solution for AuNR synthesis. Then, the growth stock solution was prepared by mixing 50 mL of 0.2 M CTAB, 50 mL of 1 mM HAuCl4, and 0.25 mL of 4 mM AgNO3. To generate the AuNRs, 0.7 mL of 0.0788 M ascorbic acid was added to the growth stock solution, followed by the addition of 0.12 mL of the seed solution with rigorous mixing. The growth solution was incubated for 1 h at 25 °C in a water bath. Within 30 min, the colour of the colloidal mixture changed to dark pink which indicates the formation of AuNRs. Finally, 50 mL of the AuNR solution was combined with 50 mL of 0.2 M glycine (pH 8.0) with overnight incubation at ambient temperature. Centrifugation was used to recover the AuNRs by removing excess reagents.Preparation of gold nanospheres (AuNSs)
AuNSs were prepared using a seed mediation protocol.44,45 Appropriate microliters of HAuCl4 (2.5 mM) and CuCl2 solutions (10 mM) were mixed with 0.3 mL of tri-sodium citrate (1%) and then the total volume was adjusted to 1.5 mL using Milli-Q water under vigorous stirring for 5 min. The average diameter of AuNSs could be controlled by the amount of CuCl2 solution added. In this study, 27.5 μL of CuCl2 solution used was to obtain AuNSs with a mean diameter of 65 nm (considered to be the optimum size for the preparation of a high-performance SERS substrate46,47). The obtained mixture was rapidly infused into 50 mL of water and heated to 90 °C with vigorous stirring, resulting in a rapid colour change of the colloidal solution. The obtained suspension was further heated at a temperature of 90 °C for an additional 60 min before cooling down to room temperature. For all SERS experiments, stainless steel was used as a solid substrate since it does not produce a background Raman signal in the region of interest.48,49For comparison with our method, AuNPs were also coated onto the substrate by using a drop casting method and conventional electrospray deposition (without any ion focusing). For drop casting, 35 μL of AuNS solution was dropped onto a stainless-steel substrate and left to dry out overnight in a fume hood. Electrospray deposition was carried out by using an electrospray ionisation (ESI) probe retrieved from a Quattro LC mass spectrometer (Waters Corporation, Milford, MA, USA). The ESI capillary exit was held 8 mm above the stainless-steel substrate. The AuNP solution was diluted 1![[thin space (1/6-em)]](https://www.rsc.org/images/entities/char_2009.gif) :1 with DI water and fed to the ESI probe using a syringe pump (Harvard Apparatus) at a liquid flow rate of 3 μL min−1 to ensure the volume of AuNPs deposited (coated) on the substrate was consistent for a fair comparison.
:1 with DI water and fed to the ESI probe using a syringe pump (Harvard Apparatus) at a liquid flow rate of 3 μL min−1 to ensure the volume of AuNPs deposited (coated) on the substrate was consistent for a fair comparison.
Instrumentation
A Raman spectrometer (Renishaw inVia Raman microscope) equipped with a 785 nm laser diode was used to acquire a SERS signal from the substrate. Spectral data were acquired in the range of 300–2500 cm−1 using a 50× magnifying objective, laser power of ∼17 mW, integration time of 2 s, three accumulations per spectrum, and 1200 lines per mm grating. Multiple spots were scanned on the substrate, with a total number of 10 spectra per spot collected every 2 μm. UV-Visible spectroscopic measurements (Thermo Scientific Gensys 10S) were carried out to characterise the size distribution of the colloidal solution in the range of 200–1100 nm. SEM images were captured using a Hitachi S-4800 scanning electron microscope. The microscope was operated in high vacuum mode with acceleration voltages ranging from 5 to 30 kV. The images were obtained using a secondary electron imaging (SEI) detector.Finite-difference time domain (FDTD) simulations
FDTD simulations (Lumerical Solutions Ltd) were carried out to infer the intensity of the near-field surrounding different geometries of gold nanoparticles electrosprayed on a stainless-steel substrate. The electromagnetic field distribution was computed for AuNSs measuring 65 nm in diameter, and for AuNRs measuring 60 nm long and 15 nm wide. For the AuNSs/AuNSs, AuNRs/AuNRs, and AuNSs/AuNRs systems, the interparticle distance was kept at 1 nm. A plane wave of light polarised along the z-axis with a wavelength of 785 nm was utilised. To optimise field enhancement resolution and minimise simulation duration, a mesh override region of 1 nm and a total simulation time of 500 fs were specified.Ambient DC-only focusing ion funnel
The basic premise for this study, is a novel ambient ion funnel that can be used to focus charged particles on to a conductive surface with high density (Fig. 1). To realise an exponential DC voltage gradient across a series of ring electrodes requires exponentially increasing resistor values to drop the voltage consecutively across each resistor. Eqn (1) defines the exponential voltage, V, and is characterised by two terms, the exponent, m, and the exponential multiplier, C. Furthermore, in eqn (1), N is the electrode number, and C is further subtracted so that the zero electrode registers 0 Volts.| V = C × exp(m × N) − C | (1) |
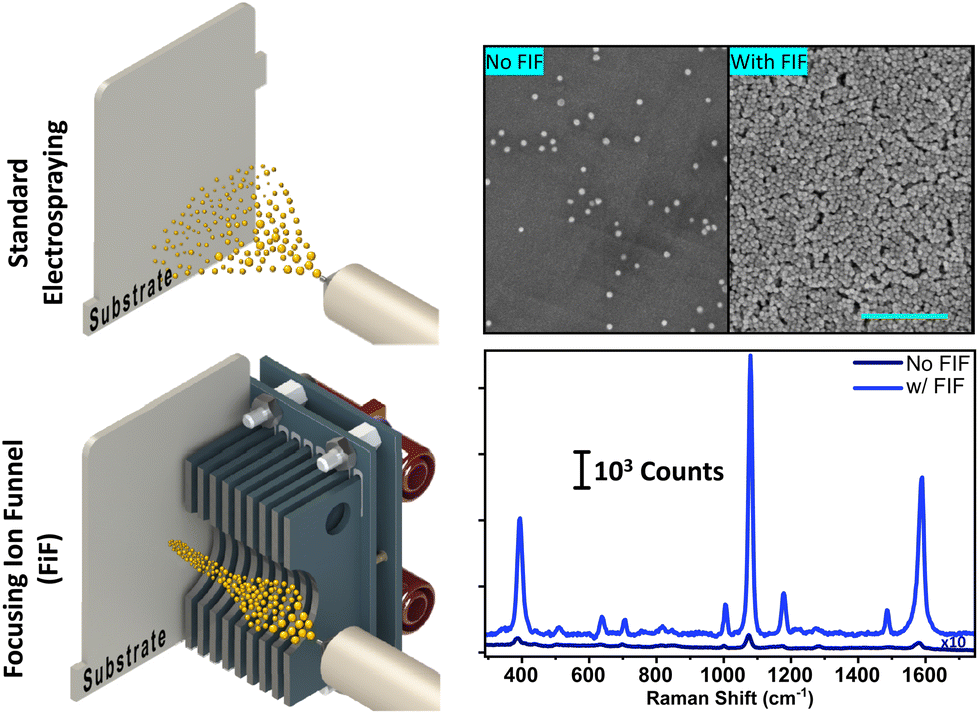 | ||
| Fig. 1 Illustration of electrospray ionisation deposition coupled with a focusing ion funnel (FIF) in comparison with standard electrospray deposition (ESD). Corresponding SEM images taken from surfaces prepared using ESD with and without a FIF are also shown, as well as representative SERS spectra acquired with 10−5 M 4-ATP for both setups. | ||
The C and m values required to generate the exponential gradients used in this study are shown in Table 1, which are referred to throughout this article by their multiplier value, C.
| Gradient | C | m |
|---|---|---|
| 10 | 10 | 0.6907 |
| 50 | 50 | 0.5128 |
| 100 | 100 | 0.4369 |
| 500 | 500 | 0.2892 |
| 1000 | 1000 | 0.1991 |
A visual representation of applied voltages across a 9-electrode ion funnel are shown in Fig. S1.† The gradients are mirrored about the x-axis to operate the focusing ion funnel with the target substrate held at −5 kV. Note, the electrospray is operated at approximately 5 kV above the first electrode voltage to maintain a consistently decreasing potential from emitter tip to SERS substrate. Also shown in Fig. S1† is a conventional linear gradient funnel, whereby the same value resistor is used between each electrode (this also acts as a control for comparison).
The associated resistor values to facilitate generation of each exponential gradient are found in Table S1† and calculated to ensure the available power supply current (Isc = 2 mA) is not exceeded. The nearest available standard resistor value was purchased or generated by series/parallel combinations if the standard value deviated by more than 2% from the values calculated in Table S1.† Note, the large voltage drops (>1 kV) across the last few resistors in the steepest exponential gradients (Fig. S1†) necessitated procurement of resistors with high standoff voltage ratings.
The stacked ring ion guide was constructed from printed circuit boards (PCBs) similar to the literature50 and shown in Fig. S2† (cut-away view). Briefly, as depicted in Fig. S2† with numerical labels, nine ring electrodes (9), with an inner diameter of 16 mm, were constructed using conventional PCBs and slotted into an interface PCB (3) containing evenly spaced slots to set the linear distance to 1 mm between ring electrodes. A PCB accommodating the resistor chains (2) set out in Table S1† is attached to the interface PCB by standoffs (1). Spring loaded pins (4) transfer voltages to each ring electrode via connections on the interface board. Swappable resistor PCBs enable rapid switching and testing of different exponential resistor chains. High voltage connections to the resistor PCB are made through high voltage banana plugs (5). AuNPs in solution are pumped into an ESI emitter (6) via a syringe driver (not shown in Fig. S2†) and sprayed towards a conductive stainless-steel sheet (8). A small circular region (7) illustrates the deposition of AuNPs on the substrate surface.
Simulation of focusing ion funnel
Particle trajectory modelling was performed in Simion 8.1 using a statistical diffusion simulation (SDS) model. The conductive geometry (Fig. S2†) was coded in a .gem file containing: ESI emitter (5 mm × 0.2 mm) held at 5 kV, nine ring electrodes (ID = 16 mm, OD = 20 mm, thickness = 1.6 mm, spacing = 1 mm) with corresponding voltages as shown in Fig. S1,† and SERS target held at −5 kV. 2000 ions of mass 200000 and charge +10 where arbitrarily chosen to represent the AuNPs. The simulation is devised to provide a qualitative indication of the focusing effect from the ambient DC-only ion funnel and not as a quantitative design tool since several important processes are not modelled, e.g., momentum of electro-sprayed droplets emanating from ESI emitter, nebulising nitrogen gas flow due to unknown velocity and spatial charging, etc.
Fig. 2 shows the qualitative simulation results for each exponential gradient examined, and also a linear gradient for comparison. The linear gradient, which is akin to a conventional drift tube-ion mobility spectrometer (DT-IMS)51 type ion guide, provides a baseline comparison. As expected, an immediate expansion of the ion cloud is evident due to high E-field created by the ESI emitter at 5 kV. Upon entering the ion guide, the ions traverse with generally constant velocity and limited radial focusing. The non-uniformity of velocity and slight focusing effect observed is due to field penetration from the ESI emitter and the conductive SERS substrate. Usually in a DT-IMS the entrance would have a gridded electrode across it to prevent field ingress.
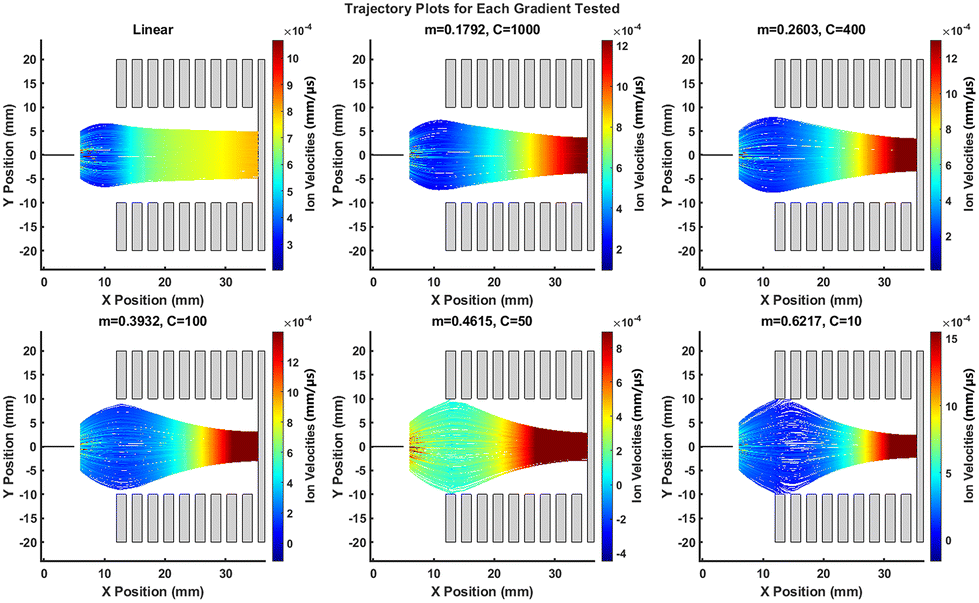 | ||
| Fig. 2 Particle trajectory maps colour-coded to ion velocity for various voltage gradients as labelled. | ||
In stark contrast, the steepest exponential gradient, C = 10, exhibited a much broader ion cloud expansion due to essentially a field free region around the first few electrodes where the applied voltage is close to 0 V. The ESI emitter field can therefore penetrate much further into the ion guide resulting in a more widely dispersed ion cloud. In fact, for this particular case, which is the steepest exponential gradient tested, the ion cloud diameter actually exceeds that of the inner diameter of the electrodes, which reduces the overall ion transmission.
Physical processes not modelled here would presumably be useful, in practice, to assist ions through this field free region. For instance, the nitrogen gas will, through collisions, impart an assisting velocity in the positive x direction. As ions traverse the ion guide the field curvature created by the exponential gradient effectively ‘funnels’ ions radially inwards. Field maps for each gradient can be seen in Fig. S3,† clearly demonstrating that for steeper exponential gradients a higher degree of inward field curvature is generated.
Fig. S4A† (left panel) shows a series of hit maps for y and z coordinates of simulated ions where they strike the substrate at the end of the ion guide, for each gradient. The radius of the observed landing pattern decreases with an increase in the exponential gradient corroborating the field map data. Transmission of ions is 100% for the first four gradients simulated, after which the ion plume starts to expand beyond the inner dimensions of the funnel and discharge on the first and second electrodes (C = 10). Therefore, the density (ions per mm2) is highest for the field gradient denoted by C = 50 (Fig. S4A,† right panel). The simulated ion densities broadly follow the experimental data for the linear ion guide which exhibited a higher intensity Raman spectrum than C = 1000 and C = 400 (shown later in Results and Discussion section, Fig. 5C). It is important to note that the simulation study is only designed to give a qualitative indication of the electrodynamic effects one can expect from the ion funnel. It does not consider other physical phenomenon at play, for instance the influence of the nebuliser gas on the particle dynamics which can also influence the distribution of NPs deposited on the substrate. To examine the surface coverage, we also obtained SERS line scan data, for linear and C = 50, with corresponding photographs of the deposited areas also shown in Fig. S4B† insert. These results demonstrate consistent SERS signal intensity across each AuNP-coated region, indicating good uniformity (RSDs of 6.5% and 5.7% for linear and C = 50, respectively). Further consideration of this is given in the Results section (Fig. 3).
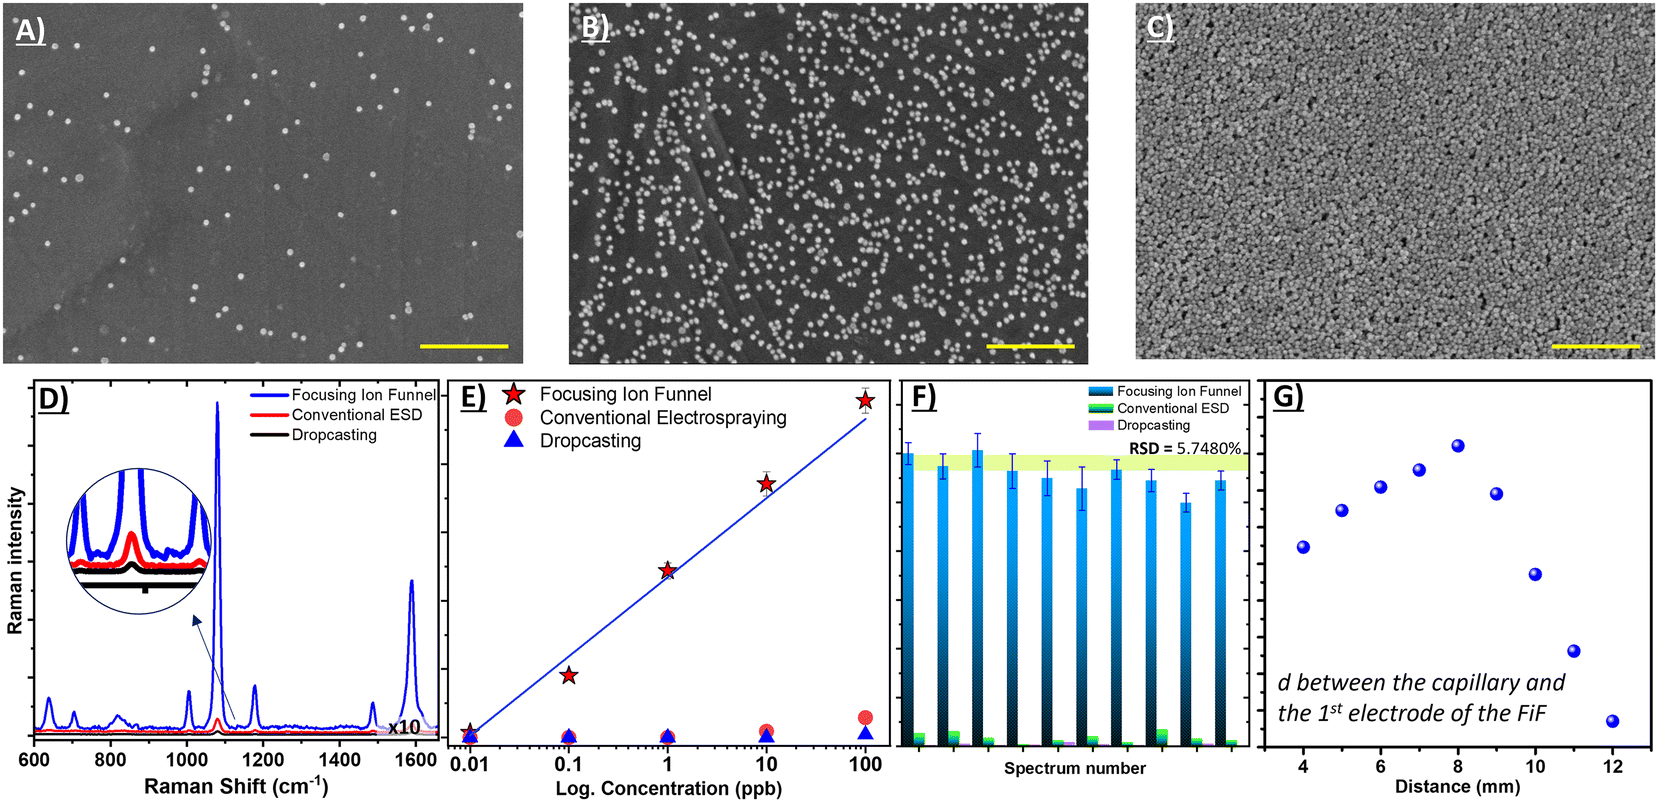 | ||
| Fig. 3 SEM images after depositing gold nanoparticles by (A) dropcasting, (B) conventional ESD, (C) ESD with ambient focusing ion funnel, (D) SERS spectra comparison of the 3 substrate samples, (E) SERS intensity variation with different concentrations of 4-ATP, (F) SERS signal uniformity analysis from 10 random locations for each sample, (G) SERS intensity variation versus distance between the ESD capillary and the 1st electrode of the focusing ion funnel. For the focusing ion funnel experiments, Cgradient = 50 (at 10 kV) was used. All scale bars are 500 nm. | ||
Ambient electrospray deposition (ESD) of AuNPs by focusing ion funnel
To reduce the surface tension and speed up solvent evaporation, the solution was diluted with an equivalent volume of DI water. Using the syringe pump, the diluted suspension was infused into the ESI probe at the desired liquid flow rate. The spray nozzle exit was directly coupled to the entrance of the focusing ion funnel, to focus the ionised beam of AuNPs on to the substrate, which was charged at 3.5–5.0 kV with a high-voltage power supply. The ESI probe also incorporates a nebuliser gas (nitrogen) which was supplied from a Nitrogen generator (Genius XE35, Peak Scientific USA), with a flow rate of 1 L min−1 to enhance desolvation of the electrosprayed solution. Also, an IR lamp (HE015, Vet-Tech, UK) was placed directly above the ESD setup for the same purpose, to aid solvent evaporation. The average temperature in the vicinity with the IR lamp on was ∼55 °C. The substrate was attached to the last electrode of the focusing ion funnel and negatively charged at – 3.5–5.0 kV by using the same high-voltage power supply. AuNPs were electrosprayed for one hour at ambient pressure (1 atm) onto the substrate with a flow rate of 3 μL min−1. Heating the nebuliser gas is an effective means to improve desolvation, as is routinely the case for regular electrospray ionisation mass spectrometry. Since we did not have this feature available, we utilised an IR lamp instead. A simple experiment was conducted to demonstrate its influence within the experimental setup, whereby a series of SERS measurements were carried out with and without the IR lamp. As expected (Fig. S5†), in the absence of IR heating, an increased variability of the SERS signal intensity is observed. Fig. S5B and C† further show corresponding scanning electron microscopy (SEM) images of AuNP surface coverage with and without the IR lamp, respectively. Without the additional heat from the IR lamp, there is evidence of AuNP aggregation on the surface (Fig. S5B†). Under ambient conditions, this can be ascribed to insufficient evaporation of the electrospray droplets. At room temperature there is an increased likelihood of droplets landing on the substrate, resulting in localised wetting and on-surface evaporation. Hence, the increased temperature afforded by the IR lamp is an important facet of the experimental apparatus. To examine the effect of nebulising gas on the distribution of NPs deposited on the surface, we performed further experiments in the absence of the gas. As presented in Fig. S6A and B,† the SERS intensity variation across the surface increases when the nebulising gas is turned off. Corresponding SEM images, shown in Fig. S6C and D,† support the observed SERS signal intensity variations. Therefore, nebulising gas and IR heating were used throughout this study.Results and discussion
The density and relative positions of deposited noble metal nanoparticles determine the enhancement behaviour of the substrate.52,53 Therefore, SEM was used to evaluate the density of AuNPs coated on the substrate prepared by the different methods: dropcasting, ESD, and ESD-with a focusing ion funnel. Fig. 3A to C shows typical images of the density of AuNPs (spherical) following each coating procedure (dropcasting, standard ESD and focusing ion funnel ESD, respectively). The highest density of AuNP coverage was obtained with ESD-focusing ion funnel at 926 NPs per μm2 (calculated using ImageJ software). This represents a ∼6.5-fold and ∼38.6-fold increase in AuNP density over conventional electrospray (143 NPs per μm2) and dropcasting (24 NPs per μm2), respectively. In Fig. 3D, the SERS spectra of 1 ppm 4-ATP for the three deposition methods are presented. The a1 modes at 1079 cm−1 and 1585 cm−1, which are linked to C–S and C–C stretching vibrations, respectively, are the most dominant bands in the SERS spectra. The electromagnetic effect is primarily responsible for the amplification of the a1 modes, which is thought to reflect 4-ATP's vertical or tilled orientation on the gold surface.54 The SERS intensity of ESD by focusing ion funnel is almost 70-fold and, 20-fold more intense than dropcasting and conventional electrospray, respectively. This is roughly in accordance with the increased AuNP densities as calculated from SEM images.In Fig. 3E, the calibration curve corresponds to the signal intensity of the Raman band at 1585 cm−1 for all three substrate preparation methods. ESD by focusing ion funnel shows good linearity (R2 > 0.987) over a concentration range of 0.01 to 100 ppb for 4-ATP. The limit of detection (LoD), RSD and R2 values are calculated for conventional ESD and dropcasting techniques. The LoD for conventional ESD was 9 ppb while dropcasting yielded 801 ppb with relatively poor linearity in both instances. The enhancement factor of the substrate will be discussed later.
Along with sensitivity, homogeneity of the substrate and reproducibility of the SERS signal are also crucial elements in real-world SERS applications. In addition to increased AuNP density, we speculated whether the additional control afforded to ESD by using a focusing ion funnel could also help to create a uniform coating providing a basis for reproducible SERS analysis. To demonstrate this, we performed a series of SERS measurements across each substrate monitoring the Raman response for the same probe molecule, 4-ATP which was drop-cast onto each substrate after AuNP deposition. On the three different substrate preparations the 4-ATP Raman signal was clearly visible, as seen in Fig. 3F. Within each substrate 10 random locations were selected to determine the relative standard deviation (RSD) for each. These were calculated from the Raman band at 1585 cm−1 for focused-ESD, conventional ESD and dropcasting, yielding 5.75%, 19.51%, and 22.71% respectively. The findings indicate that the utilisation of a focusing ion funnel with ESD provides an effective means for producing a consistent SERS signal, thus making it a viable substrate for SERS.
We also investigated the effect of changing the distance between the ESI capillary and the first electrode of the focusing ion funnel, as presented in Fig. 3G. Many ESI interfaces allow adjustment of the distance between the ES emitter and sampling inlet in a conventional sense. Typically, for ESI mass spectrometry (MS), this gap ranges from 2 to 10 mm, with larger distances favoured for higher solution flow rates. When the distance is shorter, more of the ES plume can be sampled by the MS instrument, but this can reduce ionisation efficiency.55 To investigate this relationship for our setup, we kept the applied voltage, flow rate and the focusing ion funnel gradient fixed, while varying the distance between the emitter and the first electrode. The substrate itself is, in totality, >10 cm away from the ESI capillary, due to the length of the focusing ion funnel (10 cm). As seen in Fig. 3G, as the distance between the ESI capillary and first electrode increased from 4 to 8 mm, the SERS signal from the resultant substrate increased also. We suspect that this increase in distance provides additional time for droplet evaporation.56 When the distance is further increased (beyond 8 mm), the SERS intensity tends to decrease. This is due to the fact that the subsequent reduction in the electric field is no longer strong enough to direct ionised particles to the inside of the funnel and thus charged particles cannot reach the substrate (attached to the last electrode).
Based on the scaling law developed by De La Mora and Loscertales, the current delivered by a cone-jet electrospray increases proportionally to the square root of the flow rate.57 It is also well known that there is a strong correlation between the electrospray voltage and the current.58 Therefore, to find the optimum voltage that needs to be applied, the ESI voltage was also varied systematically from 6.5 to 10.0 kV while keeping the other parameters constant, as shown in Fig. 4. SERS results show that the intensity of the 4-ATP molecule tends to increase with increasing ESI potential. It suggests that the number of nanoparticles per unit area is directly proportional to the ESI potential. In Fig. 4B, the SERS signal intensity is plotted against substrates fabricated with increasing ESI voltage, showing a piecewise linear relationship. In Fig. 4C, corresponding SEM images for substrates prepared with ESI voltages ranging from 6.5 to 10.0 kV are presented. SEM results tend to agree with the trend observed in Fig. 4B. As seen in the SEM images, the surface coverage density (AuNPs per unit area) increases with ESI voltage increase. The highest AuNP coverage was obtained with 10.0 kV ESI voltage (the maximum voltage output of the power supply available).
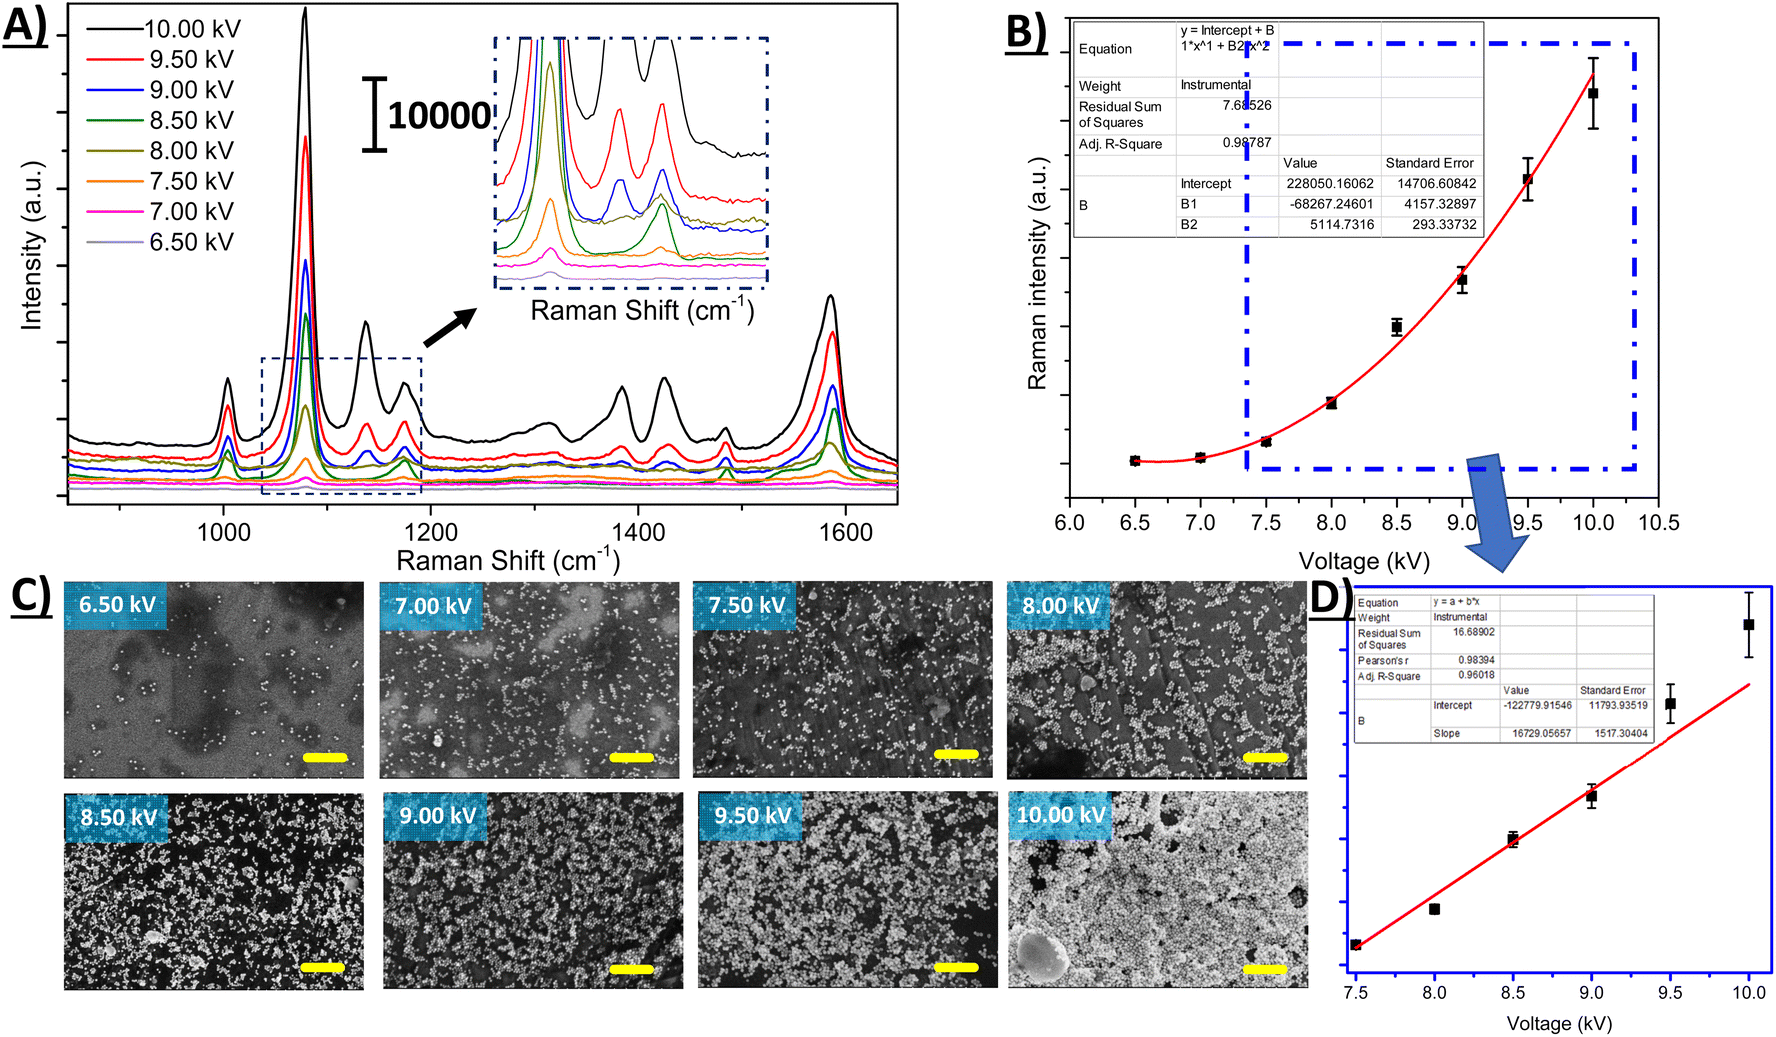 | ||
| Fig. 4 (A) SERS intensity variation for different applied voltages, (B) corresponding calibration curve and (C) SEM images for different ESI voltages as labelled. All scale bars are 500 nm. In (B) and (D) means are shown with standard deviation error bars from 10 replicates. | ||
Focusing ion funnel-ESD of a mixture containing different AuNP geometries
The focused ESD technique reported herein has been optimised to develop substrates with high density AuNPs and high uniformity, making them ideal for quantitative SERS analysis. Additionally, we further investigated our focusing ESD setup to determine whether it can facilitate effective deposition including mixing within charged droplets comprising diverse AuNP geometries (including non-spherical shapes), which can potentially be advantageous for a SERS substrate. Although the production of spherical AuNPs has been researched extensively, rod-shaped gold NPs have also gained a lot of interest due to their optical anisotropic nature.59,60 Specifically, gold nanorods have two plasmonic bands, which can be tuned based on the aspect ratio of the nanoparticle, making them particularly versatile and useful.60–62Even though combining different shapes of nanoparticles can be advantageous in terms of SERS efficiency, it requires either complicated chemical synthesis or lengthy sample preparation steps.63–65 In Fig. 5, we presented SERS results of electrospray deposited gold nanorods (NRs) and gold nanospheres (NSs) separately, and furthermore a mixture of the two geometries (AuNRs/AuNSs), in comparison with dropcasting. SERS results are shown in Fig. 5A, clearly showing the superior performance of ESD by focusing ion funnel compared to drop casting for all samples. The ESD process allows for better control of NP density on the substrate surface, which can be quite challenging for dropcasting methods. Additionally, our FDTD calculations (Fig. S7†) support the observation that coatings of AuNRs yield better enhancement than AuNSs, regardless of the coating technique used. As demonstrated in Fig. S7A,† the local electric field intensity enhancement of AuNRs is higher than that of AuNSs. However, when the mixture of AuNRs and AuNSs are drop-casted (or dropcasted AuNRs and AuNSs in sequence, as presented in Fig. S8†) separately onto SS substrates, their SERS signal intensities are quite different from each other, as seen in Fig. 5A and B. To investigate this, we performed SEM measurements, as shown in Fig. 5D. We presented results for dropcasted and ESD-focusing ion funnel with gradients C-400 and C-50. It is clearly seen from SEM images that the density of nanoparticles on the focused ESD surface is higher than that of dropcasted. We also tested different focusing ion funnel exponential voltage gradients in terms of their SERS signal response, as presented in Fig. 5C. Our results indicate that the highest SERS signal intensity was obtained with C-50 gradient. Furthermore, in the inset of Fig. 5C, we displayed the SERS signal intensity results for three different electrode spacings of focusing ion funnel (5, 10 and 15 mm) exhibiting marginal differences in the corresponding SERS response.
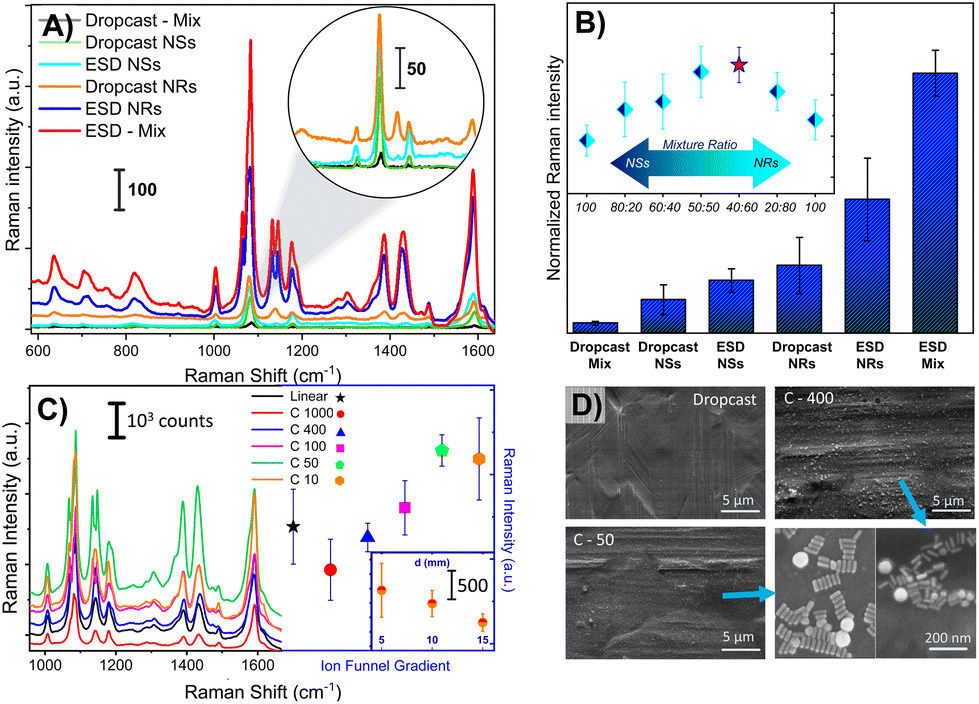 | ||
| Fig. 5 (A) SERS spectra comparison and (B) SERS intensity comparison of AuNSs and AuNRs by FIF-ESD and dropcasting techniques, where bars represent mean values and the error bars are standard deviations from 10 replicates (inset: SERS intensity vs. mixture ratio) (C) SERS spectra obtained from ESD by focusing ion funnel with different gradients (inset: mean SERS intensity variation by changing the inter-electrode distances for C-1000; error bars relate to standard deviations from 10 replicates), (D) SEM images from dropcasting, and ESD by FIF using C-400 and C-50 gradients. | ||
In addition to density, the aggregation behaviour of the AuNRs/AuNSs mixture determines the enhancement factor of the substrate. UV-VIS absorption spectra of the mixture, in comparison with AuNRs and AuNSs, are presented in Fig. S9.† Absorption spectra of the mixture showed that there is no interaction between AuNRs and AuNSs as shown by the preservation of the same plasmon bands. As presented in Fig. S10,† when the mixture is dropcast on the substrate, AuNRs and AuNSs do not aggregate with each other in contradistinction to a focused-ESD substrate. Nanorods and nanospheres are close enough to each other to create plasmonic hot spots on the surface. We further investigated this by employing FDTD calculations to reveal the effect of nanorod and nanosphere aggregation on the surface, as shown in Fig. S7.† In order to closely resemble a realistic scenario, only the aggregation of nanorods (both horizontally and vertically oriented) and nanospheres were considered for FDTD calculations. Our calculations showed that the nanorod/nanosphere system has the strongest near-field enhancement among three configurations. Thus, greater enhancement is not only due to high density of nanoparticles but also due to having higher near-field enhancement within the vicinity of the AuNRs–AuNSs system. The ratio of AuNSs/AuNRs was also investigated by considering the SERS enhancement, as depicted in Fig. 5B. We found that the highest SERS signal was obtained from a 40:60 (AuNSs:AuNRs) mixture ratio.
Enhancement factor of the substrate
The substantial amplification offered by SERS is commonly believed to stem from two factors: the enhancement of the electromagnetic field (EM) and the enhancement of the chemical effect (CE). Chemical enhancement is often observed for molecules which exhibit a high binding efficiency on the metal NP surface (i.e., those that are adsorbed onto the metal). As presented above, 4-ATP is known for its high binding energy on metal NP surfaces and both EM and CE take place. To validate the performance of our substrate regarding EM enhancement, R6G was chosen as an alternative probe to explore the label-free SERS activities of the focused ESD substrate. The distinguishing Raman peaks for the concentration dependence of the SERS intensities for R6G are displayed in Fig. 6A. At a concentration of 10−7 M, typical Raman band assignments for R6G include the peaks at 1645, 1505, and 1358 cm−1, which are linked to the carbon skeleton stretching modes.66 Additionally, the peaks at 611, 771, and 1180 cm−1 are assigned to the C–C–C ring in-plane, out-plane bending, and C–C stretching vibrations, respectively.67 It is noteworthy that the C–O–C stretching mode at 1127 cm−1, which is hardly visible in the Raman spectrum, is distinctly observable. The characteristic Raman peaks of R6G for the concentration range of 10−4 M to 10−10 M are clearly visible. The linear fit curves for the vibrations of R6G located at 612, 1362, and 1510 cm−1 relative to concentration are displayed in Fig. 6B, showing excellent linearity (R2 was 0.992 for 612 cm−1, 0.991 for 1362 cm−1, and 0.991 for 1510 cm−1).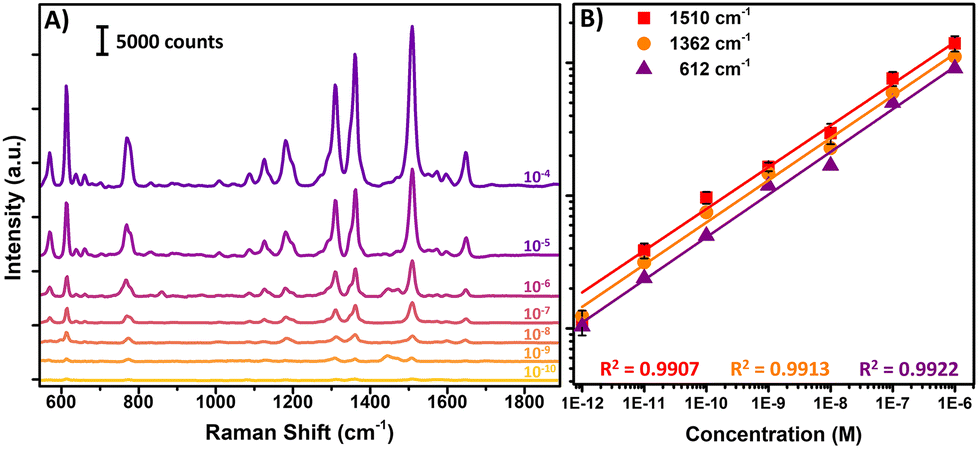 | ||
| Fig. 6 SERS spectra of (A) R6G on ESD by focusing ion funnel substrate from 10−4 M to 10−10 M and (B) the Raman signal intensity of R6G at 612, 1362, and 1510 cm−1 peaks as a function of molecular concentration (log scale). | ||
The effectiveness of the focused-ESD-SERS substrate developed herein can be evaluated by considering the enhancement factor (EF), which measures the contribution to the enhanced Raman spectra of R6G molecules. To calculate the enhancement factor of the substrate, the most dominant Raman peak located at 1585 cm−1 was chosen. The enhancement factor is calculated by using the following formula (eqn (2)),68,69
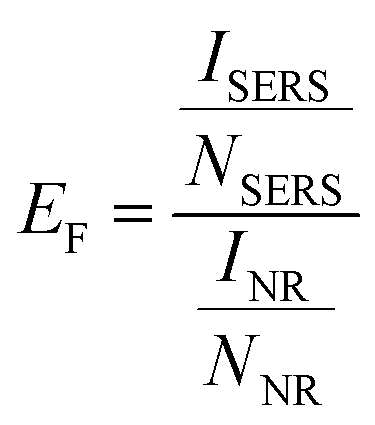 | (2) |
Conclusions
We have successfully developed an ambient (DC-only) focusing ion funnel coupled with electrospray deposition (ESD) that enables uniform, high-density, large-area and intact coating of noble metal nanoparticles, including non-spherical geometries, for high performance SERS substrate fabrication. Compared to dropcasting and conventional electrospray, our ESD-focusing ion funnel arrangement demonstrated significantly more intense SERS signals with ∼70-fold and ∼20-fold increase, respectively. Additionally, our uniformity analysis showed that the ESD-focusing ion funnel provides an excellent coating of AuNPs with a relative standard deviation <5.75%. We also optimised some operating parameters of the focused-ESD technique, such as the distance between the ESI capillary and the focusing ion funnel, spacing between the electrodes, exponential focusing ion funnel gradient, and applied voltage, which affect the coating quality of AuNPs in terms of uniformity and density. Moreover, we demonstrated that the focused-ESD approach can be used to successfully coat mixtures of AuNSs and AuNRs, whereby the electrosprayed mixture provides a better signal enhancement than electrospraying either the AuNSs or AuNRs separately. FDTD calculations indicate that the near-field enhancement between adjacent AuNRs and AuNSs is higher than the enhancement between AuNSs or AuNRs. Using R6G as a model analyte, we assessed the enhancement factor of the SERS substrate, finding it to be ∼3.4 × 10⁸. Furthermore, the substrates developed by focused-ESD were further examined in terms of their analytical figures of merit. A calibration curve was generated for R6G which exhibited excellent linearity (R2 > 0.99) over a wide concentration range with a detection limit of 80 pM.The fabrication method in this work provides a sound basis that other researchers can readily implement. Possible improvements to this work might include using a heated nebuliser gas, with optimised gas temperature and flow rate. Furthermore, the electrospray flow rate and capillary diameter can be further optimised depending upon the colloidal solution to be deposited. Indeed, this approach can also be readily coupled to nano electrospray. However, particular attention should be given to the internal diameter of the capillary and any associated tubing when using NPs to avoid blockages. The same focusing-ESD apparatus can also be used to apply analyte solution to the same SERS substrate, which may yield even better SERS signal uniformity. Moreover, as demonstrated herein, this approach allows non-spherical NP geometries to be soft landed, thus there is an exciting opportunity to deposit a range of bespoke NPs with peculiar geometries. It is also worth noting that this surface preparation method is not limited to SERS substrate fabrication with AuNPs. Indeed, electrospray ionisation can be carried out with a wide range of materials including non-metallic plasmonic NPs. The high uniformity and precise control over the amount of material deposited using the focused-ESD setup could prove useful for a range of other applications. In conclusion, ESD by focusing ion funnel offers a versatile and effective method to augment uniform and high-density coating of both spherical and non-spherical, homo- and hetero-dispersed metal colloidal nanoparticle solutions for high performance SERS analysis.
Author contributions
The manuscript was written through contributions of all authors.Conflicts of interest
There are no conflicts to declare.Acknowledgements
S. M., T.-Y. C. and B. A. acknowledge funding from the University of Liverpool (UK) and National Tsing Hua University (Taiwan) dual-award PhD degree partnership. S. M. and R. G. gratefully acknowledge support from the EPSRC (EP/V001019/1). Authors R. G. and C. L. would like to thank LIV-SRF for financial support for Raman. Furthermore, R. G. and C. L. would also like to thank EPSRC-SFI (EP/V042882/1) for support. Authors T. V., S. M., K. W. and B. C. acknowledge the National Science, Research and Innovation Fund (NSRF) via the Program Management Unit for Human Resources & Institutional Development, Research and Innovation (B16F640101) for supporting this research.References
- U. Kreibig and M. Vollmer, in Optical Properties of Metal Clusters, ed. U. Kreibig and M. Vollmer, Springer Berlin Heidelberg, Berlin, Heidelberg, 1995, pp. 203–274, DOI:10.1007/978-3-662-09109-8_3.
- C. F. Bohren and D. R. Huffman, Absorption and scattering of light by small particles, John Wiley & Sons, 2008, pp. 12–56 Search PubMed.
- U. Kreibig, M. Vollmer, U. Kreibig and M. Vollmer, Optical Properties of Metal Clusters, 1995, pp. 203–274 Search PubMed.
- M. Moskovits, J. Chem. Phys., 1978, 69, 4159–4161 CrossRef CAS.
- M. Moskovits, Rev. Mod. Phys., 1985, 57, 783 CrossRef CAS.
- T. R. Jensen, M. D. Malinsky, C. L. Haynes and R. P. Van Duyne, J. Phys. Chem. B, 2000, 104, 10549–10556 CrossRef CAS.
- S.-Y. Ding, J. Yi, J.-F. Li, B. Ren, D.-Y. Wu, R. Panneerselvam and Z.-Q. Tian, Nat. Rev. Mater., 2016, 1, 1–16 Search PubMed.
- L.-L. Tay and J. Hulse, J. Mod. Opt., 2013, 60, 1107–1114 CrossRef CAS.
- L.-L. Tay, J. Hulse, D. Kennedy and J. P. Pezacki, J. Phys. Chem. C, 2010, 114, 7356–7363 CrossRef CAS.
- J. Langer, D. J. de Aberasturi, J. Aizpurua, R. A. Alvarez-Puebla, B. Auguié, J. J. Baumberg, G. C. Bazan, S. E. J. Bell, A. Boisen, A. G. Brolo, J. Choo, D. Cialla-May, V. Deckert, L. Fabris, K. Faulds, F. J. García de Abajo, R. Goodacre, D. Graham, A. J. Haes, C. L. Haynes, C. Huck, T. Itoh, M. Käll, J. Kneipp, N. A. Kotov, H. Kuang, E. C. Le Ru, H. K. Lee, J.-F. Li, X. Y. Ling, S. A. Maier, T. Mayerhöfer, M. Moskovits, K. Murakoshi, J.-M. Nam, S. Nie, Y. Ozaki, I. Pastoriza-Santos, J. Perez-Juste, J. Popp, A. Pucci, S. Reich, B. Ren, G. C. Schatz, T. Shegai, S. Schlücker, L.-L. Tay, K. G. Thomas, Z.-Q. Tian, R. P. Van Duyne, T. Vo-Dinh, Y. Wang, K. A. Willets, C. Xu, H. Xu, Y. Xu, Y. S. Yamamoto, B. Zhao and L. M. Liz-Marzán, ACS Nano, 2020, 14, 28–117 CrossRef CAS PubMed.
- T. S. Alomar, N. AlMasoud, Y. Xu, C. Lima, B. Akbali, S. Maher and R. Goodacre, Sensors, 2022, 22, 7832 CrossRef PubMed.
- H. Fisk, C. Westley, N. J. Turner and R. Goodacre, J. Raman Spectrosc., 2016, 47, 59–66 CrossRef CAS PubMed.
- P. Z. El-Khoury, G. E. Johnson, I. V. Novikova, Y. Gong, A. G. Joly, J. E. Evans, M. Zamkov, J. Laskin and W. P. Hess, Faraday Discuss., 2015, 184, 339–357 RSC.
- D. Wang, F. Liang, P. Ma, Q. Yang, D. Gao, D. Song and X. Wang, Food Anal. Methods, 2016, 9, 934–941 CrossRef.
- D. Mampallil and H. B. Eral, Adv. Colloid Interface Sci., 2018, 252, 38–54 CrossRef CAS PubMed.
- H. Tan, S. Wooh, H.-J. Butt, X. Zhang and D. Lohse, Nat. Commun., 2019, 10, 478 CrossRef CAS PubMed.
- B. R. D. Deegan, T. F. Dupont, G. Huber, S. R. Nagel and T. A. Witten, Nature, 1997, 389, 827–829 CrossRef.
- T. S. Dabodiya, S. G. Sontti, Z. Wei, Q. Lu, R. Billet, A. V. Murugan and X. Zhang, Adv. Mater. Interfaces, 2022, 9, 2201998 CrossRef CAS.
- S. E. J. Bell, G. Charron, E. Cortés, J. Kneipp, M. L. de la Chapelle, J. Langer, M. Procházka, V. Tran and S. Schlücker, Angew. Chem., Int. Ed., 2020, 59, 5454–5462 CrossRef CAS PubMed.
- R. Goodacre, D. Graham and K. Faulds, TrAC, Trends Anal. Chem., 2018, 102, 359–368 CrossRef CAS.
- B. Chen, G. Meng, Q. Huang, Z. Huang, Q. Xu, C. Zhu, Y. Qian and Y. Ding, ACS Appl. Mater. Interfaces, 2014, 6, 15667–15675 CrossRef CAS PubMed.
- H. Zhang, M. Liu, F. Zhou, D. Liu, G. Liu, G. Duan, W. Cai and Y. Li, Small, 2015, 11, 844–853 CrossRef CAS PubMed.
- Q. Yu, P. Guan, D. Qin, G. Golden and P. M. Wallace, Nano Lett., 2008, 8, 1923–1928 CrossRef CAS PubMed.
- Q. Wu, R. Liu, F. Miao, G. Zhang, W. Li and Y. Song, Chem. Eng. J., 2023, 452, 139355 CrossRef CAS.
- R. Liu, Q. Wu, X. Huang, X. Zhao, X. Chen, Y. Chen, D. A. Weitz and Y. Song, RSC Adv., 2021, 11, 37814–37823 RSC.
- S. Kumar, S. Cherukulappurath, T. W. Johnson and S.-H. Oh, Chem. Mater., 2014, 26, 6523–6530 CrossRef CAS PubMed.
- T. Ahuja, A. Ghosh, S. Mondal, P. Basuri, S. K. Jenifer, P. Srikrishnarka, J. S. Mohanty, S. Bose and T. Pradeep, Analyst, 2019, 144, 7412–7420 RSC.
- C. Kanike, H. Wu, A. W. Zaibudeen, Y. Li, Z. Wei, L. D. Unsworth, A. Atta and X. Zhang, Chem. Eng. J., 2023, 470, 144019 CrossRef CAS.
- A. Jaworek, J. Mater. Sci., 2007, 42, 266–297 CrossRef CAS.
- A. K. Badu-Tawiah, C. Wu and R. G. Cooks, Anal. Chem., 2011, 83, 2648–2654 CrossRef CAS PubMed.
- A. Li, Z. Baird, S. Bag, D. Sarkar, A. Prabhath, T. Pradeep and R. G. Cooks, Angew. Chem., Int. Ed., 2014, 53, 12528–12531 CAS.
- A. Ghosh, T. Ahuja, K. Chaudhari and T. Pradeep, J. Phys. Chem. C, 2020, 124, 16644–16651 CrossRef CAS.
- A. Li, Q. Luo, S.-J. Park and R. G. Cooks, Angew. Chem., Int. Ed., 2014, 53, 3147–3150 CrossRef CAS PubMed.
- S. J. Clark, R. Argelaguet, C.-A. Kapourani, T. M. Stubbs, H. J. Lee, C. Alda-Catalinas, F. Krueger, G. Sanguinetti, G. Kelsey and J. C. Marioni, Nat. Commun., 2018, 9, 781 CrossRef PubMed.
- J. Wang, L. Yang, B. Liu, H. Jiang, R. Liu, J. Yang, G. Han, Q. Mei and Z. Zhang, Anal. Chem., 2014, 86, 3338–3345 CrossRef CAS PubMed.
- A. Li, Q. Luo, S. J. Park and R. G. Cooks, Angew. Chem., Int. Ed., 2014, 53, 3147–3150 CrossRef CAS PubMed.
- R. T. Kelly, A. V. Tolmachev, J. S. Page, K. Tang and R. D. Smith, Mass Spectrom. Rev., 2010, 29, 294–312 Search PubMed.
- A. V. Tolmachev, H. R. Udseth and R. D. Smith, Int. J. Mass Spectrom., 2003, 222, 155–174 CrossRef CAS.
- B. L. Smith, C. Boisdon, D. Romero-Perez, T.-T. Sham, B. Bastani, Y. Zhou, S. McWilliam, A. K. Badu-Tawiah and S. Maher, Int. J. Mass Spectrom., 2022, 471, 116737 CrossRef CAS.
- A. L. Hollerbach, Y. M. Ibrahim, R. V. Norheim, T. O. Metz and R. G. Ewing, Int. J. Mass Spectrom., 2022, 482, 116948 CrossRef CAS.
- N. Wiriyachaiporn, P. Srisurat, J. Cherngsuwanwong, N. Sangsing, J. Chonirat, S. Attavitaya and S. Bamrungsap, New J. Chem., 2019, 43, 8502–8507 RSC.
- B. Nikoobakht and M. A. El-Sayed, Chem. Mater., 2003, 15, 1957–1962 CrossRef CAS.
- S. Bamrungsap, A. Treetong, C. Apiwat, T. Wuttikhun and T. Dharakul, Microchim. Acta, 2016, 183, 249–256 CrossRef CAS.
- A. Parnsubsakul, C. Sapcharoenkun, C. Warin, S. Ekgasit and P. Pienpinijtham, Colloids Surf., B, 2022, 217, 112702 CrossRef CAS PubMed.
- M. Sánchez-Purrà, M. Carré-Camps, H. de Puig, I. Bosch, L. Gehrke and K. Hamad-Schifferli, ACS Infect. Dis., 2017, 3, 767–776 CrossRef PubMed.
- J. Sun, Z. Zhang, C. Liu, X. Dai, W. Zhou, K. Jiang, T. Zhang, J. Yin, J. Gao and H. Yin, Anal. Bioanal. Chem., 2021, 413, 5469–5482 CrossRef CAS PubMed.
- R. K. Saini, A. K. Sharma, A. Agarwal and R. Prajesh, Mater. Chem. Phys., 2022, 287, 126288 CrossRef CAS.
- A. Lewis, R. Gaifulina, M. Isabelle, M. L. Woods, G. R. Lloyd, K. Lau, M. Rodriguez-Justo, C. Kendall, N. Stone and G. M. Thomas, J. Raman Spectrosc., 2017, 48, 119–125 CrossRef CAS PubMed.
- H. Kotrange, A. Najda, A. Bains, R. Gruszecki, P. Chawla and M. M. Tosif, Int. J. Mol. Sci., 2021, 22, 9596 CrossRef CAS PubMed.
- T. Reinecke and B. H. Clowers, HardwareX, 2018, 4, e00030 CrossRef.
- B. L. Smith, C. Boisdon, I. S. Young, T. Praneenararat, T. Vilaivan and S. Maher, Anal. Chem., 2020, 92, 9104–9112 CrossRef CAS PubMed.
- H. Ko, S. Singamaneni and V. V. Tsukruk, Small, 2008, 4, 1576–1599 CrossRef CAS PubMed.
- V. Merk, J. Kneipp and K. Leosson, Adv. Opt. Mater., 2013, 1, 313–318 CrossRef.
- M. Osawa, N. Matsuda, K. Yoshii and I. Uchida, J. Phys. Chem., 1994, 98, 12702–12707 CrossRef CAS.
- J. S. Page, R. T. Kelly, K. Tang and R. D. Smith, J. Am. Soc. Mass Spectrom., 2007, 18, 1582–1590 CrossRef CAS PubMed.
- N. M. Sarih, D. Romero-Perez, B. Bastani, M. Rauytanapanit, C. Boisdon, T. Praneenararat, H. A. Tajuddin, Z. Abdullah, A. K. Badu-Tawiah and S. Maher, Sci. Rep., 2020, 10, 21504 CrossRef CAS PubMed.
- J. F. De La Mora and I. G. Loscertales, J. Fluid Mech., 1994, 260, 155–184 CrossRef.
- V. Gundabala, N. Vilanova and A. Fernández-Nieves, Phys. Rev. Lett., 2010, 105, 154503 CrossRef CAS PubMed.
- M. Grzelczak, J. Pérez-Juste, P. Mulvaney and L. M. Liz-Marzán, Chem. Soc. Rev., 2008, 37, 1783–1791 RSC.
- S. Nam, N. Oh, Y. Zhai and M. Shim, ACS Nano, 2015, 9, 878–885 CrossRef CAS PubMed.
- Q. Jiang, Y. Shi, Q. Zhang, N. Li, P. Zhan, L. Song, L. Dai, J. Tian, Y. Du and Z. Cheng, Small, 2015, 11, 5134–5141 CrossRef CAS PubMed.
- X. Qian, D. Peng and Q. Ansari, Nat. Biotechnol., 2008, 26, 83–90 CrossRef CAS PubMed.
- M. P. Davies, C. S. McKinney, J. M. Serrano, T. J. Mullen and S. P. Stagon, Appl. Phys. Lett., 2017, 110, 053109 CrossRef.
- N. Yang, T.-T. You, X. Liang, C.-M. Zhang, L. Jiang and P.-G. Yin, RSC Adv., 2017, 7, 9321–9327 RSC.
- D. Lee and S. Yoon, J. Phys. Chem. C, 2016, 120, 20642–20650 CrossRef CAS.
- R. Que, M. Shao, S. Zhuo, C. Wen, S. Wang and S. T. Lee, Adv. Funct. Mater., 2011, 21, 3337–3343 CrossRef CAS.
- X. Li, G. Chen, L. Yang, Z. Jin and J. Liu, Adv. Funct. Mater., 2010, 20, 2815–2824 CrossRef CAS.
- B. Akbali, M. Yagmurcukardes, F. Peeters, H.-Y. Lin, T.-Y. Lin, W.-H. Chen, S. Maher, T.-Y. Chen and C.-H. Huang, J. Phys. Chem. C, 2021, 125, 16289–16295 CrossRef CAS.
- X. Yan, M. Wang, X. Sun, Y. Wang, G. Shi, W. Ma and P. Hou, Appl. Surf. Sci., 2019, 479, 879–886 CrossRef CAS.
- E. C. Le Ru, M. Meyer, E. Blackie and P. G. Etchegoin, J. Raman Spectrosc., 2008, 39, 1127–1134 CrossRef CAS.
Footnote |
| † Electronic supplementary information (ESI) available. See DOI: https://doi.org/10.1039/d3an01021j |
| This journal is © The Royal Society of Chemistry 2023 |