 Open Access Article
Silver nanoparticles – laser induced graphene (Ag NPs – LIG) hybrid electrodes for sensitive electrochemical-surface enhanced Raman spectroscopy (EC-SERS) detection†
Yunyun
Mu‡
ab,
Jahidul
Islam‡
a,
Richard
Murray
 a,
Cathal
Larrigy
a,
Alida
Russo
a,
Cathal
Larrigy
a,
Alida
Russo
 a,
Xinping
Zhang
 b,
Aidan J.
Quinn
a and
Daniela
Iacopino
 *a
*a
aTyndall National Institute, University College Cork, Dyke Parade, Cork, Ireland. E-mail: daniela.iacopino@tyndall.ie
bFaculty of Science, Institute of Information Photonics Technology, Beijing University of Technology, Beijing 100124, China
First published on 9th June 2023
Abstract
This paper presents a novel approach for the fabrication of low cost Electrochemical-Surface Enhanced Raman Scattering (EC-SERS) sensing platforms. Laser Induced Graphene (LIG) electrodes were readily fabricated by direct laser writing of polyimide tapes and functionalized with silver nanoparticles (Ag NPs) to obtain hybrid Ag NPs – LIG electrodes suitable for EC-SERS analysis. Detection was achieved by coupling a handheld potentiostat with a Raman spectrograph, enabling measurement of SERS spectra of target analytes generated during voltage sweeps in the 0.0 to −1.0 V interval range. The sensing capabilities of the fabricated system were first tested with model molecule 4-aminobenzenethiol (4-ABT). Following sensitive detection of 4-ABT, EC-SERS analysis of food contaminant melamine in milk and antibiotic difloxacin hydrochloride (DIF) in river water was demonstrated, achieving sensitive detection of both analytes without pre-treatment steps. The easiness of fabrication, versatility of design, rapid analysis time and potential miniaturization of the system make Ag NPs – LIG electrodes suitable for a large range of in situ applications in the field of food monitoring and for environmental analysis.
Introduction
In the last three decades, Surface Enhanced Raman Scattering (SERS) has been employed for the detection of a wide range of analytes for a plethora of applications, including environmental and health/wellbeing monitoring,1,2 agri-food,3 chemical and warfare detection,4 food safety,5 forensic analysis,6 art conservation7 and general point-of-care analysis.8 The versatility of SERS is due to its sensitive fingerprinting detection, based on the enhancement of Raman signals (up to a factor of 108–1012), generated by the close proximity of an analyte to plasmonic nanoparticles. This phenomenon has been investigated in depth and it has now been mainly attributed to the formation of large localized surface plasmons resulting in enhanced electromagnetic fields.9 Along with this electromagnetic (EM) enhancement, chemical enhancement processes (CE) also come into play, leading to the large observed enhancement factors.10 The combination of high sensitivity, fingerprinting capabilities and recent technological advances in instrumental miniaturization, gives SERS opportunities for fast analysis time, non-destructive and in situ analysis, with minimum pre-treatment steps.11,12In parallel, electrochemical analysis is also an attractive and versatile technique suitable for fast, low cost and in situ detection of a wide range of analytes.13,14 Recently, direct laser writing methods have been used to fabricate Laser Induced Graphene (LIG) electrodes for electrochemical sensing and biosensing.15–20 As well as versatility of design and low cost, LIG electrode materials displayed enhanced sensitivity compared to other carbon-based materials and screen printed electrodes, associated to their high surface area and high defect density.21,22 Furthermore, SERS platforms obtained by the combination of graphene-like materials and plasmonic nanoparticles have been shown to improve Raman enhancement effects through mechanical stability and reproducibility factors, leading to low concentration molecular detections.23–25
In this context, the combination of electrochemical and SERS techniques (EC-SERS) in a single platform is very attractive to widen the range of the capabilities of the individual techniques and to increase selectivity and sensitivity of analysis. In EC-SERS measurements the SERS spectra of selected analytes adsorbed on SERS-active electrodes are recorded while controlling the electrode polarization in an electrochemical cell.26 The changes occurring at the metal surface during the sweeping process can enhance the analyte's SERS response by promoting increased chemical enhancement contribution through electrode voltage induced variation of the metal's Fermi level or through analyte re-orientation induced by potential changes.27 Moreover, enhanced electrostatic interactions or desorption of interfering matrix species at negative potentials can also occur, leading to control of adsorption and redox states of the analytes and leading to improved performance compared to SERS analysis alone. Recently, EC-SERS has been successfully applied to the detection of herbicides,28 chemotherapy drugs,29 melamine,30 cannabinoids31 and seized drugs.32 Low cost and disposable commercial screen printed electrodes (SPEs) modified with Ag nanoparticles (Ag NPs) were used in combination with portable electrochemical and spectroscopic instrumentation, thus making the analysis amenable to point-of-need analysis. The same approach was also used by Eisnor et al. in the field of cultural heritage diagnostics for the identification of polyphenolic components in natural lake pigments.33 In a recent development, monitoring of biomarkers was achieved with EC-SERS fabric-based plasmonic sensors, suggesting that such platforms could become suitable also for patient point-of-care applications.34
In this work, novel LIG electrodes of different morphologies were readily fabricated by direct laser writing of polyimide tapes using low-cost hobbyist lasers. A concentrated solution of Ag NPs was dropped on the LIG surfaces to obtain hybrid Ag NPs – LIG electrodes suitable for EC-SERS analysis. The hybrid electrodes showed sensitive SERS responses for model molecule 4-ABT and target analytes melamine and difloxacin hydrochloride in milk and river water, respectively. EC-SERS measurements of target analytes in relevant matrices allowed sensitive detection without any need of pre-treatment steps. Taking in consideration the low cost of production, the versatility in electrode design geometry and the inherent flexibility of the developed sensing platforms, these electrodes could be implemented for many point-of-care and point-of need applications across multiple sectors from health to food and environmental monitoring.
Experimental section
Materials
Polyimide tape with thickness of 80 μm was purchased from Radionics and used without further treatment. Silver nitrate (AgNO3, ≥99.0%), sodium citrate (C6H5Na3O7·2H2O, ≥99.0%), 4-aminobenzenethiol (C6H7NS ≥97.0%), melamine (C3H6N6, 99%), difloxacin hydrochloride (C21H19F2N3O·3HCl, ≥98.0%), acetonitrile (C2H3N, ≥99.9%), acetone, isopropanol, ethanol, sodium fluoride (NaF, 99%), phosphate buffered saline (PBS, pH 7.4) were purchased from Sigma Aldrich and used without further purification. All solutions were prepared using deionized (DI) Milli-Q water (resistivity 18.2 MΩ cm).Electrode fabrication
LIG electrodes were fabricated using three different lasers: a Colemeter DK-8 Pro-5 Square Haste Edition equipped with a diode laser at 405 nm and 500 mW laser power, a KKmoon Compact Automatic Desktop Laser Engraving Machine equipped with a 3 W power laser with illumination wavelength of 450 nm; a 10.6 μm universal Laser System 4.75, 30 W maximum average power. Electrode structures were designed in Microsoft PowerPoint and transferred to the laser engraving software. Laser writing occurred by raster scanning of the laser beam on the polyimide substrates. The following conditions were used to write LIG structures: 405 nm laser, power 500 mW, dwelling time 40 ms; 450 nm laser, power 30% (0.9 W), contrast ratio 160%, depth of engraving 30%; 10.6 μm laser, power 12.5% (3.75 W), scan speed 12%. Conductive silver paint (Radionics) was used to electrically contact the electrodes to the potentiostat.Ag NPs synthesis
Ag NPs were synthesized following the classic Lee–Meisel method.35 Specifically, 45 mg AgNO3 was dissolved in 250 mL of H2O and added to a 1 L of H2O in a conical flask equipped with a reflux condenser. The mixture was brought to boiling by a heating mantle for 1 hour. Next, 5 mL of 1% citrate solution was added to the reaction solution. The solution was kept boiling under vigorous mechanical stirring for 1 hour and was then slowly cooled to room temperature. Next, 1000 μL of the prepared Ag NP solution was centrifuged for 10 min at 10![[thin space (1/6-em)]](https://www.rsc.org/images/entities/char_2009.gif) 000 rpm, the supernatant was removed and the solid residue re-dispersed into 25 μL of DI water.
000 rpm, the supernatant was removed and the solid residue re-dispersed into 25 μL of DI water.
Hybrid Ag NPs – LIG electrode fabrication
LIG electrodes were modified by dropping 50–120 μL of concentrated Ag NP solution on the LIG working electrodes. The hybrid electrodes were left to dry in air and washed with DI water prior use to remove unbound NPs.Characterisation
Morphological characterization was performed by a cold-cathode field-emission Scanning Electron Microscope (SEM, FEI Quanta 650) operating at 30 kV acceleration voltage. Surface wettability was measured by a Data physics OCA 20 Wetting angle system in air at ambient temperature by dropping distilled water droplets (1 mm diameter) on the surfaces. The average contact angle value was acquired by measuring at six different positions per sample. Raman investigation was performed with Horiba-XPlora Plus equipped with 532 nm (70 mW power) and 785 nm (60 mW power) lasers. Spectra were acquired at a laser power of 1% and 10 s acquisition time. Cyclic voltammetry (CV) electrochemical measurements were performed with a CHI760 bi-potentiostat.EC-SERS measurements
EC-SERS analysis was carried out by combining the SERS readout from the benchtop Raman spectrograph with the EC readout from a handheld mini potentiostat (Palmsens-Sensit Smart) connected either to a table -top computer or to a cell phone for data display. In order to perform EC-SERS measurements, a teflon custom made cell was designed and fabricated by 3D printing (see details in Fig. S1†). Before EC-SERS measurements analyte solutions were dropped on the work electrodes and left to dry. Then, chronoamperometric (CA) electrochemical measurements were performed by systematically decreasing the potential between 0 V and −1.0 V vs. Ag/AgCl in 100 mV steps. Simultaneously, SERS spectra were recorded at each potential step with 785 nm laser illumination and power between 0.25% and 25%.Results and discussion
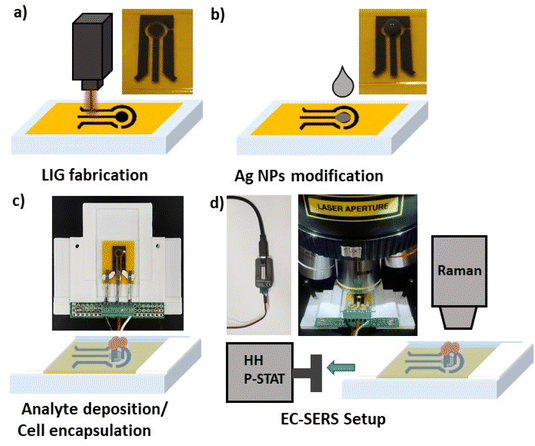
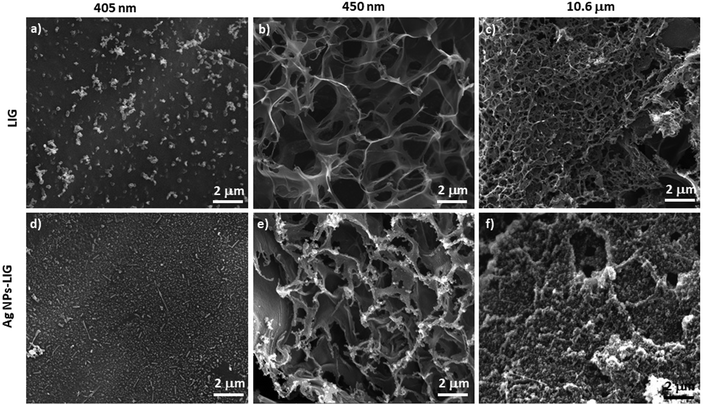
Scheme 1 shows a diagram of the EC-SERS electrode fabrication and the instrumental setup used to record spectra. Photographs of electrodes and instrumentation setup are also included. First LIG electrodes were fabricated by direct laser writing of polyimide with a range of hobbyist lasers with illumination wavelengths 10.6 μm, 450 nm and 405 nm (Scheme 1a). A three-electrode system was designed whereby LIG was used as working electrode (WE) and counter electrode (CE) and an Ag/AgCl modified LIG electrode was used as reference electrode. The surface of the LIG WE was then modified with Ag NPs (Scheme 1b). Following deposition of the analyte, the hybrid Ag NPs – LIG electrode was incorporated in a custom-built electrochemical cell in presence of an electrolyte (Scheme 1c). EC-SERS spectra were recorded with a bench top Raman system (785 nm excitation wavelength) coupled with a handheld potentiostat (Scheme 1d).Fig. 1 shows SEM images of LIG structures obtained by direct laser writing of polyimide using lasers of different wavelengths. LIG structures obtained with 405 nm laser (Fig. 1a) showed smooth surface with some particulate likely arising from the laser burning process. The dwell time of the 405 nm laser was kept low on purpose, in order to maintain the surface topography of the resulting LIG material smooth and flat, with the intention to promote homogeneous distribution of Ag NPs on the LIG electrode surface. Fig. 1b shows a representative SEM image of a LIG structure obtained by writing with 450 nm laser. In contrast with the smooth surface previously obtained at 405 nm, the features obtained at 450 nm displayed the typical 3D, highly porous and rich in defect/edge planes LIG structure, characterised by “exploded” features associated with outgassing generated by laser-assisted local high temperature, high pressure process.36 A similar morphology was observed in the LIG structures obtained by 10.6 μm laser writing (Fig. 1c), which displayed a high density of defects and high surface area, in agreement with the morphology already reported for other CO2 laser written features on polyimide.37
Fig. 1d–f show SEM images of LIG structures written with the three lasers following Ag NP deposition. For this electrode modification, a drop of concentrated Ag NP solution (average particle size 50 nm, Fig. S2†) was deposited on the LIG surface and left to evaporate at room temperature. The hybrid Ag NPs – LIG 405 nm structure displayed accumulation of NPs in the grooves formed by the laser writing process (see low magnification SEM image in Fig. S3a†), whereas the top LIG surface remained largely unmodified (Fig. 1d). In contrast, for LIG structures fabricated with 450 nm laser, Ag NPs preferentially attached to the top of the edge planes, whereas most of the plane walls remained virtually unmodified (Fig. 1e). The Ag NPs – LIG 10.6 μm structure showed the most uniform nanoparticle coverage, as evident from the SEM image showing uniform coverage of the LIG planes (Fig. 1f).
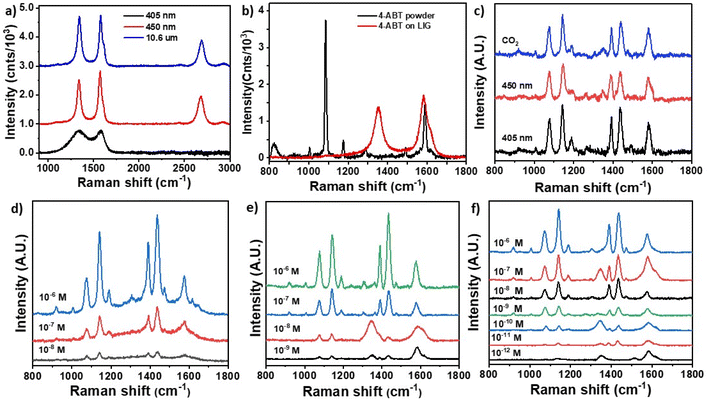
Fig. 2a shows the Raman spectra of LIG materials obtained with the three laser illuminations. The structure written at 405 nm (black line) only displayed two broad bands at 1343 and 1579 cm−1 corresponding the D and G vibrations typical of amorphous carbon materials.38 This corresponds with incomplete LIG formation, as evidenced by the smooth morphology of the carbonaceous material formed under the above writing conditions (see Fig. 1a). In contrast, LIG materials obtained with visible and CO2 illumination (Fig. 2a red and blue lines) displayed sharp and well-defined D (1342 cm−1), G (1572 cm−1) and 2D (2680 cm−1) bands, typical of crystalline graphene-like materials and very much in line with the characteristic bands obtained for other reported LIG materials on polyimide. The contact angle of the three LIG structures were 87°, 138° and 145°, respectively. Investigation of the SERS capabilities of fabricated hybrid Ag NPs – LIG structures was carried out using 4-ABT as model molecule. Fig. 2b reports Raman spectra of 4-ABT powder displaying sharp bands at 1006, 1084, 1174, 1492 and 1590 cm−1 (see Table S1† for band assignations), in agreement with literature data.39Fig. 2b also shows a spectrum of 4-ABT (1 × 10⁻⁶ M) deposited on a LIG-450 nm surface in absence of Ag NPs. The spectrum displayed only LIG peaks and absence of any SERS effect. Fig. 2c shows spectra of 4-ABT (1 × 10⁻⁶ M) obtained from Ag NPs – LIG structures written with the different lasers. All spectra displayed the typical SERS features of 4-ABT, characterized by 1075 (a1), 1146 (b2), 1188 (a1), 1388 (b2), 1436 (b2) and 1578 (b2) cm−1 peaks. The SERS bands at 1146 (b2), 1388 (b2), 1436 (b2) and 1578 (b2) cm−1 were assigned to the fundamental benzene ring vibrations.40 The concomitant shift of a1 peaks and the appearance of b2 in plane, out of phase vibrational modes peaks was ascribed to the interaction between the 4-ABT and the Ag NPs, resulting from a metal-molecule charge transfer and has been identified as clear proof of the occurrence of a chemical enhanced process related to SERS effect.39,40 The enhancement of b2 modes has also been reported to be indicative of a 4-ABT orientation perpendicular to the Ag NPs.41Fig. 2d–f report the SERS capabilities of the three Ag NPs – LIG substrates exposed to solutions of 4-ABT of decreasing concentrations. Using the Ag NPs – LIG 405 nm substrate concentrations as low as 1 × 10⁻⁸ M were detected, whereas 1 × 10⁻⁹ M and 1 × 10⁻¹² M were reached for Ag NPs – LIG 450 nm and Ag NPs – LIG 10.6 μm, respectively.
Even though Ag NPs – LIG 10.6 μm gave the strongest SERS effect with 4-ABT, EC-SERS characterization was carried out with Ag NPs – LIG 450 nm substrates, as they provided more reproducible SERS results.
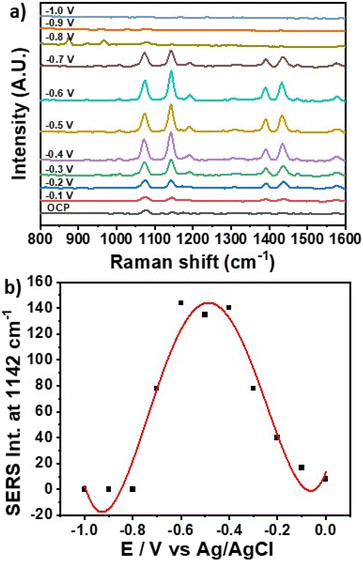
Fig. 3a shows the EC-SERS spectra measured for 4-ABT in the electrochemical cell in presence of 0.1 M NaF as supporting electrolyte. SERS spectra were recorded while stepping the potential in the cathodic direction (from 0.0 to −0.1 V) in 100 mV increments. An open circuit potential (OCP) spectrum was also measured, equivalent to the signal produced by the system in absence of applied potential. Under OCP conditions only the peaks at 1074 and 1141 cm−1 were visible. As the potential was stepped in the cathodic direction, significant changes were observed in the corresponding 4-ABT SERS spectra as the intensity of the b2 bands at 1141, 1391 and 1432 cm−1 gradually increased between −0.1 and −0.6 V, and decreased upon further potential decrease. The observed trend is in line with data reported by Robinson et al., and is ascribed to the transition from 4-aminobenzenethiol to p,p′-dimercaptoazobenzene (DMAB) by selective catalytic coupling reaction on the Ag NPs.30 The occurrence of this transition in the SERS spectra of 4-ABT has been investigated in details, and is supported here by the strong increase of all b2 vibrations (1142, 1391 and 1432 cm−1) associated with formation of –N![[double bond, length as m-dash]](https://www.rsc.org/images/entities/char_e001.gif) N– bonds. Fig. 3b shows the variation of peak intensity for the b2 vibration at 1141 cm−1 across the potential range analysed. The intensity of the band increased up to −0.6 V and then decreased signalling the re-conversion of DMAB to 4-ABT at negative potentials.
N– bonds. Fig. 3b shows the variation of peak intensity for the b2 vibration at 1141 cm−1 across the potential range analysed. The intensity of the band increased up to −0.6 V and then decreased signalling the re-conversion of DMAB to 4-ABT at negative potentials.
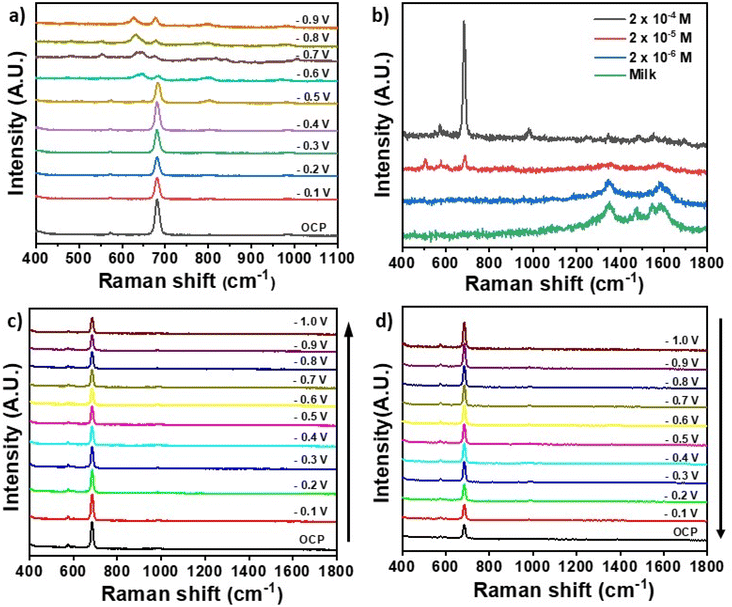
The EC-SERS response of hybrid LIG electrodes was further characterized with melamine, a product often added to food to boost its apparent nitrogen content. The Raman spectrum of melamine powder is shown in Fig. S5† and it was characterized by two main peaks at 675 and 985 cm−1, both associated to ring breathing modes of the triazine ring.42Fig. 4a shows the EC-SERS response of melamine (2 × 10⁻⁵ M) in PBS buffer as the electrode potential is stepped in the cathodic direction from −0.1 to −0.9 V. Starting from the OCP spectrum, the intensity of 680 cm−1 peak decreased and then increased to relative maximum value until the potential reached −0.4 V. As the voltage became increasingly negative, the intensity of the 680 cm−1 peak decreased and its maximum shifted to 677 cm−1, as already reported elsewhere.30Fig. 4b shows SERS spectra of melamine in milk (diluted 10 times) at different concentrations. Concentrations as low as 0.2 ppm of melamine in milk matrix were identified by the characteristic peak at 683 cm−1 by using Ag NPs – LIG 450 nm electrodes. This concentration is ten times lower than the maximum residue limit (MRL) of 2.5 ppm set by the standard of US Food and Drug Administration.43 It is worth noting that this low detection limit was reached even in the milk complex matrix and in absence of cumbersome extraction or pre-treatment processes. Fig. 4c and d shows cathodic and anodic voltage sequences for melamine (2 × 10⁻⁵ M) in milk recorded with Ag NPs – LIG 450 nm electrodes. At OCP a prominent band at 685 cm−1 was observed. This band decreased in intensity as the voltage became more negative. The opposite trend was observed in the anodic sequence (Fig. 4d) as the intensity of the 684 cm−1 band increased gradually with the stepping of the potential to more positive values. These data show how the combination of SERS and EC readout contributed to provide a clear signal for melamine even in a complex matrix such as milk with only a simple dilution of the matrix and the avoidance of cumbersome pre-analytical steps.
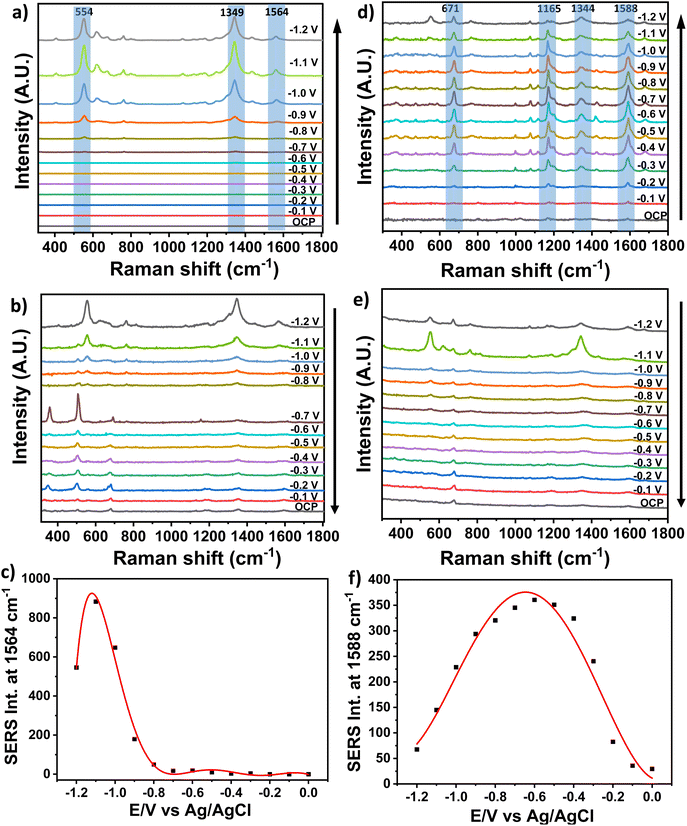
As further example of real analyte detection, difloxacin hydrochloride (DIF) was chosen as it is a broad spectrum, synthetic fluoroquinolone antibiotic widely used in veterinary medicine, particularly for the treatment of infected dermal wounds in dogs, for its bactericidal activity. DIF accumulates in tissues and therefore the recommended daily dose is 5–10 mg kg−1 and its use is not recommended for longer than 30 days.44 Raman and SERS spectra of DIF are shown in Fig. S6.†Fig. 5 show the EC-SERS cathodic (Fig. 5a and d) and anodic (Fig. 5b and e) sequences of DIF recorded with 785 nm laser excitation in 100 mV steps in DI water and river water. The cathodic series recorded in DI water (Fig. 5a) until −1.2 V showed featureless SERS spectra at OCP and until the potential reached −0.7 V. For increasingly negative applied potentials SERS spectra were generated which increased in intensity as the potential was stepped to increasingly negative values.
The SERS spectra displayed highest intensities at −1.2 V and decreased in intensity as the potential was swept back to 0 V in the anodic direction (Fig. 5b). Interestingly, the 1536 cm−1 peak increased in intensity, as well as the 554 and 1349 cm−1 bands. For a very structurally similar molecule, levofloxacin, it has been reported that the appearance of the 1588 cm−1 band (CO stretching mode of the carboxylate moiety νC![[double bond, length as m-dash]](https://www.rsc.org/images/entities/char_e001.gif) O) is consistent with a bidentate chelate coordination, allowing to suggest that the carboxylate could be the anchor site of DIF adsorption.45 The concomitant increase of the other bands, associated with stretching and bending of bonds close to the carboxylate moiety further confirmed this hypothesis.45 Finally, EC-SERS measurements of DIF were carried out in river water. For these studies DIF (10 μL, 1 × 10⁻³ M) was mixed with filtered river water (90 μL) containing 0.1 M NaF as electrolyte. As already reported for DI water, an increase of SERS bands (Fig. 5d) occurred as the potential of the cathodic series was swept to increasingly negative values. Particularly, peaks at 671, 1165, 1344 and 1588 cm−1 were enhanced, again suggesting a coordination to the metal sites through the carboxylic group. The enhanced peaks gradually disappeared in the anodic series (Fig. 5e) as the potential was swept back from −1.2 to 0 V. Fig. 5c, f show the change of SERS intensity of the 1564 cm−1 band and 1588 cm−1 with decreasing potential in DI and river water, respectively. In the case of DI water, the band increased as the potential decreased up to −1 V and then decreased at further negative potentials. For river water a similar trend was observed but at lower potentials. The association of the appearance of the 1588 cm−1 band with the occurrence of a carboxylate bidentate chelate coordination suggested a transition in coordination of the DIF molecule from mono- to bis-chelate as the potential was swept in the cathodic direction.
O) is consistent with a bidentate chelate coordination, allowing to suggest that the carboxylate could be the anchor site of DIF adsorption.45 The concomitant increase of the other bands, associated with stretching and bending of bonds close to the carboxylate moiety further confirmed this hypothesis.45 Finally, EC-SERS measurements of DIF were carried out in river water. For these studies DIF (10 μL, 1 × 10⁻³ M) was mixed with filtered river water (90 μL) containing 0.1 M NaF as electrolyte. As already reported for DI water, an increase of SERS bands (Fig. 5d) occurred as the potential of the cathodic series was swept to increasingly negative values. Particularly, peaks at 671, 1165, 1344 and 1588 cm−1 were enhanced, again suggesting a coordination to the metal sites through the carboxylic group. The enhanced peaks gradually disappeared in the anodic series (Fig. 5e) as the potential was swept back from −1.2 to 0 V. Fig. 5c, f show the change of SERS intensity of the 1564 cm−1 band and 1588 cm−1 with decreasing potential in DI and river water, respectively. In the case of DI water, the band increased as the potential decreased up to −1 V and then decreased at further negative potentials. For river water a similar trend was observed but at lower potentials. The association of the appearance of the 1588 cm−1 band with the occurrence of a carboxylate bidentate chelate coordination suggested a transition in coordination of the DIF molecule from mono- to bis-chelate as the potential was swept in the cathodic direction.
Conclusions
In this work a novel LIG-based electrode was proposed for the realization of versatile EC-SERS detection platforms. The merit of the combined EC-SERS methodology was demonstrated through sensitive detection of food contaminants and residual antibiotics in relevant matrices. Melamine and DIF were rapidly detected at concentrations lower than their relative MRL without the need to pre-treatment steps and with no interference from milk and water river matrices, respectively. EC-SERS approaches are characterized by low-cost instrumentation and rapid/selective signal acquisition. The development of flexible and versatile hybrid materials, such the proposed Ag NPs – LIG electrodes, contributes to extend the use of EC-SERS approaches to the monitoring of food quality/security/traceability and the monitoring of the environmental impact associated to farming and veterinary drugs.Author contributions
Yunyun Mu: formal analysis, investigation; Jahidul Islam: validation, formal analysis; Richard Murray: resources; Cathal Larrigy: investigation, resources; Alida Russo: resources; Xinping Zhang: funding acquisition; Aidan J. Quinn: writing, review editing; Daniela Iacopino: conceptualization; funding acquisition, writing original draft. The manuscript was written through contributions of all authors. All authors have given approval to the final version of the manuscript.Data availability statement
The data presented in this article are available from the author upon reasonable request.Conflicts of interest
There are no conflicts to declare.Acknowledgements
This publication has emanated from research conducted with the financial support of China Scholarship Council Grant number 202006540037, Science Foundation Ireland (SFI) under the Department of Agriculture, Food and Marine on behalf of the Government of Ireland under Grant Number 16/RC/3835 (VISTAMILK).References
- T. T. X. Ong, E. W. Blanch and O. A. H. Jones, Surface Enhanced Raman Spectroscopy in environmental analysis, monitoring and assessment, Sci. Total Environ., 2020, 720, 137601 CrossRef CAS.
- X.-S. Zheng, I. J. Jahn, K. Weber, D. Cialla-May and J. Popp, Label-free SERS in biological and biomedical applications: Recent progress, current challenges and opportunities, Spectrochim. Acta, Part A, 2018, 15(197), 56–77 CrossRef.
- C. Liu, D. Xu, X. Dong and Q. Huang, A review: Research progress of SERS-based sensors for agricultural applications, Trends Food Sci. Technol., 2022, 128, 90–101 CrossRef CAS.
- M. Lafuente, D. Sanz, M. Urbiztondo, J. Santamaría, M. P. Pina and R. Mallada, Gas phase detection of chemical warfare agents CWAs with portable Raman, J. Hazard. Mater., 2020, 121279 CrossRef CAS.
- J. Neng, Q. Zhang and P. Sun, Application of surface-enhanced Raman spectroscopy in fast detection of toxic and harmful substances in food, Biosens. Bioelectron., 2020, 167, 112480 CrossRef.
- M. A. Fikiet, S. R. Khadasammy, E. Mistek, Y. Ahmed, L. Halámková, J. Bueno and I. K. Lednev, Surface enhanced Raman spectroscopy: A review of recent applications in forensic science, Spectrochim. Acta, Part A, 2018, 197, 255–260 CrossRef CAS PubMed.
- D. Saviello, M. Trabace, A. Alyami, A. Mirabile, R. Giorgi, P. Baglioni and D. Iacopino, A combined Surface Enhanced Raman Spectroscopy (SERS)/UV-vis approach for the investigation of dye content in commercial felt tip pens inks, Talanta, 2018, 181, 448–453 CrossRef CAS PubMed.
- K. Xu, R. Zhou, K. Takei and M. Hong, Toward Flexible Surface-Enhanced Raman Scattering (SERS) Sensors for Point-of-Care Diagnostics, Adv. Sci., 2019, 6, 1900925–1900948 CrossRef PubMed.
- X. X. Han, R. S. Rodriguez, C. L. Haynes, Y. Ozaki and B. Zhao, Surface-enhanced Raman spectroscopy, Nat. Rev. Dis. Primers, 2021, 1, 87 CrossRef CAS.
- H. W. Wang, Y. Liu, G. R. Rao, Y. Wang, X. Du, A. Hu, Y. Hu, C. Gong, X. Wang and J. Xiong, Coupling enhancement mechanisms, materials, and strategies for surface-enhanced Raman scattering devices, Analyst, 2021, 146, 5008–5032 RSC.
- R. Pilot, R. Signorini, C. Durante, L. Orian, M. Bhamidipati and L. Fabris, A review on Surface-Enhanced Raman Scattering, Biosensors, 2019, 9, 57 CrossRef CAS.
- D. Langer, et al. Present and Future of Surface-Enhanced Raman Scattering, ACS Nano, 2020, 14, 28–117 CrossRef PubMed.
- H. Park, W. Park and C. H. Lee, Electrochemically active materials and wearable biosensors for the in situ analysis of body fluids for human healthcare, NPG Asia Mater., 2021, 13, 23 CrossRef CAS.
- M. Cuartero, Electrochemical sensors for in situ measurement of ions in seawater, Sens. Actuators, B, 2021, 334, 129635 CrossRef CAS.
- R. Ye, D. K. James and J. M. Tour, Laser-Induced Graphene, Acc. Chem. Res., 2018, 51(7), 1609–1620 CrossRef CAS PubMed.
- J. Lin, Z. Peng, Y. Liu, F. Ruiz-Zepeda, R. Ye, E. L. Samuel, M. J. Yacaman, B. I. Yakobson and J. M. Tour, Laser-induced porous graphene films from commercial polymers, Nat. Commun., 2014, 5, 5714 CrossRef CAS PubMed.
- X. Kong, P. Gai, L. Ge and F. Li, Laser-Scribed N-doped Graphene for Integrated Flexible Enzymatic Biofuel Cells, ACS Sustainable Chem. Eng., 2020, 8, 12437–12442 CrossRef CAS.
- L. Ge, Q. Hong, C. Liu and F. Li, Direct-Laser-Writing of Metal Sulfide-Graphene Nanocomposite Photoelectrode toward Sensitive Photoelectrochemical Sensing, Adv. Funct. Mater., 2019, 29, 1904000 CrossRef.
- L. Ge, Q. Hong, H. Li and F. Li, A laser-induced TiO2-decorated graphene photoelectrode for sensitive photoelectrochemical biosensing, Chem. Commun., 2019, 55, 4945 RSC.
- X. Liu, H. Cheng, Y. Zhao, Y. Wang and F. Li, Portable electrochemical biosensor based on laser-induced graphene and MnO2 switch-bridged DNA signal amplification for sensitive detection of pesticide, Biosens. Bioelectron., 2022, 19, 113906 CrossRef PubMed.
- E. Vaughan, C. Larrigy, M. Burke, L. Sygellou, A. J. Quinn, C. Galiotis and D. Iacopino, Visible Laser Scribing Fabrication of Porous Graphitic Carbon Electrodes: Morphologies, Electrochemical Properties, and Applications as Disposable Sensor Platforms, ACS Appl. Electron. Mater., 2020, 2(10), 3279–3288 CrossRef CAS.
- P. Nayak, N. Kurra, C. Xia and H. N. Alshareef, Highly, Efficient Laser Scribed Graphene Electrodes for On-Chip Electrochemical Sensing Applications, Adv. Electrode Mater., 2016, 2(10), 1600185 CrossRef.
- Y. Han, Y. Han, Q. He, H. Liu, Y. Zhang and L. Han, Ultrasensitive and reliable SERS chip based on facile assembly of Ag NPs on porous LIG to enhance the local electromagnetic field, J. Phys. Chem. C, 2023, 127, 4195–4202 CrossRef CAS.
- H. K. Lee, Y. H. Lee and C. S. L. Koh, et al. Designing surface-enhanced Raman scattering (SERS) platforms beyond hotspot engineering: emerging opportunities in analyte manipulations and hybrid materials, Chem. Soc. Rev., 2019, 48, 731–756 RSC.
- Y. Han, Y. Han, J. Sun, H. Liu, X. Luo, Y. Zhang and L. Han, Controllable nanoparticle aggregation through a superhydrophobic laser-Induced graphene dynamic system for surface-enhanced Raman scattering detection, ACS Appl. Mater. Interfaces, 2022, 14, 3504–3514 CrossRef CAS PubMed.
- A. V. Markin, A. I. Arzhanukhina, N. I. Markina and I. Y. Goryacheva, Analytical performance of electrochemical surface-enhanced Raman spectroscopy: A critical review, Treatise Anal. Chem., 2022, 157, 116776 CrossRef CAS.
- R. Moldovan, E. Vereshchagina, K. Milenko, B. C. Iacob, A. E. Bodoki, A. Falamas, N. Tosa, C. M. Muntean, C. Farcău and E. Bodoki, Review on combining surface-enhanced Raman spectroscopy and electrochemistry for analytical applications, Anal. Chim. Acta, 2022, 1209, 339250 CrossRef CAS PubMed.
- N. Albarghouthi, M. M. Eisnor, C. C. Pye and C. L. Brousseau, Electrochemical Surface Enhanced Raman Spectroscopy (EC-SERS) and computational study of atrazine: toward point-of-need detection of prevalent herbicides, J. Phys. Chem. C, 2022, 126, 9836–9842 CrossRef CAS.
- B. H. C. Greene, D. S. Alhatab, C. C. Pye and C. L. Brousseau, Electrochemical Surface Enhanced Raman Spectroscopy (EC-SERS) study of 6-Thiouric acid: a metabolite of chemotherapy drug azathioprine, J. Phys. Chem. C, 2017, 121, 8084–8090 CrossRef CAS.
- A. M. Robinson, S. G. Harroun, J. Bergman and C. L. Brosseau, Portable Electrochemical Surface-Enhanced Raman Spectroscopy System for Routine Spectroelectrochemical Analysis, Anal. Chem., 2012, 84, 1760–1764 CrossRef CAS PubMed.
- S. D. Bindesri, R. Jebailey, N. Albarghouthi, C. C. Pye and C. L. Brousseau, Spectroelectrochemical and computational; studies of tetrahydrocannabinol (THC) and carboxy-tetrahydrocannabinol (THC-COOH), Analyst, 2020, 145, 1849–1857 RSC.
- C. E. Ott, A. Burns, E. Sisco and L. E. Arroyo, Targeted fentanyl screening utilizing electrochemical surface-enhanced Raman spectroscopy (EC-SERS) applied to authentic seized drug casework samples, Forensic Chem., 2023, 34, 100492 CrossRef CAS.
- M. M. Eisnor, K. E. R. McLeod, S. Bindesri, S. A. Svoboda, K. L. Wustholzc and C. L. Brosseau, Electrochemical surface-enhanced Raman spectroscopy (EC-SERS): a tool for the identification of polyphenolic components in natural lake pigments, Phys. Chem. Chem. Phys., 2022, 24, 347 RSC.
- S. Bindesri, D. S. Alhatab and C. L. Brosseau, Development of an electrochemical surface-enhanced Raman spectroscopy (EC-SERS) fabrics-based plasmonic sensor for point-of-care diagnostics, Analyst, 2018, 143, 4128–4135 RSC.
- C. Lee and D. Meisel, Adsorption and surface-enhanced Raman of dyes on silver and gold sols, J. Phys. Chem., 1982, 86, 3391–3395 CrossRef.
- M. Burke, C. Larrigy, E. Vaughan, G. Paterakis, L. Sygellou, A. J. Quinn, G. Herzog, C. Galiotis and D. Iacopino, Fabrication and Electrochemical Properties of Three-Dimensional (3D) Porous Graphitic and Graphene-like Electrodes Obtained by Low-Cost Direct Laser Writing Methods, ACS Omega, 2020, 5(3), 1540–1548 CrossRef CAS PubMed.
- R. Murray, M. Burke, D. Iacopino and A. J. Quinn, Design of Experiments and Optimization of Laser-Induced Graphene, ACS Omega, 2021, 6(26), 16736–16743 CrossRef CAS PubMed.
- L. Zheling, L. Deng, I. A. Kinloch and R. J. Young, Raman spectroscopy of carbon materials and their composites, Prog. Mater. Sci., 2023, 135, 101089 CrossRef.
- K. Kim, H. B. L. Lee, D. Shin, H. Ryoo, J. W. Lee and K. S. Shin, Surface-enhanced Raman scattering of 4-aminobenzenethiol on silver: confirmation of the origin of b2-type bands, J. Raman Spectrosc., 2011, 42, 2112–2118 CrossRef CAS.
- M. Osawa, N. Matsuda, K. Yoshii and I. Uchida, Charge transfer resonance Raman process in surface-enhanced Raman scattering from p-aminothiophenol adsorbed on silver: Herzberg-Teller contribution, J. Phys. Chem., 1994, 89, 12702–12707 CrossRef.
- Y. Wang, S. Guo, H. Chen and E. Wang, Facile fabrication of large area of aggregated gold nanorods film for efficient surface-enhanced Raman scattering, J. Colloid Interface Sci., 2008, 318, 82–87 CrossRef CAS PubMed.
- N. E. Mircescu, M. Oltean, V. Chis and V. Leopold, FTIR, FT-Raman, SERS and DFT study on melamine, Vib. Spectrosc., 2012, 62, 165–171 CrossRef CAS.
- A. Filazi, U. T. Sireli, H. Ekici, Y. H. Can and A. Karagoz, Determination of melamine in milk and dairy products by high performance liquid chromatography, J. Dairy Sci., 2012, 95, 602–608 CrossRef CAS PubMed.
- Center for Veterinary Medicine. “FOIA Drug Summaries – NADA 141-096 Dicural® Tablets – original approval”. www.fda.gov. Retrieved 2015-11-30.
- A. L. Filgueiras, D. Paschoal, H. F. Dos Santos and A. C. Sant'Ana, Adsorption study on solver nanoparticle surfaces by surface-enhanced Raman scattering spectroscopy, Spectrochim. Acta, Part A, 2015, 136, 979–985 CrossRef CAS PubMed.
Footnotes |
| † Electronic supplementary information (ESI) available: Details of custom made EC-SERS cell; characterization of Ag NPs; SEM imaging of Ag NPs – LIG electrodes; 4-ABT Raman/SERS peak assignment; 4-ABT SERS; melamine Raman and SERS; DIF Raman and SERS. See DOI: https://doi.org/10.1039/d3an00731f |
| ‡ These two authors contributed equally. |
| This journal is © The Royal Society of Chemistry 2023 |

