DOI:
10.1039/D3AN00164D
(Paper)
Analyst, 2023,
148, 2793-2800
Vibrational and chiroptical analysis of blood plasma for hepatocellular carcinoma diagnostics†
Received
31st January 2023
, Accepted 15th May 2023
First published on 16th May 2023
Abstract
More than one fifth of the world's population suffers from liver cirrhosis or other chronic liver diseases. Unfortunately, some of them will inevitably develop hepatocellular carcinoma (HCC), due to the vast majority of HCC cases arising against the background of liver cirrhosis. Despite this clearly identified high-risk group, the lack of early diagnostic options causes HCC mortality to approach its incidence. As opposed to many types of cancer, the incidence of HCC is expected to grow in the coming decades, which makes the search for an effective early diagnostic option a pressing necessity. This study presents evidence that blood plasma analysis employing a combination of chiroptical and vibrational spectroscopic methods might be the key to the improvement of the current status. One hundred samples of patients with HCC and controls with cirrhosis were classified using principal component analysis together with a random forest algorithm. Differentiation of the specific spectral patterns of the studied groups was successful in more than 80%, indicating the prospect of including spectroscopy in the screening of high-risk groups, such as patients with cirrhosis.
Introduction
The liver is an organ essential for a broad spectrum of bodily processes, such as digestion, metabolism, and detoxification of xenobiotics. Like many other organs, liver health is influenced heavily by lifestyle. In the long term, frequent alcohol and tobacco consumption, obesity, or a risky way of life (e.g., exposure to hepatitis C or B viral infection) make the body prone to the progressive outbreak of several liver diseases, which might lead to fibrotic scarring and ultimately to irreversible liver damage called cirrhosis. The global prevalence of cirrhosis, along with other chronic liver diseases, has remained high for a long time (1.7 billion cases in 2019) and is not expected to change in the near future, but quite the opposite.1 A dangerous aspect of cirrhosis is that it is usually symptomless until the later stages. The majority of cases are first detected during routine blood tests manifesting as elevated levels of liver enzymes, bilirubin, or other indicators, such as hepatitis infection. However, the proper diagnosis and follow-ups of patients with cirrhosis are crucial, as they are at high risk of developing liver cancer, the most common type of which is hepatocellular carcinoma (HCC). Up to 80–90% of HCC cases develop against the background of cirrhosis, yet, unfortunately, even a well-recognized risk group is not a win on its own.2,3 As in many other cancers, the absence of reliable early-stage diagnostics of HCC is the major issue. The high-risk individuals can usually rely only on repeated ultrasound examination, which exhibits nowhere near sufficient sensitivity (∼60% for early stages); additionally, in the continuously enlarging subgroup of obese patients, the sensitivity of ultrasound is barely 20%.4,5 Moreover, the examination is highly dependent on the expertise of the clinical specialist. Other imaging methods, such as computed tomography or magnetic resonance imaging, are usually used only to confirm the diagnosis and monitor the effectiveness of the treatment. Other possible diagnostic tools for HCC are biochemical tests assessing the blood levels of liver enzymes and α-fetoprotein (AFP), the only generally accepted blood-based biomarker of HCC. However, the sensitivity of AFP is also insufficient (approximately 60%, depending on the threshold value), and American and European Associations for the Study of the Liver do not routinely recommend AFP as the screening biomarker for HCC.6–8 In summary, none of the current diagnostic options is adequate for the early diagnostics or screening of HCC; thus, alternative approaches are still being investigated. A lot of attention is paid to the search for novel blood-based biomarkers of HCC. Blood collection is a standard part of routine check-ups and, therefore, represents a very convenient tool for screening. In addition, blood is highly susceptible to showing cancer-derived changes in molecular composition and structure due to its direct contact with the tumour, making it an ideal material for cancer diagnostics. The methods of vibrational and chiroptical spectroscopy are excellent candidates for searching for the aforementioned changes. In particular, they offer the possibility of rapid and non-destructive analysis of small-volume samples without the need for extensive sample preparation, which makes them suitable for use in a routine clinical setting. The collected spectra contain complex information about the molecules present within the sample – their chemical structure and relative abundance, both of which may be altered by the presence of HCC. Additionally, the methods of chiroptical spectroscopy are – thanks to the utilization of circularly polarized light – inherently sensitive to the spatial structure of molecules, which is essential for their biological function. Electronic circular dichroism (ECD) measures the difference in absorbance of right- and left-circularly polarized light. The spectra reflect π–π* and n–π* electronic transitions in the far-ultraviolet region.9 Therefore, ECD is not as sensitive to the variety of disease-induced changes in biomolecules as vibrational spectroscopic methods but is essential for the estimation of their secondary structure. It is known that some diseases may be accompanied by changes in protein conformations, some of which might represent potential disease-specific biomarkers.10,11 Raman optical activity (ROA) provides more comprehensive information about the sample as the spectra show the difference in intensity of Raman scattered left- and right-circularly polarized light and reflect fundamental molecular vibrational transitions of chiral components in the sample.12 Both Raman spectroscopy and ROA are well-suited for the analysis of biological samples. Thanks to the low intensity of water signals, the analysis in an aqueous environment, such as biofluids, is trouble-free.13 On the other hand, a significant limitation in the analysis of biological samples using Raman spectroscopy, and by extension ROA, is the high natural fluorescence of such samples, which might make the analysis impossible.14 When using Fourier-transform infrared (FTIR) spectroscopy, the fluorescence is absent; however, the signals of the relevant biomolecules may be overlapped by the intensive vibrational bands of water. To eliminate the water interference, it is possible to analyse the samples in dried form, either in transmission or reflection mode;13 however, it might negatively affect their native state. Another option is the subsequent subtraction of the water spectrum, which might, however, introduce additional artefacts into the data, if not performed correctly. The diagnostic power of Raman and FTIR spectroscopy has been studied many times and shown promising results.15–19 Herein, we demonstrate the potential of their combination with structure-sensitive chiroptical methods, which may bring new insights into HCC-induced alterations of biomolecules and thereby allow for the differentiation between patients with liver cirrhosis and those who have already developed HCC.
Experimental
Subjects
The enrolment of subjects was performed at the Department of Medicine 1st Faculty of Medicine Charles University and the Military University Hospital Prague. The patient diagnoses were established according to international guidelines using imaging methods and/or histology.7,8,20,21
In total, 40 patients with HCC against the background of liver cirrhosis and 60 patients with liver cirrhosis were included in our study. The summarised general information about the subjects is listed in Table 1. The imbalance of sex in the HCC sample group is due to the long-term low number of female HCC cases at the collaborating clinic, which is in line with the global trend.1,22 Baseline biochemistry and AFP levels were examined along with the plasma sample collection.
Table 1 Summary of information about age and sex of the studied groups
| |
HCC |
Cirrhosis |
| Number of samples |
40 |
60 |
| Age (years ± SD) |
66.7 ± 9.6 |
63.0 ± 9.5 |
| Male (%) |
82.5 |
58.3 |
| Female (%) |
17.5 |
41.7 |
The study was approved by the Ethics Committee at the Military University Hospital Prague. Sample collection, handling, and analyses were conducted in accordance with the Helsinki Declaration and the Collection of Laws of the Czech Republic. All subjects provided signed informed consent.
Blood plasma sample collection
The blood was collected into tubes containing K3EDTA as an anticoagulant agent and centrifuged at 1500g for 10 minutes at 25 °C. The prepared plasma samples were frozen immediately, transported, and stored at −80 °C. Before the analyses, the samples were thawed at room temperature and subsequently filtered using spin columns with a polyvinylidene difluoride membrane with 0.45 μm pores (Ciro, USA) for the removal of possible residual blood cells and other foreign particles. The filtration was performed at 10![[thin space (1/6-em)]](https://www.rsc.org/images/entities/char_2009.gif) 000g for 10 minutes at 10 °C.
000g for 10 minutes at 10 °C.
Fourier-transform infrared spectroscopy
The infrared spectra were acquired on the Nicolet 6700 FT-IR spectrometer (Thermo Fisher Scientific, USA) using a ZnSe crystal as an ATR sampling accessory. The spectra were collected in the region of 4000–650 cm−1 as an average of 512 scans with a resolution of 4 cm−1. The spectra pre-processing consisted of the subtraction of water and water vapour spectra acquired under the same conditions. Additionally, extended multiplicative scatter correction in the region of 1800–1070 cm−1 was performed in The Unscrambler X software, version 10.5.1 (CAMO, NOR).
Electronic circular dichroism
The analyses were done on the J-815 spectrometer (Jasco, JPN) at 23 °C, controlled by a Peltier cell holder. Prior to the analysis, the samples were diluted with sterile phosphate-buffered saline (pH = 7.4) in the ratio of 1/3 (vol/vol) in order to obtain signals in the lower wavelength region. Twenty microliters of the diluted sample were placed into a 0.01 mm quartz cuvette (Hellma, DEU) and analysed in the 280–185 nm region. Six accumulations with a data pitch of 0.1 nm and scanning speed of 50 nm·min−1 were collected and averaged.
Raman spectroscopy and Raman optical activity
The ChiralRAMAN-2X (BioTools Inc., USA) spectrometer was utilized for both ROA and Raman spectra acquisition. The system is equipped with an Opus 532 laser with an excitation wavelength of 532 nm, powered by an mpc6000 control unit (Laser Quantum, GBR). Due to the natural fluorescence of blood plasma samples, we have previously developed a methodology to suppress undesirable fluorescence background to obtain ROA spectra with a reasonable signal-to-noise ratio.23 Thus, a fluorescence quencher (NaI) was added to the plasma sample in a ratio of 10 mg of NaI per 100 μl of plasma. One hundred microliters of the sample were placed into a 4 × 4 × 10 mm quartz cuvette (BioTools Inc., USA) and photobleached for 12 hours at 280 mW laser power on a sample (measured with an external laser power meter PD300-TP, Ophir Optronics Solutions Ltd, ISR). That followed a spectral acquisition in the 200–2450 cm−1 region with a resolution of ∼7 cm−1 and constant 150 mW laser power on the sample. Repeated accumulations with an illumination period of 0.3–1.5 s (regarding the limits of the CCD detector due to the different content of fluorescence-emitting molecules in the samples) were collected for a total acquisition time of 24 hours. The combination of NaI addition and photobleaching, as well as the acquisition time, come from our pilot study focusing on the optimization of parameters for blood plasma analysis using ROA.23 Individual scans of Raman and ROA were merged and subjected to cosmic rays removal using non-commercial software (by Josef Kapitán, Palacký University Olomouc, CZE). The Raman baseline was corrected using the BubbleFill algorithm.24 Another pre-processing of Raman spectra was not necessary, thanks to the long acquisition time. The baseline of the ROA spectra was corrected using a fast Fourier transform (FFT) filtering – the blood plasma spectrum was highly smoothed using FFT filtering with a cut-off noise period of 750 cm−1 and subtracted from the original spectrum to remove the baseline distortion. Despite the 24-hour acquisition, the ROA spectra showed a high level of noise that required its removal prior to the statistical analyses. Therefore, the spectrum was further smoothed using FFT filtering with a period of 22 cm−1 to remove excess noise. The resulting spectra were unit vector normalised for statistical purposes in the final regions of 580–1715 cm−1 for Raman and 810–1715 cm−1 for ROA.
Statistical analyses
All statistical analyses were conducted in RStudio, version 2022.07.2, using the caret package (version 6.0-93). To reduce the high computational time of classification while using whole spectra, mean-centred data from individual methods were subjected to a dimensionality reduction method, namely principal component analysis (PCA). The classification was performed using principal component (PC) scores and a random forest algorithm with a down-sampling condition and optimisation step for algorithm parameters (mtry and ntree). The model was validated by a 10-fold cross-validation with 100 repetitions.
Results and discussion
Infrared spectroscopy
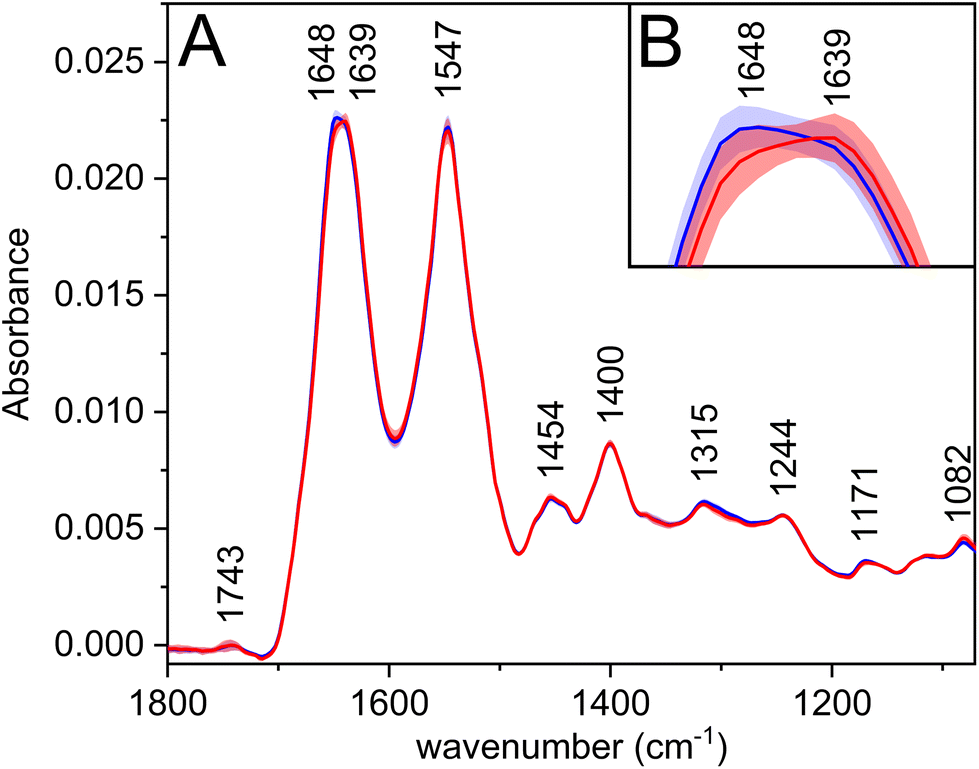
The most prominent bands in the average infrared spectra (Fig. 1A, Table 2) are amide I and amide II. Amide bands originate from the vibrations of peptide bonds; the former is associated mainly with the C![[double bond, length as m-dash]](https://www.rsc.org/images/entities/char_e001.gif) O stretching vibration, the latter with the N–H bending in combination with C–N stretching vibrations (to a greater extent than amide I).25 The amide regions comprise several overlapping bands with characteristic positions according to the secondary structures of proteins, which may be reflected by the appearance of more or less pronounced shoulders on the resulting convoluted band. Therefore, the observed shift of amide I maximum (Fig. 1B) to a lower wavenumber for carcinoma might be associated with the changes in the secondary structure of proteins, e.g. partial transitions of helical to unordered or beta-sheet structures.25 This theory is further supported by the PCA loadings (Fig. S1†), in which the shoulders of the amide I band are visible; thus, revealing the structure-related changes in proteins happening during the disease progression.
O stretching vibration, the latter with the N–H bending in combination with C–N stretching vibrations (to a greater extent than amide I).25 The amide regions comprise several overlapping bands with characteristic positions according to the secondary structures of proteins, which may be reflected by the appearance of more or less pronounced shoulders on the resulting convoluted band. Therefore, the observed shift of amide I maximum (Fig. 1B) to a lower wavenumber for carcinoma might be associated with the changes in the secondary structure of proteins, e.g. partial transitions of helical to unordered or beta-sheet structures.25 This theory is further supported by the PCA loadings (Fig. S1†), in which the shoulders of the amide I band are visible; thus, revealing the structure-related changes in proteins happening during the disease progression.
 |
| | Fig. 1 (A) Average infrared spectra and standard deviation (coloured areas) of blood plasma samples of patients with HCC (red) and controls with cirrhosis (blue); (B) detailed visualization of the amide I region. | |
Table 2 Position and assignment of the bands in the infrared spectra of blood plasma
| Wavenumber (cm−1) |
Assignment26,27 |
| 1743 |
ν(CO): lipids |
| 1648 |
Amide I |
| 1639 |
Amide I |
| 1547 |
Amide II |
| 1454 |
δ(CH3): proteins/side chains |
| 1400 |
δ(CH3): proteins/side chains |
| 1315 |
Amide III |
| 1244 |
Amide III; νas(PO2−) |
| 1171 |
ν
as(C–O): esters |
| 1082 |
ν
s(C–O); νs(PO2−) |
Electronic circular dichroism
The average ECD spectra (Fig. 2, Table 3) show three bands with a spectral pattern typical to α-helical proteins, such as human serum albumin, the most abundant protein in blood plasma. The intensity of all these three bands is reduced in the spectra of patients with HCC. Since proteins represent a significant part of blood plasma and ECD is sensitive to their secondary structure, the observed differences might contain information about the disease-related changes. The PCA loadings (Fig. S3†) confirm the previous expectations. The PC1 loading curve primarily reflects overall intensity changes between spectra, and its pattern corresponds to the α-helical protein content of plasma samples. Interestingly, the loading curves of PC2 and PC3 are similar to the ECD spectra of β-sheet and polyproline II (random coil) secondary structures of proteins,28 respectively, which confirms that the ECD spectra capture changes in the relative abundance of individual structural motifs between samples.
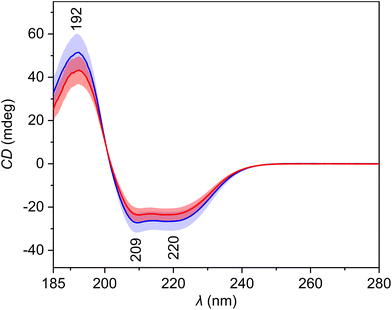 |
| | Fig. 2 Average electronic circular dichroism spectra and standard deviation (coloured areas) of blood plasma samples of patients with HCC (red) and controls with cirrhosis (blue). | |
Table 3 Position and assignment of the bands in the electronic circular dichroism spectra of blood plasma
| Wavelength (nm) |
Assignment29 |
| 192 |
π–π* transitions of the peptide bond in proteins |
| 209 |
π–π* transitions of the peptide bond in proteins |
| 220 |
n–π* transitions of the peptide bond in proteins |
Raman spectroscopy
Utilization of a 532 nm excitation wavelength caused resonant enhancement of the signals of carotenoid molecules, which dominates the average Raman spectra (Fig. 3, Table 4) with bands at 1006, 1158, and 1521 cm−1. For these bands, the largest intensity differences between the spectra of HCC and cirrhosis were observed. Carotenoid molecules act as antioxidants, and their cancer-protective effects, as well as cancer-related blood level changes, were studied thoroughly.30–33 The conclusions are not consistent; nevertheless, carotenoids might be linked with a decreased risk of cancer development as they may reduce tumour growth and increase apoptosis. However, the observed decrease in the spectral intensity of carotenoid bands does not seem specific for HCC, as a similar trend was observed in the blood plasma spectra of patients with other diseases.34,35 Moreover, carotenoid plasmatic levels are diet dependent. Thus, to make the diagnostic model more HCC-specific, these bands were excluded from the subsequent statistical processing. Additionally, due to the high intensity and broad bases of the carotenoid bands, other possibly relevant bands might be overlapped, and adjacent surroundings might be deformed. For this reason, the band at 1450 cm−1 was also not taken into account while creating the statistical model, as it was elevated by the base of the neighbouring carotenoid band in some spectra.
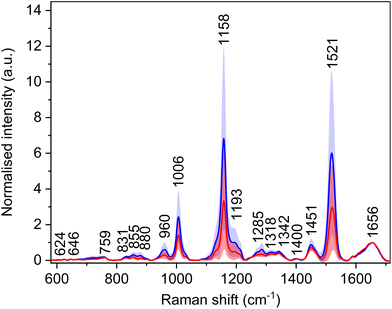 |
| | Fig. 3 Average Raman spectra and standard deviation (coloured areas) of blood plasma samples of patients with HCC (red) and controls with cirrhosis (blue); normalised on amide I band (1656 cm−1). | |
Table 4 Position and assignment of the bands in the Raman spectra of blood plasma
| Raman shift (cm−1) |
Assignment26,36 |
| 624 |
τ(CC): Phe |
| 646 |
τ(CC): Tyr |
| 703 |
ν(CS): Met |
| 720 |
ν(CS): Met |
| 759 |
δ(CH)ring: Trp |
| 831 |
δ(CH)ring: Tyr |
| 855 |
δ(CH)ring: Tyr |
| 880 |
ν(CN), ν(CC): proteins, lipids; Trp, Arg |
| 960 |
ν(CC), ν(CN), δ(CH2) |
| 1006 |
ρ
r(CH3): carotenoids |
| 1158 |
ν(CC): carotenoids |
| 1193 |
δ(CH), τ(CH2) |
| 1272 |
δ(NH), ν(CN): amide III in proteins |
| 1285 |
δ(NH), ν(CN): amide III in proteins |
| 1318 |
δ(NH), ν(CN), δ(CH): extended amide III in proteins |
| 1342 |
τ(CH2), δ(CH): proteins, carbohydrates |
| 1400 |
ν
s(COO−): Asp, Glu |
| 1451 |
δ
as(CH3), δ(CH2) |
| 1521 |
ν(CC): carotenoids |
| 1656 |
Amide I, α-helix |
Raman optical activity
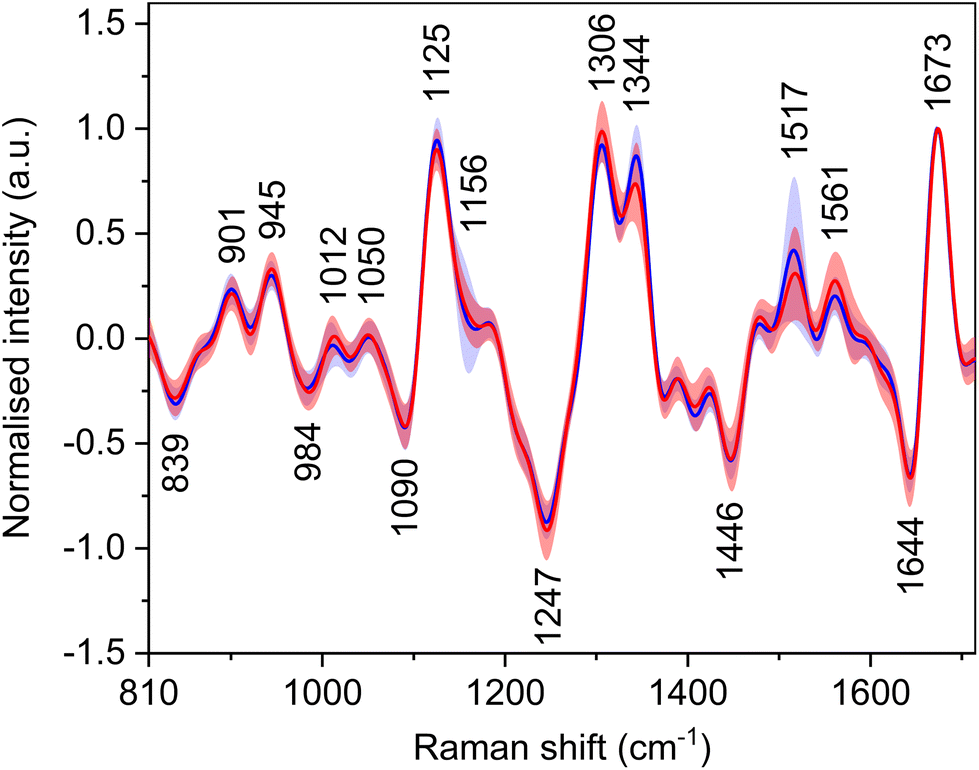
Carotenoid molecules, although not inherently chiral, have signals in the ROA spectra (Fig. 4, Table 5) with bands at ∼1012, 1156, and 1517 cm−1. The reason for the signals of achiral carotenoids might be the fact that they are transported in the body by lipoproteins, which are chiral. By binding to them, induced ROA signals occur.37 The bands at 1012 and 1156 cm−1 have only low intensity, and their group means are around the baseline. The band at 1517 cm−1 shows an intensity decrease for HCC patients similarly to the Raman spectra. Nevertheless, for the same reason as in the Raman spectra, the spectral regions of carotenoid bands were not included in the statistical analyses. Other, primarily intensity differences, were found e.g. in the amide III region, which originates from in-phase combination of N–H in-plane bending and C–N stretching vibrations and in the extended form of this region also C–H bending.38
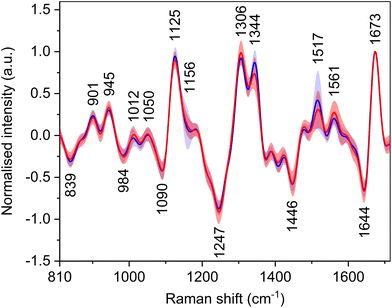 |
| | Fig. 4 Average Raman optical activity spectra and standard deviation (coloured areas) of blood plasma samples of patients with HCC (red) and controls with cirrhosis (blue); normalised on positive amide I band (1673 cm−1). | |
Table 5 Position and assignment of the bands in the Raman optical activity spectra of blood plasma
| Raman shift (cm−1) |
Assignment36,38–40 |
| 839 |
δ(CH)ring: Tyr |
| 901 |
ν(CC), ν(CN) |
| 945 |
ν(CC), ν(CN) |
| 984 |
Peptide backbone deformation |
| 1012 |
ρ
r(CH3): carotenoids |
| 1050 |
ν(CC), ν(CN) |
| 1090 |
ν(CC), ν(CN), δ(CH) |
| 1125 |
ν(CC), ν(CN): proteins, α-helix |
| 1156 |
ν(CC): carotenoids |
| 1247 |
δ(NH), ν(CN): amide III in proteins, unhydrated β-sheet |
| 1306 |
δ(NH), ν(CN): amide III in proteins, α-helix |
| 1344 |
τ(CH2), δ(CH): proteins, unhydrated α-helix |
| 1446 |
δ
as(CH3), δ(CH2) |
| 1517 |
ν(CC): carotenoids |
| 1561 |
Trp (indole ring) |
| 1644 |
ν(CO): amide I in proteins, β-sheet, unordered |
| 1673 |
ν(CO): amide I in proteins, β-sheet, unordered |
Sample discrimination
The selection of PCs for the classification of samples was established according to the PCA loadings and the explained spectral variability. For FTIR, the first six PCs (Fig. S1 and S2†) explained more than 91% of the total spectral variability. The PC4 was omitted from the classification, as the loading curve was essentially a water vapour spectrum; thus, it did not contain any information relevant to the sample classification. The remaining five PCs were used in the final model. In the case of ECD, the first two PCs already explained more than 95% of the variability in the acquired spectra (Fig. S3 and S4†); nevertheless, the similarity of PC3 to the polyproline II pattern made us include it in the classification model. For the Raman spectra, the first six PCs (Fig. S5 and S6†) explained more than 95% of the spectral variability, and these were utilised for the classification model. The ROA spectra were noisy despite the smoothing; therefore, PCA was unable to explain a high percentage of variance. Only the first four PCs (Fig. S7 and S8†), which explained more than 50% of the spectral variance, were used for the classification.
The diagnostic ability of each spectroscopic method and their respective combinations was evaluated using the selected PCs and random forest algorithm (Table 6).
Table 6 Performance characteristics of the classification models
| Data |
AUC-ROC |
Accuracy |
Sensitivity |
Specificity |
| ECD |
0.77 |
0.707 |
0.709 |
0.706 |
| Raman |
0.75 |
0.729 |
0.706 |
0.744 |
| ROA |
0.80 |
0.733 |
0.728 |
0.736 |
| FTIR |
0.83 |
0.756 |
0.770 |
0.748 |
| ECD + Raman |
0.78 |
0.733 |
0.720 |
0.742 |
| Raman + ROA |
0.80 |
0.735 |
0.716 |
0.748 |
| FTIR + Raman |
0.85 |
0.779 |
0.772 |
0.784 |
| FTIR + ECD |
0.82 |
0.781 |
0.781 |
0.782 |
| ECD + Ram + ROA |
0.82 |
0.740 |
0.734 |
0.744 |
| FTIR + ECD + Ram |
0.84 |
0.787 |
0.784 |
0.789 |
| FTIR + Ram + ROA |
0.85 |
0.792 |
0.794 |
0.791 |
| FTIR + ECD + Ram + ROA |
0.86 |
0.803 |
0.807 |
0.801 |
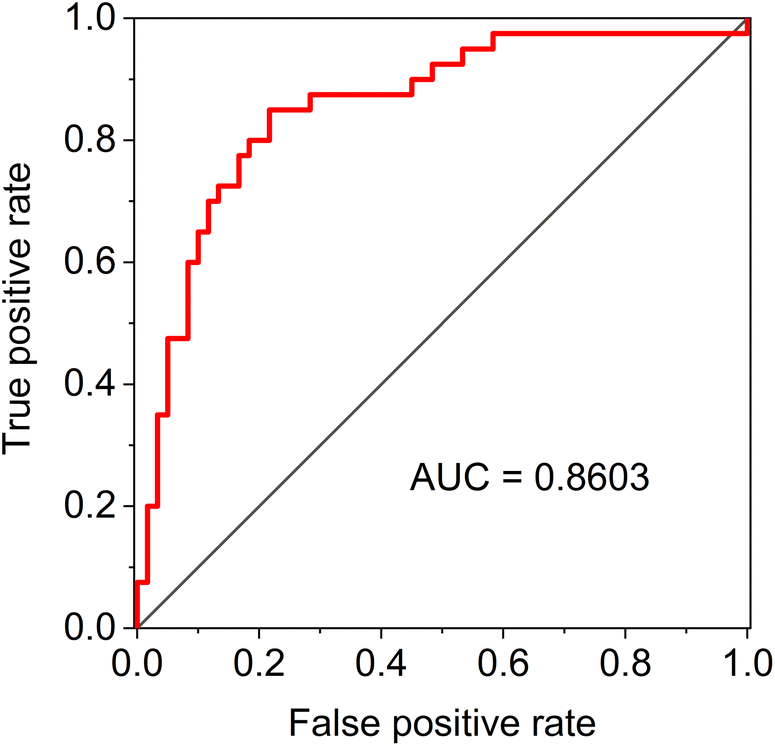
As for the classification models based on the individual spectroscopic method, the accuracy of all of them exceeded 70%, with the best result achieved by FTIR, namely 75.6%. For the various combinations of the methods, we have always coupled ROA with Raman spectroscopy, as the acquisition of ROA is simultaneous with Raman. When combining three methods, classification accuracy reached up to 79.2% for FTIR, Raman and ROA. The final random forest model which combined all the data distinguished the studied groups with an overall accuracy exceeding 80.3% (95% confidence interval 0.795–0.811), with sensitivity and specificity being 80.7 and 80.1%, respectively. The model has balanced values of performance characteristics, which is further confirmed by the value of the area under the curve (AUC) of the receiver operating characteristic (ROC), which reached 0.86 (Fig. 5).
 |
| | Fig. 5 Receiver operating characteristic of the final classification model. | |
None of the combinations without FTIR achieved accuracy as high as FTIR alone, making it the method which contributed most to the differentiation of patients with HCC from cirrhosis in our study. In the average FTIR spectra, the most prominent changes were found in the amide I region; thus, it appears that alterations in the secondary structure of proteins are crucial for classification. Although ECD spectra contain almost exclusively information about the secondary structure of proteins, it seems to be the worst-performing method in terms of individual method classification. Apart from the spatial structure of proteins, FTIR spectra carry much more complex information about the sample compared to ECD; thus, it is to be expected to reach higher accuracy. While comparing Raman spectroscopy and its chiral variation, ROA provides a slightly better classification result. It might be thanks to the sensitivity to the spatial structure that is essential to many biomolecules. A downside is that to achieve ROA spectra with a reasonable signal-to-noise ratio, the required acquisition time is much longer than for Raman spectra. Combined classification models generally achieved higher accuracies than individual methods, especially the combinations with FTIR spectroscopy. Only the model combining data from all four spectroscopic methods exceeded sensitivity and specificity values of 80%.
The use of a multi-method approach for the diagnostics of HCC comes with certain disadvantages, both from a financial perspective and a relatively high acquisition cost and in terms of longer analysis time in the case of ROA. As shown above, combining methods has been proven to be beneficial; therefore, it should be taken into account but also considered from financial, time and other perspectives.
The classification accuracy reaching 80% represents a promising result in terms of application in clinical diagnostics of HCC as the currently employed ultrasound examination reaches in many cases significantly worse results (∼60% sensitivity for early stages, ∼20% for obese patients).4,5 However, the obtained results need to be further validated on a larger cohort. Unfortunately, assessing the benefits of our specific methodology or confirming the general potential of spectroscopic analysis of blood plasma for HCC diagnosis by comparison with other studies is currently not feasible on a large scale as the use of spectroscopic methods for diagnostics of HCC or other liver diseases is not as well explored as for other cancers. Nevertheless, surface-enhanced Raman scattering (SERS) was used in several studies41–43 to differentiate between subjects with HCC and cirrhosis or healthy controls with promising results (accuracy of 78–96%). However, there is a possible repeatability issue with different batches of used substrates in SERS in general, as the re-prepared substrate might not have the same characteristics. We have also found a few studies using FTIR spectroscopy44–46 or Raman spectroscopy47 with similar or slightly higher classification results, but as mentioned above, the comparison is not as simple. The use of chiroptical spectroscopy in the clinical field is unique, as to our knowledge our group is the only one to employ them in such a manner.23,48
The main current downside in the potential applicability of the proposed spectroscopic combination, both in terms of instrument availability and analysis time, is ROA. So far, only one ROA spectrometer with 532 nm excitation by default has been commercially available, but that may change soon. A new instrument49,50 developed by Josef Kapitán with the ZEBR and Meopta-optica companies should be available soon, probably shortening the required analysis time. In addition, an excitation of 785 nm may be available in the near future, the use of which would lower the fluorescence background and would make the observation of overlapped bands possible.
Conclusions
In conclusion, by combining data from various spectroscopic methods, we were able to look at blood plasma samples from different perspectives and detect specific spectral patterns of patients with HCC and controls with cirrhosis. The most pronounced differences were found in spectral regions with signals assigned to proteins. Other significant changes were observed in the carotenoid bands, as their intensity declined with carcinogenesis; nevertheless, this trend is not specific for HCC but generally points to increased oxidative stress in the body due to the presence of a disease.
Classification models based on PC scores and random forest algorithm accurately classified 70–80% of samples, depending on the combination of spectroscopic data evaluated. The best individual results were achieved by FTIR spectroscopy, but when combined with other methods, there was a noticeable increase in the classification results. The improvement in accuracy of the model combining all four spectroscopic methods compared to previous classification models may seem slight, but in the medical field it is potentially the matter of lives saved when screening a high-risk group of patients. Even though these results need to be confirmed on a larger data set, this study proves the potential of chiroptical and vibrational spectroscopic analysis of blood plasma to be an alternative for HCC diagnosis, as the sensitivity of this approach seems to be far superior to the blood-based biomarker AFP.
Author contributions
Ondřej Vrtělka: Investigation, formal analysis, visualization, writing – original draft; Kateřina Králová: investigation, formal analysis, writing – reviewing and editing; Markéta Fousková: data curation, writing – reviewing and editing; Lucie Habartová: writing – reviewing and editing; Petr Hříbek: resources; Petr Urbánek: resources, funding acquisition; Vladimír Setnička: Conceptualization, funding acquisition, supervision, writing – reviewing and editing.
Conflicts of interest
There are no conflicts to declare.
Acknowledgements
This work was supported by the Ministry of Health of the Czech Republic (Grant No. NV19-08-00525) and partially by Specific University Research (Grant No. A2_FCHI_2022_004).
References
-
Institute for Health Metrics and Evaluation, GBD Results, https://vizhub.healthdata.org/gbd-results/, (accessed 10 December 2022).
- R. G. Simonetti, C. Cammà, F. Fiorello, F. Politi, G. D'Amico and L. Pagliaro, Dig. Dis. Sci., 1991, 36, 962–972 CrossRef CAS PubMed.
- J. M. Llovet, R. K. Kelley, A. Villanueva, A. G. Singal, E. Pikarsky, S. Roayaie, R. Lencioni, K. Koike, J. Zucman-Rossi and R. S. Finn, Nat. Rev. Dis. Primers, 2021, 7, 6 CrossRef PubMed.
- A. Singal, M. L. Volk, A. Waljee, R. Salgia, P. Higgins, M. A. M. Rogers and J. A. Marrero, Aliment. Pharmacol. Ther., 2009, 30, 37–47 CrossRef CAS PubMed.
- J. M. Esfeh, K. Hajifathalian and K. Ansari-Gilani, Clin. Mol. Hepatol., 2020, 26, 54–59 CrossRef PubMed.
- J. Zhang, G. Chen, P. Zhang, J. Zhang, X. Li, D. n. Gan, X. Cao, M. Han, H. Du and Y. a. Ye, PLoS One, 2020, 15, e0228857 CrossRef CAS PubMed.
- J. K. Heimbach, L. M. Kulik, R. S. Finn, C. B. Sirlin, M. M. Abecassis, L. R. Roberts, A. X. Zhu, M. H. Murad and J. A. Marrero, Hepatology, 2018, 67, 358–380 CrossRef PubMed.
- P. R. Galle, A. Forner, J. M. Llovet, V. Mazzaferro, F. Piscaglia, J.-L. Raoul, P. Schirmacher and V. Vilgrain, J. Hepatol., 2018, 69, 182–236 CrossRef PubMed.
- T. A. Keiderling, Chem. Rev., 2020, 120, 3381–3419 CrossRef CAS PubMed.
- H. W. Querfurth and F. M. LaFerla, N. Engl. J. Med., 2010, 362, 329–344 CrossRef CAS PubMed.
- E. Mandelkow, M. von Bergen, J. Biernat and E. M. Mandelkow, Brain Pathol., 2007, 17, 83–90 CrossRef CAS PubMed.
-
S. Ostovar Pour, L. D. Barron, S. T. Mutter and E. W. Blanch, in Chiral Analysis(Second Edition), ed. P. L. Polavarapu, Elsevier, Cambridge, MA, 2018, pp. 249–291 Search PubMed.
- D. I. Ellis and R. Goodacre, Analyst, 2006, 131, 875–885 RSC.
- H. J. Butler, L. Ashton, B. Bird, G. Cinque, K. Curtis, J. Dorney, K. Esmonde-White, N. J. Fullwood, B. Gardner, P. L. Martin-Hirsch, M. J. Walsh, M. R. McAinsh, N. Stone and F. L. Martin, Nat. Protoc., 2016, 11, 664–687 CrossRef CAS PubMed.
- E. Barlev, U. Zelig, O. Bar, C. Segev, S. Mordechai, J. Kapelushnik, I. Nathan, F. Flomen, H. Kashtan, R. Dickman, O. Madhala-Givon and N. Wasserberg, J. Gastroenterol., 2016, 51, 214–221 CrossRef CAS PubMed.
- M. Paraskevaidi, C. L. M. Morais, K. M. Ashton, H. F. Stringfellow, R. J. McVey, N. A. J. Ryan, H. O'Flynn, V. N. Sivalingam, S. J. Kitson, M. L. MacKintosh, A. E. Derbyshire, C. Pow, O. Raglan, K. M. G. Lima, M. Kyrgiou, P. L. Martin-Hirsch, F. L. Martin and E. J. Crosbie, Cancers, 2020, 12, 1256 CrossRef CAS PubMed.
- H. F. Nargis, H. Nawaz, H. N. Bhatti, K. Jilani and M. Saleem, Spectrochim. Acta, Part A, 2021, 246, 119034 CrossRef CAS PubMed.
- D. Lin, Y. Wang, T. Wang, Y. Zhu, X. Lin, Y. Lin and S. Feng, Anal. Bioanal. Chem., 2020, 412, 1611–1618 CrossRef CAS PubMed.
- P. Giamougiannis, C. L. M. Morais, B. Rodriguez, N. J. Wood, P. L. Martin-Hirsch and F. L. Martin, Anal. Bioanal. Chem., 2021, 413, 5095–5107 CrossRef CAS PubMed.
- J. A. Marrero, L. M. Kulik, C. B. Sirlin, A. X. Zhu, R. S. Finn, M. M. Abecassis, L. R. Roberts and J. K. Heimbach, Hepatology, 2018, 68, 723–750 CrossRef PubMed.
- J. M. Llovet, C. Brú and J. Bruix, Semin. Liver Dis., 1999, 19, 329–338 CrossRef CAS PubMed.
- P. Hříbek, J. Klasová, T. Tůma, T. Kupsa and P. Urbánek, Medicina, 2022, 58, 1099 CrossRef PubMed.
- M. Tatarkovič, A. Synytsya, L. Šťovíčková, B. Bunganič, M. Miškovičová, L. Petruželka and V. Setnička, Anal. Bioanal. Chem., 2015, 407, 1335–1342 CrossRef PubMed.
- S. Guillaume, P. Fabien, D. Frédérick, J. E. Katherine, N. Tien, P. Kevin, T. Dominique and L. Frédéric, J. Biomed. Opt., 2023, 28, 025002 Search PubMed.
- M. Jackson and H. Mantsch, Crit. Rev. Biochem. Mol. Biol., 1995, 30, 95–120 CrossRef CAS PubMed.
-
I. U. Rehman, Z. Movasaghi and S. Rehman, Vibrational Spectroscopy for Tissue Analysis, Taylor & Francis Group, Boca Raton, FL, 2012 Search PubMed.
- F. Bonnier, G. Brachet, R. Duong, T. Sojinrin, R. Respaud, N. Aubrey, M. Baker, H. Byrne and I. Chourpa, J. Biophotonics, 2016, 9, 1085–1097 CrossRef CAS PubMed.
- V. I. Dodero, Z. B. Quirolo and M. A. Sequeira, Front. Biosci., 2011, 16, 61–73 CrossRef PubMed.
-
V. Setnička and L. Habartová, in Chiral Analysis (Second Edition), ed. P. L. Polavarapu, Cambridge, MA, 2018, pp. 429–465 Search PubMed.
- J. L. Rowles and J. W. Erdman, Biochim. Biophys. Acta, Mol. Cell Biol. Lipids, 2020, 1865, 158613 CrossRef CAS PubMed.
- T. Tanaka, M. Shnimizu and H. Moriwaki, Molecules, 2012, 17, 3202–3242 CrossRef CAS PubMed.
- H. Tapiero, D. M. Townsend and K. D. Tew, Biomed. Pharmacother., 2004, 58, 100–110 CrossRef CAS PubMed.
- H. Nishino, M. Murakoshi, H. Tokuda and Y. Satomi, Arch. Biochem. Biophys., 2009, 483, 165–168 CrossRef CAS PubMed.
- L. Habartova, B. Bunganic, M. Tatarkovic, M. Zavoral, J. Vondrousova, K. Syslova and V. Setnicka, Chirality, 2018, 30, 581–591 CrossRef CAS PubMed.
- L. Habartova, K. Hrubesova, K. Syslova, J. Vondrousova, Z. Fisar, R. Jirak, J. Raboch and V. Setnicka, Clin. Biochem., 2019, 72, 58–63 CrossRef CAS PubMed.
- A. Synytsya, M. Judexová, T. Hrubý, M. Tatarkovič, M. Miškovičová, L. Petruželka and V. Setnička, Anal. Bioanal. Chem., 2013, 405, 5441–5453 CrossRef CAS PubMed.
- G. C. Chen and J. P. Kane, Biochemistry, 1974, 13, 3330–3335 CrossRef CAS PubMed.
- L. D. Barron, F. Zhu, L. Hecht, G. E. Tranter and N. W. Isaacs, J. Mol. Struct., 2007, 834–836, 7–16 CrossRef CAS.
- L. D. Barron, L. Hecht, E. W. Blanch and A. F. Bell, Prog. Biophys. Mol. Biol., 2000, 73, 1–49 CrossRef CAS PubMed.
- J. Kessler, J. Kapitán and P. Bouř, J. Phys. Chem. Lett., 2015, 6, 3314–3319 CrossRef CAS.
- E. Gurian, A. Di Silvestre, E. Mitri, D. Pascut, C. Tiribelli, M. Giuffrè, L. S. Crocè, V. Sergo and A. Bonifacio, Anal. Bioanal. Chem., 2021, 413, 1303–1312 CrossRef CAS PubMed.
- W. Dawuti, X. Zheng, H. Liu, H. Zhao, J. Dou, L. Sun, J. Chu, R. Lin and G. Lü, Photodiagn. Photodyn. Ther., 2022, 38, 102811 CrossRef CAS PubMed.
- R. Liu, Y. Xiong, Y. Guo, M. Si and W. Tang, J. Raman Spectrosc., 2018, 49, 1426–1434 CrossRef CAS.
- K. Thumanu, S. Sangrajrang, T. Khuhaprema, A. Kalalak, W. Tanthanuch, S. Pongpiachan and P. Heraud, J. Biophotonics, 2014, 7, 222–231 CrossRef CAS PubMed.
- X. Zhang, G. Thiéfin, C. Gobinet, V. Untereiner, I. Taleb, B. Bernard-Chabert, A. Heurgué, C. Truntzer, P. Ducoroy, P. Hillon and G. D. Sockalingum, Transl. Res., 2013, 162, 279–286 CrossRef CAS PubMed.
- X. Yang, Q. Ou, W. Yang, Y. Shi and G. Liu, Spectrochim. Acta, Part A, 2021, 263, 120181 CrossRef CAS PubMed.
- I. Taleb, G. Thiéfin, C. Gobinet, V. Untereiner, B. Bernard-Chabert, A. Heurgué, C. Truntzer, P. Hillon, M. Manfait, P. Ducoroy and G. D. Sockalingum, Analyst, 2013, 138, 4006–4014 RSC.
- M. Tatarkovič, Z. Fišar, J. Raboch, R. Jirák and V. Setnička, Chirality, 2012, 24, 951–955 CrossRef PubMed.
- P. Michal, R. Čelechovský, M. Dudka, J. Kapitán, M. Vůjtek, M. Berešová, J. Šebestík, K. Thangavel and P. Bouř, J. Phys. Chem. B, 2019, 123, 2147–2156 CrossRef CAS PubMed.
- P. Michal, J. Hudecová, R. Čelechovský, M. Vůjtek, M. Dudka and J. Kapitán, Symmetry, 2022, 14, 990 CrossRef CAS.
|
| This journal is © The Royal Society of Chemistry 2023 |
Click here to see how this site uses Cookies. View our privacy policy here. 
 Open Access Article
 This Open Access Article is licensed under a Creative Commons Attribution-Non Commercial 3.0 Unported Licence
 *a,
Kateřina
Králová
*a,
Kateřina
Králová