
 Open Access Article
 This Open Access Article is licensed under a Creative Commons Attribution-Non Commercial 3.0 Unported Licence
Volatile metabolites differentiate air–liquid interface cultures after infection with Staphylococcus aureus†
Waqar
Ahmed
 a,
Emmanuelle
Bardin
bc,
Michael D.
Davis
d,
Isabelle
Sermet-Gaudelus
be,
Stanislas
Grassin Delyle
cf and
Stephen J.
Fowler
*ag
a,
Emmanuelle
Bardin
bc,
Michael D.
Davis
d,
Isabelle
Sermet-Gaudelus
be,
Stanislas
Grassin Delyle
cf and
Stephen J.
Fowler
*ag
aDivision of Immunology, Immunity to infection & Respiratory Medicine, Faculty of Biology, Medicine, and Health, University of Manchester, Manchester, UK
bInstitut Necker-Enfants Malades, Paris, France
cUniversité Paris-Saclay, UVSQ, INSERM, Infection et inflammation, Montigny le Bretonneux, France
dHerman B Wells Center for Pediatric Research, Pediatric Pulmonology, Allergy, and Sleep Medicine, Indiana University School of Medicine, Indianapolis, USA
eService de Pneumo-Pédiatrie, Université René Descartes, Hôpital Necker-Enfants Malades, Paris, France
fHôpital Foch, Exhalomics, Département des maladies des voies respiratoires, Suresnes, France
gNIHR Manchester Biomedical Research Centre, Manchester University Hospitals NHS Foundation Trust, Education and Research Centre, W ythenshawe Hospital, Manchester, M23 9LT, UK. E-mail: stephen.fowler@manchester.ac.uk
First published on 4th January 2023
Abstract
Early detection of lung infection is critical to clinical diagnosis, treatment, and monitoring. Measuring volatile organic compounds (VOCs) in exhaled breath has shown promise as a rapid and accurate method of evaluating disease metabolism and phenotype. However, further investigations of the role and function of VOCs in bacterial-host-stress response is required and this can only be realised through representative in vitro models. In this study we sampled VOCs from the headspace of A549 cells at an air–liquid interface (ALI). We hypothesised VOC sampling from ALI cultures could be used to profile potential biomarkers of S. aureus lung infection. VOCs were collected using thin film microextraction (TFME) and were analysed by thermal desorption-gas chromatography-mass spectrometry. After optimising ALI cultures, we observed seven VOCs changed between A549 and media control samples. After infecting cells with S. aureus, supervised principal component-discriminant function analysis revealed 22 VOCs were found to be significantly changed in infected cells compared to uninfected cells (p < 0.05), five of which were also found in parallel axenic S. aureus cultures. We have demonstrated VOCs that could be used to identify S. aureus in ALI cultures, supporting further investigation of VOC analysis as a highly sensitive and specific test for S. aureus lung infection.
1. Introduction
As a commensal microorganism Staphylococcus aureus does not normally cause harm to a healthy individual. Complications arise however with tissue damage1 and a weakened immune system unable to fight off an opportunistic infection, for example in critically ill patients.2,3 Rapid and early detection of S. aureus is critical to diagnose infection, prescribe the right antibiotic at the right time, and reduce the risks associated with drug-resistant strains.4Measuring exhaled volatile organic compounds (VOCs) offers potential for rapid non-invasive detection of lung infection.5,6 To this end, several studies have explored VOC analysis with S. aureus infection from respiratory samples.7–9 However, VOCs from complex samples may contain several endogenous (e.g., host tissues and metabolism) and exogenous (e.g., sampling apparatus, environment, and other pathogens) sources, and these may likely confound VOCs directly associated with microbes. Investigating how these sources impact changes in the volatilome may provide novel insights into their metabolic pathway activation and role in infection pathogenesis. For example, studies have explored how changing the culture media environment can cause variations in the volatilome of bacterial cultures.10,11 Confounders such as host response metabolic response to an infection may be responsible for poor reproducibility between in vitro and in vivo studies.12,13
Infection models of microbes and mammalian cells are more representative of the human lung environment than standard microbial cultures.14,15 Air–liquid interface (ALI) culture models are widely used to emulate the cellular structure of lung disease in controlled environments and in some cases reduce the dependence on animal models for experimentation.16 Studies have also profiled the headspace from air–liquid interface (ALI) models, to investigate viral infection and the metabolic impact of oxidative stress from smoking.17–19 These studies used either used stir-bar sorptive extraction or solid phase microextraction to sample VOCs from modified cell culture apparatus. All three studies used gas chromatography-mass spectrometry (GC-MS) for analysis of VOCs.
The aim of this study was to model epithelial damage caused by S. aureus and analyse the volatilome for potentially diagnostic biomarkers for S. aureus. The hypothesis was that VOC sampling could be used to profile potential biomarkers of S. aureus lung infection. We developed a method to sample VOCs using thin-film microextraction (TFME) from the apical compartment of an alveolar epithelial ALI culture, analysed offline by thermal desorption-gas chromatography-mass spectrometry (TD-GC-MS). Univariate and multivariate statistical comparisons will be presented between mammalian cells with and without S. aureus inoculation, using cell culture media and S. aureus culture as control samples.
2. Methods
2.1. Strains and cell culture
The immortalised A549 alveolar epithelial cell line was used in this study, kindly donated from the Blaikley lab at the University of Manchester (passage no. 117). Cells were cultured in Dulbecco's Modified Eagle's medium (DMEM) supplemented with 4500 mg L−1 glucose (Sigma Aldrich, UK), 10% fetal bovine serum (PAA, UK), 2% 200 mM L-glutamine (Sigma Aldrich, UK), 1% 100 mM sodium pyruvate solution (Sigma Aldrich, UK), 1% penicillin–streptomycin (1000 μg mL−1–10 mg mL−1 in solution with 0.9% NaCl, Sigma Aldrich, UK), and 0.1% 250 μg mL−1 Amphotericin B (Gibco, UK).Cells were incubated at 37 °C in 5% CO2, passaged when at least 80% cell confluence was reached using trypsin-EDTA (0.25% solution, Sigma Aldrich, UK), centrifuged at 100 RCF for 5 min, and the pellet resuspended in fresh media to a concentration of 1 × 10⁶ cells per mL. Cell concentration was determined using a trypan blue stain (0.4%, Sigma Aldrich, UK) and cells counted using a Fuchs-Rosenthal haemocytometer (C-chip DHC-F01, NanoEntek, South Korea).
To generate an ALI culture, approximately 1 × 10⁵ cells were seeded onto sterile 12-well plates with well inserts (ThinCert™, PET transparent membrane, pore size 3.0μm, pore density 0.6 × 106 cm2, insert surface area 113.1mm2, Gibco, UK). Spent media in the apical compartment was removed after 24 h to generate a cell layer exposed to air on the apical side of the insert membrane. Basal compartment media was replenished every other day. Cell growth was visually inspected compared with control wells. In addition, transepithelial electrical resistance (TEER) measurements were carried out using an epithelial voltohmmeter according to manufacturer protocols (EVOM2, World Precision Instruments, USA). Cell monolayer TEER was calculated using the following equation: TEER (Ω cm2) = RTissue × S, where R is resistance (Ω), RTissue = Rblank − Rculture, and S is the insert surface area (cm2). Both apical and basal compartments were washed with phosphate buffered saline (PBS) before measurement.
2.2. Infection with S. aureus and VOC sample collection
A reference strain of S. aureus (ATCC 29213) was initially sub-cultured in tryptic soy media. Apical compartments were inoculated with 100 μL of S. aureus suspended in PBS and incubated for 24 h at 37 °C. Prior to this, basal media was replaced with DMEM without antibiotic supplementation and incubated at 37 °C for a further 24 h to confirm absence of contamination.TFME was carried out using PDMS strips (20 mm × 15 mm × 0.45 mm, Goodfellow Cambridge Ltd, Huntingdon, UK), as previously described.20 Strips were initially washed with water then methanol and conditioned in a stream of N2 at 350 °C for 1 h. Conditioned strips were stored in capped stainless-steel tubes until sample collection and analysis and were used within 24 h of conditioning. Strips were reused after reconditioning with the same parameters. VOCs were sampled by inserting a PDMS strip into the apical compartment of each well insert. Cultures were then incubated for a further 24 h before removing PDMS strips for VOC analysis. S. aureus was aspirated from the apical side with a 100 μL PBS wash and growth observed on tryptic soy agar plates using the drop plate method (10 μL of the PBS wash dropped on a segment of the agar plate and incubated at 37 °C for 18 h). Basal media was also collected to observe S. aureus migration through the cell layer and insert membrane. The PBS wash and basal media were diluted (1![[thin space (1/6-em)]](https://www.rsc.org/images/entities/char_2009.gif) :10) up to a maximum of four dilutions.
:10) up to a maximum of four dilutions.
Absorbance change of Phenol Red, a pH indicator and a constituent of DMEM, was measured as an orthogonal method to detect cell culture acidification by S. aureus infection. A standard curve of DMEM at different pH was created by adding citric acid, measured at 415 and 560 nm (Biochrom Asys UVM340, Cambridge, UK). The standard curve was calculated based on the 415/560 nm ratio for Phenol Red and used to interpolate pH levels of basal media (R2 0.96). This method was used as opposed to direct measurement using a pH probe due to the low volume of spent media available per well and risk of cross contamination between infected and uninfected samples.
2.3. Thermal desorption-gas chromatography-mass spectrometry (TD-GC-MS)
PDMS strips were dry purged with N2 at 50 mL min−1 for 4 min to remove excess water on the sorbent before analysis by TD-GC-MS. Prior to thermal desorption, a gas standard (1 ppmV p-bromofluorobenzene in N2; Thames Restek, Saunderton, UK) was automatically spiked onto each tube. Tubes were then desorbed at 280 °C for 5 min (TD100, Markes International, Llantrisant, UK) then transferred with splitless injection to a cold trap (kept at 0 °C) for cryofocussing which was subsequently flash heated to 280 °C for 2 min. Desorbed VOCs were transferred to the GC column (DB-5 ms, length 30 m × internal diameter 0.25 mm × film thickness 0.25 μm, Agilent Technologies, Cheadle, UK) using a constant helium flow of 1 mL min−1. The GC column oven (7890B, Agilent Technologies, Cheadle, UK) was set to a linear temperature programme starting at 30 °C and increasing to 250 °C at 7.5 °C min−1 (total GC cycle time of 29.33 min). After GC separation, VOCs were transferred to the MS (7010, Agilent Technologies, Cheadle, UK) where they were ionised (EI 70 eV) in the source kept at 150 °C. Data was acquired in full scan mode with an acquisition rate of 5 scans s−1 between m/z 40–300. In addition, validation of cell culture VOCs was performed on a different GC-MS method, as described previously.212.4. Data analysis
Masshunter Quantitative Analysis software (version B.07.00, Agilent, Cheadle, UK) was used to automatically integrate peaks (Agile2) and identify VOCs in each sample to MSI level 222 using the NIST mass spectral library (version 2014, match factor > 70) and retention indices calculated using an alkane ladder. An aligned n × p matrix was created of peak intensities. Missing values were imputed using Random Forest imputation (R package missForest). All samples were then normalised by the internal standard (p-bromofluorobenzene), and features were log transformed and mean centred (i.e. z-normalised). Statistical analyses were performed in Graphpad Prism (version 9.1) and R (v 4.1.1) and consisted of univariate tests including repeated measures ANOVA, non-parametric Mann–Whitney-U and multivariate analysis in the form of unsupervised principal component analysis (PCA) and supervised classification via principal component-discriminant function analysis (PC-DFA). PC-DFA was cross validated (80:20 training:test set) using stratified random sampling with 1000 repeats. Comparisons were made between culture media and mammalian cells, and infected and uninfected cells. The Benjamini–Hochberg one way ANOVA was applied (q < 0.05) where appropriate to control the false discovery rate (FDR).
3. Results
3.1. Blank PDMS strip reproducibility
Reproducibility of PDMS strip adsorption was assessed by calculating RSD for the internal standard purged onto blank PDMS strips. Repeated desorption of a single blank PDMS strip (n = 10) resulted in an RSD of 1.35% whereas ten repeat desorption runs of a tube without sorbent material resulted in an RSD of 1.10%. Desorption of several individual PDMS strips (n = 10) resulted in an RSD 7.27%. The most consistently produced compounds associated with the sorbent background were hexamethylcyclotrisiloxane and octamethylcyclotetrasiloxane.3.2. Optimal ALI culture time and CFU inoculum for S. aureus
To assess the formation of a A549 cell layer on the well insert, transepithelial integrity was measured by TEER (n = 11) on day 2, 5, 7, 9, and 12 after seeding (Fig. 1). A repeated measures ANOVA showed TEER increased on all days compared to the initial measurement on day 2 (p = < 0.001), whereas no difference was found between days 5, 7, 9, and 12. Day 9 was selected as the optimal time to infect cells based on the representative TEER (55.2 ± 6.5) and low RSD (11.7%), in comparison to other time points (day 5 = 52.3 ± 14.2 RSD 27.2%, day 7 = 56.1 ± 16.8 RSD 30.0%, day 12 = 39.7 ± 3. 6 RSD 9.1%). TEER measurements were also used to evaluate the impact of S. aureus on membrane integrity.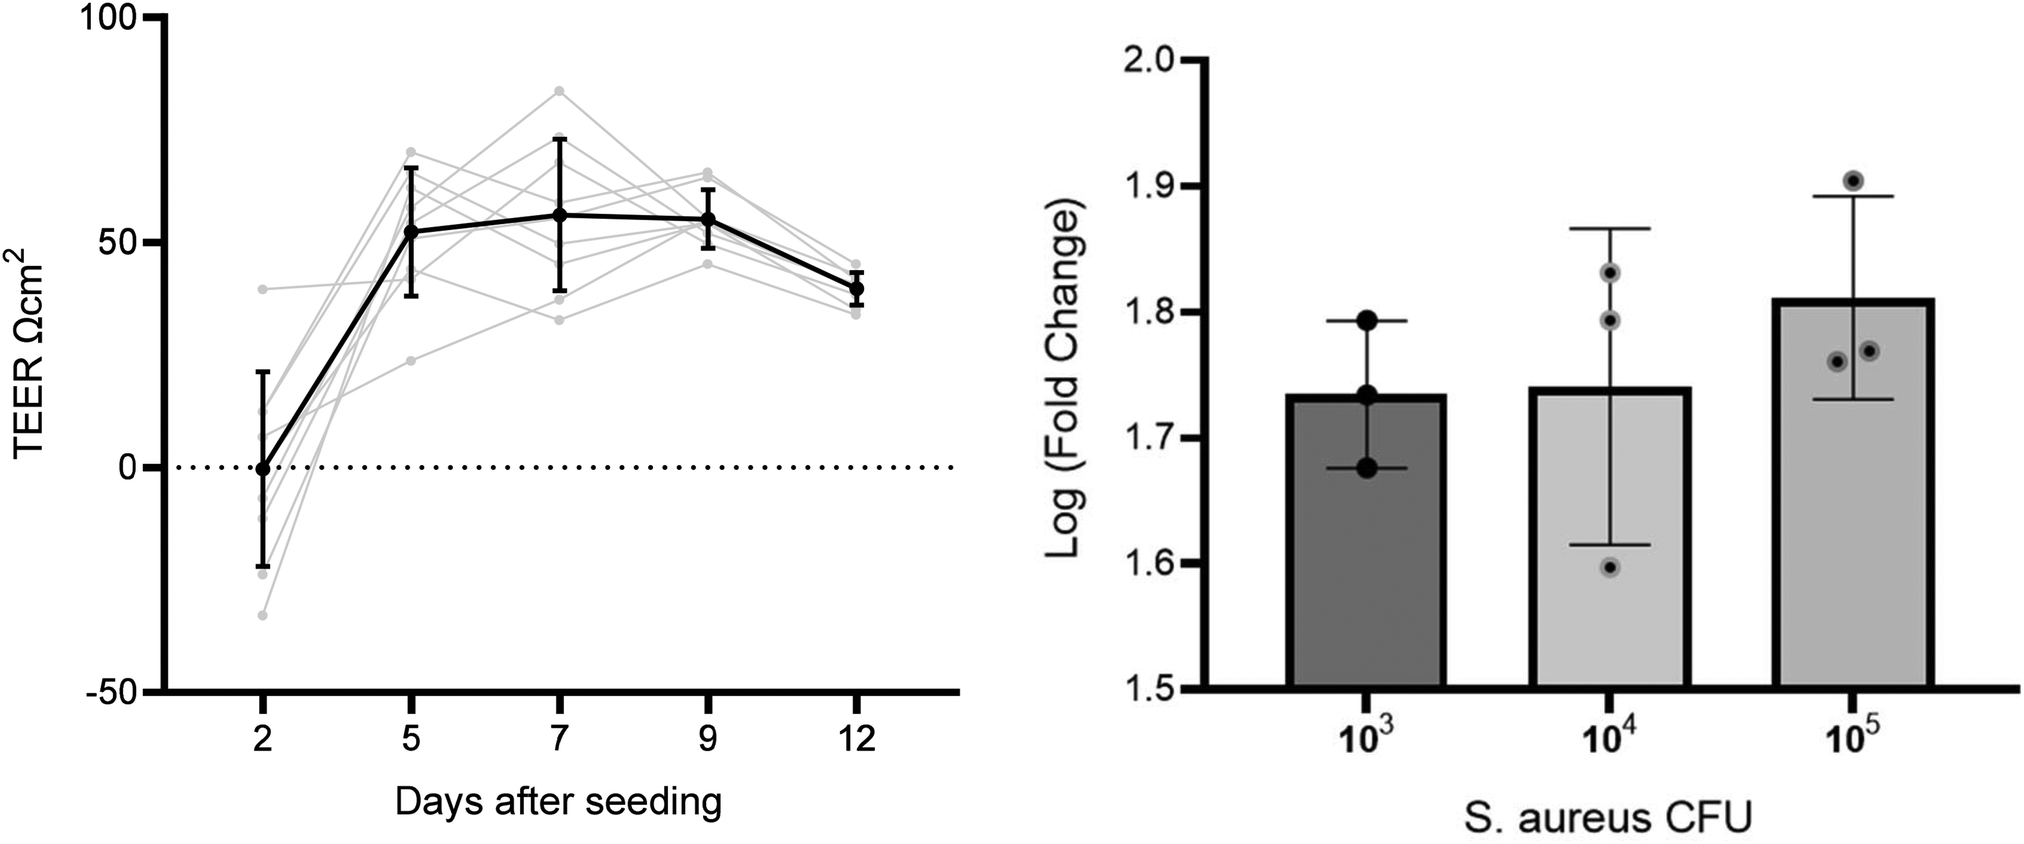 | ||
| Fig. 1 Left: line graph with TEER measurements across several days on the same well inserts. Right: graph comparing three S. aureus CFU concentration of TEER fold change before and after inoculation. | ||
To select an infection CFU inoculum concentration for infection, A549 cells were cultured at ALI and the apical side was inoculated with S. aureus at three CFU concentrations – 1 × 10³, 1 × 10⁴, and 1 × 10⁵ CFU (n = 3 per concentration). All S. aureus CFU concentrations decreased cell culture TEER after inoculation and incubation for 24 h (paired t test p < 0.001). Mean log fold changes for each CFU concentration were 1 × 10³ CFU mL−1 = 1.7, 1 × 10⁴ CFU mL−1 = 1.8, and 1 × 10⁵ CFU mL−1 = 1.8. No significant differences were found between TEER measured before or after inoculation between CFU concentrations (p > 0.05). The lowest concentration tested (103 CFU) was taken forward for infecting cells in the headspace sampling experiments. A low initial CFU was selected to reduce detection of saturated high-abundance VOCs from S. aureus, reducing the risk of sample carry over.
3.3. Volatiles from A549 cells without infection
Headspace volatiles were sampled from A549 cells and media-only controls after 9 days in ALI culture, under standard growth conditions without infection. In addition, a validation experiment was carried out using the same culture methods but with a different analytical method as described in21 (cells n = 6, media n = 3). All samples were confirmed free of microbial contamination after plate culture and visual inspection of the culture colour remaining red (media) or pink (cells) and absence of turbidity. After controlling for FDR, 107 features were significantly different between media and cells. For the validation experiment, 111 features were found significantly different between the two groups. Separation across PC1 was observed between sample groups for both original (Fig. 2A) and validation experiments (Fig. 2B).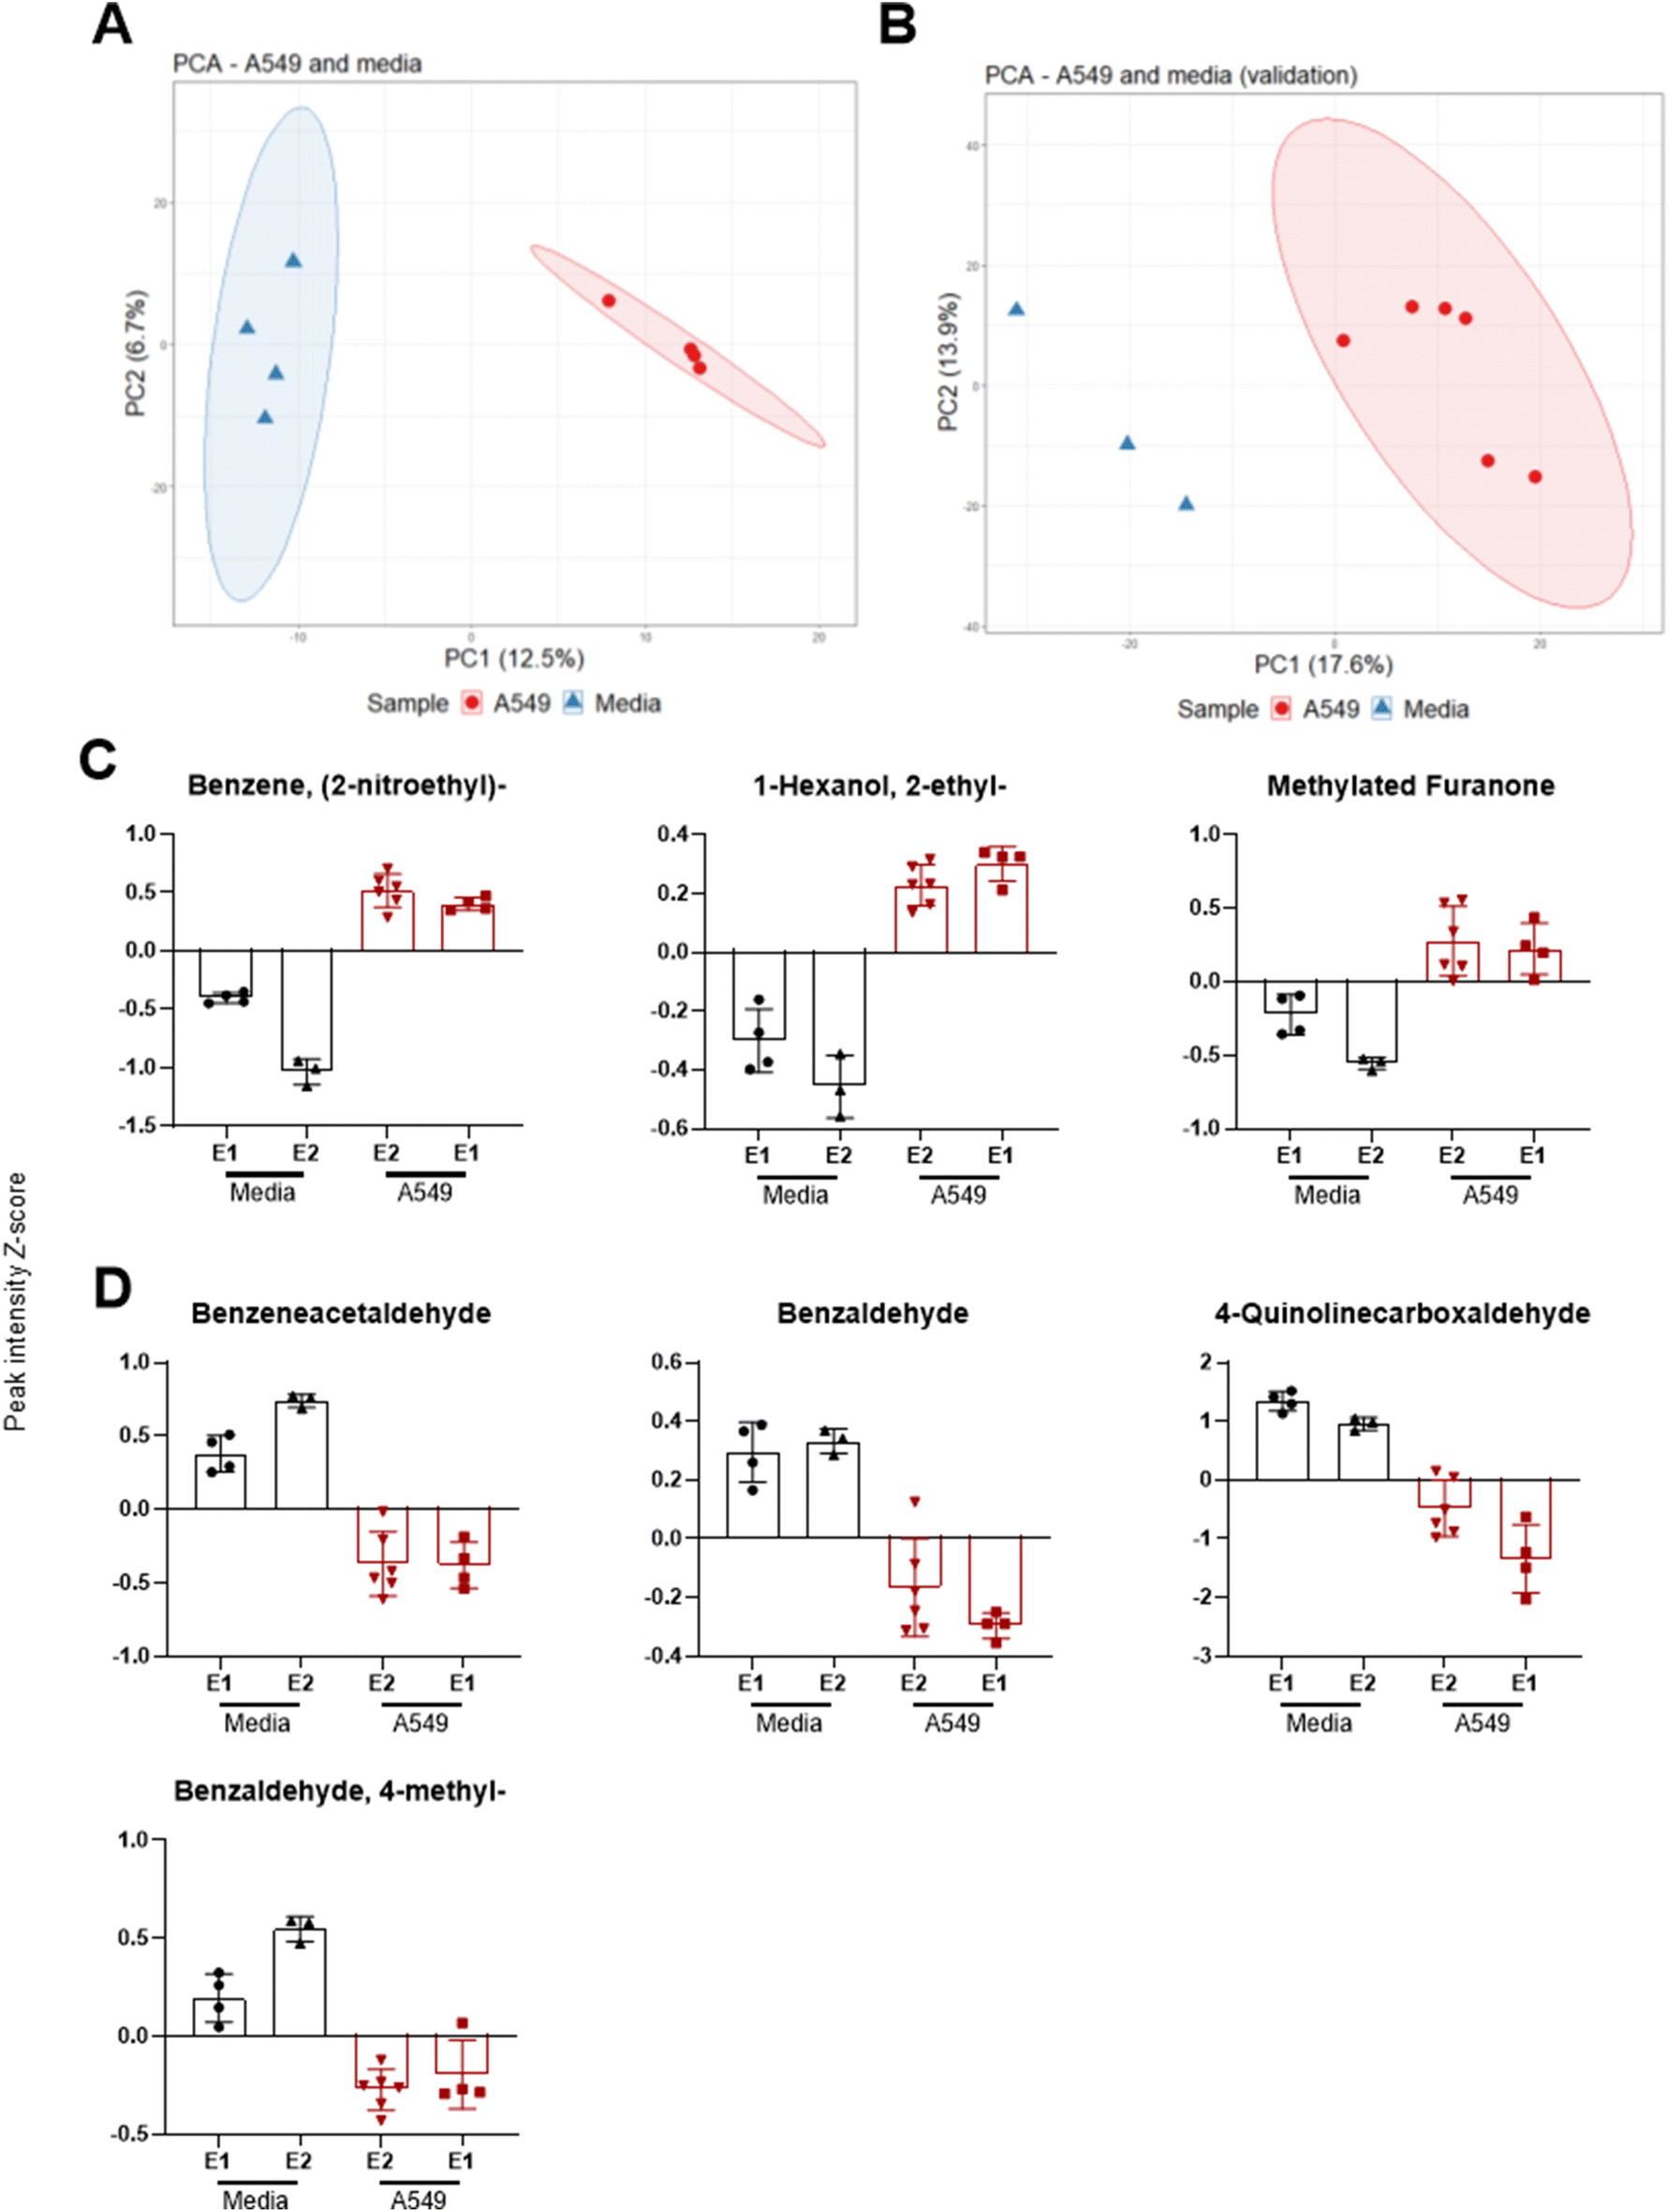 | ||
| Fig. 2 PCA scores plot showing PC1 and PC2 of headspace sampling experiments where VOCs were sampled after 24 h of incubation at 37 °C comparing (A) A549 and media, and (B) validation experiment comparing A549 and media using a different analysis method (see methods). Z-score plots of (C) of significantly increased (p < 0.05) VOCs in A549 and (D) significantly increased VOCs in media, across both original (E1) and validation (E2) experiments. | ||
Seven VOCs extracted from PCA loadings were significantly different between media and cells across both experiments as shown in Fig. 2. These included benzene 2-nitroethyl-(log2 fold change [FC] 2.7, q < 0.001, validation experiment FC 5.2, q < 0.001), 1-hexanol 2-ethyl-(FC 2.0, q = 0.003 validation FC 2.3, q = 0.023) and a methylated furanone (Fig. 2C). The latter compound was identified as 2(3H)-furanone 5-methyl-(FC 2.5, q = 0.026) in the original experiment and as 2(3H)-furanone dihydro-4-methyl-(FC 2.9, q = 0.004) in the validation experiment. VOCs with a decreased abundance in cells (Fig. 2D) were benzeneacetaldehyde (FC −2.5, q = 0.003, validation FC −3.5, q = 0.001), benzaldehyde (FC −2.0, q = 0.003, validation FC −1.6 q = 0.007), 4-quinolinecarboxaldehyde (FC −8.1, q = 0.010, validation FC −4.1 q = 0.007) and benzaldehyde 4-methyl-(FC −1.2, q = 0.032, validation FC −2.7 q < 0.001).
3.4. Infection of A549 cells with S. aureus
After 9 days of maintaining an ALI, cells were infected with 103 CFU of S. aureus (n = 6) on the apical side alongside cells without infection inoculated with 100μL PBS without S. aureus (n = 6) and control samples (media and S. aureus in media). After 24 h, leakage of media from the basal to the apical side was observed for A549 cultures with S. aureus infection, whereas no such leakage was seen for samples uninfected with S. aureus. TEER measurements decreased in S. aureus infected cells after 24 h (paired t test p = 0.0003), as shown in Fig. 3A. Basal media pH suggested increased acidity in infected cell cultures compared to uninfected cells (Fig. 3B) which is consistent with bacterial contamination of mammalian cell culture. No visible S. aureus growth was observed for A549 cultures alone compared to infected A549 for both apical and basal samples (Fig. 3C). Saturated microbial growth was observed across all inoculated cultures, including the basal compartment cultures (>107CFU) suggesting exponential growth of S. aureus in the presence of A549 cells.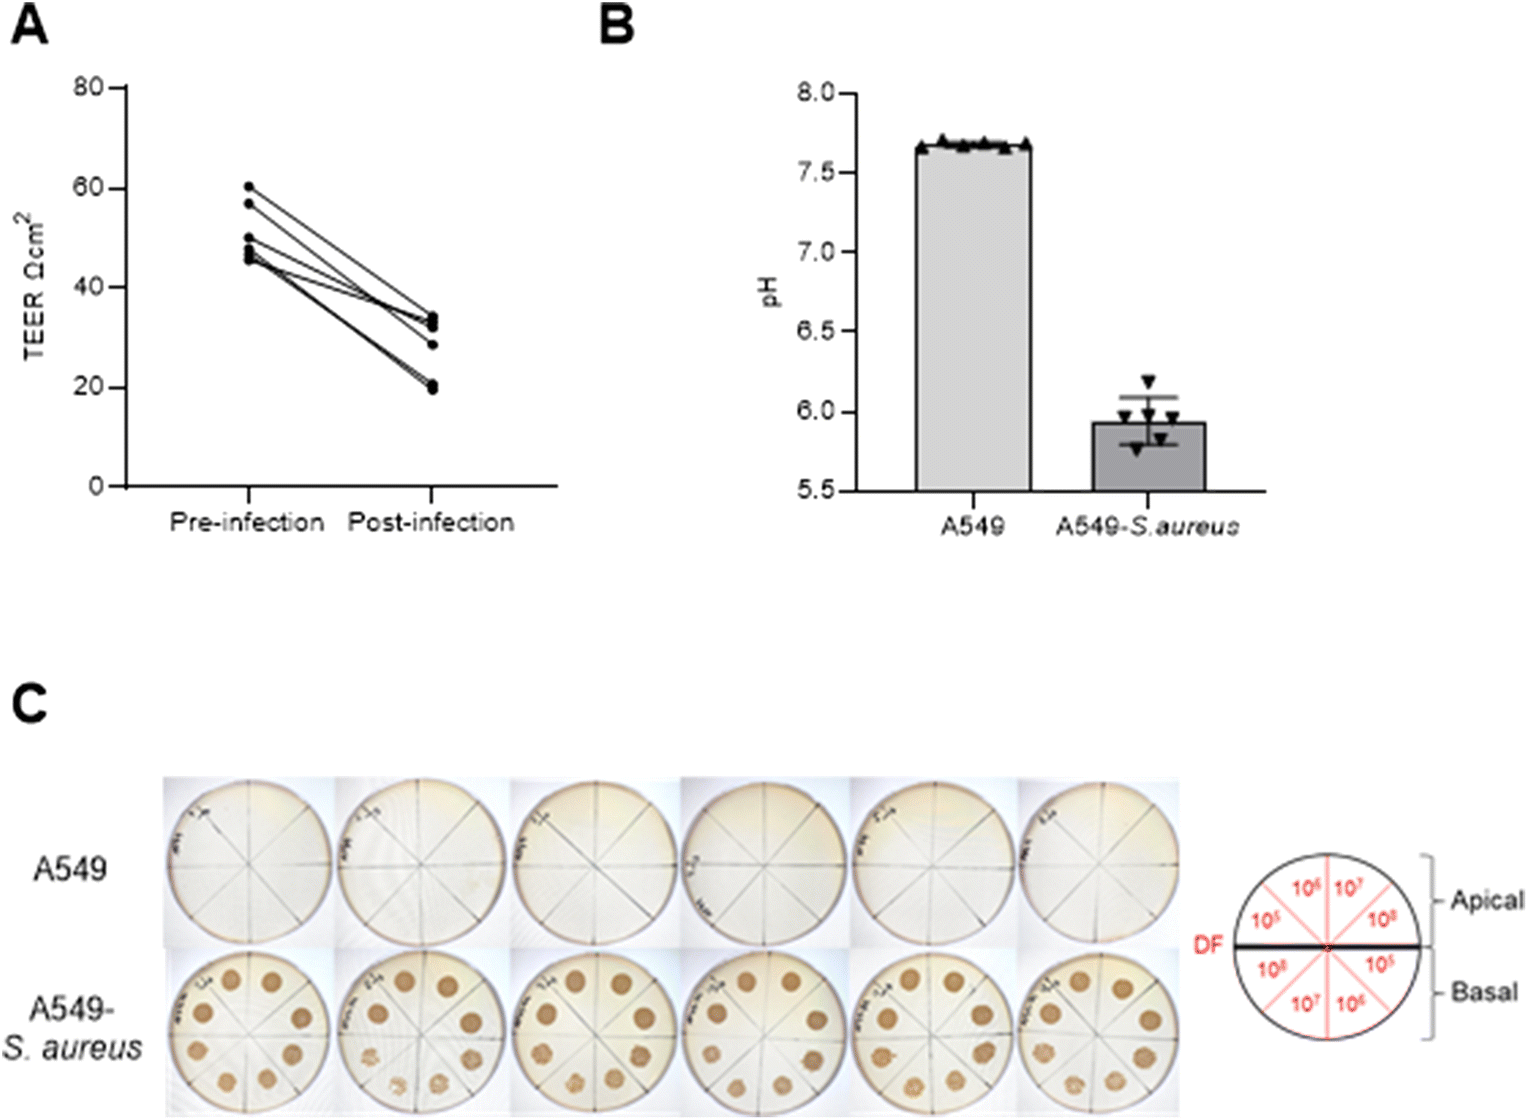 | ||
| Fig. 3 (A) TEER measurements per well before and after infection of A549 cells with S. aureus. (B) Basal media pH after 24 h of infection (A549-S. aureus) compared to uninfected (A549) cells. (C) Tryptic soy agar plates with serial dilutions (DF = estimated CFU mL−1) of apical PBS wash and basal media from both sample groups. | ||
3.5. Volatile profile of A549 cells infected with S. aureus
Data were initially assessed using PCA (Fig. S1†) and inspecting total ion current chromatograms, where no clear separation was found between groups. In addition, two samples failed analysis due to water retention. Therefore, to extract VOC features which differentiate infected and uninfected cells, a cross-validated PC-DFA (with eight PCs) was performed with A549 cells infected with S aureus (n = 4) in comparison to uninfected A549 cells (n = 6), media (n = 8), and S. aureus (n = 8) samples alone (Fig. 4). The PC-DFA model showed separation across the first discriminant function (DF1, S3) between samples with A549 cells (infected and uninfected) and those without (media and S. aureus alone). The second discriminant function (DF2, S4) showed separation of infected and uninfected sample groups. After applying an arbitrary noise cut off to the loadings (0.05), features that contributed to separation were extracted for DF1 (n = 70) and DF2 (n = 50). | ||
| Fig. 4 Cross-validated PC-DFA (PCs = 8) scores plot illustrating separation between sample groups on DF1 and DF2. | ||
Features from DF2, which indicated differences between infected and uninfected cells (n = 34, Table 1), were screened using the univariate non-parametric Mann–Whitney-U test and 22 were found to have statistically significant changes in abundance between the two groups (Fig. 5). Two VOCs were decreased in infected cells compared to uninfected. All other features were significantly increased (n = 20), five of which were also increased in axenic S. aureus cultures (see Table 1).
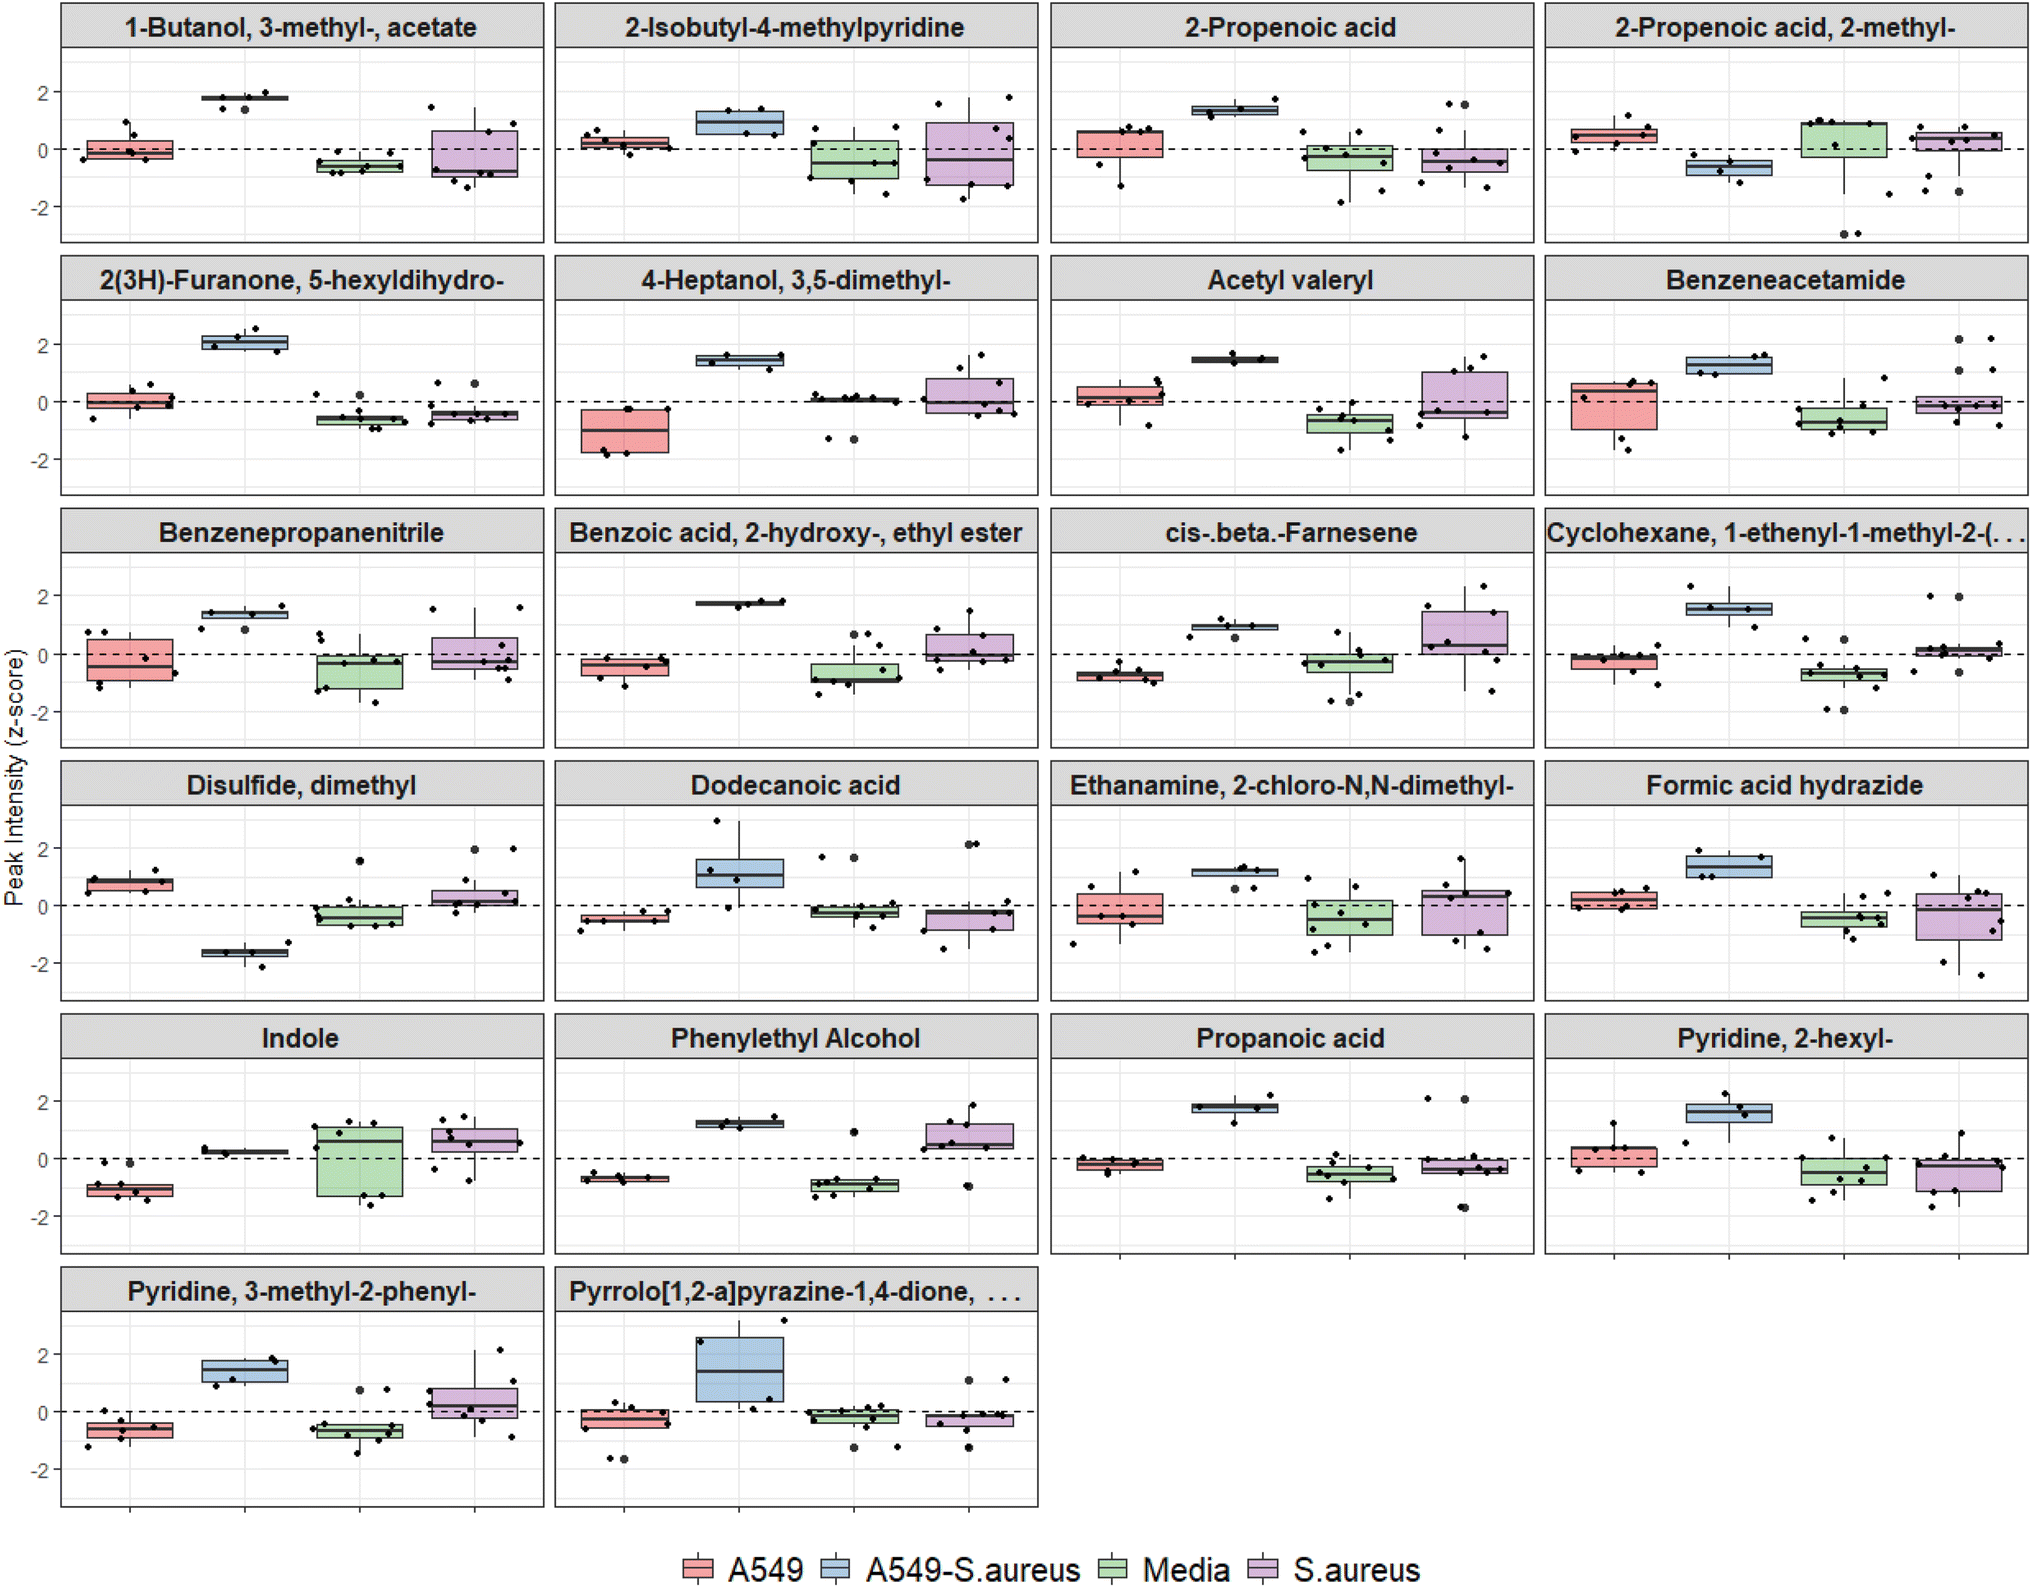 | ||
| Fig. 5 Boxplots of VOCs which are significantly different between infected and uninfected cells, showing all sample groups for comparison. Dashed line represents peak intensity mean after z-normalisation. | ||
| VOC name (NIST ID) | Quantifier m/z | NIST match factor | Retention time (min) | NIST library RIb | Calculated kovats RI | Detected in infection model | Detected in S. aureus cultures | Normalised peak intensity | p value | 95% CI lower | 95% CI upper | |||
|---|---|---|---|---|---|---|---|---|---|---|---|---|---|---|
| Mean | SD | Median | IQR | |||||||||||
| Values highlighted in Bold indicate statistically significant changes in abundance (α < 0.05).a Identified to metabolomics standards initiative level 1.b NIST library retention indices based on non-polar capillary column stationary phase (references in Table S1†). | ||||||||||||||
| Triethylamine | 101 | 87.0 | 3.44 | 711 | 693 | −0.101 | 0.978 | −0.545 | 1.754 | 0.171 | −0.099 | 2.235 | ||
| 2-Propenoic acid | 72 | 92.7 | 3.81 | NA | 721 | ↑ | 0.584 | 0.920 | 0.698 | 0.642 | 0.010 | −2.550 | −0.475 | |
| Propanoic acid | 74 | 89.9 | 3.82 | NA | 722 | ↑ | 0.566 | 1.045 | 0.009 | 1.811 | 0.010 | −2.379 | −1.397 | |
| 2,2′-Bioxirane | 57 | 81.9 | 3.94 | NA | 729 | −0.330 | 1.526 | 0.370 | 2.481 | 0.610 | −3.350 | 0.913 | ||
| Disulfide, dimethyla | 94 | 90.6 | 4.10 | 722 | 740 | ↓ | −0.190 | 1.310 | 0.436 | 2.388 | 0.010 | 2.031 | 2.991 | |
| Ethanamine, 2-chloro-N,N-dimethyl | 107 | 87.0 | 4.29 | 750 | 753 | ↑ | 0.349 | 0.968 | 0.629 | 1.606 | 0.038 | −2.602 | −0.085 | |
| 2-Propenoic acid, 2-methyl | 86 | 71.1 | 4.63 | 711 | 776 | ↓ | −0.012 | 0.717 | −0.015 | 0.839 | 0.010 | 0.347 | 1.935 | |
| Acetyl valeryl | 85 | 93.4 | 5.56 | 816 | 830 | ↑ | 0.622 | 0.836 | 0.658 | 1.352 | 0.010 | −2.296 | −0.696 | |
| Formic acid hydrazide | 60 | 72.4 | 5.94 | NA | 849 | ↑ | 0.687 | 0.711 | 0.530 | 0.917 | 0.010 | −1.918 | −0.538 | |
| Butanoic acid, 2-methyl | 74 | 82.9 | 6.31 | 894 | 868 | 0.638 | 1.259 | 0.111 | 0.719 | 0.171 | −3.833 | 0.281 | ||
| 1-Butanol, 3-methyl-, acetate | 70 | 92.4 | 6.42 | 867 | 874 | ↑ | 0.700 | 0.962 | 0.668 | 1.843 | 0.010 | −2.187 | −0.875 | |
| Cyclopent-4-ene-1,3-dione | 96 | 84.3 | 6.47 | 880 | 876 | 0.584 | 0.794 | 0.131 | 1.226 | 0.352 | −0.928 | 1.815 | ||
| 4-Heptanol, 3,5-dimethyl | 87 | 74.1 | 8.15 | NA | 958 | ↑ | −0.093 | 1.415 | −0.303 | 2.626 | 0.010 | −3.423 | −1.378 | |
| Furaneol | 128 | 84.5 | 10.11 | 1097 | 1052 | 0.391 | 1.035 | 0.389 | 1.200 | 0.171 | −0.201 | 2.563 | ||
| Phenylethyl alcohola | 91 | 98.2 | 11.36 | 1086 | 1112 | ↑ | ↑ | 0.097 | 0.990 | −0.541 | 1.764 | 0.010 | −2.114 | −1.675 |
| 4H-Pyran-4-one, 2,3-dihydro-3,5-dihydroxy-6-methyl | 144 | 79.8 | 11.97 | 1134 | 1143 | 0.239 | 0.802 | 0.201 | 0.752 | 0.762 | −0.664 | 1.982 | ||
| Dehydromevalonic lactone | 54 | 90.6 | 12.22 | 1169 | 1155 | 0.154 | 1.144 | −0.104 | 1.282 | 0.114 | −3.150 | 0.365 | ||
| 2-Isobutyl-4-methylpyridine | 107 | 90.3 | 12.27 | 1154 | 1158 | ↑ | 0.469 | 0.513 | 0.440 | 0.450 | 0.038 | −1.346 | −0.038 | |
| 3-(2-Hydroxyethyl)-2-oxazolidinone | 100 | 73.1 | 12.30 | NA | 1159 | 0.190 | 1.123 | −0.229 | 1.008 | 0.171 | −0.725 | 2.948 | ||
| Decanal | 82 | 89.1 | 13.22 | 1200 | 1205 | −0.086 | 0.752 | 0.078 | 0.598 | 0.067 | −0.063 | 2.038 | ||
| Benzenepropanenitrile | 91 | 95.3 | 13.82 | 1243 | 1237 | ↑ | 0.343 | 1.068 | 0.725 | 1.851 | 0.010 | −2.631 | −0.634 | |
| Benzoic acid, 2-hydroxy-, ethyl ester | 120 | 71.2 | 14.45 | 1249 | 1270 | ↑ | ↑ | 0.363 | 1.198 | −0.187 | 2.122 | 0.010 | −2.861 | −1.857 |
| Indolea | 90 | 95.6 | 14.88 | 1292 | 1293 | ↑ | −0.492 | 0.738 | −0.503 | 1.298 | 0.010 | −1.739 | −0.395 | |
| Benzoic acid, 4-chloro | 139 | 91.3 | 15.69 | NA | 1337 | 0.418 | 1.265 | −0.078 | 1.651 | 0.171 | −0.312 | 3.358 | ||
| n-Decanoic acid | 73 | 85.5 | 16.12 | 1387 | 1361 | 0.529 | 0.805 | 0.763 | 0.888 | 0.610 | −0.945 | 2.131 | ||
| Benzeneacetamide | 92 | 87.6 | 16.80 | 1412 | 1399 | ↑ | 0.376 | 1.102 | 0.639 | 0.747 | 0.010 | −2.938 | −0.280 | |
| cis-β-Farnesene | 93 | 84.4 | 17.71 | 1446 | 1453 | ↑ | ↑ | −0.093 | 0.879 | −0.473 | 1.629 | 0.010 | −2.017 | −1.190 |
| 2(3H)-Furanone, 5-hexyldihydro | 85 | 91.1 | 17.92 | 1463 | 1465 | ↑ | 0.800 | 1.154 | 0.410 | 1.964 | 0.010 | −2.747 | −1.414 | |
| Cyclohexane, 1-ethenyl-1-methyl-2-(1-methylethenyl)-4-(1-methylethylidene) | 93 | 76.0 | 19.49 | 1492 | 1562 | ↑ | ↑ | 0.433 | 1.096 | 0.090 | 1.572 | 0.010 | −2.674 | −0.999 |
| Dodecanoic acid | 129 | 94.5 | 19.53 | 1562 | 1564 | ↑ | 0.202 | 1.163 | −0.208 | 1.176 | 0.010 | −3.492 | −0.455 | |
| Pyridine, 3-methyl-2-phenyl | 168 | 86.8 | 20.09 | 1513 | 1598 | ↑ | ↑ | 0.191 | 1.129 | −0.151 | 1.713 | 0.010 | −2.794 | −1.217 |
| Pyridine, 2-hexyl | 93 | 72.9 | 24.79 | NA | 1915 | ↑ | 0.745 | 0.919 | 0.450 | 1.124 | 0.019 | −2.280 | −0.126 | |
| Pyrrolo[1,2-a]pyrazine-1,4-dione, hexahydro-3-(2-methylpropyl) | 154 | 73.0 | 24.88 | 1908 | 1921 | ↑ | 0.379 | 1.413 | 0.107 | 0.738 | 0.038 | −3.777 | −0.113 | |
| Octadecanoic acid | 284 | 92.5 | 27.69 | 2170 | 2111 | 0.051 | 1.054 | 0.322 | 0.268 | 0.476 | −1.252 | 2.544 | ||
4. Discussion
In this study, we found several VOCs associated with uninfected and infected alveolar epithelial cells in ALI cultures. VOCs were associated with the infection response alone and included VOCs also identified in axenic cultures of S. aureus. Therefore, these results demonstrate the diverse sources of VOCs in the infection process (i.e. bacterial infection and cell response) and are potentially good candidates as diagnostic biomarkers of the multiple contributors to infection pathogenesis.An assessment of PDMS material adsorption showed good reproducibility without degradation after 10 sequential desorption cycles of the same PDMS strip. Desorption between different PDMS strips was less reproducible (higher RSD). This may be due to minor inconsistencies between strip length and width. To minimise the number of water-logged samples, the dry purge time would require optimisation in future studies. When sampling from cell headspace, only seven compounds were observed to be consistent between two experiments conducted at different times and with different GC-MS methods. This shows that different analytical methods can impact on the total number of VOCs observed. Furthermore, improving sampling and analytical parameters, such as introducing a secondary polar GC column, will increase the abundance and range of detectable VOCs. For sampling headspace, researchers have developed multi-bed TFME films which may also increase the range of VOCs sampled from cultures.23
Cells were successfully infected with S. aureus as demonstrated by increased CFU post-infection, reduced pH in co-culture (i.e., acidification due to aerobic bacterial contamination), and reduced TEER suggesting membrane damage. Epithelial damage by S. aureus and subsequent membrane rupture resulting in leakage in ALI culture is consistent with previous studies using a similar airway infection model.24 Alcohol and fatty acid compounds were increased in the VOC profile of infected cells. Phenylethyl alcohol has previously been identified in S. aureus headspace.25 The VOC 1-hexanol 2-ethyl in ALI culture was also shown by previous studies investigating A549 cells.26 Fatty acids have been associated with the cell membrane phospholipid structure and their increased detection in infected cells may potentially be caused by membrane damage by S. aureus. Fatty acids are also found to control cell membrane integrity and biofilm dispersion in S. aureus.27–30 Aromatic volatiles were decreased under normal cell growth suggesting uptake from the media and have been reported in previous studies investigating A549 cells.26,31 Several methylated pyridine compounds were increased in infected cells compared to uninfected cells. Pyridine 3-methyl-2-phenyl was also detected in axenic S. aureus cultures. Pyridine is a potential marker for smoking and structurally associated with nicotine.32
Although it was expected that VOCs which are very volatile will not be captured by the PDMS sorbent, not all VOCs within the detectable range were consistent with previous literature. For example, dimethyl disulfide (DMDS), a VOC known to be emitted by S. aureus, was comparatively low in infected cells, which suggests altered metabolism during infection. Furthermore, DMDS is a ubiquitous VOC produced by several microbial and plant species and therefore has little value as a clinically useful diagnostic biomarker. However, further optimisation of the method (e.g. use of labelled sulfur-containing amino acids to track DMDS) is required to evaluate metabolic changes during infection. Culture conditions could be further improved by using primary cell culture, other cell types, by targeting specific bacterial and mammalian growth phases, and by collecting VOCs through dynamic or active sampling which has the advantage of measuring VOC metabolism in relation to VOC release time and rate.33,34 Finally, we recognise the use of immortalised mammalian cells lines such as A549 may not represent normal mammalian cell metabolism and response to infection and a more representative model would include patient-derived primary cells.
We demonstrated for the first time a direct VOC sampling method for ALI cultures of bacterial infection and using standard 2D culture well inserts. TFME is a highly versatile method31,35 and was applied to ALI cultures with minimal intervention, thus preserving routine mammalian lung cell propagation techniques. ALI culture is physiologically relevant and resembles the environment of the respiratory epithelium more closely than standard sedimented liquid cultures. Furthermore, ALI is an important tool to study the effects of nebulised drugs, exogenous pollutants and particulate matter on airway cells. Cultures can be further enhanced to develop a true lung infection model to include bronchial epithelial cells for cilia, goblet cells for mucus production, and include inflammatory cells for host response to xenobiotics.36
5. Conclusions
In this study we have detected VOCs characteristic of S. aureus infection in lung epithelial cells, using a novel approach which harnesses the adaptability of TFME to sample from a two-dimensional air–liquid interface culture model. We identified VOCs that are unique to S. aureus, and to infected and uninfected mammalian cells. These results demonstrate the potential for investigating VOCs as potential biomarkers of infection using complex two-dimensional culture models.Conflicts of interest
There are no conflicts to declare.Acknowledgements
We acknowledge the experimental support provided by Kai Wang and Professor Clare Mills at the Manchester Institute of Biotechnology and Dr John Blaikley and Dr Conal Hayton for donation of the immortalised cell line. E. B. also acknowledges the fellowship support of the European Cystic Fibrosis Society. W. A. and S. J. F. are supported by the NIHR-Manchester Biomedical Research Centre.References
- A. J. Fischer, S. B. Singh, M. M. LaMarche, L. J. Maakestad, Z. E. Kienenberger and T. A. Peña, et al., Sustained Coinfections with Staphylococcus aureus and Pseudomonas aeruginosa in Cystic Fibrosis, Am. J. Respir. Crit. Care Med., 2021, 203(3), 328–338 CrossRef PubMed.
- J. Vincent, J. Rello, J. Marshall, E. Silva, A. Anzueto and C. Martin, et al., International Study of the Prevalence and Outcomes of Infection in Intensive Care Units, J. Am. Med. Assoc., 2009, 302(21), 2323–2329 CrossRef CAS PubMed.
- D. Koulenti, E. Tsigou and J. Rello, Nosocomial pneumonia in 27 ICUs in Europe: perspectives from the EU-VAP/CAP study, Eur. J. Clin. Microbiol. Infect. Dis., 2017, 36(11), 1999–2006 CrossRef CAS PubMed.
- D. G. Wootton, S. J. Aston and T. W. Felton, The challenge of antimicrobial prescribing for hospital-acquired pneumonia, J. Hosp. Infect., 2020, 104(2), 198–199 CrossRef CAS PubMed.
- W. M. Ahmed, O. Lawal, T. M. Nijsen, R. Goodacre and S. J. Fowler, Exhaled Volatile Organic Compounds of Infection: A Systematic Review, ACS Infect. Dis., 2017, 3(10), 695–710 CrossRef CAS PubMed.
- L. D. J. Bos, P. J. Sterk and M. J. Schultz, Volatile Metabolites of Pathogens: A Systematic Review, PLoS Pathog., 2013, 9(5), e1003311 CrossRef CAS PubMed.
- A. H. Neerincx, B. P. Geurts, M. F. J. Habets, J. A. Booij, J. van Loon and J. J. Jansen, et al., Identification of Pseudomonas aeruginosa and Aspergillus fumigatus mono- and co-cultures based on volatile biomarker combinations, J. Breath Res., 2016, 10(1), 016002 CrossRef CAS PubMed.
- M. Nasir, H. D. Bean, A. Smolinska, C. A. Rees, E. T. Zemanick and J. E. Hill, Volatile molecules from bronchoalveolar lavage fluid can ‘rule-in’ Pseudomonas aeruginosa and ‘rule-out’ Staphylococcus aureus infections in cystic fibrosis patients, Sci. Rep., 2018, 8(1), 1–11 CAS.
- W. Filipiak, R. Beer, A. Sponring, A. Filipiak, C. Ager and A. Schiefecker, et al., Breath analysis for in vivo detection of pathogens related to ventilator-associated pneumonia in intensive care patients: a prospective pilot study, J. Breath Res., 2015, 9(1), 016004 CrossRef PubMed.
- C. L. Jenkins and H. D. Bean, Influence of media on the differentiation of Staphylococcus spp. By volatile compounds, J. Breath Res., 2020, 14(1), 016007 CrossRef PubMed.
- O. Lawal, H. Muhamadali, W. M. Ahmed, I. R. White, T. M. E. Nijsen and R. Goodacre, et al., Headspace volatile organic compounds from bacteria implicated in ventilator-associated pneumonia analysed by TD-GC/MS, J. Breath Res., 2018, 12(2), 026002 CrossRef PubMed.
- J. Zhu, H. D. Bean, M. J. Wargo, L. W. Leclair and J. E. Hill, Detecting bacterial lung infections: in vivo evaluation of in vitro volatile fingerprints, J. Breath Res., 2013, 7(1), 016003 CrossRef PubMed.
- H. D. Bean, J. Jimenez-Diaz, J. Zhu and J. E. Hill, Breathprints of model murine bacterial lung infections are linked with immune response, Eur. Respir. J., 2015, 45(1), 181–190 CrossRef PubMed.
- S. Traxler, G. Barkowsky, R. Saß, A. C. Klemenz, N. Patenge and B. Kreikemeyer, et al., Volatile scents of influenza A and S. pyogenes (co-)infected cells, Sci. Rep., 2019, 9(1), 1–12 CrossRef PubMed.
- O. Lawal, H. Knobel, H. Weda, L. D. Bos, T. M. E. Nijsen and R. Goodacre, et al., Volatile organic compound signature from co- culture of lung epithelial cell line with Pseudomonas aeruginosa, Analyst, 2018, 3148–3155 RSC.
- D. Baldassi, B. Gabold and O. M. Merkel, Air−Liquid Interface Cultures of the Healthy and Diseased Human Respiratory Tract: Promises, Challenges, and Future Directions, Adv. Biomed. Res., 2021, 1(6), 2000111 Search PubMed.
- M. Schivo, A. A. Aksenov, A. L. Linderholm, M. M. McCartney, J. Simmons and R. W. Harper, et al., Volatile emanations from in vitro airway cells infected with human rhinovirus, J. Breath Res., 2014, 8(3), 037110 CrossRef CAS PubMed.
- M. S. Yamaguchi, M. M. McCartney, A. L. Linderholm, S. E. Ebeler, M. Schivo and C. E. Davis, Headspace sorptive extraction-gas chromatography–mass spectrometry method to measure volatile emissions from human airway cell cultures, J. Chromatogr. B: Anal. Technol. Biomed. Life Sci., 2018, 1090(January), 36–42 CrossRef CAS PubMed.
- M. S. Yamaguchi, M. M. McCartney, A. K. Falcon, A. L. Linderholm, S. E. Ebeler and N. J. Kenyon, et al., Modeling cellular metabolomic effects of oxidative stress impacts from hydrogen peroxide and cigarette smoke on human lung epithelial cells, J. Breath Res., 2019, 13(3), 036014 CrossRef PubMed.
- M. Ashrafi, Y. Xu, H. Muhamadali, I. White, M. Wilkinson and K. Hollywood, et al., A microbiome and metabolomic signature of phases of cutaneous healing identified by profiling sequential acute wounds of human skin: An exploratory study, PLoS One, 2020, 15(2), e0229545 CrossRef CAS PubMed.
- W. M. Ahmed, P. Geranios, I. R. White, M. Bromley, O. Lawal and T. Nijsen, et al., Development of an adaptable headspace sampling method for metabolic profiling of the fungal volatome, Analyst, 2018, 4155–4162 RSC.
- L. W. Sumner, A. Amberg, D. Barrett, M. H. Beale, R. Beger and C. A. Daykin, et al., Proposed minimum reporting standards for chemical analysis, Metabolomics, 2007, 3(3), 211–221 CrossRef CAS PubMed.
- J. J. Grandy, E. Boyaci and J. Pawliszyn, Development of a Carbon Mesh Supported Thin Film Microextraction Membrane As a Means to Lower the Detection Limits of Benchtop and Portable GC/MS Instrumentation, Anal. Chem., 2016, 88(3), 1760–1767 CrossRef CAS PubMed.
- M. R. Kiedrowski, A. E. Paharik, L. W. Ackermann, A. U. Shelton, S. B. Singh and T. D. Starner, et al., Development of an in vitro colonization model to investigate Staphylococcus aureus interactions with airway epithelia, Cell. Microbiol., 2016, 18(5), 720–732 CrossRef CAS PubMed.
- G. Preti, E. Thaler, C. W. Hanson, M. Troy, J. Eades and A. Gelperin, Volatile compounds characteristic of sinus-related bacteria and infected sinus mucus: Analysis by solid-phase microextraction and gas chromatography-mass spectrometry, J. Chromatogr. B: Anal. Technol. Biomed. Life Sci., 2009, 877(22), 2011–2018 CrossRef CAS PubMed.
- R. Thriumani, A. Zakaria, Y. Z. H. Y. Hashim, A. I. Jeffree, K. M. Helmy and L. M. Kamarudin, et al., A study on volatile organic compounds emitted by in vitro lung cancer cultured cells using gas sensor array and SPME-GCMS, BMC Cancer, 2018, 18(1), 1–17 CrossRef PubMed.
- C. N. H. Marques, D. G. Davies and K. Sauer, Control of biofilms with the fatty acid signaling molecule cis-2-Decenoic acid, Pharmaceuticals, 2015, 8(4), 816–835 CrossRef CAS PubMed.
- D. G. Davies and C. N. H. Marques, A fatty acid messenger is responsible for inducing dispersion in microbial biofilms, J. Bacteriol., 2009, 191(5), 1393–1403 CrossRef CAS PubMed.
- M. W. Frank, S. G. Whaley and C. O. Rock, Branched-chain amino acid metabolism controls membrane phospholipid structure in Staphylococcus aureus, J. Biol. Chem., 2021, 297(5), 1–14 CrossRef PubMed.
- X. Chen, W. Ping Teoh, M. R. Stock, Z. J. Resko and F. Alonzo, Branched chain fatty acid synthesis drives tissue-specific innate immune response and infection dynamics of Staphylococcus aureus, PLoS Pathog., 2021, 17(9), 1–22 Search PubMed.
- W. Filipiak, K. Jaroch, P. Szeliska, K. Żuchowska and B. Bojko, Application of thin-film microextraction to analyze volatile metabolites in a549 cancer cells, Metabolites, 2021, 11(10), 704 CrossRef CAS PubMed.
- V. Kapishon, G. K. Koyanagi, V. Blagojevic and D. K. Bohme, Atmospheric pressure chemical ionization mass spectrometry of pyridine and isoprene: potential breath exposure and disease biomarkers, J. Breath Res., 2013, 7(2), 026005 CrossRef CAS PubMed.
- A. Baranska, A. Smolinska, A. W. Boots, J. W. Dallinga and F. J. van Schooten, Dynamic collection and analysis of volatile organic compounds from the headspace of cell cultures, J. Breath Res., 2015, 9(4), 047102 CrossRef CAS PubMed.
- W. M. Ahmed, P. Geranios, I. R. White, M. Bromley, O. Lawal and T. Nijsen, et al., Development of an adaptable headspace sampling method for metabolic profiling of the fungal volatome, Analyst, 2018, 143, 4155–4162 RSC.
- T. Koehler, I. Ackermann, D. Brecht, F. Uteschil, J. Wingender and U. Telgheder, et al., Analysis of volatile metabolites from in vitro biofilms of Pseudomonas aeruginosa with thin-film microextraction by thermal desorption gas chromatography-mass spectrometry, Anal. Bioanal. Chem., 2020, 412(12), 2881–2892 CrossRef CAS PubMed.
- V. V. Thacker, N. Dhar, K. Sharma, R. Barrile, K. Karalis and J. D. McKinney, A lung-on-chip infection model reveals protective and permissive roles of alveolar epithelial cells in tuberculosis, bioRxiv, 2020.
Footnote |
| † Electronic supplementary information (ESI) available. See DOI: https://doi.org/10.1039/d2an01205g |
| This journal is © The Royal Society of Chemistry 2023 |