 Open Access Article
Creative Commons Attribution 3.0 Unported Licence
From rectangular to diamond shape: on the three-dimensional and size-dependent transformation of patterns formed by single particles trapped in microfluidic acoustic tweezers
Zhichao
Deng
 a,
Vijay V.
Kondalkar
b,
Christian
Cierpka
 a,
Hagen
Schmidt
 *b and
Jörg
König
 *a
*a
aInstitute of Thermodynamics and Fluid Mechanics, Technische Universität Ilmenau, Ilmenau, Germany. E-mail: joerg.koenig@tu-ilmenau.de
bLeibniz Institute for Solid State and Materials Research Dresden, SAWLab Saxony, Dresden, Germany. E-mail: h.schmidt@ifw-dresden.de
First published on 28th March 2023
Abstract
Generally, the pattern formed by individual particles trapped inside a microfluidic chamber by a two-dimensional standing acoustic wave field has been considered only the result of the acoustic radiation force. Previous studies showed that particles can be trapped at the local minima and maxima of the first-order pressure and velocity fields. Thus, either a rectangular or a diamond pattern can be formed solely depending on the particle size, when the acoustic field is unchanged, and the material properties of the particles and the fluid are fixed. In this paper, we report about the co-existence of different patterns with particles of the same size. The actual shape of the patterns depends mainly on the ratio between particle diameter and wavelength. In addition, particles were found to be trapped at locations that coincide with the position of antinodes, even though the particles have a positive acoustic contrast factor. These phenomena imply that the trapping of individual particles cannot be described by the acoustic radiation force solely. Hence, further research is required, taking the viscous drag force caused by the fluid flow induced by the acoustic streaming effect into account.
1 Introduction
The concept of aligning small objects into regular, equidistant patterns by means of surface acoustic waves (SAW) has gained a growing interest in the past few years. Studies concerning a variety of perspectives were carried out. The patterning either in 1D lines or 2D arrays can be realized by using a 1D traveling SAW,1 1D standing surface acoustic wave (sSAW)2 or 2DsSAW.3 Either living matters like microorganisms, cells and tissues,4 or objects like immiscible droplets,5 glass fibers,6 and carbon nanotubes7 have been patterned. They were either gathered as clusters8 or separated individually,9 depending on the application. This concept brought great benefits to different disciplines, including flow cytometry,10 cell culture,11 and tissue engineering,12 among others. One application scenario is the patterning of individual cells by means of a 2DsSAW field, with which a high throughput analysis on single cell level is possible.9 The mechanism behind this technique was well-studied in the discipline of acoustofluidics.13,14 Generally speaking, if a spherical particle can be considered as a model of the cell, two types of forces exert on the particle. One is the acoustic radiation force (ARF) caused by the interaction between the incident and the scattered acoustic wave field. The other is the viscous drag force caused by the acoustically induced fluid flow, i.e. acoustic streaming (AS). Despite the existence of many complex effects in reality, the most fundamental principle hidden behind the regular, equidistant pattern is the spatially periodically repeating nature of the harmonic acoustic field.The formation of most of the particle patterns in a 2DsSAW-field can be well explained based on a theoretical framework proposed by Oberti et al. considering only the effect of the ARF.15 The ARF can be regarded as the gradient of the Gor'kov potential FARF = −∇〈U〉,16 where 〈U〉 has the expression of:
 | (1) |
 and
and  are the monopole and dipole scattering coefficients related to the compressibilities κp, κf, and densities ρp and ρf of the particle and the fluid, respectively. The two scalar fields 〈p12〉 and 〈v12〉 are the mean square fluctuation of the first-order pressure and velocity field, which give rise to the monopole and dipole scattering.
Assuming an ideal 2DsSAW with the wavelength λSAW, speed of sound c and amplitude p0 in two orthogonal directions x and y, the resulting Gor'kov potential 〈U〉 in normalized form is depicted in Fig. 1, illustrating the acoustic landscape. From eqn (1), one can tell that the Gor'kov potential is the linear combination of 〈p12〉 and 〈v12〉. Thus, as depicted in Fig. 1, the particles shall be trapped at those potential minima coinciding with either the local minima of 〈p12〉 i.e. nodes and antinodes (in the case of a negative acoustic contrast factor), or local minima of −〈v12〉, denoted as midpoints in Fig. 1. This analysis is valid only with the assumption of a particle size smaller than the Rayleigh limit.14 Recently, the discussion of patterning was extended to larger particle sizes. The inter-particle secondary acoustic radiation force was considered and the limitation of Rayleigh scattering was unleashed, both for a 2D standing bulk acoustic wave (BAW) driven system17 and for a 2DsSAW driven system.18 In both systems, it was presented that particles could be trapped at nodes, antinodes or midpoints, which implied that all three patterns depicted in Fig. 1 as black diamond, pink diamond and square markers could be formed. The key factors determining the trapping locations are the ratio of particle diameter to SAW wavelength ξ = dp/λSAW and the two constants f1 and f2. In theory, a transformation of the patterns is possible only with varying the above-mentioned three parameters. The transformation of patterns with respect to ξ was reported in several recent experimental studies. For instance, with a very small ξ ≪ 1, clusters of particles were trapped at the nodal lines denoted as solid lines in Fig. 1 and formed a net-like grid.8,19 With a slightly larger ratio of ξ = 0.083, individual particles were collected in the oval-shaped potential wells located at the midpoints and formed a rectangular pattern.20 Further increasing ξ to about 0.3, individual particles were trapped at the pressure nodes and formed a diamond pattern.9 To our best knowledge, a diamond patterning of small objects trapped at antinodes with a positive acoustic contrast factor was not shown so far. Besides, the formation of the patterns was still limited to 2D in the theoretical framework and the pattern formation in 3D remained unexplored.
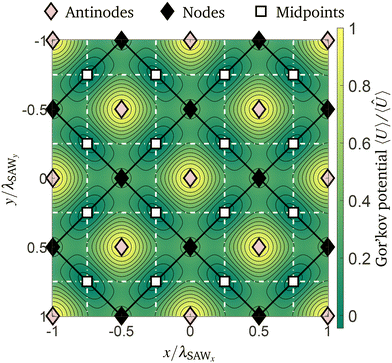 | ||
| Fig. 1 Contour plot of the normalized Gor'kov potential 〈U〉/〈Û〉 determined with scattering coefficients f1 = 0.7684 and f2 = 0.034 adopted from Oberti et al.,15 in an ideal 2D standing acoustic wave field. Markers represent possible particle trapping locations, namely the pressure nodes (black diamond marker), the antinodes (pink diamond marker) and the midpoints (square marker). | ||
Therefore, the effect of ξ on the 3D pattern formation and transformation was studied experimentally, employing two SAW devices with two different wavelengths λSAW, in which particles of different diameters dp were trapped. To measure the three-dimensional trapping locations of the particles and to characterize the geometrical features of the patterns formed within the micro chambers, astigmatism particle tracking velocimetry (APTV)21,22 was applied. The experimental setup, measurement procedures and obtained results will be described in detail as follows.
2 Experimental
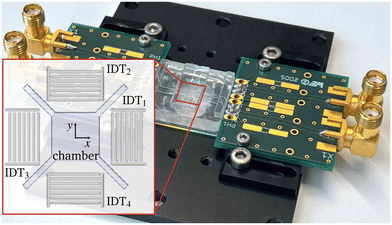
For the experiments, two SAW devices of different sizes and acoustic wavelengths, but with the same design configuration and materials, were used. Both consist of a SAW chip and a microfluidic chamber bonded on top, as shown in Fig. 2. The SAW chips are made of 128° rotated Y-cut of lithium niobate (LiNbO3). Two pairs of uniform interdigital transducers (IDTs) are arranged along the X + 0° and X + 90° orientations of the crystal, which correspond to the y- and x-directions of the chosen coordinate system, respectively. To excite four SAWs with comparable surface displacement amplitude at a common resonant frequency fR, the number of IDT finger electrodes and the wavelengths in the two orientations slightly differ from each other due to the different coupling coefficients and phase velocities in both directions. The resonant frequencies were designed to be 32.40 MHz and 115.25 MHz for the SAW devices with large and small dimensions, respectively. The design parameters of both SAW devices are listed in Table 1.| f R in MHz | λ SAWx in μm | λ SAWy in μm | |
|---|---|---|---|
| Large device | 32.40 | 112 | 120 |
| Small device | 115.25 | 31 | 34 |
The microfluidic chambers have the dimensions of 1200 × 1200 × 88 μm3 (large device) and 340 × 340 × 50 μm3 (small device). They were made of polydimethylsiloxane (PDMS, Sylgard 184, Dow Corning) by mold-assisted casting using a silicon master. To improve the adhesion of the chamber to the chips, the bonding was supported by a surface activation with UV/ozone plasma. The bonding was carried out manually under a microscope to ensure precise alignment between the IDT structure and the PDMS chamber. Detailed information regarding the designing concepts and the manufacturing process can be found in previous studies.20,23 To excite a characteristic 2DsSAW-field at the region of the PDMS chamber, a signal generator with an integrated power amplifier (PowerSAW, SAW Generator BSG-F20, BelektroniG) was used.
Each of both channels was connected to one pair of opposing IDTs with a splitter (SYPS-2-52HP+, Mini-Circuits). The operating frequency of the signal generator was fixed to the resonant frequency of the corresponding SAW device. In addition, to account for the different sizes and frequencies, the applied electrical power was set to 0.1 W and 1.6 W for the small and large SAW device, respectively. During excitation of the 2DsSAW, the signal generator ensured very comparable surface displacements of the SAWs in both directions, by using two phase- and frequency-coupled output channels with individually adjustable power levels. Particles made of polystyrene (1.05 g cm−3) and labeled with a fluorescent dye (PS-FluoRed, EX530 nm/EM607 nm, microParticles GmbH) with five different diameters were used as objects to be trapped. The diameter of the particles dp and the resulting ξ depending on the SAW device used are listed in Table 2. The particle-size-to-wavelength ratio discussed here is determined by the wavelength λSAWy of the SAW in y-direction. These particles were suspended in DI-water containing polysorbate 80 of 0.2% v/v, and introduced into the microfluidic chamber with a syringe pump (neMESYS 290 N, Cetoni).
| d p in μm | 2.5 | 5 | 10 | 19 | 33 |
|---|---|---|---|---|---|
| ξ in large device | — | — | 0.083 | 0.158 | 0.275 |
| ξ in small device | 0.074 | 0.147 | 0.294 | — | — |
For the 3D characterization of the trapping locations of the particles inside the chambers, the SAW devices were placed on top of an inverse microscope (Axio Observer 7, Zeiss GmbH) equipped with a high-power LED at a central wavelength of 525 nm (Solis525C, Thorlabs Inc.) for illumination and an sCMOS camera (LaVision GmbH) for detection. Details regarding microscope objective, optical filters and cylindrical lens used to induce astigmatism can be found in our previous publication.20
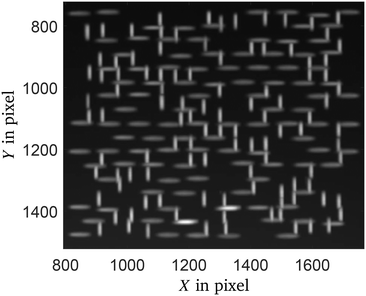
To characterize the patterns of individual trapped particles, only a low concentration of particles was used to avoid particle agglomerations. Therefore, measurements were repeated several times under identical conditions for each SAW device and each specific particle size. Before every measurement run, the particle suspension was aspirated into the chamber, and then the in/outlets of the micro chamber were closed. At each measurement run, 15 minutes were waited to let the particles be sedimented on the substrate surface at random positions before 100 images were captured with a frame rate of 10 Hz. With this image sequence, the initial height of the particles was used to determine the baseline height and correct a slight tilting angle between the substrate and the horizontal measurement plane. Then the SAW device was turned on, and the particles were trapped. The 3D trapping locations of all individual particles detected within each measurement run were determined and ensemble averaged afterwards, to obtain a more complete particle pattern. An example of particle images detected with APTV in the microfluidic chamber of the small device is shown in Fig. 3. According to the principle of APTV, the particle images appear elliptically shaped depending on the height position of the particles. Considering the shape of the particle images, the particles were trapped obviously in two different heights with different pattern formation. For details about particle image detection and subsequent evaluation of the 3D particle locations as well as particle position uncertainty applying APTV, we refer to previous publications.24–26
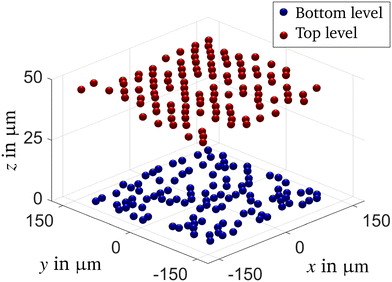
To better visualize the measurement data, trapping locations detected in different time steps and different measurement runs were clustered and averaged based on their 3D coordinates by applying Ward's method integrated in the built-in linkage and cluster functions offered in MATLAB.27 An example of a three-dimensional measurement result is depicted in Fig. 4, obtained with particles of dp = 5 μm in size trapped within the microfluidic chamber of the small SAW device. At this configuration, the height of the chamber is almost four times larger than the bulk acoustic wavelength, which is why particles were trapped within a bottom and a top level close to the substrate surface and ceiling of the microfluidic chamber, respectively. The different height levels result from the three-dimensional acoustic pressure field within the fluid, with local pressure minima close to the substrate surface as well as pressure nodes and antinodes above.20 Here, 107 and 108 trapping locations were detected at the bottom and top level, respectively. Although not all possible trapping locations were occupied by a particle, it is already obvious that particles were arranged differently in both height levels, i.e. different particle patterns obviously coexist. The result will be discussed more in detail later on.
Since the standard deviations of trapping locations after the ensemble average are around a few micrometers and much smaller than the distances between trapping locations, only the mean values of the trapping locations will be discussed. The periodicity of the pattern was estimated by computing the distances matrix between every trapping location to all other trapping locations and applying a Gaussian fit to the histogram of the distance matrix.
3 Results and discussion
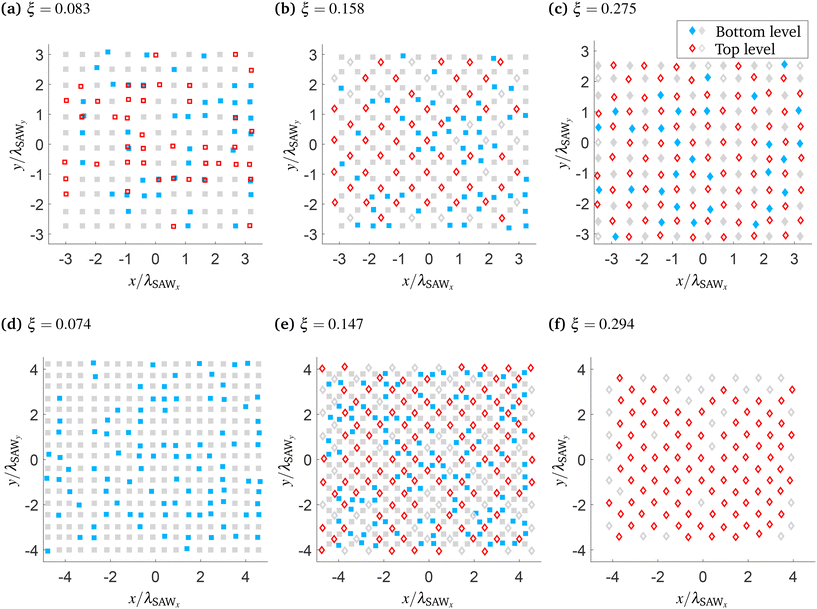
The measured particle trapping locations in the large and the small SAW device with different sizes of particles are shown in Fig. 5. In all subfigures, the scatter points represent the averaged lateral locations of the trapped particles. Depending on the particle-size-to-wavelength ratio ξ and the actual SAW device used, particles were trapped at different height positions. However, at most two particle levels in height were determined in each configuration. To discriminate between them also in Fig. 5, the corresponding markers are either empty or filled. Here, filled markers indicate particle trapping locations at the bottom level (close to the SAW chip), while empty markers indicate particle trapping locations at the top level (levitated, either floating in the fluid or close to the ceiling). For better recognition of the patterns, particle trapping locations at which particles were not detected during the experiments are filled in with markers colored light gray.In the first row, patterns formed in the large device are depicted with increasing particle-size-to-wavelength ratio ξ from left to right. As shown in Fig. 5a, at a ratio ξ of 0.083 (dp = 10 μm), two rectangular patterns were found in both height levels. The measured height positions for the bottom and top level amount to z = 4.9 ± 1.6 μm and z = 19.9 ± 2.6 μm,† respectively. The distance in height is close to the half of the bulk acoustic wavelength in the fluid of ∼22.5 μm. The spatial periodicities of the lateral particle trapping locations are dx = 57 μm and dy = 60 μm, matching quite well to the half of the SAW wavelengths in x- and y-direction, respectively. Therefore, it is reasonable to normalize the coordinates by λSAW, as done in all sub-figures. Besides, both patterns overlapped well with each other, indicating no phase shift between both height levels and confirming previous results.20 Considering the rectangular shape and the spatial periodicity, these trapping locations correspond to the midpoints of the acoustic force potential field depicted in Fig. 1.
At an intermediate particle-size-to-wavelength ratio of ξ = 0.158 (dp = 19 μm), depicted in Fig. 5b, a rectangular pattern was found for the bottom level at z = 9.6 ± 2.6 μm. However, unlike in the former case, at which the top level was located within a distance close to the half of the bulk acoustic wavelength, the second pattern was levitated close to the ceiling of the micro chamber at z = 62.9 ± 2.4 μm. Besides, the pattern formed at the top level is of a diamond shape, even though particles of the same size were trapped. The shortest distance between two trapping locations aligns along the diagonal direction with an average spacing of ∼84 μm, close to  times of the λSAW. The coexistence of both patterns in the same device for the same parameters (ξ, f1 and f2) can only be partly explained by the model proposed by Baasch and Dual.18 According to their analysis considering the influence of the ARF only, particles with a positive contrast factor can be trapped either at nodal positions or at the midpoints depending on ξ. By tuning this characteristic parameter, either a diamond or rectangular pattern can be obtained. However, according to the result depicted in Fig. 5b, particles with a constant ξ can be trapped in a rectangular and diamond particle pattern at the same time, but at different height levels. Obviously, the explanations given to date, considering the influence of the ARF solely, do not hold generally. Meanwhile, in several numerical and experimental investigations of the acoustic streaming effect, a fluid flow with a considerable velocity was reported,28–30 which may allow particles to be displaced from their predicted trapping locations. However, measurements of the fluid flow will be required to verify it finally.
In this context, the patterns obtained at the largest ratio of ξ = 0.275 (dp = 33 μm) can neither be adequately explained by the currently existing models. As shown in Fig. 5c, two diamond patterns were formed, not only at the top level (z = 45.6 ± 12.6 μm), but also at the bottom level (z = 16.8 ± 2.7 μm). Interestingly, they are out of phase, meaning that they are shifted to each other about half of the λSAW in x- and y-direction. Although the acoustic landscape depicted in Fig. 1 is only on the lateral plane, several numerical studies20,31,32 showed that the relative location of the nodes, antinodes and midpoints would not vary with height. Hence, either the particle trapping locations at the bottom or at the top level shall coincide with the lateral locations of the antinodes, according to Fig. 1. To determine the relationship between both patterns and the acoustic pressure distribution, a reference point is needed, which may be obtained by in situ measurements of the acoustic wave field.20,23
Similar results were observed at a comparable particle-size-to-wavelength ratio ξ in the small SAW device, as depicted in the figures in the second row. In Fig. 5d, only one pattern formed at the bottom level was found (z = 0.9 ± 2.2 μm) for the smallest ratio of ξ = 0.074 (dp = 2.5 μm). In the case of an intermediate ratio ξ = 0.147 (dp = 5 μm), again, the particle trapping positions formed a rectangular pattern at the bottom level (z = 2.2 ± 0.8 μm) and a diamond pattern at the top level (z = 45.7 ± 1.0 μm), see Fig. 5e. As for the largest ratio ξ = 0.294 (dp = 10 μm), particles were mostly trapped in the top level close to the ceiling of the chamber (z = 43.5 ± 1.4 μm) and formed a diamond pattern, see Fig. 5f. Although the pattern formed at the top level in Fig. 5d and the pattern formed at the bottom level in Fig. 5f are missing, a transformation of the rectangular pattern to the diamond pattern with an increasing particle-size-to-wavelength ratio ξ can be confirmed by the measurement results in the small SAW device.
4 Conclusions
In this article, we report the measured 3D locations of the particles trapped in 2D standing SAW devices and discuss the different patterns formed. A transformation from the rectangular pattern to the diamond pattern with an increasing ratio between the particle diameter and the SAW wavelength was found, which matches theoretical predictions. However, in the case of an intermediate particle-size-to-wavelength ratio of ξ about 0.15, both types of patterns can be found simultaneously at different heights with identical acoustic settings and material properties of the particles and the fluid. Moreover, the patterns formed with a comparably large particle-size-to-wavelength ratio ξ of almost 0.3 in the large SAW device indicated the trapping of particles both on the pressure nodes and antinodes, while the acoustic contrast factor was unchanged. These phenomena cannot be explained by the analytical models published to date. From the perspective of a fundamental understanding of the patterning mechanism, the results reported herein imply that further research is required, including the in situ measurement of the acoustic wave field for relating particle patterns to the distribution of the acoustic force potential, and the influence of the viscous drag force caused by the fluid flow induced by the acoustic streaming effect. For this, measurements of the particle trapping locations and the three-dimensional fluid flow inside the microfluidic chamber need to be supported by numerical simulations. In that way, fundamental understanding is gained regarding not only the interplay between the acoustic radiation force, drag force, buoyancy as well as inter-particle forces but also of designing parameters like the height of the microfluidic chamber. Here, the ratio between height of the microfluidic chamber and bulk acoustic wavelength is about two and four in the large and small device, respectively. Regardless of this difference, the same behavior regarding the formation and the transition of the particle patterns was found in the experiments. However, a reliable numerical model would allow a rapid and a more detailed investigation of those parameters as also of importance from the application side. From the perspective of applications, the discovered phenomena can be helpful for many disciplines ranging from separation processes to cell screening. For instance, the simultaneous trapping of cells in different patterns at different heights promises an improved single-cell analysis with high throughput as well as a size- and species-selective patterning in individual virtual wells, which may speed up the isolation and analysis of phenomena affecting only a very small fraction of a cell population.Author contributions
J. K., H. S., C. C. contributed to the conceptualization of the research project. J. K., Z. D., V. V. K. developed the methodology. Z. D., V. V. K. implemented the measurements, Z. D., J. K. realized the visualization of the results. J. K., C. C., H. S. supervised the research project. Z. D. wrote the original draft of the manuscript. All authors were involved in the reviewing and editing of the manuscript.Conflicts of interest
There are no conflicts to declare.Acknowledgements
The authors are grateful to Christian Koppka, Manuela Breiter, Joachim Döll, David Schreier and Arne Albrecht from the Center of Micro- and Nanotechnology (ZMN) at Technische Universität Ilmenau as well as to Dina Bieberstein and Andreas Büst from Leibniz Institute for Solid State and Materials Research Dresden for their support during fabrication of the SAW devices, and Robert Weser for fruitful discussions. Funding: Z. D., J. K. and C. C. received funding from German Research Foundation under grant CI 185/6-1. V. V. K. and H. S. received funding from German Research Foundation under grant SCHM 2365/17-1.Notes and references
- A. Fakhfouri, C. Devendran, A. Ahmed, J. Soria and A. Neild, Lab Chip, 2018, 18, 3926–3938 RSC.
- J. Shi, X. Mao, D. Ahmed, A. Colletti and T. J. Huang, Lab Chip, 2008, 8, 221–223 RSC.
- J. Shi, D. Ahmed, X. Mao, S.-C. S. Lin, A. Lawit and T. J. Huang, Lab Chip, 2009, 9, 2890–2895 RSC.
- A. Guex, N. Di Marzio, D. Eglin, M. Alini and T. Serra, Mater. Today Bio, 2021, 10, 100110 CrossRef CAS PubMed.
- L. Tian, N. Martin, P. G. Bassindale, A. J. Patil, M. Li, A. Barnes, B. W. Drinkwater and S. Mann, Nat. Commun., 2016, 7, 1–10 Search PubMed.
- M.-S. Scholz, B. W. Drinkwater, T. M. Llewellyn-Jones and R. S. Trask, IEEE Trans. Ultrason. Ferroelectr. Freq. Control, 2015, 62, 1845–1855 Search PubMed.
- Z. Ma, J. Guo, Y. J. Liu and Y. Ai, Nanoscale, 2015, 7, 14047–14054 RSC.
- H. Pan, D. Mei, C. Xu, S. Han and Y. Wang, Lab Chip, 2023, 23, 215–228 RSC.
- D. J. Collins, B. Morahan, J. Garcia-Bustos, C. Doerig, M. Plebanski and A. Neild, Nat. Commun., 2015, 6, 1–11 Search PubMed.
- M. D. Ward and G. Kaduchak, Curr. Protoc. Cytom., 2018, 84, e36 Search PubMed.
- B. Chen, Y. Wu, Z. Ao, H. Cai, A. Nunez, Y. Liu, J. Foley, K. Nephew, X. Lu and F. Guo, Lab Chip, 2019, 19, 1755–1763 RSC.
- V. Serpooshan, P. Chen, H. Wu, S. Lee, A. Sharma, D. A. Hu, S. Venkatraman, A. V. Ganesan, O. B. Usta and M. Yarmush, et al. , Biomaterials, 2017, 131, 47–57 CrossRef CAS PubMed.
- H. Bruus, Lab Chip, 2012, 12, 20–28 RSC.
- H. Bruus, Lab Chip, 2012, 12, 1014–1021 RSC.
- S. Oberti, A. Neild and J. Dual, J. Acoust. Soc. Am., 2007, 121, 778–785 CrossRef CAS PubMed.
- L. P. Gor'kov, Sov. Phys. Dokl., 1962, 773–775 Search PubMed.
- G. T. Silva, J. H. Lopes, J. P. Leão-Neto, M. K. Nichols and B. W. Drinkwater, Phys. Rev. Appl., 2019, 11, 054044 CrossRef CAS.
- T. Baasch and J. Dual, J. Acoust. Soc. Am., 2018, 143, 509–519 CrossRef PubMed.
- F. Guo, P. Li, J. B. French, Z. Mao, H. Zhao, S. Li, N. Nama, J. R. Fick, S. J. Benkovic and T. J. Huang, Proc. Natl. Acad. Sci. U. S. A., 2015, 112, 43–48 CrossRef CAS PubMed.
- R. Weser, Z. Deng, V. V. Kondalkar, A. N. Darinskii, C. Cierpka, H. Schmidt and J. König, Lab Chip, 2022, 22, 2886–2901 RSC.
- C. Cierpka and C. J. Kähler, J. Visualization, 2012, 15, 1–31 CrossRef CAS.
- R. Barnkob, C. Cierpka, M. Chen, S. Sachs, P. Mäder and M. Rossi, Meas. Sci. Technol., 2021, 32, 094011 CrossRef CAS.
- R. Weser, A. Winkler, M. Weihnacht, S. Menzel and H. Schmidt, Ultrasonics, 2020, 106, 106160 CrossRef CAS PubMed.
- J. König, M. Chen, W. Rösing, D. Boho, P. Mäder and C. Cierpka, Meas. Sci. Technol., 2020, 31, 074015 CrossRef.
- C. Cierpka, R. Segura, R. Hain and C. J. Kähler, Meas. Sci. Technol., 2010, 21, 045401 CrossRef.
- Z. Deng, J. König and C. Cierpka, Meas. Sci. Technol., 2022, 33, 115301 CrossRef.
- J. H. Ward Jr, J. Am. Stat. Assoc., 1963, 58, 236–244 CrossRef.
- S. Sachs, M. Baloochi, C. Cierpka and J. König, Lab Chip, 2022, 22, 2011–2027 RSC.
- S. Sachs, C. Cierpka and J. König, Lab Chip, 2022, 22, 2028–2040 RSC.
- F. Guo, Z. Mao, Y. Chen, Z. Xie, J. P. Lata, P. Li, L. Ren, J. Liu, J. Yang and M. Dao, et al. , Proc. Natl. Acad. Sci. U. S. A., 2016, 113, 1522–1527 CrossRef CAS PubMed.
- C. Devendran, T. Albrecht, J. Brenker, T. Alan and A. Neild, Lab Chip, 2016, 16, 3756–3766 RSC.
- C. Devendran, D. J. Collins and A. Neild, Microfluid. Nanofluid., 2022, 26, 1–14 CrossRef.
Footnote |
| † The uncertainty of the averaged trapping height represents two times the standard deviation of the measured height positions. |
| This journal is © The Royal Society of Chemistry 2023 |

