 Open Access Article
Creative Commons Attribution 3.0 Unported Licence
Detection & identification of hazardous narcotics and new psychoactive substances using Fourier transform infrared spectroscopy (FTIR)
Samuel F.
Williams
 *a,
Robert
Stokes
b,
Pik Leung
Tang
b and
Ana M.
Blanco-Rodriguez
b
aDepartment of Infection, Immunity & Cardiovascular Disease, The University of Sheffield, Sheffield, UK. E-mail: sfwilliams2@sheffield.ac.uk
bAgilent Technologies, Sheffield, UK
First published on 12th June 2023
Abstract
According to the latest World Drug Report, released by the United Nations Office on Drugs and Crime (UNODC), drug use is up 30% over the past decade and there are more drugs, and more types of drugs, than ever. Herein we use Fourier Transform Infrared Spectroscopy (FTIR) for the rapid ID of narcotics in a range of concentrations – from pure forms (as it is likely to be smuggled & transported) to street forms, often mixed with conventional cutting agents. Using FTIR, 75% of “street sample” narcotics were rapidly identified, and the effects of cutting agents on identification (ID) were also investigated. The limit of detection of MDMA was assessed, with a correct ID shown from 25% w/v. Concentration was correlated with Hit Quality Index, showing the capability of FTIR use in concentration estimation.
Introduction
Consumption of illicit drugs is on the rise globally. As of the latest report from the United Nations Office on Drugs and Crime, a predicted 5.4% of the global population aged 15–64, around 269 million people, consumed an illegal drug during 2018. By 2030 an 11% increase of annual drug users is predicted, based solely on population growth. However the link between urbanisation and drug use, due to increased unemployment, poverty and crime rates in more urbanised areas, will likely mean a further increase in drug users, as more and more areas become urbanised to keep up with the demands of the ever-increasing human population.1 Cannabis was used by around 200 million people in 2019, making it the most popular drug globally, compared to 62 million users of opioids. However, opioids accounted for an estimated loss of 18 million “healthy” years of life lost due to causing disability or premature death, making the opioid class of drugs the greatest threat to life.1In the UK the illicit drugs market is estimated to be worth around £9.4 billion per year and drug poisoning deaths are currently at record levels.2 4400 deaths in England and Wales were recorded due to drug misuse in 2019 according to the Office of National Statistics, increasing to 4561 deaths in 2020, 60.9% higher than a decade earlier in 2010. Opiates, such as heroin and morphine, accounted for just under half, 49.6%, of overdoses in England and Wales.3,4 In response to the findings that current drug misuse costs the UK £20 billion per year, the UK government has promised a 10 year plan, investing over £3 billion, targeted at breaking drugs supply chains, expanding the treatment of current addicts and improving socioeconomic conditions of society to prevent onset of addiction before it begins. The UK government has stated that by 2025 it hopes to have prevented 1000 early deaths due to drug misuse and increased capacity for treating current drug addicts by 20%.5
Current techniques used for narcotics identification (ID) include mass spectrometry (MS) – the current gold standard for drug analysis often combined with chromatographic techniques such as high-performance liquid chromatography, X-ray diffractometry (used to assess crystalline samples) and immunoassays (allowing for ID of metabolised drugs in urine). Whilst very powerful, these methods are generally all performed in a lab setting, potentially making them less useable for rapid analysis in field operations.6,7 Portable GC-MS and MS systems are available but generally at a higher price point and this again, could limit widespread deployment in community settings. Infrared, Raman and Ion Mobility Spectrometry (IMS) (used in conjunction with commercially available spectral libraries), colourimetric and microcrystalline tests are all common ID methods which can be performed at collection sites by operators without advanced laboratory training to provide sample information, although only qualitatively in the latter two methods. Infrared, and Raman all provide quantitative analysis on a vast array of narcotics at the point of care, without destroying the sample.8 Fast and accurate analysis of street drug samples can provide information to inform safety and operational response, and in some cases treatment options for users of narcotics. If more samples can be analysed quickly in the field, by non-scientific users, rather than sent to a lab, then costs can be reduced, and operational momentum maintained in some cases.
Fourier Transform Infrared spectroscopy (FTIR) is used to identify the chemical fingerprint of samples based on the absorption of infrared by chemical bond vibration, and as such is applicable for use in ID of unknown samples. Previous studies have shown the capability of FTIR in profiling illicit drugs such as cocaine, and as part of the UK government's strategy of breaking the supply lines in illegal drug networks, further investments have been made in 2021 to equip the London Metropolitan Police with FTIR spectrometers to aid in ID of seized samples suspected of containing controlled and illegal substances.9–11
In this study we aimed to investigate the utility of FTIR methods in an “out-of-lab” based setting in counter-narcotics operations by analysing 184 illicit narcotic samples previously seized by UK law enforcement and cross-checked by laboratory techniques. Samples studied here included common class A drugs, with the addition of new psychoactive substances (NPS) & pharmaceuticals. Due to availability during measurement collection, there are some omissions in the sample pool, including fentanyl & synthetic cannabinoids, and thus samples may not fully represent current UK drug use trends. Several spectroscopic analysis techniques that could be easily deployed in field operations were assessed to determine the performance of attenuated total reflectance (ATR)-FTIR in rapid ID of suspected illicit drugs, as would be used by law enforcement in counter-narcotics investigations. Spectroscopic libraries are expensive to purchase – particularly as they often incur a significant cost to the device. As such we investigated the utility of focussed and broad-based commercially available libraries in the analysis of street drug samples.
Methods
Instrumentation
The Agilent 4500 and 5500 portable FTIR spectrometers (Agilent Technologies, Santa Clara, USA) supplied by Agilent Technologies (Oxford, United Kingdom) were used to collect all spectra from samples during this study. Both spectrometers were fitted with a diamond 1-bounce attenuated total reflectance (ATR) accessory and a triglycine sulphate (DTGS) detector. Each spectrum was compiled of 64 sample scans (scan time ∼ 15 seconds), with 128 background scans collected between each sample, at a resolution of 4 cm−1, with HappGenzel apodization, a zero fill factor set to 2 and Mertz phase correction. All spectrometers were operated using Microlab PC software (Agilent Technologies, Santa Clara, USA).Sample source
Narcotics and NPS used for library creation were obtained as chemical standards and used as purchased (Cayman Chemical or Sigma Aldrich). 184 “Street samples”, split into 56 substance types, were supplied by TICTAC (TICTAC Communications, University College London, UK) and measured without purification. Samples were previously analysed by TICTAC via liquid chromatography-mass spectrometry (LCMS) to identify the active ingredient to categorise the sample. Samples were crushed, where necessary, and mixed before being measured in triplicate.Library sources and sample analysis
A spectroscopic library containing 549 spectra, compiled by Agilent Technologies, was used for street sample ID through the Microlab Lite software (Agilent Technologies, Santa Clara, USA). Similarity library matching algorithm was based on scaler dot product. Results are given as a hit quality index from 0–1, with a closer match resulting in a higher index. The compound ID was defined by being the top library match and a hit quality index (HQI) exceeding 0.75, and was then compared to LC-MS results. Sample purity and physical state, as well as processing actions such as normalisation, baseline inclusion and wavenumber region choice all can impact final index. To compare ID success between the initial library and an expanded spectral database, a commercial ATR-FTIR library (ST Japan, Germany) library was compiled of 10![[thin space (1/6-em)]](https://www.rsc.org/images/entities/char_2009.gif) 119 spectra, with contents selected for analysis of white powders, explosives, traditional drugs, cutting agents, minerals and solvents.
119 spectra, with contents selected for analysis of white powders, explosives, traditional drugs, cutting agents, minerals and solvents.
Results & discussion
Street narcotics
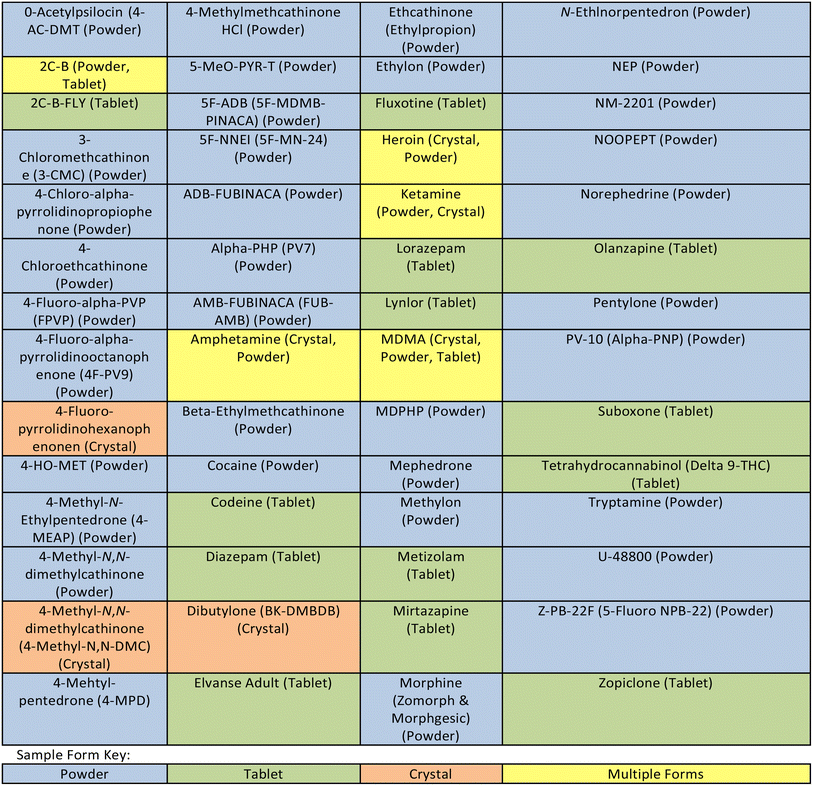
Illicit drugs are manufactured and supplied to consumers through county lines networks in many different forms; powders delivered in small plastic bags, wrapped in filter papers as “bombs” or pressed into tablets to be consumed orally. Drugs seized by law enforcement are commonly found to contain “cutting agents” alongside the active ingredient, in which the drug will be sold as. These cutting agents are often legal to obtain, and have the purpose of reducing the amount of active ingredients in sold samples, increasing profits and also adding or replicating effects of the compounds when consumed.12 Caffeine is amongst the most popular cutting agents, used in a variety of drug types providing beneficial side effects such as reducing fatigue.13,14 Cutting agents can also be used to mimic side effects of the active ingredient. Benzocaine is a compound commonly found in illicit drugs sold as cocaine due to its use for local anaesthetics in a number of settings including dentistry, which mimics the numbing effects of cocaine when ingesting through the nose, causing consumers to believe there is more of the psychoactive ingredient in the sample than is actually present.9,15,16Table 1 shows the various narcotic samples analysed during this study, with narcotic forms categorised by the form sampled in i.e., powder, tablet, or crystal. Samples were stored in the packaging law enforcement seized them in, often polyethylene resealable bags, capsules or wrapped in other materials such as filter paper, depending on method of intended consumption.Sample ID
Fig. 1 shows the results of the library matching of collected spectra of samples previously identified using liquid chromatography (LC)-MS. Part A shows prior to any analysis, in 63% of all samples the active ingredients were correctly identified as the top HQI result, matching LC-MS results, with 21.2% of samples incorrectly identified as compounds which are chemically related and share many of the same functional groups as the actual active ingredient present. 16.3% of samples were incorrectly identified with no significant chemical relationship. Residual analysis in MicroLab subtracts a selected spectrum in the library from the sample spectrum, leaving a resultant spectrum that is then matched with remaining spectra in the library. In Fig. 1B, after secondary residual analysis, it was observed that that ∼10% of those previously identified as chemically related compounds, were correctly identified as the active ingredient. | ||
| Fig. 1 Breakdown of the FTIR matching performance based on the HQI attained before (A) and after residual analysis (B). Samples were previously identified via LC-MS. | ||
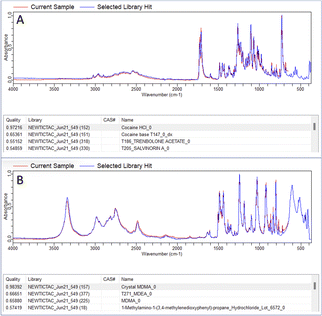
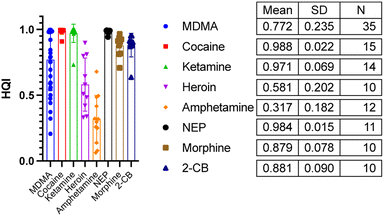
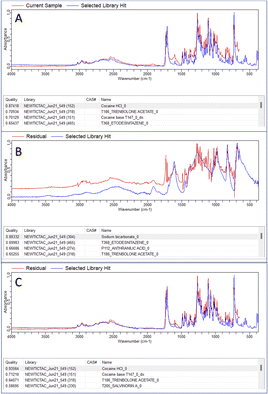
In both the examples in Fig. 2 the correct active ingredient was identified with a HQI score given out of a maximum score of 1. Due to the high HQI scores in these examples, the difference in HQI score between the first and second result, as well as the visual overlay between the current sample and the library “hit” there is a high degree of certainty that the active ingredient was correctly identified. The analysis of one of the samples making up the 10% which were correctly identified after residual analysis is shown in Fig. 3. In part A, in the top four matches are legal substances which are likely incorporated into the sample as cutting agents, as previously discussed, and are thus masking the signal from any illicit materials. The residual function allows positive ID by removing a single signal from the spectrum contributed by the selected library match. In the example in Fig. 3A, lactose is identified as the predominant material in the sample, but after removal of lactose peaks from the signal codeine was successfully identified as the predominant active ingredient, with the sample also likely containing chloroquine diphosphate – often observed as a common adulterant, particularly in heroin samples (Fig. 3B). Fig. 4 depicts the performance of the method through the generated HQI in samples categorised by the active ingredient. It can be observed that active ingredient detection (HQI) is greater in some varieties of narcotics, such as cocaine, ketamine, NEP, morphine and 2-CB compared to amphetamine and heroin. It is possible that in the cases of low HQI the active ingredient is masked by a cutting agent that was not included in the library used for matching compounds. Heroin, for example, is commonly cut with starch, which was not present in the library.17 However, a low HQI did not necessarily mean that a correct match cannot be identified, as 50% of heroin samples with an initial HQI between 0.3–0.65 were correctly identified after subtraction of the first match and analysis of the residual spectrum. Further expansion of the library used to include more cutting agents would further increase detection performance in this regard.
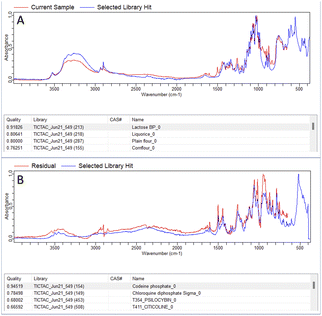 | ||
| Fig. 3 Incorrect ID of codeine street sample (A), followed by successful ID after secondary residual analysis (B). | ||
Enhancing sample ID performance
The use of expandable libraries means that ID of unknown samples can be improved over time. Use of multiple libraries at once increases the amount of library spectra matched to that of the unknown sample. Use of the commercial library containing 10![[thin space (1/6-em)]](https://www.rsc.org/images/entities/char_2009.gif) 119 spectra was assessed to increase positive sample ID rate by 3.24%, shown in Fig. 5. Fig. 4 shows the mean HQI for Heroin samples in this study was 0.58, meaning that some difficulty may be encountered when attempting to correctly identify seized Heroin samples encountered in the field. Fig. 6 shows the difference in HQI of Heroin samples prior to and after adding 4 new spectra to the library used for sample ID. Due to Heroin frequently found to be cut with common over-the-counter painkillers and stimulants, the spectra for paracetamol, aspirin & caffeine were added to the library, as well as a computationally produced heroin–caffeine–paracetamol mix spectrum.18
119 spectra was assessed to increase positive sample ID rate by 3.24%, shown in Fig. 5. Fig. 4 shows the mean HQI for Heroin samples in this study was 0.58, meaning that some difficulty may be encountered when attempting to correctly identify seized Heroin samples encountered in the field. Fig. 6 shows the difference in HQI of Heroin samples prior to and after adding 4 new spectra to the library used for sample ID. Due to Heroin frequently found to be cut with common over-the-counter painkillers and stimulants, the spectra for paracetamol, aspirin & caffeine were added to the library, as well as a computationally produced heroin–caffeine–paracetamol mix spectrum.18
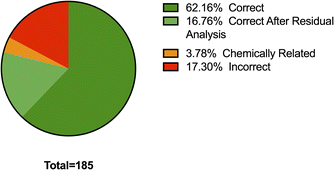 | ||
| Fig. 5 Breakdown of the FTIR matching performance based on the HQI attained before and after residual analysis, after addition of S.T. Japan Europe GmbH library. | ||
 | ||
| Fig. 6 Mean ± SD Hit Quality Index of Heroin samples using original library containing 549 spectra, before and after addition of 4 new spectra, when matching samples to a heroin–caffeine–paracetamol spectrum (A), compared to match against the Heroin standard (used in Fig. 4) after residual analysis to remove peaks contributed by paracetamol and caffeine (B). | ||
When matching the unknown samples to the heroin–caffeine–paracetamol mix spectrum, as this mixed spectrum is contributed to equally by the three drugs, the increase in HQI may be caused by content of caffeine or paracetamol present in the samples, rather than the active ingredient. To combat this, the residual was used to remove the contributing caffeine and paracetamol signals from the sample. Fig. 6B shows that HQI of Heroin was still improved when matching to the Heroin standard T242 which was previously used in Fig. 4, due to the removal of signal from common adulterants.
Principal component analysis
Another method for ID of the illicit active ingredient in samples is to use principal component analysis (PCA), which assesses the spectral variance, displayed as principal component factors, between sample types. The PCA model for ID of narcotics samples is shown in Fig. 7.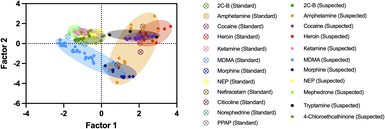 | ||
| Fig. 7 Principal component analysis (PCA) of narcotics spectra, grouped by drug type. Clusters depict more similar spectra after assessing variance using principal component factors 1 and 2. | ||
The results of sample ID using the PCA model above are listed in Table 2. The PCA model shows that different amphetamine samples have a clear split, located in two separate clusters, seen in Fig. 8. Where sample groups cluster closely together, their spectral differences are smaller. Although most samples within the same sample group cluster together, the amphetamine samples suspected of containing caffeine as an adulterant, based on their library match, were plotted in the lower-right cluster, separating from amphetamine samples without caffeine.
| Sample group | Drug type | Correct ID (%) | Total samples | Validation samples |
|---|---|---|---|---|
| 2-CB | Psychedelic | 100 | 9 | 3 |
| 4-Chloroethcathinone | Stimulant | 0 | 7 | 2 |
| Amphetamine | Stimulant | 75 | 12 | 4 |
| Cocaine | Stimulant | 100 | 13 | 4 |
| Heroin | Opioid | 0 | 10 | 3 |
| Ketamine | Dissociative | 75 | 15 | 4 |
| MDMA | Empathogen | 83.3 | 36 | 12 |
| Mephedrone | Empathogen | 0 | 6 | 2 |
| Morphine | Opioid | 0 | 10 | 3 |
| NEP | Stimulant | 0 | 10 | 3 |
| Tryptamine | Psychedelic | 0 | 3 | 1 |
ID of samples using the PCA model above is possible in 45% of the sample groups assessed here. Difficulty in ID could be caused by the purity of the samples, as according to the United States Drug Enforcement Administration (DEA), the purity of amphetamine, cocaine, ketamine and MDMA seized by law enforcement ranged from 49.5–96.1% in 2020. Whereas, opioids such as heroin have been found to be, on average, 37.6% pure.19,20 This expected difference in purity helps to explain the clustering pattern, as when using Table 2, the clusters are not formed of samples of the same drug type. The less pure samples will be impacted more greatly by the adulterants present, as seen with amphetamine. This can create difficulty in ID of samples, as it becomes difficult to ascertain to what extent the clustering pattern is caused by the adulterants, rather than the active ingredient. This highlights the need for increased reporting of cutting agents and diluents as well as a degree of hierarchical supervision and intense model training to enhance analysis and ID ability of such models when assessing street drug samples.
Concentration studies
To expand on the performance analysis of simple ID of unknown street samples, 19 samples of MDMA were scanned. The batches of these 19 samples had previously been quantified so that the percentage mass of psychoactive ingredient MDMA making up each pill was known. The HQI of MDMA in each sample is plotted against the known mass concentration in Fig. 9, showing that the limit of detection (LOD) of MDMA was 4.4%. However, for purposes of identifying unknown suspect illicit drugs, successful ID of MDMA was only possible in excess of 22.7% of total mass, this measure previously being defined as the limit of ID (LOI).21 This suggests that there is potential for ATR-FTIR to be used to first identify and then quantitatively estimate the concentrations of active ingredient present in unknown narcotic samples, provided the minimum threshold of mass concentration is met.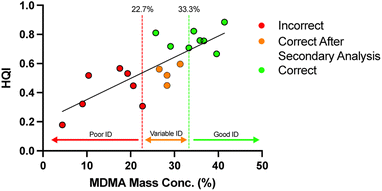 | ||
| Fig. 9 The relationship between Hit Quality Index and percentage of active ingredient (MDMA) present in the street sample. | ||
Cutting agents
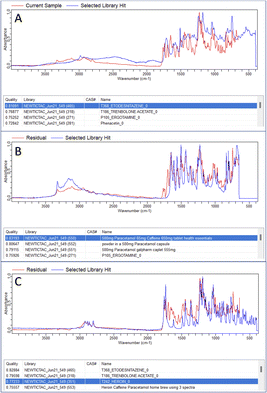
The ID of cutting agents or adulterants alongside the active ingredient in narcotic samples is not as widely reported as it might be. Many substances such as caffeine are usually omitted by labs when identifying suspected controlled substances, which hampers the collection of information that could be beneficial for law enforcement and treatment of users.18 Two examples are shown below in Fig. 10 & 11 where an adulterant is identified in samples of cocaine and heroin respectively. Again, the top “hit” was selected and the contributing signal removed through residual analysis in each case to remove need for user judgement.The adulterant is identified by residual analysis, removing the signal contributed by the active ingredient, to leave signal contributed by any other substances found in the sample. Using this information to remove the adulterant signal from our original sample then improved HQI of the active ingredient, with cocaine HQI increasing from 0.87 to 0.94. After removal of the paracetamol–caffeine signal from the heroin sample it was observed that the active ingredient heroin, which was not previously listed inside the top four HQI matches, now matches third with a HQI of 0.77233, making the likelihood of positive rapid ID of the controlled substance more likely.
Rapid ID of adulterants shown here could be hugely important in the safety of law enforcement working in the field as well as current users. Adulterants such as fentanyl, a potent synthetic opioid, often found in heroin in the US is beginning to become more common in the UK, with NHS trusts first receiving information on the treatment of suspected fentanyl overdoses on the central alert system in 2017.22 Some fentanyl variants have a lethal dose of ∼2 mg, whilst an even more powerful variant, carfentanil, has a lethal dose around 100× less than this, and may be absorbed through the skin or inhaled.23 The use and study of such substances is clearly hugely dangerous, and thus improving rapid ID of active ingredients as well as cutting agents or adulterants such as fentanyl could be important in preventing loss of life.
Hyphenated techniques such as GC-FTIR are effective in separating compounds found in a single sample, allowing for efficient psychoactive ingredient(s) ID, without impact from cutting agents, even at trace levels within the assessed sample.6,7 However, two-step analytical techniques with front-end sample separation such as GC-FTIR can require more advanced sample preparation prior to analysis. As this study was focussed on rapid ID of psychoactive samples by law enforcement at the scene of sample collection, such techniques were not within scope of this work.
Conclusions
In his study we have investigated the ability of FTIR in rapid ID of a large range of illicit psychoactive substances. Spectral library matching was effective in identifying 75% of samples of varying degrees of purity effectively. The benefit of “location specific” intelligence on cutting agents has a significant effect on the matching hit quality index, especially when combined with larger libraries. This study highlights the value of this in local law enforcement agencies. Where sample concentration by mass percentage has been confirmed, through external analysis of MDMA tablets, we have shown an LOD of 4.4% and LOI of >22.7% mass concentration. Through the link of concentration to HQI, there is potential for FTIR to quantitatively estimate purity of such samples.We have also assessed the use of principal component analysis in ID of street narcotic samples. Although there was success in just 46% of our sample groups, the results appear to be skewed by adulterants present. This highlights the need for further reporting of adulterants to gain insight into common mixtures of controlled and non-controlled substances and aid in ID of potentially dangerous diluents or additives, for the protection of law enforcement and current drug users. Taken as a whole, we have demonstrated the utility of, fast, easy to use and cost effective FTIR spectroscopic techniques for accurate ID of street narcotics samples in a field setting. This has the potential to enable law enforcement organizations to perform analysis in the field improving operational efficiency and, in some cases, reducing the need to send samples to a lab.
Author contributions
Samuel F. Williams – investigation, data curation, writing – original draft, writing – review & editing. Robert Stokes – conceptualisation, methodology, investigation, writing – review & editing, supervision. Pik Leung Tang – methodology, data curation, writing – review & editing. Ana M. Blanco-Rodriguez – investigation, writing – review & editing, supervision.Conflicts of interest
Robert Stokes, Pik Leung Tang and Ana M. Blanco-Rodriguez are employees of Agilent Technologies.Acknowledgements
The authors would like to acknowledge Agilent Technologies LDA UK Ltd for the supply of 4500 and 5500 FTIR instruments and TICTAC Communications Limited (UK) for supply of samples and data. SFW thanks the EPSRC for PhD studentship funding.Notes and references
- Crime UNO on D, Global Overview: Drug Demand Drug Supply, in World Drug Report 2021 [Internet], 2021 [cited 2021 Nov 24], pp. 1–113, available from: http://www.unodc.org/unodc/en/data-and-analysis/wdr2021.html Search PubMed.
- B. Brewster, G. Robinson, B. W. Silverman and D. Walsh, Covid-19 and Child Criminal Exploitation in the UK: Implications of the Pandemic for County Lines, Trends Organ crime [Internet], 2021 Dec 6 [cited 2021 Dec 16], available from: https://pubmed.ncbi.nlm.nih.gov/34898976/ Search PubMed.
- F. Alam and P. Barker, Interruption of medication-assisted treatment for opioid dependence: Insights from the UK, Drugs and Alcohol Today, 2014, 14(3), 114–125 CrossRef.
- E. Mahase, Drug deaths: England and Wales see highest number since records began, BMJ, 2020, 371, 3988 CrossRef PubMed , available from: http://dx.doi.org/10.1136/bmj.m3988http://www.bmj.com/.
- HM Government, From Harm to Hope: A 10-year Drugs Plan to Cut Crime and Save Lives, [Internet], 2021 [cited 2021 Dec 15], available from: https://assets.publishing.service.gov.uk/government/uploads/system/uploads/attachment_data/file/1038722/From_harm_to_hope_PDF_FINAL.pdf Search PubMed.
- T. M. G. Salerno, P. Donato, G. Frison, L. Zamengo and L. Mondello, Gas Chromatography—Fourier Transform Infrared Spectroscopy for Unambiguous Determination of Illicit Drugs: A Proof of Concept, Front. Chem., 2020, 8, 624 CrossRef CAS PubMed.
- Y. Abiedalla, A. J. Almalki, J. DeRuiter and C. R. Clark, GC-MS and GC-IR analysis of methylenedioxyphenylalkylamine analogues of the psychoactive 25X-NBOMe drugs, Forensic Chem., 2021, 23 Search PubMed.
- L. Harper, J. Powell and E. M. Pijl, Harm Reduction Journal, 2017, 14(52) Search PubMed.
- N. V. S. Rodrigues, E. M. Cardoso, M. V. O. Andrade, C. L. Donnici and M. M. Sena, Analysis of Seized Cocaine Samples by Using Chemometric Methods and FTIR Spectroscopy, J. Braz. Chem. Soc., 2013, 24(3), 507–517, DOI:10.5935/0103-5053.20130066.
- M. C. A. Marcelo, K. C. Mariotti, M. F. Ferrão and R. S. Ortiz, Profiling cocaine by ATR-FTIR, Forensic Sci. Int., 2015, 246, 65–71 CrossRef CAS PubMed.
- Contract for the Supply of Fourier Transform Infrared Spectroscopy, London City Hall [Internet]. [cited 2021 Dec 15], available from: https://www.london.gov.uk/what-we-do/mayors-office-policing-and-crime-mopac/governance-and-decision-making/mopac-decisions-0/contract-supply-fourier-transform-infrared-spectroscopy.
- T. Mahintamani, A. Ghosh and R. Jain, Serious health threats of novel adulterants of the street heroin: a report from India during the COVID-19 pandemic, BMJ, 2021, 14(8) Search PubMed ), available from: https://pubmed.ncbi.nlm.nih.gov/34433525/.
- A. Żubrycka, A. Kwaśnica, M. Haczkiewicz, K. Sipa, K. Rudnicki and S. Skrzypek, et al., Illicit Drugs Street Samples and Their Cutting Agents. The Result of the GC-MS Based Profiling Define the Guidelines for Sensors Development, Talanta, 2022, 237 Search PubMed . Available from: https://pubmed.ncbi.nlm.nih.gov/34736717/.
- A. Smith, Effects of caffeine on human behavior, Food Chem. Toxicol., 2002, 40, 1243–1255 CrossRef CAS PubMed.
- F. S. Alanazi, M. F. Alhazzaa, Y. M. Alosaimi, F. A. Alajaji, A. S. Alanazi and A. Alassaf, et al., Preference of Dental Practitioners toward the Use of Local and Topical Anesthetics for Pediatric Patients in Saudi Arabia: A Cross-Sectional Survey, Child, 2021, 8(11) Search PubMed ). Available from: https://pubmed.ncbi.nlm.nih.gov/34828691/.
- M. Almugait and A. AbuMostafa, Comparison between the analgesic effectiveness and patients' preference for virtual reality vs. topical anesthesia gel during the administration of local anesthesia in adult dental patients: a randomized clinical study, Sci. Rep., 2021, 11(1), 23608 CrossRef CAS PubMed . Available from: https://pubmed.ncbi.nlm.nih.gov/34880344/.
- X. He, J. Wang, F. Niu, L. Fan, X. Teng, C. Zhang and et al., Characterization of Heroin and Its Additives by Attenuated Total Reflection (ATR) – Fourier Transform Infrared Spectroscopy (FTIR) and Multivariate Analysis, https://doi.org/101080/0003271920201751181, [Internet]. 2020 Nov 1 [cited 2021 Dec 16], 53(16), 2656–2670, available from: https://www.tandfonline.com/doi/abs/10.1080/00032719.2020.<?ccdc_no 1751181?>1751181<?ccdc END?> Search PubMed.
- T. R. Fiorentin, A. J. Krotulski, D. M. Martin, T. Browne, J. Triplett and T. Conti, et al., Detection of Cutting Agents in Drug-Positive Seized Exhibits within the United States, J. Forensic Sci., 2019, 64(3), 888–896 CrossRef CAS PubMed.
- US-DEA, 2020 National Drug Threat Assessment, Drug Enforcement Administration, 2020, available from: https://www.dea.gov/documents/2020/01/30/2019-national-drug-threat-assessment.
- Laguna Treatment Hospital, Drug Purities in America|Laguna Treatment Hospital [Internet]. Laguna Treatment Hospital. 2019 [cited 2022 Feb 11], available from: https://lagunatreatment.com/addiction-research/drug-purities-in-america/.
- G. Frison, F. Zancanaro, S. Frasson, L. Quadretti, M. Agnati and F. Vlassich, et al., Analytical Characterization of 3-MeO-PCP and 3-MMC in Seized Products and Biosamples: The Role of LC-HRAM-Orbitrap-MS and Solid Deposition GC-FTIR, Front. Chem., 2021, 8 Search PubMed , available from: www.frontiersin.org.
- Cosford P., NHS Central Alert System: Evidence of Harm from Fentanyl-Contaminated Heroin, London: Department of Health, 2017, available from: https://www.cas.mhra.gov.uk/ViewandAcknowledgment/ViewAlert.aspx?AlertID=102588.
- National Crime Agency, Recent Deaths Possibly Linked to Fentanyl, 2017, available from: http://www.fentanylsafety.com.
| This journal is © The Royal Society of Chemistry 2023 |

