DOI:
10.1039/D2YA00050D
(Paper)
Energy Adv., 2022,
1, 438-448
Single-step in situ synthesis of MoO2-faceted structures as highly efficient HER electrocatalysts and electrode materials for pseudocapacitors
Received
23rd February 2022
, Accepted 25th May 2022
First published on 16th June 2022
Abstract
In the present study, intermediate molybdenum oxide (MoO2) structures are synthesized via an in situ reduction process in an autoclave in the presence of nitrogen (N) and carbon (C), respectively. The carbothermic reduction favored the formation of MoO2 structures with smaller crystallite sizes. The synthesized samples showed the formation of laminar, faceted, and stacked structures as determined by FESEM and TEM analyses. The presence of C and N in the synthesized samples, elucidated by XPS analysis, contributed to the efficiency and stability of the electrolytic hydrogen evolution reaction (HER) and pseudocapacitance performance. The synthesized samples exhibited very low Tafel slopes (46.3–47.8 mV dec−1) for the HER activity and showed very high stability (3000 CV cycles) over a wide voltage window (0–1 V). Moreover, the synthesized samples required a very low overpotential of 80 mV to produce a current density of 10 mA cm−2. The cyclic voltammetry (CV) and galvanic charge–discharge (GCD) characteristics revealed the actual pseudocapacitor behavior of the synthesized samples. CV and GCD signals revealed the potential application of the synthesized samples for pseudocapacitor applications. The active sites on the edges and N and C in the synthesized samples enhanced their potential use as electrocatalysts for the HER and electrode materials for pseudocapacitors.
1. Introduction
The increasing industrialization and population growth have led to an upsurge in the use of traditional fossil fuels. The over-demand and utilization of these fossil fuels has shrunk their reserves and led to the critical issue of global warming.1,2 In this regard, the search for new, efficient and green renewable energy sources has gained considerable attention to replace traditional fuels. Among the green energy resources, hydrogen energy and its generation through water splitting is a promising approach.3,4 Hydrogen (H2), when primarily produced by electrolysis or the electrochemical (EC) water splitting reaction linked to a renewable source of electricity, can become a global driver towards sustainable energy development.1,5,6 The sluggish kinetics of the overall water splitting reaction requires a high overpotential to produce hydrogen, which restricts its practical implementation. Highly efficient and durable catalysts are needed to lower the overpotential and kinetic barrier for efficient production of H2via the HER.7–9
At present, platinum (Pt) is mainly used as an efficient and stable catalyst for the HER.10,11 The high cost and low abundance restrict its practical use. Low-cost non-noble metal species are required to replace Pt entirely or reduce Pt utilization as an electrocatalyst in electrochemical water splitting.12 Electrocatalysts exhibiting dual characteristics like being an efficient catalyst for the HER along with high performance electrochemical capacitance are desired to address the emerging energy storage demands for hybrid electric vehicles.13,14 Pseudocapacitors have attained much attention due to their ability to provide high capacitances at higher charging rates. Moreover, the prevailing confusion between the electrode materials for batteries and pseudocapacitors is a critical issue to be addressed.15
Different non-noble materials like metal carbides, chalcogenides, metal alloys, metal oxides (MOs), and other carbon materials have been developed for the HER and EC capacitors.16–18 Among the metal oxide (MO) species, the transition metal oxides (TMOs) are being studied due to their abundance, low-cost, eco-friendly nature, and ease of fabrication.19,20 Different TMO species like TiO2, MnO2, V2O5, Cr2O3, WO3, and Co3O4 have been synthesized and tested for the HER and EC capacitors.21–26 These TMOs are either doped with suitable transition metal (TM) atoms or an interfacial heterostructure is created with other metal oxides or carbon species to modify their band structures and make them viable for an improvement in their HER activity and stability. Among these, the intermediate TMO species exhibiting partially filled d-orbitals and oxygen vacancies have shown promising results for HER and capacitance applications. However, due to the multivalent oxidation states of TMOs, the synthesis of highly active intermediate species is critical. Among these TMOs, molybdenum oxide (MoOx, x = 2–3), exhibiting a layered structure has gained special attention as an electrocatalyst due to its excellent chemical and physical properties. The molybdenum species are non-toxic with the unique feature of having their d-band characteristics analogous to Pt.27,28 The variation in oxidation states of molybdenum (Mo) and tuning the oxygen vacancies of Mo-oxides make them a suitable candidate for electrocatalysis. The synergistic effects of anion vacancies created in TMOs, especially in the layer-structured oxide species (MoOx, x = 2–3), significantly enhanced adsorption and desorption of ions on their surfaces.20,29 In the hydrogen evolution reaction, distorting structural ordering in the anion vacant species during the adsorption of electrolyte ions limits their proper use. The anion-deficient MoO3 (MoO3−x) or low oxidation-stabilized MoO2 (MoO3−x, x = 1) species that maintain the structural stability and layered characteristics are highly suitable for enhancing the electrocatalytic activities.20,29,30 Synthesis of the MoO2 species is very critical due to comproportionation between the transformations of MoO2 and MoO3via certain intermediate species as follows:
The formation of the oxygen-deficient or low oxidation state oxides requires special heat treatments under inert and reduction atmospheres. Different methods have been adopted to synthesize MoO2 nanostructures ranging from controlled oxidation of molybdenum metal to reducing molybdenum precursors under a suitable reducing atmosphere. Jo et al.20 synthesized the MoO3−x electrode by one-step oxidation of Mo mesh in an argon atmosphere and studied the electrochemical HER activity in alkaline media. Zhou et al.31 synthesized MoO2 nanoparticles via a hydrothermal route for supercapacitors and photocatalysis. The synthesized MoO2 nanostructures were potential electrode materials for high-performance supercapacitors. Zhang et al.32 synthesized MoO2 nanosheets via a solvothermal route. The synthesized nanosheets exhibited high capacitive performance and enhanced Li-ion intercalation properties. Similarly, MoO2 species supported with carbon have attained special attention for supercapacitors. The stability of the MoO2 nanostructures is enhanced when incorporated within different carbon structures.27,33 In some instances, the electrocatalytic performance can be improved by doping or forming a heterostructure of MoO2 with particular metal and non-metal species. This structural modification influences the d-band skeleton near the Fermi level and shortens the electron pathways to improve the electrocatalytic activity.
In the present study, MoO2 structures are prepared through an in situ single-step thermal reduction process using two different precursors in a specially designed autoclave. The role of different molybdenum precursors is to get a pure phase of MoO2. Moreover, the role of temperature and other key factors impacting the formation of the pure phase has been studied. Being low in cost, the synthesized product is studied for the hydrogen evolution reaction (HER) with some interesting results. The cyclic voltammetry (CV) and galvanic charge–discharge (GCD) results revealed the pseudocapacitance behavior of the synthesized samples.
2. Materials and methods
2.1 Synthesis of MoO2 nanostructures
Molybdenum oxide (MoO2) nanoparticles (N1) were synthesized in a single step by thermally treating ammonium heptamolybdate (AHM) in a specially designed autoclave made up of stainless steel (SS) having a volume capacity of 50 ml and wall thickness of 45 mm. A mass of 1.4390 g of AHM was charged in the SS autoclave, which was sealed (airtight) adequately before heat treatment. For the heat treatment, the temperature was ramped to 800 °C at a heating rate of 5 °C min−1. The temperature was maintained for one hour followed by cooling to room temperature to get the product and further details of the procedure are reported elsewhere.34,35 The product obtained was washed with water and ethanol and dried at 80 °C overnight to get the final product.
Alternatively, for the M1 sample, MoO3 (1.439 g) and carbonaceous waste (waste polyethylene, 0.5 g) were used as initial precursors. The polyethylene was washed, dried, and cut into small pieces before being charged inside the autoclave. The autoclave was then air-sealed and heated at 600 °C for 1 hour with a heating rate of 5 °C min−1. The autoclave was cooled to room temperature under similar conditions as mentioned above. The obtained powder was collected, washed with water and ethanol and dried overnight at 80 °C. The obtained powders in both instances were further characterized for structural, morphological, and surface features.
2.2 Material characterization
The phase formation and crystal structure confirmation were done by X-ray diffraction (XRD) using PAN analytical XPert Highscore software and ICDD reference patterns. A copper (Cu) source of wavelength 0.154 nm was used for X-ray diffraction measured in the range of 20 ≤ 2θ ≤ 80 at a step size of 0.013 (2θ). The surface morphological features were analysed by field emission scanning electron microscopy (FESEM) using a Hitachi (SU8010) operated at 5 kV. Moreover, the detailed atomic-level morphological characteristics were determined by transmission electron microscopy (TEM) and high-resolution TEM (HRTEM), respectively (JEOL 2100F operating at 200 kV). An X-ray photoelectron spectroscopy (XPS) model PHI 5000 Versa Probe II, FEI Inc. confirmed the surface characteristics and bonding features of the synthesized samples. The XPS spectra were collected (ESCA+) using Al Kα radiation (1486.7![[thin space (1/6-em)]](https://www.rsc.org/images/entities/char_2009.gif) eV), operating at 15kV and 15mA. The C 1s peak at 282.4 eV was selected as a reference to calibrate the position of other peaks. XPS peak 4.1 software was used to deconvolute the high resolution (HR) XPS elemental spectra. The fitting has been done with reference to a Shirley background.
eV), operating at 15kV and 15mA. The C 1s peak at 282.4 eV was selected as a reference to calibrate the position of other peaks. XPS peak 4.1 software was used to deconvolute the high resolution (HR) XPS elemental spectra. The fitting has been done with reference to a Shirley background.
2.3 Electrochemical measurements
The electrochemical measurements of the synthesized samples were done in a three-electrode electrochemical cell (Biologic EC lab instrument; SP-300). For the working electrode, 1.0 mg of MoO2 powder was uniformly mixed with 250 μl of ethanol and ultrasonicated for about 30 minutes. The prepared solution (20 μl) was drop cast on a glassy carbon electrode (GCE) having a diameter of 0.3 mm and dried overnight at room temperature. The electrode was further impregnated with a drop of 10 μl Nafion solution (Nafion® 117). All the electrochemical measurements were performed in 0.5 M H2SO4 with a platinum counter electrode and a reversible hydrogen electrode (RHE) as the reference electrode. The EIS measurements (Nyquist plots) were performed within a frequency range of 1 MHz to 100 mHz. The CV studies were conducted in a voltage range of −1 V to 1 V at a scan rate of 100 mV s−1 for 30 cycles before taking the electrochemical measurements.
3. Results and discussion
3.1 XRD analysis
The XRD patterns of the N1 and M1 samples are shown in Fig. 1, the XRD pattern of N1 shows that AHM was reduced entirely to monoclinic MoO2 species. The reduction of AHM takes place inside the autoclave under the influence of H2 and the nitrogen atmosphere. The AHM first reduces to MoO3 (eqn (2)), and the as-formed product further reduces to MoO2 as per eqn (3).36 Increasing the temperature and time leads to the formation of molybdenum nitride (Mo2N) and Mo metal phases via an in situ simultaneous reduction–nitridation process.36| | | MoO3 + H2 → MoO2 + H2O | (3) |
The XRD pattern of M1 shows a complete in situ conversion of MoO3 to the pure phase MoO2 in the carbon and hydrogen atmosphere. The mechanism of the reduction of MoO3 to MoO2 is very critical due to the formation of some intermediate species. Different investigations regarding the transformation of MoO3 to MoO2via an intermediate product, Mo4O11 (eqn (1)), have been carried out.37,38 The carbothermic reduction of MoO3 reduces it to MoO2 in the presence of carbon precursor of C/H2 and CO/CO2, which facilitate the fast reduction of MoO3 at relatively low temperatures and in less time. The reduction of MoO3 to MoO2 by C/H2 occurs as per the combination of eqn (3)–(5).39,40| | | 2MoO3 + C → 2MoO2 + CO2 | (5) |
The overall reaction step proceeds as follows:| | 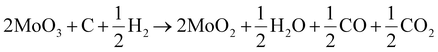 | (6) |
The optimization of temperature and time is necessary to restrict the reduction of the reactant species to facilitate the formation of pure phase MoO2. Herein, the waste carbon species act as the reductant species for the transformation of MoO3 to MoO2, which provided a suitable reduction and carbothermic atmosphere during synthesis in a closed vessel. The process not only utilizes low-cost carbon/hydrogen non-biodegradable waste as a source of the reduction atmosphere but also addresses the utilization of the waste for material processing.
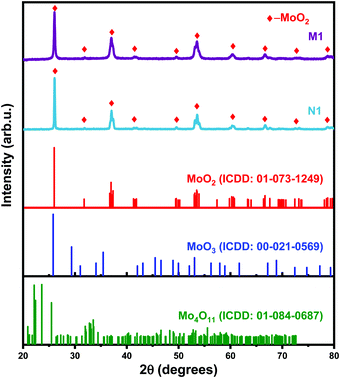 |
| | Fig. 1 X-ray diffraction patterns of N1 and M1 powders. | |
The initial precursor and the reaction temperature influence the structural features, like crystallite size estimated by the Scherrer method.41 The crystallite size as calculated for N1 and M1 is 71.2 and 40.4 nm, respectively. The results are in agreement with the XRD pattern (Fig. 1) exhibiting high crystallinity and broad peak patterns for N1 and M1, respectively. The carbonaceous gases favor the reduction of MoO3, whereas the hydrogen present in the system helps in reducing and fragmenting larger particles into smaller ones via hydrogen embrittlement.42 Further increase in the temperature, time, and carbon and nitrogen sources in the presence of reducing agents resulted in the formation of molybdenum carbide and nitride species as described and explained in our previous reports.35,36,42,43
3.2 X-ray photoelectron spectroscopy (XPS) analysis
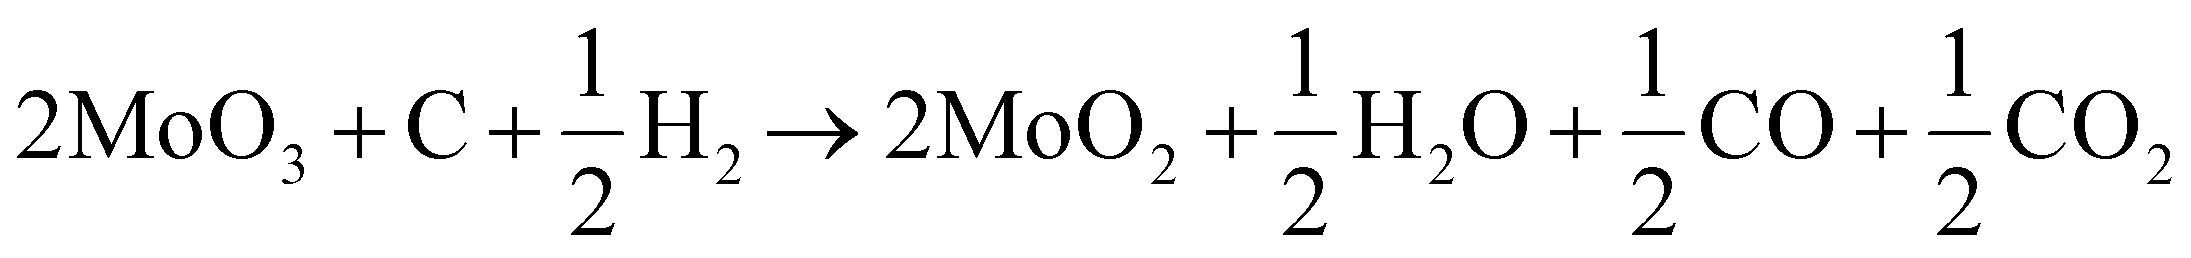
The surface features, bonding characteristics, and electronic states of the synthesized samples were confirmed by XPS analysis, as shown in Fig. 2. The full survey XPS spectrum of the synthesized samples reveals the presence of molybdenum (Mo), carbon (C), oxygen (O), and nitrogen (N) at distinct peak positions (Fig. 2(a)). The presence of N 1s (in sample N) is due to the inherent N in the initial precursor. The peak positions of the deconvoluted doublets in the high resolution (HR) spectra of Mo3 d (Fig. 2(b)) that correspond to Mo4+ and Mo6+ are given in Table 1.44–46 The peak positions follow the reported literature values.44,47–49 The HR O 1s spectra of the N1 sample are shown in Fig. 2(c), and the corresponding peak positions are given in Table 1 and are in agreement with earlier reports.18 The peaks are attributed to lattice oxygen (oxygen bonded to Mo) and the oxygen vacancies in the synthesized species, respectively. HR spectra of N 1s (Fig. 2(c) inset) reveal the bonding features of Mo–N. Fig. 2(d) shows the Mo 3d spectra of the M1 sample and the peak positions of the deconvoluted doublets are given in Table 1.46,47Fig. 2(e) shows the bonding features of oxygen bonded to Mo and the oxygen vacancies in the synthesized sample (M1) as per their respective binding energies (BEs) (Table 1). The additional peak at lower binding energy (Table 1) is attributed to oxygen-containing groups bonded with C atoms.50 The same is confirmed by the HR C 1s spectra of the M1 sample (Fig. 2(f)).51 Moreover, the O 1s spectra of N1 (Fig. 2(c)) reveal a higher number of oxygen-deficient sites (vacancies) than that of M1 (Fig. 2(e)).
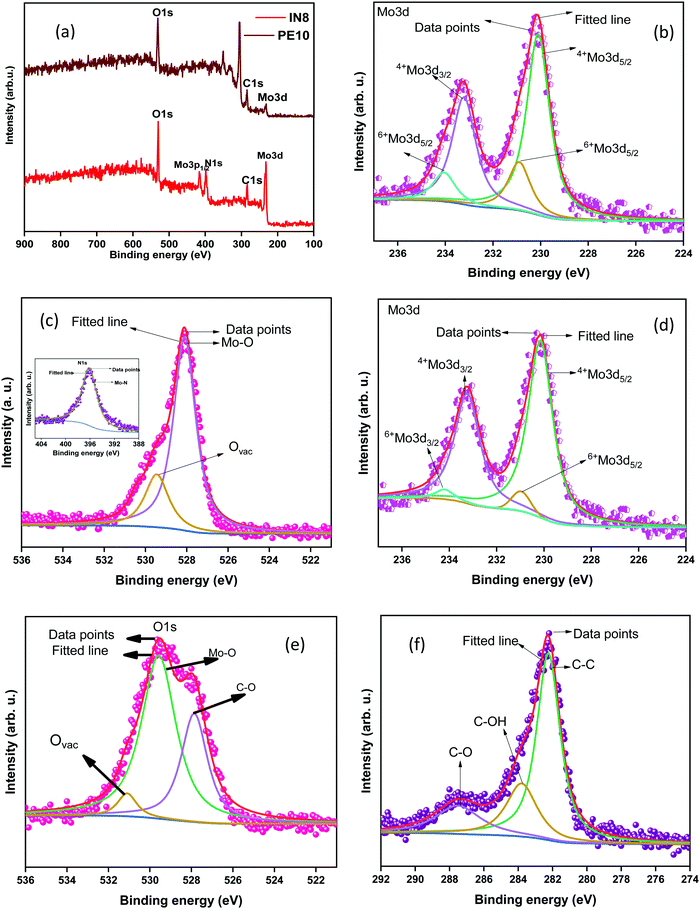 |
| | Fig. 2 (a) Survey XPS spectra of N1 and M1, (b) high-resolution spectra of (N1) Mo 3d and (c) O 1s (N 1s inset); high-resolution spectra of (d) Mo 3d, (e) O 1s and (f) C 1s of the M1 sample. | |
Table 1 XPS peak parameters of the synthesized samples
| Sample ID |
Mo4+ |
Mo6+ |
| Mo 3d5/2 |
Mo 3d3/2 |
Mo 3d5/2 |
Mo 3d3/2 |
| Peak Position (eV) |
FWHM |
Peak Position (eV) |
FWHM |
Peak Position (eV) |
FWHM |
Peak Position (eV) |
FWHM |
|
|
|
|
|
|
|
|
|
|
| N1 |
230.1 |
1.15 |
233.2 |
1.14 |
230.9 |
1.12 |
234.1 |
1.11 |
| M1 |
230.1 |
1.25 |
233.2 |
1.29 |
230.9 |
0.93 |
234.2 |
0.92 |
|
|
O 1s |
| Peak position (eV) Mo–O |
Peak position (eV) Ovac |
Peak position (eV) C–O |
| N1 |
528.10 |
530.45 |
— |
| M1 |
528.08 |
530.75 |
527.21 |
3.3 Morphological features
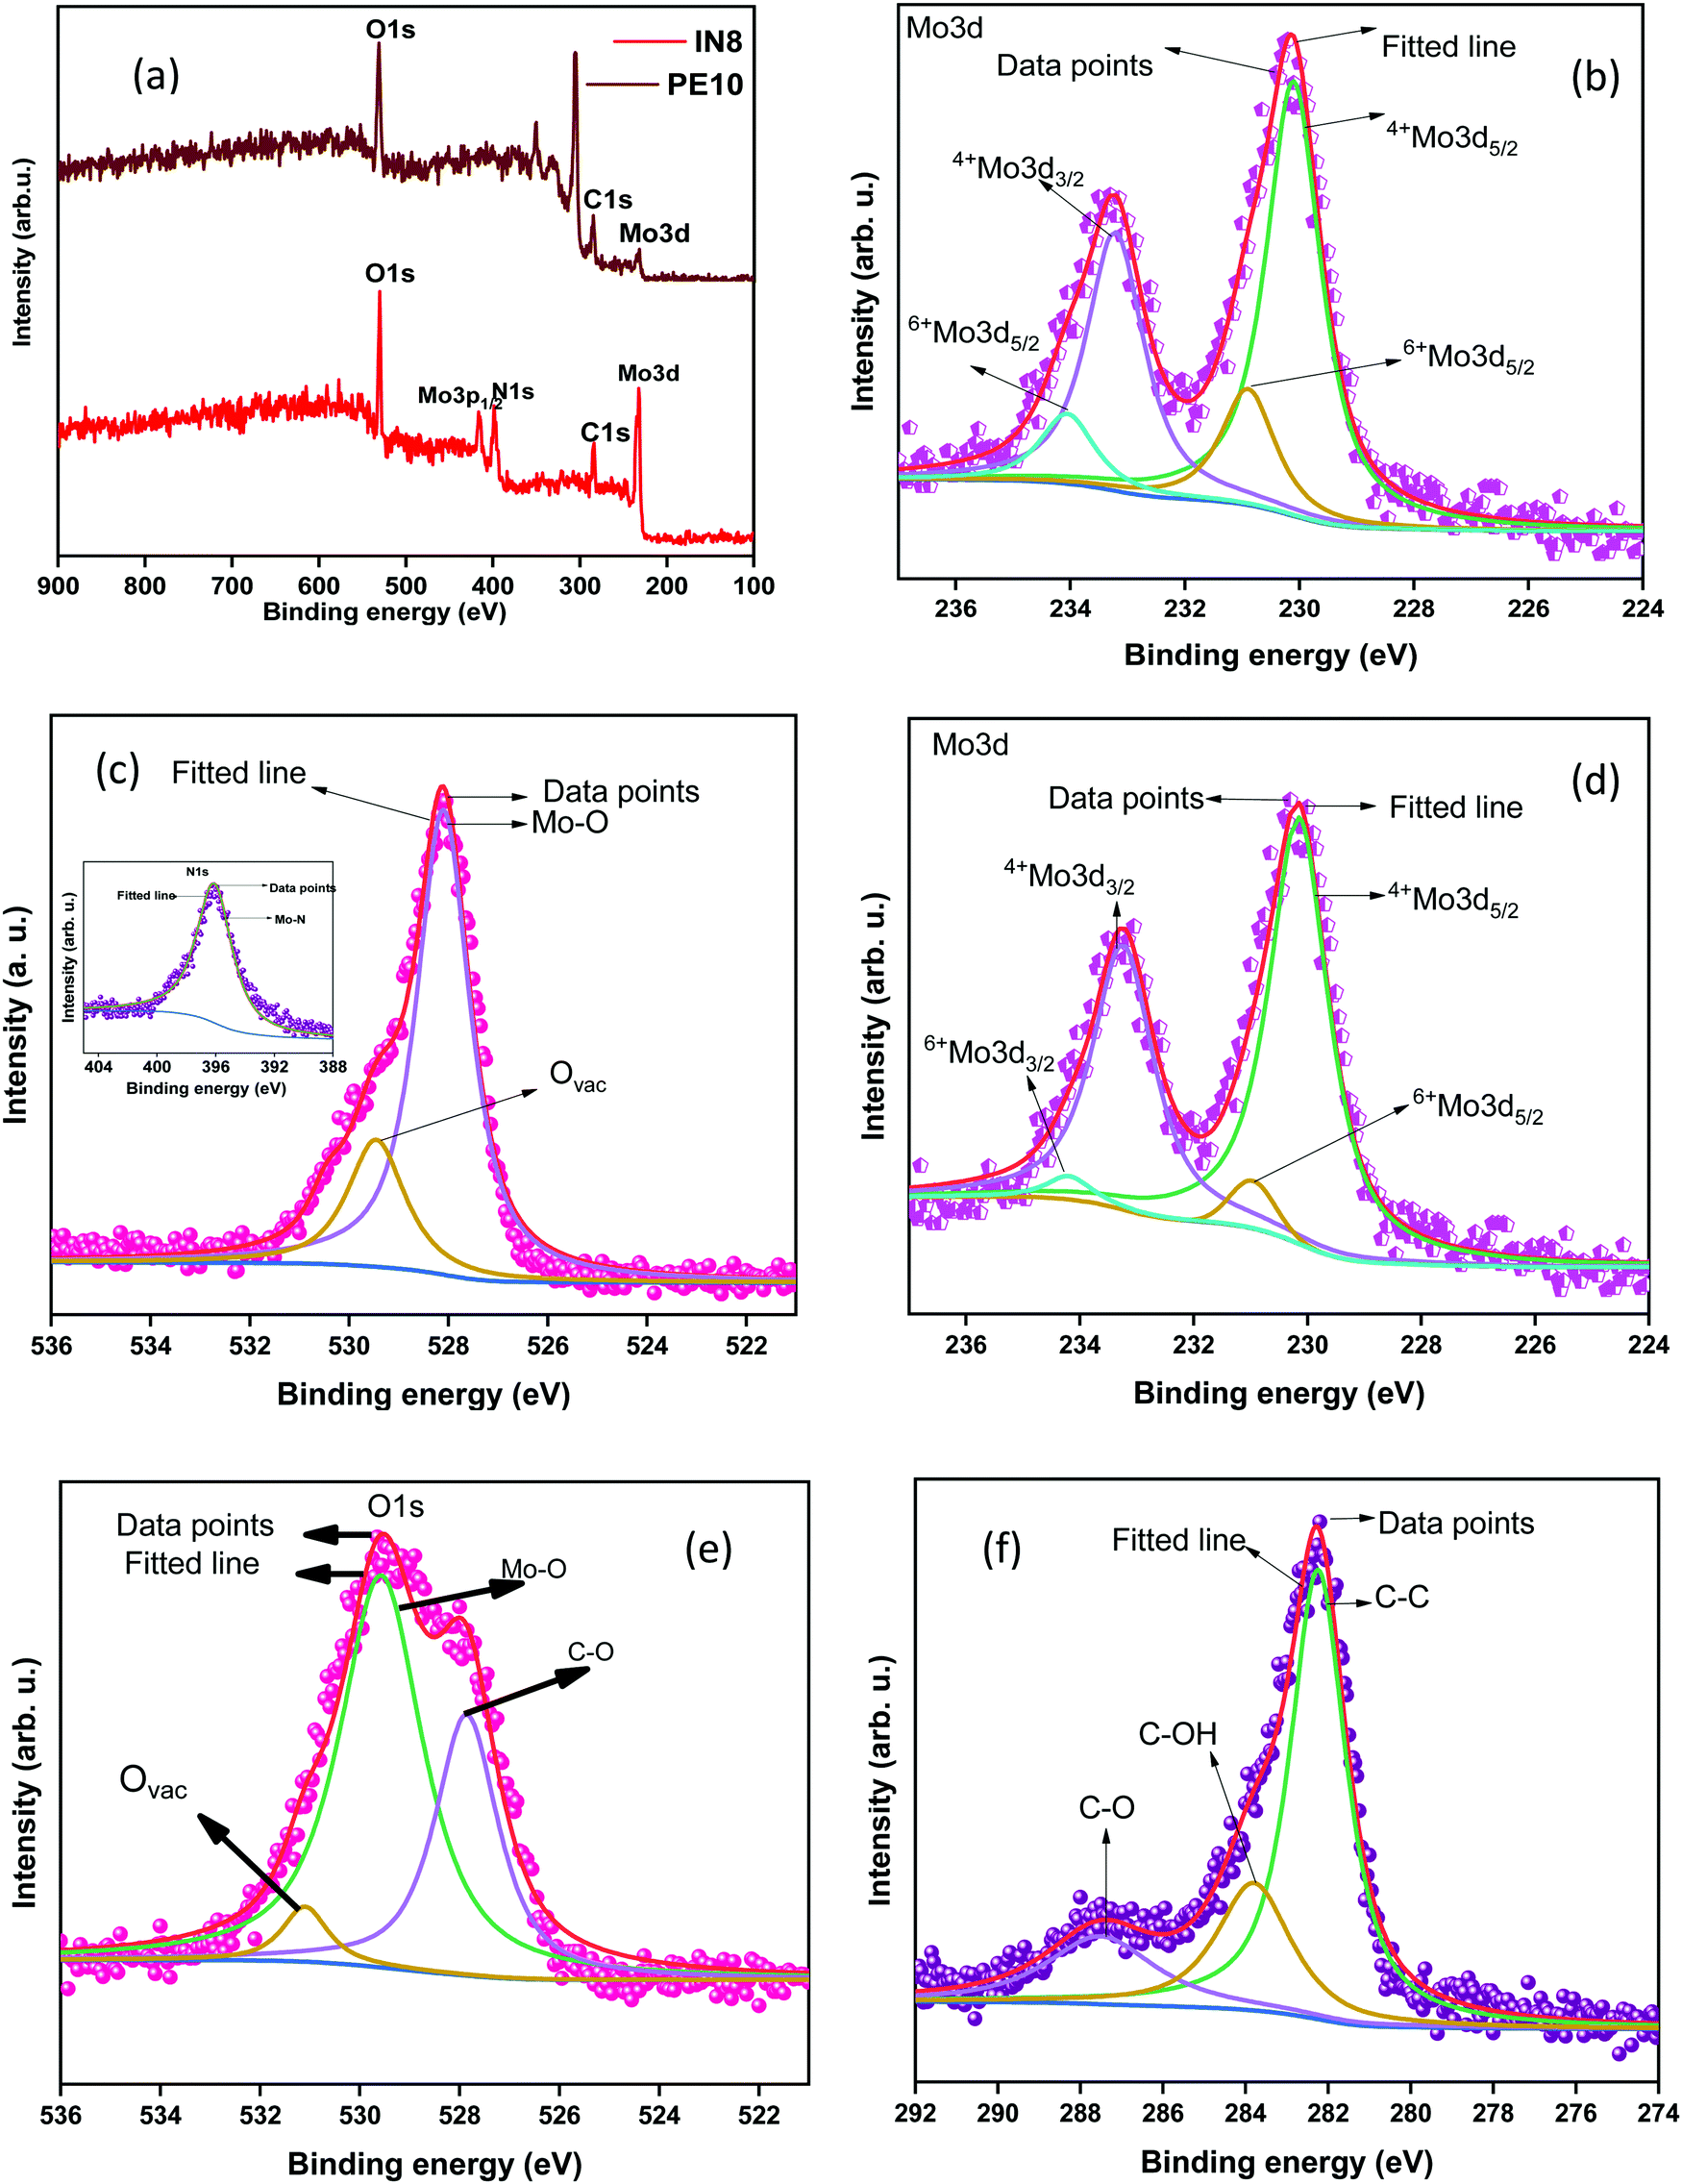
The morphology of the as-synthesized MoO2 nanostructure was investigated by FESEM (Fig. 3). Fig. 3(a) and (b) show the compacted surface characteristics of the as-synthesized N1 sample. The laminar and two-dimensional stacked structures exhibited more facets and edges. These structures reveal faceted sharp cut, dull blade cut, and tear-out type patterns (Fig. 3(b)). Fig. 3(c) represents the morphology of the M1 sample exhibiting a layered and flaky type structure of MoO2. The magnified view of the stacks showed that the layers are not stacked in one direction but exist as crosslinked layers (Fig. 3(d)). This type of stacking inhibits compactness and facilitates space between the stacked layers, which provides more surface sites for electrochemical applications.52 For further investigation, transmission electron microscopy (TEM) is used to confirm the morphology of these synthesized structures at the atomic scale. TEM images of the N1 sample revealed the formation of small faceted particles of nearly uniform dimensions, as shown in Fig. 4(a). Fig. 4(b) shows the presence of agglomerated particles of larger size as compared to that of N1. The TEM micrograph (Fig. 4(c)) of the flaky type M1 sample reveals the formation of a 2D shape and is in good resemblance with the FESEM results. Fig. 4(d) shows that the structures were connected and decorated on carbon cloth. HRTEM micrographs of N1 (Fig. 4(e)) and M1 (Fig. 4(f)) confirmed the formation of the MoO2 phases, following the XRD results. The FESEM and TEM images indicated that the particles of both the samples adhere to each other. The physical contact between the particles will be beneficial for electron conduction and will help to enhance electrochemical stability.
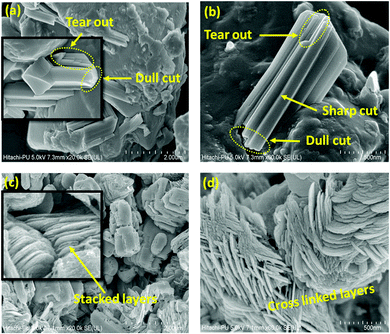 |
| | Fig. 3 FESEM micrographs of the (a), (b) N1 and (c), (d) M1 samples. | |
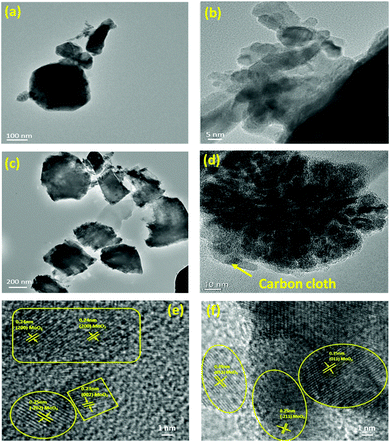 |
| | Fig. 4 TEM micrographs of the as-prepared MoO2 nanoparticles of (a), (b) N1 and (c), (d) M1 samples; HRTEM micrographs of the (e) N1 and (f) M1 samples. | |
4. Electrochemical studies
4.1 HER activity
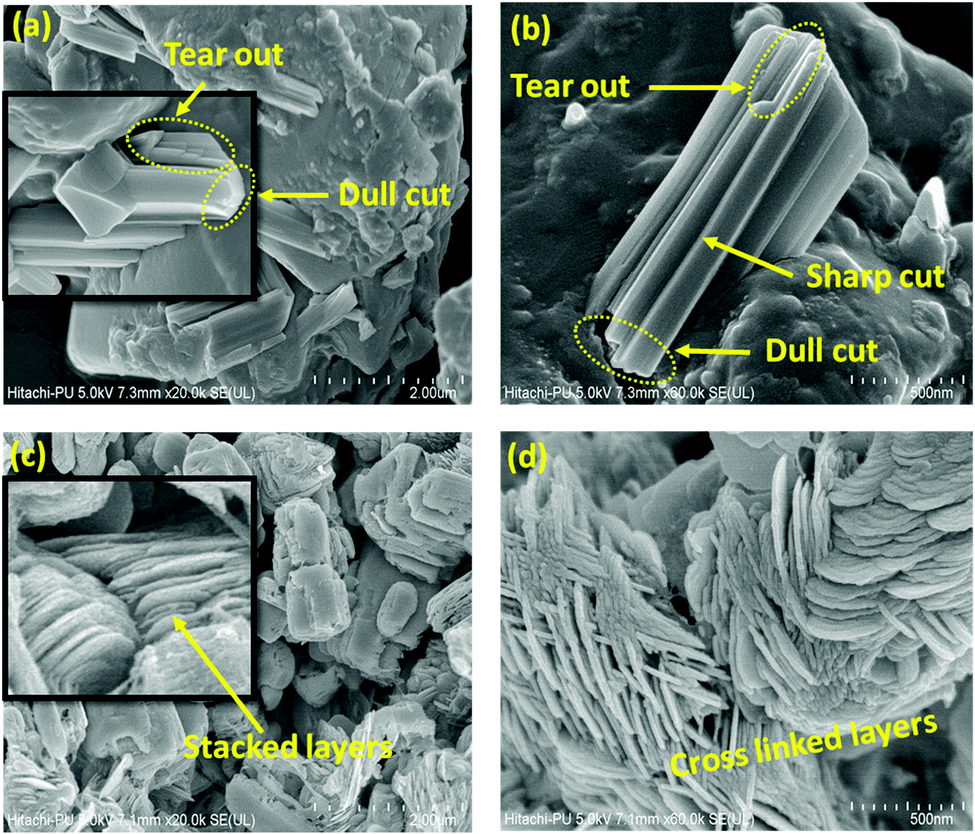
The linear sweep voltammetry (LSV) curves of the synthesized samples investigated in a low voltage window of 0 to −0.45 V are shown in Fig. 5(a). The results revealed that the synthesized MoO2 samples exhibit a very high charge transfer rate. The unique types of morphological features provide more active edge sites and interconnected/crosslinked layers, help to enhance the charge transfer rate. Moreover, the crosslinked and stacked layered structures provide more active sites for hydrogen adsorption/desorption at a rapid rate required for improved HER activity. Furthermore, Tafel plots have been measured to discuss the mechanism for the HER in an acidic electrolyte. Fig. 5(d) shows the Tafel plots of the as-synthesized samples and the Tafel slope ‘b’ is estimated from the linear section of the Tafel plot using the Tafel equation (η = a + blogj, where ‘a’ represents the intercept, ‘b’ is the Tafel slope, ‘j’ stands for the current density and ‘η’ is the overpotential).16 A value of ‘b’ of 30 mV dec−1 corresponds to the Tafel mechanism, of 40 mV dec−1 to the Heyrovsky mechanism, and of up to 120 mV dec−1 to the Volmer step as the rate-determining step for HER activity.53 The Tafel slopes ‘b’ for N1 and M1 estimated from the Tafel plots (Fig. 5(b)) are 46.3 and 47.8 mV dec−1, respectively. The values of ‘b’ are smaller than those of the electrocatalysts reported earlier and a comparison of the Tafel slopes of the prepared samples with those of other reported electrocatalysts (Mo species) in acidic medium is given in Table 2.
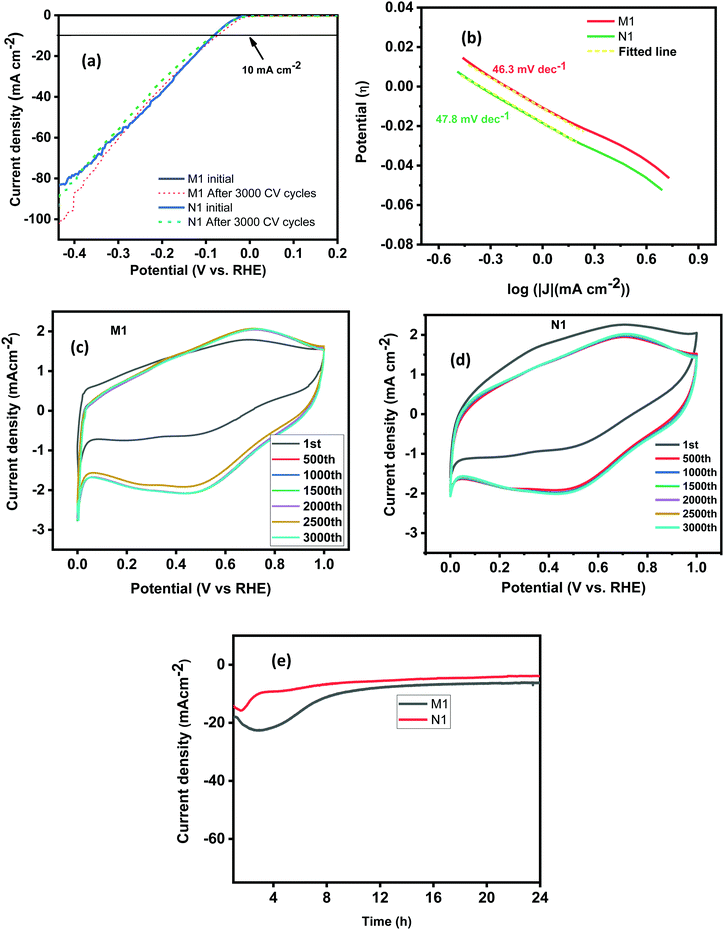 |
| | Fig. 5 (a) LSV curves of N1 and M1 before and after 3000 cycles. (b) The Tafel plots, (c) and (d) CV curves for 3000 cycles and (e) i–t plots of the N1 and M1 samples. | |
Table 2 Comparison of overpotentials and Tafel slopes of the prepared MoO2 nanoparticles with those of reported electrocatalysts
| Catalyst |
Electrolyte |
Overpotential |
Tafel slope |
Ref. |
| M1 |
0.5 M H2SO4 |
80 mV |
46.3 mV dec−1 |
Present work |
| N1 |
0.5 M H2SO4 |
80 mV |
47.8 mV dec−1 |
Present work |
| Nanoporous Mo2C nanowires 125 mV |
0.5 M H2SO4 |
125 |
53.00 |
5
|
| Pt Cs/MoO2 |
0.5 M H2SO4 |
47 mV |
32.6 mV dec−1 |
11
|
| MoO2 nanostructures |
0.5 M H2SO4 |
72 mV |
84.1 mV dec−1 |
54
|
| MoSe2/MoO2 |
0.5 M H2SO4 |
142 mV |
48.9 mV dec−1 |
55
|
| MoO2/RGO/PI-CNT |
0.5 M H2SO4 |
110 mV |
68 mV dec−1 |
56
|
| Double-gyroid MoS2 deposited on FTO N |
0.5 M H2SO4 |
260 |
50.00 |
57
|
| Vertically aligned MoS2 films |
0.5 M H2SO4 |
400 |
86.00 |
58
|
| Vertically aligned MoSe2 films |
250 |
62.00 |
| Mo2C/graphene hybrid 0.5 M H2SO4 175 mV 54 97 |
0.5 M H2SO4 |
175 |
54.00 |
59
|
| MoN nanosheets |
0.5 M H2SO4 |
— |
90.00 |
60
|
| MoP nanoparticles |
0.5 M H2SO4 |
125 |
54.00 |
61
|
| MoOx/CC |
0.5 M H2SO4 |
277 |
81.34 |
62
|
The calculated values of ‘b’ for N1 and M1 suggest that the Volmer–Heyrovsky mechanism is the rate-determining step for the HER. The rapid charge transfer could be attributed to the surface characteristics of the synthesized samples, which provide more edge sites for activation and improve the charge transfer kinetics rapidly. The Mo oxide layer acts as the charge transport layer to enhance the rapid charge transport characteristics of the synthesized samples. The current density measured for both the samples starts with a small onset potential of approximately −0.016 V (at 1 mA cm−2), which is very low compared to those reported in the literature.63,64 The synthesized samples exhibited enhanced HER activity, which requires a small overpotential (η) of 80 mV to produce a current density of 10 mA cm−2. The required overpotential in the present case is very low compared to reported results and other Mo species compared in Table 2.54–56,65
Stability is another key factor for the electrocatalyst's practical utilization. The stability of the samples has been estimated by performing CV measurements. The CV cycles were measured at a constant scan rate of 100 mV s−1 within a wide potential window of 0 to 1 V for 3000 CV cycles. For sample N1, the LSV plots measured after 3000 CV cycles revealed nearly similar results to those obtained initially (Fig. 5(a)). There is negligible loss of current density after 3000 CV cycles indicating high stability of the synthesized samples. The shape retention of the CV curves also supports the stability of the synthesized samples as shown in (Fig. 5(c) and (d)). The stability features were also confirmed by the current–time (i–t) test performed for 24 h (Fig. 5(e)) at a fixed applied potential of 120 mV, higher than the calculated overpotential to maintain a current density of 10 mA cm−2. The results reveal that the synthesized samples are stable for 24 h without any degradation of the current density. The higher stability of the N1 and M1 samples is attributed to their unique morphological features and the presence of inherent nitrogen and carbon used during the synthesis that protects the species from degradation during the electrochemical processing.
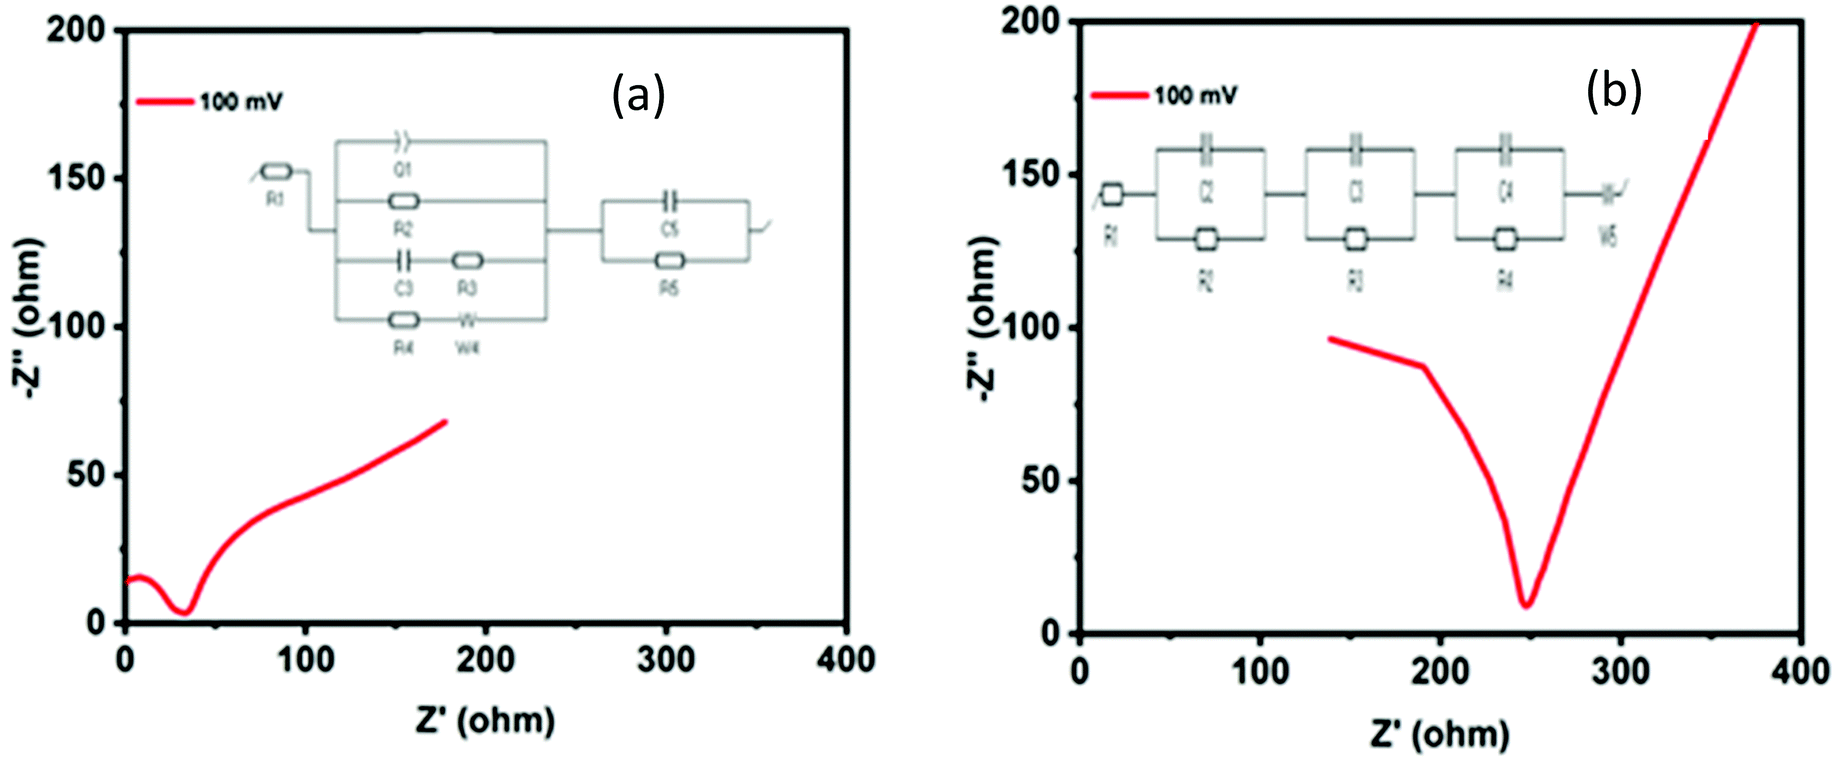
Electrochemical impedance spectroscopy (EIS) measurements were conducted to investigate the inherent features of the HER activity of the MoO2 structures. The EIS plots (Nyquist plots) of N1 (Fig. 6(a)) and M1 (Fig. 6(b)) differ in their characteristics at high frequencies. The inset figure represents the equivalent circuit model of the EIS plots fitted by EC lab Z-fit software. The first intercept point on the x-axis is the equivalent series resistance (ESR) associated with the electrode intrinsic resistance and bulk ion resistance in the electrolyte solution.66 The first semicircle at a higher frequency range corresponds to the porous property of the surface of the electrode and determines the charge transfer resistance (Rct = R1) of the electrode–electrolyte interface. The charge transfer resistances of the N1 and M1 samples were calculated to be equal to 26.45 and 48.27 Ohm, respectively, which permits high charge transfer kinetics for the HER. The lower Rct may be attributed to the array of morphological features providing more active sites and synergistic effects of nitrogen and carbon in the synthesized samples. This may also be attributed to the morphological features similar to graphene and the crosslinked stacks providing more active sites and shorter pathways for ion transfer. Furthermore, the lower frequency linear patterns in the EIS curves show the capacitive behavior of the synthesized samples. The more linear pattern of the M1 sample may be attributed to the carbon present in the sample, which enhanced the capacitive properties. Electrode porosity, surface roughness, non-equipotential surfaces, and surface inhomogeneity can be correlated with the constant phase element (CPE) present in the equivalent circuit.
 |
| | Fig. 6 Nyquist plots (EIS curves) of (a) N1 and (b) M1. The inset figure (a) and (b) represents the equivalent circuit model of the EIS plots fitted by EC lab Z-fit software. | |
4.2 Capacitance behavior
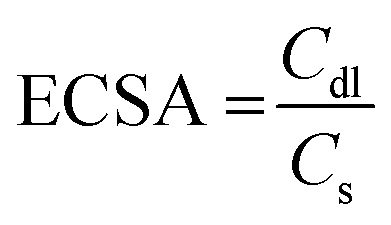
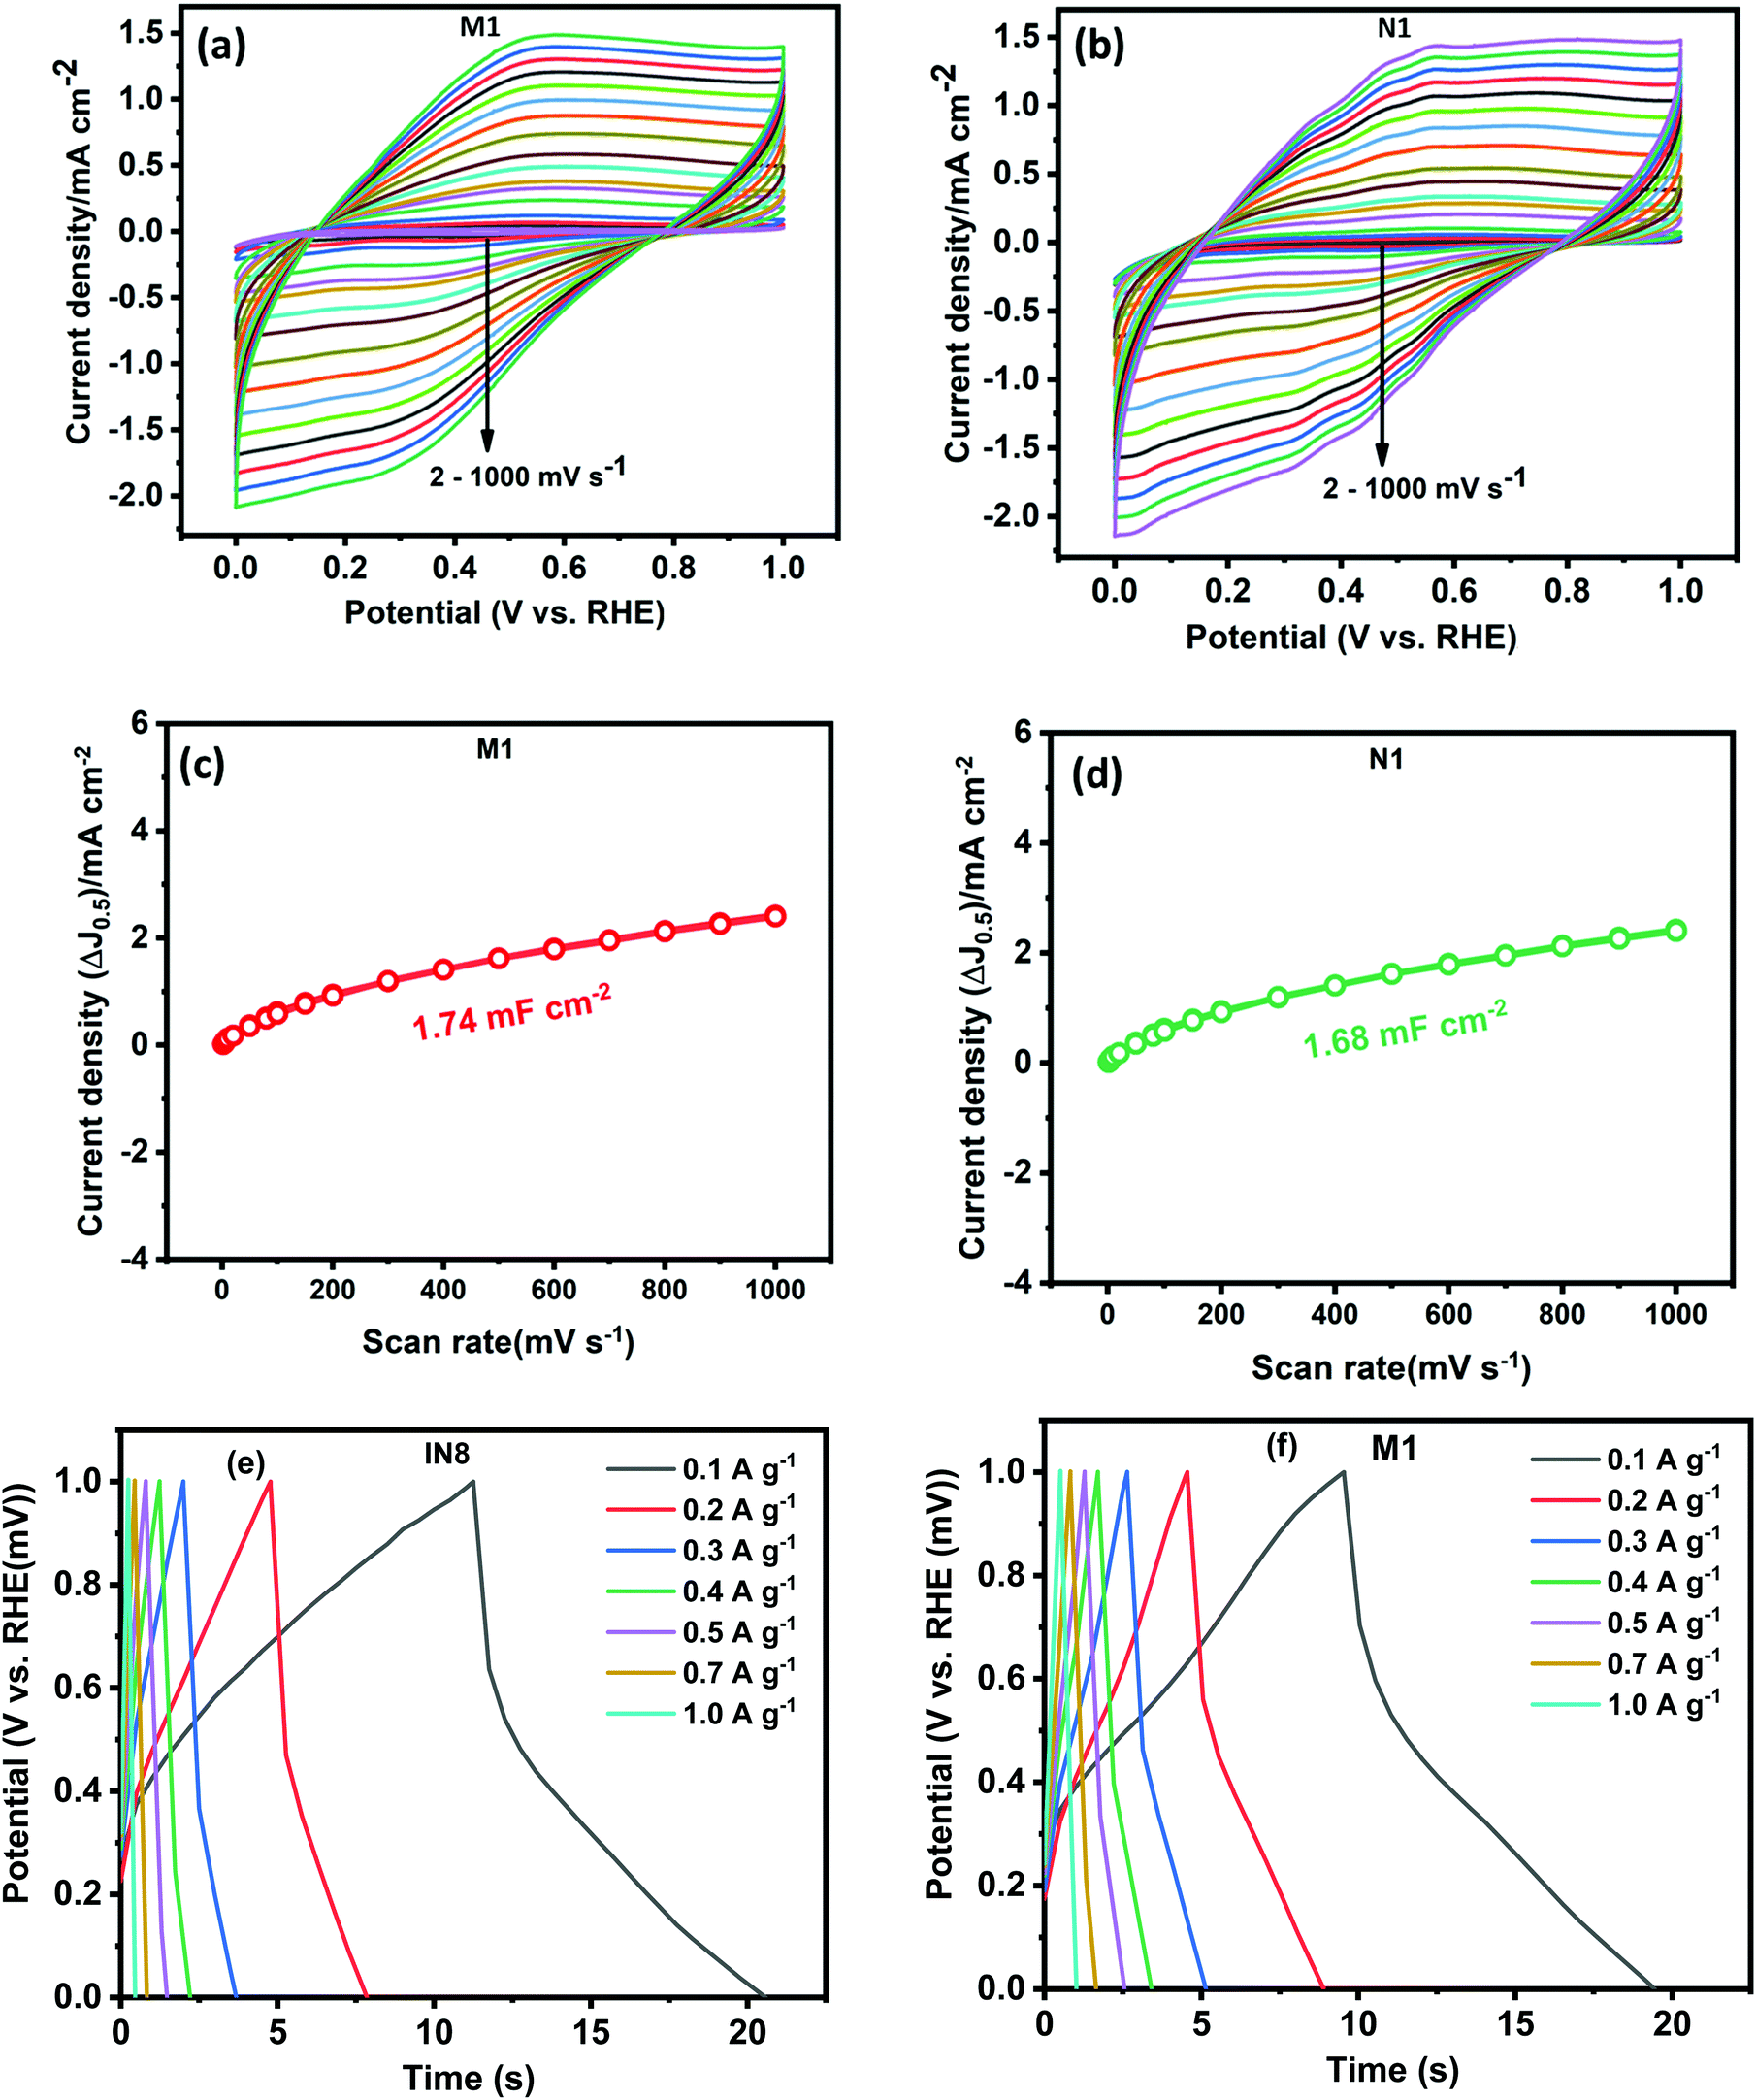
To evaluate the electrochemical capacitor performance of the as-synthesized samples a series of CV and galvanic charge–discharge (GCD) measurements were performed. CV was performed at different scan rates in a wide potential window from 0 to 1 V, as shown in Fig. 7(a) and (b). The electrochemical active surface areas (ECSA) were estimated from the CV plots performed at various scans through the following criterion:67
where Cdl is the electrochemical double-layer capacitance (EDLC) measured from the plot of scan rate by the sum of the anodic and cathodic current densities (Fig. 7(c) and (d)) and Cs is the specific capacitance (0.040mF cm−2) assumed here.67 The ECSA of M1 and N1 are 43.5 and 42.0 cm2, respectively. Both samples exhibited nearly the same ECSA due to their similar CV patterns. The quasi-rectangular shape of the CV pattern indicates the pseudocapacitance behavior of the synthesized Mo oxide structures. Usually, the CV pattern exhibiting redox peaks was considered as that of a pseudocapacitor. After the reports of Jiang and Liu15 and Brousse et al.,68 the confusion between the capacitor and battery electrode has been well differentiated. In the present case, the pseudocapacitance arises due to faradaic interactions between the electrode and electrolyte surface, which lead to the passage of charge carriers across the double layer.4,68 CV plots (Fig. 7(a) and (b)) show that the areal capacitance increases with increasing scan rates, which confirms the enhanced charge storage capability of the synthesized samples.
 |
| | Fig. 7 CV curves at various scan rates of (a) N1 and (b) M1; graphs showing current density (ΔJ0.5) vs scan rate of (c) M1 and (d) N1; GCD curves of (e) N1 and (f) M1. | |
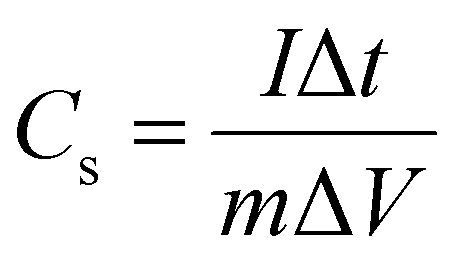
To elucidate the actual capacitance of the synthesized pseudocapacitors, galvanic charge–discharge (GCD) measurements were performed, as shown in Fig. 7(c) and (d). GCD was performed at current densities within a potential range of 0–1 V. The GCD curves exhibited a quasi-linear and triangular shape indicating a pseudocapacitive contribution to the overall capacitance.15 The electrochemical signals of the pseudocapacitors and the electrochemical double-layer capacitors (EDLCs, Cdl) are nearly similar. However, the pseudocapacitor behavior is attributed to the surface faradaic reactions on the surface or near the surface occurring at a very rapid rate. The specific capacitance (Cs) mainly reveals the true performance of the synthesized capacitor electrode and has been estimated using the following criterion:17,69
| |  | (7) |
Here
I denotes the discharge current (A), Δ
t is the discharge time,
m is the electroactive mass of the material, and Δ
V is the potential window. The specific capacitance values of N1 at current densities of 0.1, 0.2, 0.3, 0.4, 0.5. 0.7 and 1 A g
−1 are calculated to be equal to 0.95, 0.59, 0.50, 0.39, 0.35, 0.27 and 0.20 F g
−1. However, for M1 the specific capacitance values at 0.1, 0.2, 0.3, 0.4, 0.5. 0.7 and 1 A g
−1 are 0.97, 0.85, 0.78, 0.66, 0.63, 0.57 and 0.49 F g
−1. The pseudocapacitance of the synthesized MoO
2 nanostructures can be attributed to the non-ion diffusion-controlled redox reactions occurring at a much faster rate. This could be ascribed to the crystal phases and nano sizes of the synthesized structures with more exposed sites of the electrode material.
15 The mechanism of intercalation of charge carriers at the surface or near the surface of the electrode enhances the pseudocapacitance in these species, as also observed with the MoO
3 species reported in the literature.
15,70 Although the intercalation mechanism is well elaborated for battery electrodes, the electrochemical signals as observed in CV and GCD validate the pseudocapacitor behavior of the synthesized MoO
2 structures. The CV at low scan rates with no redox peaks and straight lines of EIS at lower frequencies with phase angles less than 90 degrees validate the actual pseudocapacitor nature of the synthesized electrodes.
71 The results reveal the potential application of the synthesized material for pseudocapacitors.
5. Conclusions
In summary, MoO2 structures have been synthesized in the presence of nitrogen (N) and carbon (C) via a simple and cost-effective direct reduction route. The prepared MoO2 structures exhibit laminar and faceted structures as observed in the FESEM examinations. These structures show excellent electrochemical performance towards the HER with very low Tafel slopes of (46.3–47.8) mV dec−1 and long-term cycling stability of up to 3000 CV cycles in 0.5 M H2SO4. For these samples, a very low overpotential of only 80 mV is needed to generate a current density of 10 mA cm−2. Such high electrochemical performance can be attributed to the stacked-layer structure and the presence of N and C within the samples. The stacked-layer structure facilitates the fast transportation of electrons/ions and exposes more active sites. Both the samples show pseudocapacitive behavior with a specific capacitance value of (0.95–0.97) F g−1 at a current density of 0.1 A g−1. Based on CV and GCD measurements, the pseudocapacitive behavior of the samples is discussed in detail. Hence, these results show the high potential of MoO3 for electrochemical energy conversion and storage.
Conflicts of interest
The authors declare that there are no conflicts of interest.
Acknowledgements
The authors are highly thankful to the authorities of VT-CEEMS-TIET, and especially Professor Roop Mahajan (Chairperson) and Professor Rajeev Mehta (Coordinator) for financial assistance, constant support and suggestions to carry out the work. The authors offer special thanks to SIAF PU for XRD and FESEM analysis, AIRF-JNU for TEM/HRTEM and IIT Kanpur for XPS analysis.
References
- S. Wang, A. Lu and C. J. Zhong, Nano Convergence, 2021, 8, 4 CrossRef CAS PubMed.
- X. Zou and Y. Zhang, Chem. Soc. Rev., 2015, 44, 5148–5180 RSC.
- H. M. Chen, C. K. Chen, R.-S. Liu, L. Zhang, J. Zhang and D. P. Wilkinson, Chem. Soc. Rev., 2012, 41, 5654–5671 RSC.
- R. A. Mir and O. P. Pandey, Appl. Phys. Lett., 2021, 118, 253902 CrossRef CAS.
- L. Liao, S. Wang, J. Xiao, X. Bian, Y. Zhang, M. D. Scanlon, X. Hu, Y. Tang, B. Liu and H. H. Girault, Energy Environ. Sci., 2014, 7, 387–392 RSC.
- R. A. Rather, A. Mehta, Y. Lu, M. Valant, M. Fang and W. Liu, Int. J. Hydrogen Energy, 2021, 46, 21866–21888 CrossRef CAS.
- Y. Wang, H. Zhuo, X. Zhang, X. Dai, K. Yu, C. Luan, L. Yu, Y. Xiao, J. Li, M. Wang and F. Gao, Nano Energy, 2018, 48, 590–599 CrossRef CAS.
- C. Li and J. B. Baek, ACS Omega, 2020, 5, 31–40 CrossRef CAS PubMed.
- J. Huang, Y. Jiang, T. An and M. Cao, J. Mater. Chem. A, 2020, 8, 25465–25498 RSC.
- S. Saha, B. Martin, B. Leonard and D. Li, J. Mater. Chem. A, 2016, 4, 9253–9265 RSC.
- X. Li, J. Yu, J. Jia, A. Wang, L. Zhao, T. Xiong, H. Liu and W. Zhou, Nano Energy, 2019, 62, 127–135 CrossRef CAS.
- K. Ojha, S. Saha, P. Dagar and A. K. Ganguli, Phys. Chem. Chem. Phys., 2018, 20, 6777–6799 RSC.
- Y. Manoharan, S. E. Hosseini, B. Butler, H. Alzhahrani, B. T. F. Senior, T. Ashuri and J. Krohn, Appl. Sci., 2019, 9(11), 2296 CrossRef CAS.
- L. Dong, X. Ma, Y. Li, L. Zhao, W. Liu, J. Cheng, C. Xu, B. Li, Q. H. Yang and F. Kang, Energy Storage Mater., 2018, 13, 96–102 CrossRef.
- Y. Jiang and J. Liu, Energy Environ. Mater., 2019, 2, 30–37 CrossRef.
- R. A. Mir and O. P. Pandey, Sustainable Energy Fuels, 2020, 4, 655–669 RSC.
- S. Upadhyay and O. P. Pandey, J. Alloys Compd., 2020, 157522 Search PubMed.
- J. Liu, S. Tang, Y. Lu, G. Cai, S. Liang, W. Wang and X. Chen, Energy Environ. Sci., 2013, 6, 2691–2697 RSC.
- Y. Wang, Z. Liang, H. Zheng and R. Cao, Chem. – Asian J., 2020, 15, 3717–3736 CrossRef CAS PubMed.
- S. Jo, Y. W. Lee, J. Hong and J. I. Sohn, Catalysts, 2020, 10, 1–8 Search PubMed.
- Y. Wu, R. Sun and J. Cen, Front. Chem., 2020, 8, 1–7 CrossRef PubMed.
- H. Begum, M. S. Ahmed and S. Jeon, Electrochim. Acta, 2019, 296, 235–242 CrossRef CAS.
- Y. Li, X. Tan, W. Yang, X. Bo, Z. Su, T. Zhao, S. C. Smith and C. Zhao, Cell Rep. Phys. Sci., 2020, 1, 100275 CrossRef CAS.
- Z. Zhao, C. Liu, H. S. Tsai, J. Zhou, Y. Zhang, T. Wang, G. Ma, C. Qi and M. Huo, Int. J. Hydrogen Energy DOI:10.1016/j.ijhydene.2021.07.117.
- Y. Li, X. Zhai, Y. Liu, H. Wei, J. Ma, M. Chen, X. Liu, W. Zhang, G. Wang, F. Ren and S. Wei, Front. Mater., 2020, 7, 1–8 CrossRef CAS.
- K. Panigrahi, P. Howli and K. K. Chattopadhyay, Electrochim. Acta, 2020, 337, 135701 CrossRef CAS.
- B. A. Yusuf, M. Xie, N. Ullah, C. J. Oluigbo, W. Yaseen, J. Xie and Y. Xu, Appl. Surf. Sci., 2021, 537, 147971 CrossRef CAS.
- L. B. Huang, L. Zhao, Y. Zhang, Y. Y. Chen, Q. H. Zhang, H. Luo, X. Zhang, T. Tang, L. Gu and J. S. Hu, Adv. Energy Mater., 2018, 8, 1–7 Search PubMed.
- H. S. Kim, J. B. Cook, H. Lin, J. S. Ko, S. H. Tolbert, V. Ozolins and B. Dunn, Nat. Mater., 2017, 16, 454–462 CrossRef CAS PubMed.
- Z. Luo, R. Miao, T. D. Huan, I. M. Mosa, A. S. Poyraz, W. Zhong, J. E. Cloud, D. A. Kriz, S. Thanneeru, J. He, Y. Zhang, R. Ramprasad and S. L. Suib, Adv. Energy Mater., 2016, 6, 1600528 CrossRef.
- E. Zhou, C. Wang, Q. Zhao, Z. Li, M. Shao, X. Deng, X. Liu and X. Xu, Ceram. Int., 2016, 42, 2198–2203 CrossRef CAS.
- H. Zhang, L. Zeng, X. Wu, L. Lian and M. Wei, J. Alloys Compd., 2013, 580, 358–362 CrossRef CAS.
- Y. Wang, H. Zhao, A. Di, X. Yang, B. Cong and G. Chen, Int. J. Energy Res., 2021, 45, 9438–9448 CrossRef CAS.
- H. Singh and O. P. Pandey, Ceram. Int., 2015, 41, 10481–10487 CrossRef CAS.
- R. A. Mir and O. P. Pandey, J. Cleaner Prod., 2019, 218, 644–655 CrossRef CAS.
- H. K. Sidana, R. A. Mir and O. P. Pandey, J. Alloys Compd., 2018, 736, 255–265 CrossRef CAS.
- J. Dang, G.-H. Zhang, K.-C. Chou, R. G. Reddy, Y. He and Y. Sun, Int. J. Refract. Met. Hard Mater., 2013, 41, 216–223 CrossRef CAS.
- M. Saghafi, S. Heshmati-Manesh, A. Ataie and A. A. Khodadadi, Int. J. Refract. Met. Hard Mater., 2012, 30, 128–132 CrossRef CAS.
- M. Saghafi, A. Ataie and S. Heshmati-Manesh, Int. J. Mod. Phys.: Conf. Ser., 2012, 05, 441–447 CAS.
- S. V. Aydinyan, Z. Gumruyan, K. V. Manukyan and S. L. Kharatyan, Mater. Sci. Eng., B, 2010, 172, 267–271 CrossRef CAS.
- S. Chalotra, R. A. Mir, G. Kaur and O. P. Pandey, Ceram. Int., 2020, 46, 703–714 CrossRef CAS.
- R. A. Mir, P. Sharma and O. P. Pandey, Sci. Rep., 2017, 7, 3518 CrossRef PubMed.
- R. A. Mir and O. P. Pandey, Chem. Eng. J., 2018, 348, 1037–1048 CrossRef CAS.
- J. Baltrusaitis, B. Mendoza-Sanchez, V. Fernandez, R. Veenstra, N. Dukstiene, A. Roberts and N. Fairley, Appl. Surf. Sci., 2015, 326, 151–161 CrossRef CAS.
- B. Mendoza-Sánchez, T. Brousse, C. Ramirez-Castro, V. Nicolosi and P. S. Grant, Electrochim. Acta, 2013, 91, 253–260 CrossRef.
- D. O. Scanlon, G. W. Watson, D. J. Payne, G. R. Atkinson, R. G. Egdell and D. S. L. Law, J. Phys. Chem. C, 2010, 114, 4636–4645 CrossRef CAS.
- T. Schroeder, J. Zegenhagen, N. Magg, B. Immaraporn and H. J. Freund, Surf. Sci., 2004, 552, 85–97 CrossRef CAS.
- H. Wang, Y. Cao, C. Sun, G. Zou, J. Huang, X. Kuai, J. Zhao and L. Gao, ChemSusChem, 2017, 10, 3540–3546 CrossRef CAS PubMed.
- P. A. Spevack and N. S. McIntyre, J. Phys. Chem., 1992, 96, 9029–9035 CrossRef CAS.
- Y. Sun, X. Hu, W. Luo and Y. Huang, ACS Nano, 2011, 5, 7100–7107 CrossRef CAS PubMed.
- N. Dwivedi, R. J. Yeo, N. Satyanarayana, S. Kundu, S. Tripathy and C. S. Bhatia, Sci. Rep., 2015, 5, 7772 CrossRef CAS PubMed.
- U. Gupta and C. N. R. Rao, Nano Energy, 2017, 41, 49–65 CrossRef CAS.
- A. Kahyarian, B. Brown and S. Nesic, J. Electrochem. Soc., 2017, 164, H365–H374 CrossRef CAS.
- V. Ramakrishnan, C. Alex, A. N. Nair and N. S. John, Chem. – Eur. J., 2018, 24, 18003–18011 CrossRef CAS PubMed.
- C. Jian, Q. Cai, W. Hong, J. Li and W. Liu, Small, 2018, 14, 1703798 CrossRef PubMed.
- X. Li, Y. Jiang, L. Jia and C. Wang, J. Power Sources, 2016, 304, 146–154 CrossRef CAS.
- J. Kibsgaard, Z. Chen, B. N. Reinecke and T. F. Jaramillo, Nat. Mater., 2012, 11, 963–969 CrossRef CAS PubMed.
- D. Kong, H. Wang, J. J. Cha, M. Pasta, K. J. Koski, J. Yao and Y. Cui, Nano Lett., 2013, 13, 1341–1347 CrossRef CAS PubMed.
- L. F. Pan, Y. H. Li, S. Yang, P. F. Liu, M. Q. Yu and H. G. Yang, Chem. Commun., 2014, 50, 13135–13137 RSC.
- J. Xie, S. Li, X. Zhang, J. Zhang, R. Wang, H. Zhang, B. Pan and Y. Xie, Chem. Sci., 2014, 5, 4615–4620 RSC.
- Z. Xing, Q. Liu, A. M. Asiri and X. Sun, Adv. Mater., 2014, 26, 5702–5707 CrossRef CAS PubMed.
- J. Sun, X. Zhang, M. Jin, Q. Xiong, G. Wang, H. Zhang and H. Zhao, Nano Res., 2021, 14, 268–274 CrossRef CAS.
- L. Yang, J. Yu, Z. Wei, G. Li, L. Cao, W. Zhou and S. Chen, Nano Energy, 2017, 41, 772–779 CrossRef CAS.
- Y. Rheem, Y. Han, K. H. Lee, S. M. Choi and N. V. Myung, Nanotechnology, 2017, 28, 105605 CrossRef PubMed.
- M. Zeng and Y. Li, J. Mater. Chem. A, 2015, 3, 14942–14962 RSC.
- Y. Wang, Z. Shi, Y. Huang, Y. Ma, C. Wang, M. Chen and Y. Chen, J. Phys. Chem. C, 2009, 113, 13103–13107 CrossRef CAS.
- Z. Liu, D. Jiang, L. Yang, J. Yu, X. Li, X. Liu, L. Zhao, X. L. Zhang, F. Han, W. Zhou and H. Liu, Nano Energy, 2021, 88, 106302 CrossRef CAS.
- T. Brousse, D. Bélanger and J. W. Long, J. Electrochem. Soc., 2015, 162, A5185–A5189 CrossRef CAS.
- Y. Zhu, X. Ji, S. Cheng, Z. Y. Chern, J. Jia, L. Yang, H. Luo, J. Yu, X. Peng, J. Wang, W. Zhou and M. Liu, ACS Nano, 2019, 13, 9091–9099 CrossRef CAS PubMed.
- T. Brezesinski, J. Wang, S. H. Tolbert and B. Dunn, Nat. Mater., 2010, 9, 146–151 CrossRef CAS PubMed.
- V. Augustyn, P. Simon and B. Dunn, Energy Environ. Sci., 2014, 7, 1597–1614 RSC.
|
| This journal is © The Royal Society of Chemistry 2022 |
Click here to see how this site uses Cookies. View our privacy policy here. 
 Open Access Article
 This Open Access Article is licensed under a
  *ab,
Sanjay
Upadhyay
c,
Rayees Ahmad
Rather
*ab,
Sanjay
Upadhyay
c,
Rayees Ahmad
Rather