
 Open Access Article
 This Open Access Article is licensed under a Creative Commons Attribution-Non Commercial 3.0 Unported Licence
Improved efficiency of an herbicide combining bentazone and terbuthylazine – can weeds be controlled with better environmental safety?†
Libânia
Queirós
a,
Sirine
Bouguerra
b,
Ruth
Pereira
b,
Inês P. E.
Macário
ac,
Joana I.
Santos
a,
Telma
Veloso
ac,
Fernando J. M.
Gonçalves
 a,
Patrícia
Pereira
a and
Joana Luísa
Pereira
*a
a,
Patrícia
Pereira
a and
Joana Luísa
Pereira
*a
aCESAM (Centre for Environmental and Marine Studies), Department of Biology, University of Aveiro, 3810-193 Aveiro, Portugal. E-mail: jpereira@ua.pt
bGreenUPorto – Sustainable Agrifood Production Research Centre/Inov4Agro & Department of Biology, Faculty of Sciences of the University of Porto, Campus de Vairão, Rua da Agrárias 747, Vila do Conde 4485-646, Portugal
cCICECO – Aveiro Institute of Materials & Department of Chemistry, University of Aveiro, Aveiro 3810-193, Portugal
First published on 9th June 2022
Abstract
Chemical herbicides have been extensively used in agriculture to control the negative impacts of weeds in crops to improve agricultural yields. Authorized herbicidal active ingredients (AIs) have been combined in multiple ways to produce distinct commercial formulations targeting diverse weeds. However, interactions between AIs and co-formulants can result in unpredictable outcomes. In addition, the efficacy against target weeds of application rates much lower than those commercially recommended has been reported. In this context, the present work intends to assess the possibility of optimizing the combination of AIs within a commercial formulation of bentazone and terbuthylazine towards alternatives with decreased environmental hazardous potential, by considering both the mixture composition and application rates. The putative interaction between bentazone and terbuthylazine (AIs), as formulated within a commercial product and in alternative ratios and rates, was assessed, first, by testing with selected aquatic (Raphidocelis subcapitata) and terrestrial (Brassica napus) non-target sensitive indicators for environmental safety assessment, and then, by assessing the corresponding efficacy against a major target weed (Portulaca oleracea). Results showed that (i) commercially recommended rates represent a remarkable potential risk to soil and also aquatic ecosystems; (ii) application rates 10-fold lower than recommended are effective in the control of the main target weed; and (iii) a one-way formulation including only bentazone, which is already available on the market, seems to represent an environmentally safer alternative to the two-way formulation in the control of P. oleracea. These outcomes suggest that a more systematic assessment of the ecotoxicity, as well as the efficacy, of the combinations of pesticides used in commercial products during design stages could ensure a good performance of the agrochemicals against the targets, while improving their environmental safety regarding impacts in non-target organisms.
Environmental significancePesticides are one of the main environmental contaminants of worldwide concern. Millions of tonnes of pesticides have been intentionally applied per year during the last decade to protect agricultural yields. Considering the negative impacts of pesticides on human and environmental health, reducing the total amounts applied and replacing the commercial products with environmentally safe alternatives are both critical. Notably, this study shows that equivalent or even better control of weeds, jointly with decreased undesired environmental effects, can be achieved by applying the active ingredients of commercial products at reduced rates. This is possible through the optimization of the commercial products considering the effects of ratios and interactions between different active ingredients within the formulation towards non-target sensitive indicators and target organisms. |
Introduction
Herbicides have been used in agriculture to control the negative impact of weeds on crop productivity.1 Specifically, approximately 50% of the 4 million tonnes of pesticides used worldwide in 2019 corresponds to the class of herbicides.2 The substantial and persistent use of these products has resulted in water and soil contamination.1 Consequently, toxicant effects in both aquatic3 and terrestrial non-target organisms4 have been frequently reported.Regulatory requirements concerning the authorization, placing on the market, use and control of pesticides have been applied to protect human health and the environment from their harmful effects [e.g. Regulation (EC) no. 1107/2009 in the EU5]. The agrochemical industry has met these requirements, for instance through the development of alternative commercial formulations.6,7 Although numerous different commercial herbicide brands have been registered over the past decades, research focused on the release of new active ingredients (AIs) with new modes of action has been declining since the 80s–90s.6,8 Due to the high costs of development and fall in incentives, research has been focused on other innovative aspects, like the combination of off-patent AIs with different co-formulants adapted for specific conditions (e.g. alternative cropping and delivery systems)6,9,10 or the combination of multiple AIs to circumvent weed resistance.6,11–13 Furthermore, biological control (i.e. ‘natural enemies’ of crop pests like fungi, bacteria, nematodes and others used as control agents) is another aspect that has been drawing increasing interest and investment in the last few decades.14–16 The optimization of the application rates of the herbicides in the field is another factor that can contribute to reducing the risk of adverse side effects.17,18
Previous studies have suggested that the platforms involved in the development of commercial products – including the combined use of multiple AIs19–22 or AIs and other formulants,23–25 and the optimization of recommended application rates21,26,27 – have room for improvement in order to more effectively treat the target species, in a safer way for the environment (e.g. by reducing rates and applications). For instance, Queirós et al.21 concluded that a commercial herbicide formulation currently used as a concentrated oil dispersion of terbuthylazine plus nicosulfuron (AIs) can be optimized to treat one of the main target species mentioned on its label (Portulaca oleracea). The use of only terbuthylazine at concentrations 10-fold lower than those commercially recommended ensured total efficacy against the weed, while reducing the environmental hazardous potential, as assessed by testing with a sensitive aquatic model organism (Lemna minor). The present study further explores the approach applied in Queirós et al.,21 by innovatively assessing the safety of a selected commercial pesticide (Asteca® Mays28) to both sensitive aquatic and terrestrial models, thus covering two vital environmental compartments within agroecosystems that can be impacted by this compound.
Asteca® Mays28 is a commercial concentrated suspension with herbicide action that contains bentazone and terbuthylazine as AIs (200 g L−1 each). This commercial product is selective for maize and is intended to protect this crop against several weeds like the purslane Portulaca oleracea and pigweeds (Amaranthus blitoides, Amaranthus retroflexus, and Amaranthus graecizans). It is a post-emergence herbicide with contact and residual action. It should be applied after maize emergence, when the weeds are at the 2–5 leaves stage (application dose of 3–4 L of concentrated product diluted in 250–500 L of water per ha, corresponding to an application rate of 600–800 g of each AI per ha). Bentazone and terbuthylazine belong to the benzothiadiazine and triazine chemical families,28 respectively. Both chemicals are photosynthesis inhibitors acting on photosystem II (PSII).29–31 Once in PSII, they bind to the secondary quinone (QB) and accept the electrons from the primary quinone (QA), consequently interrupting the photosynthetic electron transport and inhibiting the production of ATP and carbon fixation. This ultimately causes oxidative stress due to the formation of reactive oxygen species at the PSII center.29,31 Bentazone and terbuthylazine inhibit photosynthesis by binding at distinct sites of the QB-niche in PSII.29–31
By using Asteca® Mays as a case study, we intend specifically to (1) compare the sensitivity of two aquatic and two terrestrial producers to the herbicides bentazone and terbuthylazine individually; (2) assess the safety of mixtures of these herbicides to the most sensitive aquatic and terrestrial non-target organisms; (3) evaluate the efficacy of bentazone plus terbuthylazine mixtures at the same and alternative ratios as used in the selected commercial product against a main target weed; and (4) investigate a possible contribution of the other formulants used in the commercial formulation to the whole product toxicity. Given the herbicidal nature of the commercial product and specific action towards the photosynthetic activity, producers were chosen over other groups when selecting non-target organisms for the study. Specifically, a producer bearing a vascular system (the macrophyte Lemna gibba) and another lacking a vascular system (the microalgae Raphidocelis subcapitata) were selected to represent the aquatic compartment, while a monocotyledon (Triticum aestivum) and a dicotyledon (Brassica napus) were selected to represent the terrestrial compartment. The overall hypothesis driving this work is that the possibility of manipulating the ratio between AIs and between the AIs and other co-formulants, and/or application rates is feasible towards alternative formulations that maintain efficacy levels against the target pests but concomitantly may have reduced impacts on the environment as indicated by representative non-target species.
Materials and methods
Chemicals
An herbicide commercial formulation (Asteca® Mays, Ascenza®, Portugal) combining two active ingredients (AIs; 200 g L−1 bentazone plus 200 g L−1 terbuthylazine) with other formulants (including fatty alcohol ethoxylate, sodium hydroxide, 1,2-benzisothiazol-3(2H)-one, and propane-1,2-diol), as well as the corresponding analytical standards of these AIs, were used in this study. The analytical standards bentazone (CAS: 25057-89-0) and terbuthylazine (CAS: 5915-41-3) were purchased from Merck (Pestanal®, Sigma-Aldrich®, Steinheim). The stock solutions of the commercial product and analytical standards were prepared in distilled water, acetone, or in the test medium, as specified below for each assay.Test organisms and assay protocols
The experimental approach used in this study was iteratively sequential (Fig. 1). In a first stage, non-target organisms from both aquatic (microalgae R. subcapitata and macrophyte L. gibba) and terrestrial (monocotyledon T. aestivum and dicotyledon B. napus) compartments were submitted to single exposures to the herbicides bentazone and terbuthylazine. This allowed the selection of the most sensitive organisms among those tested to represent each compartment. Then, the representative aquatic (R. subcapitata) and terrestrial (B. napus) organisms were used in subsequent mixture assays to determine the safety of mixtures of these herbicides to these compartments. At the end, a main target weed (P. oleracea) of the commercial product combining these herbicides was exposed to concentrations corresponding to levels of effect (growth inhibition) on the non-target representatives ranging from 1% to higher than 50% and respective mixture combinations, for efficacy assessment.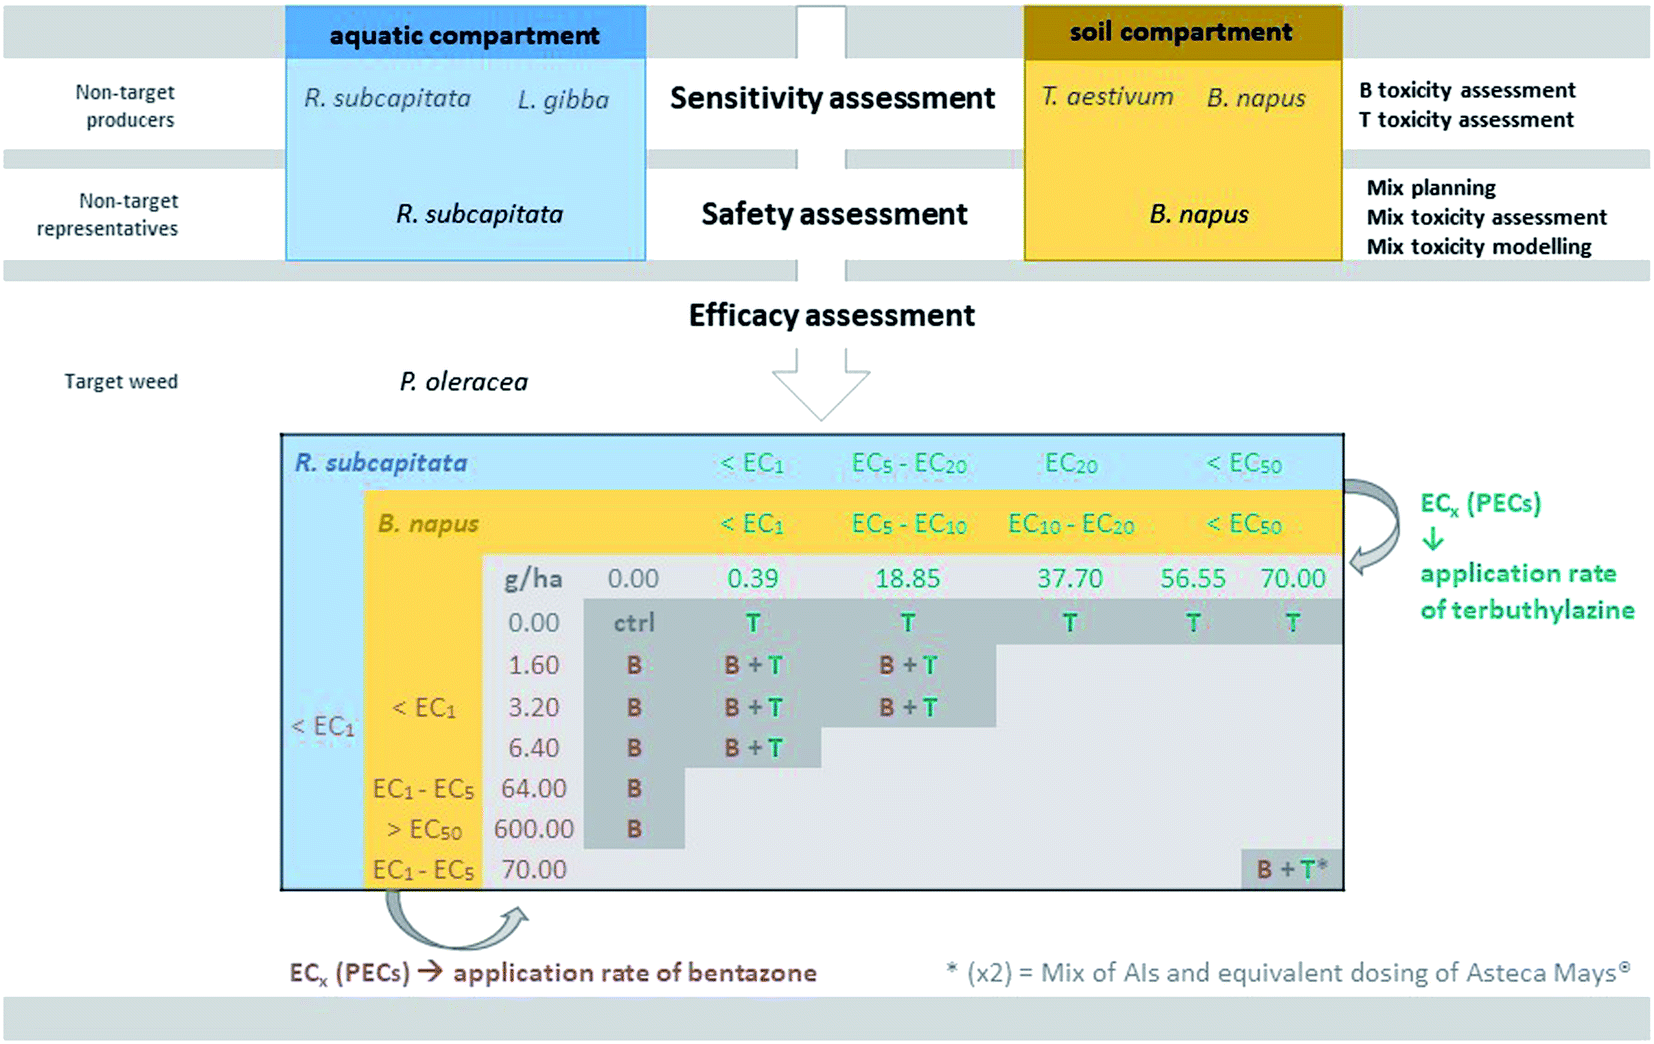 | ||
| Fig. 1 Schematic representation of the experimental design applied in the present study. The first stage (sensitivity assessment) refers to single exposures of non-target aquatic and terrestrial producers (Raphidocelis subcapitata and Lemna gibba or Triticum aestivum and Brassica napus, respectively) to bentazone (B) and terbuthylazine (T). The second stage addresses the exposure of the most sensitive species from each compartment to mixtures of B and T (safety assessment). Estimated effective concentrations causing growth inhibition in x percent of the tested organisms (ECx), herein assumed as predicted environmental concentrations (PECs), were then converted to application rates and finally tested on the target weed Portulaca oleracea for efficacy assessment of alternative herbicide combinations. | ||
The microalga Raphidocelis subcapitata was cyclically maintained in the laboratory in Woods Hole MBL medium,33 at 20 ± 2 °C with a 16 hL![[thin space (1/6-em)]](https://www.rsc.org/images/entities/char_2009.gif) :8 hD photoperiod. The macrophyte Lemna gibba was cultured under the same temperature and luminosity conditions, but in the Steinberg medium.34 Growth inhibition tests with R. subcapitata were performed accordingly to OECD guideline 201 (ref. 35) adapted to 24-well microplates.36 Specifically, microalgae at an initial density of 104 cells per mL were exposed in triplicate to bentazone dissolved at different concentrations in MBL (Table S1†) or to clean MBL (controls). The microplates were incubated for 96 h at 23 ± 1 °C under continuous illumination (≈6000 Lux). Once a day, the microplates were manually shaken to prevent cell clumping and promote gas exchange. After the 96 h exposure period, the final cell density in each well was determined following optical density measurements at 440 nm (Shimadzu UV-1800) and estimation based on a previously established calibration equation. The biomass yield (cells per mL) was calculated as the difference between cell densities at the end and the beginning of the test. Growth inhibition tests with L. gibba followed OECD guideline 221 (ref. 34) adapted to the use of 6-well plates.37 Briefly, 3 healthy colonies with 3 fronds each were inoculated per well in triplicate to grow in the Steinberg medium at a defined bentazone concentration range (Table S1†) during a 7 day exposure period. Six replicates were used for the controls, which consisted of clean Steinberg medium. The microplates were incubated at 23 ± 1 °C, under continuous illumination (≈6000 Lux). After the 7 days, the number of fronds per well was determined and the plants were dried for 24 h at 60 °C to assess the final dry weight. Biomass yield was calculated in terms of the inoculated and final number of fronds or dry weight.
:8 hD photoperiod. The macrophyte Lemna gibba was cultured under the same temperature and luminosity conditions, but in the Steinberg medium.34 Growth inhibition tests with R. subcapitata were performed accordingly to OECD guideline 201 (ref. 35) adapted to 24-well microplates.36 Specifically, microalgae at an initial density of 104 cells per mL were exposed in triplicate to bentazone dissolved at different concentrations in MBL (Table S1†) or to clean MBL (controls). The microplates were incubated for 96 h at 23 ± 1 °C under continuous illumination (≈6000 Lux). Once a day, the microplates were manually shaken to prevent cell clumping and promote gas exchange. After the 96 h exposure period, the final cell density in each well was determined following optical density measurements at 440 nm (Shimadzu UV-1800) and estimation based on a previously established calibration equation. The biomass yield (cells per mL) was calculated as the difference between cell densities at the end and the beginning of the test. Growth inhibition tests with L. gibba followed OECD guideline 221 (ref. 34) adapted to the use of 6-well plates.37 Briefly, 3 healthy colonies with 3 fronds each were inoculated per well in triplicate to grow in the Steinberg medium at a defined bentazone concentration range (Table S1†) during a 7 day exposure period. Six replicates were used for the controls, which consisted of clean Steinberg medium. The microplates were incubated at 23 ± 1 °C, under continuous illumination (≈6000 Lux). After the 7 days, the number of fronds per well was determined and the plants were dried for 24 h at 60 °C to assess the final dry weight. Biomass yield was calculated in terms of the inoculated and final number of fronds or dry weight.
Seeds of the monocotyledon Triticum aestivum (Visagricola – Produtos Agrícolas S.A., Portugal) and the dicotyledon Brassica napus (Flora Lusitana Lda., Portugal) were purchased from local suppliers. Emergence and growth tests with T. aestivum and B. napus were performed according to the ISO/DIS 11269-2 guideline.38 Stock solutions of bentazone and terbuthylazine were prepared in acetone and mixed singly with OECD soil (ISO, 2004; pH = 5.62–6.12; tested concentrations in Table S1†), by dilutions in a fixed volume of water that was added to the soil to adjust soil water content to 60% of its maximum water holding capacity. The soil was allowed to equilibrate for approximately 24 h. Twenty seeds were placed per circular plastic pot (approximately 90 cm2 area) containing 200 g of dry-weight OECD soil (replicate). A pincer was used to randomly place the seeds in the surface and gently cover them with the soil.
A total of 4 replicates were used per treatment, except for the regular (deionized water only) and carrier (deionized water with acetone at the maximum concentration used of 0.7%) controls that comprised a total of 10 replicates. A hole was made in each replicate pot for the placement of a cotton rope, that was in permanent contact with distilled water (enriched at the beginning with 7 mL L−1 nutrients; Universal, ref. 140537; 6% N, 3% P2O5, 6% K2O) added to another vessel placed under the test pot, ensuring water supply by capillarity throughout the test. The pots were incubated at 21 ± 3 °C under a 16 hL:8 hD photoperiod (light intensity and humidity of approximately 6400 Lux and 43 ± 10%, respectively). After germination of 50% of the seeds in the controls, the test was validated, and an exposure of 14 days started. During this period, the pots were checked daily for adding water, assessing mortality, and randomly changing the pot position to uniformize the luminosity conditions. At the end of the exposure, the total number of emerged seeds (only the first 5 plants to emerge were kept per pot during exposure, but all germinated seeds were counted), living plants and leaves (when applicable), and the dry aerial biomass (dried until constant weight at 70 °C) were determined for each replicate.
| Species | Parameter | Bentazone | Terbuthylazine | ||||
|---|---|---|---|---|---|---|---|
| EC10 | EC20 | EC50 | EC10 | EC20 | EC50 | ||
| a Data retrieved from ref. 32; nd – not determined. | |||||||
| Lemna gibba | 7 d yield (no. of fronds) | 0.91 (0.55–1.26) | 1.27 (0.90–1.64) | 2.25 (1.86–2.64) | 0.004a (0.003–0.006) | 0.008a (0.006–0.010) | 0.022a (0.019–0.026) |
| 7 d yield (dry weight) | 0.57 (0.13–1.00) | 1.08 (0.47–1.69) | 3.23 (2.20–4.25) | nd | 0.003 (0.000–0.007) | 0.017 (0.008–0.026) | |
| Raphidocelis subcapitata | 96 h yield (cells per mL) | 2.61 (1.89–3.33) | 3.52 (2.80–4.24) | 5.86 (5.15–6.56) | 0.003a (0.002–0.005) | 0.006a (0.004–0.008) | 0.015a (0.012–0.018) |
| Triticum aestivum | 14 d biomass (dry weight) | nd | nd | >14.29 | 1.29 (0.66–1.92) | 2.46 (1.57–3.36) | 7.45 (5.96–8.95) |
| 14 d emergence | nd | nd | >14.29 | nd | nd | >30.00 | |
| Brassica napus | 14 d biomass (no. of leaves) | 1.37 (1.10–1.64) | 1.89 (1.61–2.16) | 3.24 (2.97–3.53) | 0.94 (0.74–1.14) | 1.15 (0.98–1.33) | 1.62 (1.47–1.78) |
| 14 d biomass (no. of plants) | 1.55 (1.07–2.03) | 2.36 (1.82–2.90) | 4.84 (4.20–5.49) | nd | nd | nd | |
| 14 d biomass (dry weight) | 0.79 (0.49–1.09) | 1.15 (0.83–1.46) | 2.16 (1.81–2.51) | 0.51 (0.39–0.63) | 0.66 (0.54–0.77) | 1.01 (0.91–1.12) | |
| 14 d emergence | nd | nd | >30.00 | nd | nd | >38.00 | |
| PECsurface water (ECxR. subcapitata) = 0.3296 × application rate targeted at P. oleracea | (1) |
| PECsoil (ECxB. napus) = 0.0075 × application rate targeted at P. oleracea | (2) |
| PECsurface water (ECxR. subcapitata) = 0.02867 × application rate targeted at P. oleracea | (3) |
| PECsoil (ECxB. napus) = 0.0075 × application rate targeted at P. oleracea | (4) |
The commercial mixture (Asteca® Mays) was also tested for assessing the role of the formulants other than the AIs in the efficacy against the target. The application rate tested was 10-fold lower than that recommended, for direct comparison with an equivalent mixture containing only the AIs, at this same concentration (marked with an asterisk in Fig. 1).
The vegetative vigor tests that were carried out with P. oleracea were adapted from OECD guideline 227.44 Specifically, 20 seeds were placed with a pincer at a depth of approximately 3 mm in each circular plastic pot (approximately 90 cm2 area) containing 200 g of dry-weight OECD soil (replicate; pH = 6.3). A total of 3 replicates were used per treatment, except for the controls that comprised 5 replicates. These plastic pots were holed at the bottom for the placement of a cotton rope allowing bottom watering throughout the test. After seeding, the pots were incubated at 21 ± 3 °C under a 16 hL:8 hD photoperiod (light intensity and humidity of 19000 Lux and 56 ± 4%, respectively). Nutrients (7 mL L−1; Universal, ref. 140537; 6% N, 3% P2O5, 6% K2O) were added to the distilled water during watering supply. Only the first 5 germinated plants were kept in each replicated pot. After a growing period of approximately 8 days, the test solutions prepared in distilled water were sprayed (Turn'n'Spray, Bürkle, with 1.2 ± 0.1 mL; see Fig. 1 and Table S2† for application rates) over the 4-true leaf stage plants (recommended in the label of the commercial product: 2–5 leaves) at a height of approximately 30 cm. The volume of test solution sprayed was fixed to 14.4 mL per pot. A final volume of test solution corresponding to more water per ha than recommended in the commercial product (maximum of 500 L of water per ha, as mentioned in the introduction) was used to ensure the application of the intended mass of AI in the same area, complying with the limitations of solubility of the AIs in water (note the use of solvents in commercial products). The number of leaves and height of the plants were determined at 21 and 28 days after pulverization, and the shoots were harvested at the end of the exposure (day 28) for dry weight records until constant weight at 70 °C.
Data analysis
The records obtained in the single assays with the non-target organisms (biomass yield in cells per mL for R. subcapitata, or number of fronds and dry weight for L. gibba; emergence and final biomass in terms of dry weight and number of leaves and plants for B. napus and T. aestivum, when applicable) were used to estimate effective concentrations (ECx values) and the corresponding confidence intervals by non-linear regression using the least-squares method to fit the data to the logistic equation. The experimental responses obtained in the assays with the non-target representatives (R. subcapitata – yield cells per mL; B. napus – dry weight) were compared to the reference CA and IA mixture models to identify the most suitable modelling approach. Similarly, deviation functions to the reference models, such as synergism/antagonism (S/A) and dose-level (DL) or dose-ratio (DR) dependent effects were also fitted to the experimental data to assess whether they could more suitably describe the experimental data.39 This analysis was performed in a customized MS®Excel ® spreadsheet (ToxCalcMix, version 1.0, last rev. 20/01/2016; AJA Nogueira, unpublished), as explained in more detail in Queirós et al.21 In order to directly assess the effects of single-chemical and mixture treatments in the selected endpoints, a one-way analysis of variance (ANOVA) approach was applied after confirming the normality and homoscedasticity of the data, followed by Tukey's post hoc test. A significance level of 0.05 was always used.Results
Sensitivity of aquatic and terrestrial producers to bentazone and terbuthylazine
Bentazone and terbuthylazine affected the growth of all the non-target producers selected for this study. Table 1 presents the effective concentrations of each herbicide that inhibited the growth by 10, 20 and 50% of L. gibba, R. subcapitata, T. aestivum and B. napus. Both the aquatic and terrestrial organisms were more sensitive to terbuthylazine than to bentazone. Considering the aquatic compartment, while the macrophyte was more sensitive to bentazone than the microalga (frond number 7 day EC50 = 2.25 mg L−1, compared to yield cells per mL 96 h EC50 = 5.86 mg L−1, respectively), the latter presented higher sensitivity to terbuthylazine, with a very low estimated EC50 value (yield cells per mL 96 h EC50 = 0.015 mg L−1). Taking into account that the estimated ECx values for these herbicides are within the same order of magnitude between species, the higher sensitivity of the microalga to terbuthylazine supported the selection of this producer as a non-target aquatic representative for the mixture assessment. Additionally, the dicotyledon was selected as the terrestrial representative for the mixture assays since it was more sensitive to both herbicides than the monocotyledon.Safety of bentazone plus terbuthylazine mixtures to the non-target representatives
The mixture assay with the aquatic model R. subcapitata showed that there was significant growth inhibition under some of the tested conditions, relative to the control group, following the 96 h exposure to the herbicides (Fig. 2A; F23,65 = 18.32, p < 0.001). Specifically, the treatments that triggered higher growth inhibition rates were (1) the highest concentration of bentazone (3026 μg L−1, approximately 20% inhibition); (2) the highest concentration of terbuthylazine (19.89 μg L−1, approximately 40% inhibition); (3) the mixture comprising the two AIs at these concentrations (3026 μg L−1 bentazone + 19.89 μg L−1 terbuthylazine, approximately 50% inhibition); and (4) the mixture of the AIs at 2300 μg L−1 bentazone plus 15.12 μg L−1 terbuthylazine (approximately 40% inhibition).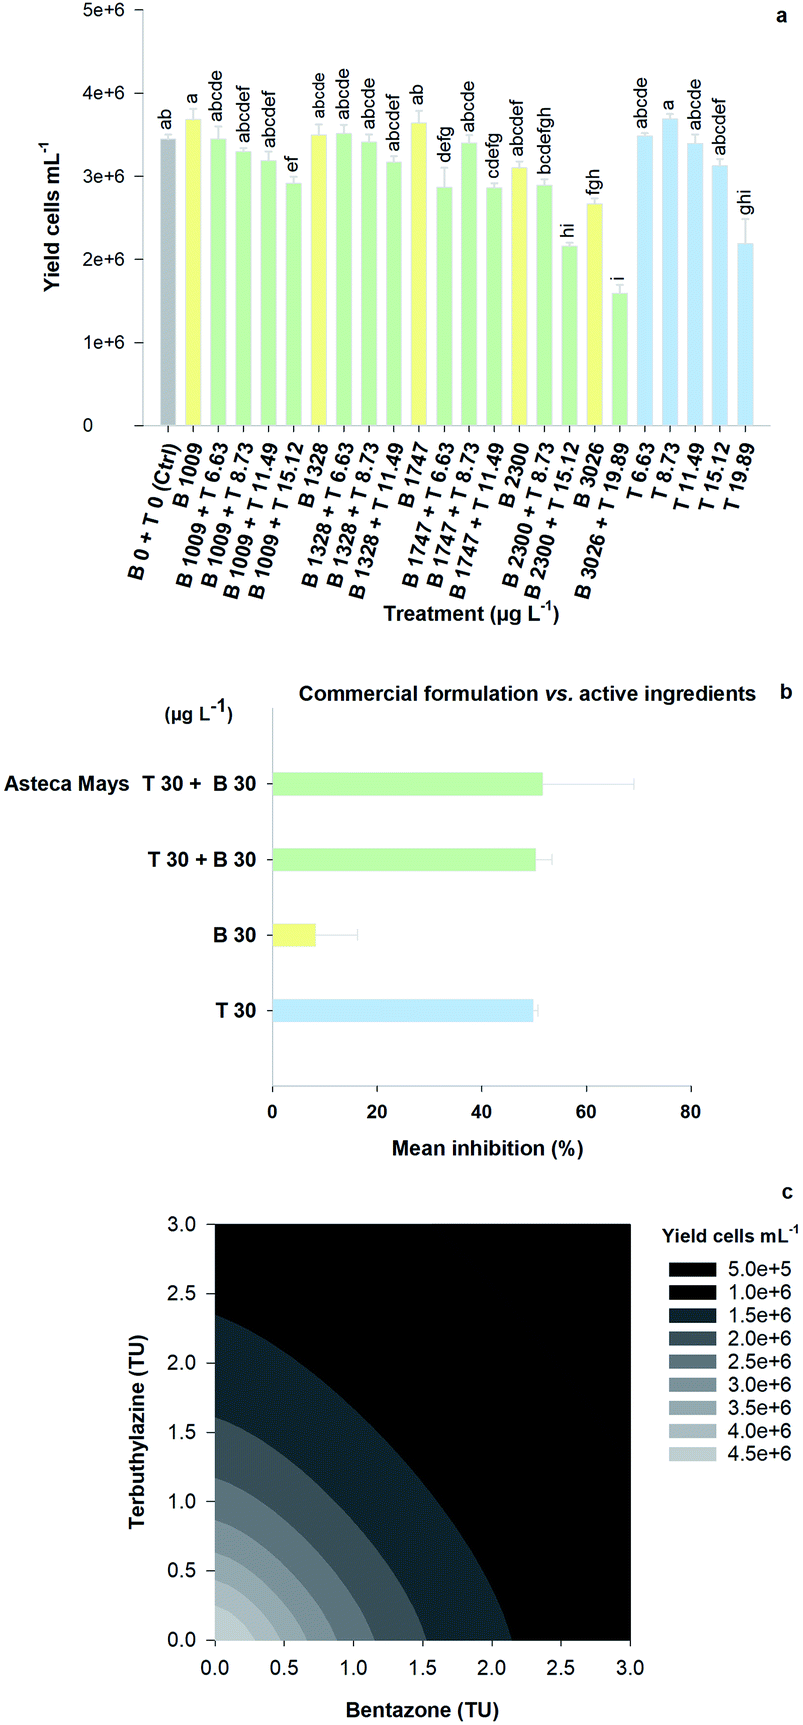 | ||
| Fig. 2 Response of Raphidocelis subcapitata in terms of yield (cells per mL) following a 96 h exposure to bentazone (B) and terbuthylazine (T), singly and in mixture. Bar graphs relating the concentration of B and T with the average yield cells per mL for each treatment (a), and the mean growth inhibition in treatments considering specifically the commercial formulation Asteca® Mays and corresponding treatments dosing the AIs in combination and singly (b). Error bars denote the standard error and significant differences (n = 3; Tukey's test, p < 0.05) are assigned using lowercase letters. The isobologram (c) illustrates the response to the mixture of AIs as predicted by CA – antagonism model, using a TU mixture strength scaling (TU = Ci/ECi) and a grey-scale gradient indicative of the level of the effect (yield cells per mL). | ||
Three additional mixtures significantly inhibited R. subcapitata's growth (1747 μg L−1 bentazone + 6.63 μg L−1 terbuthylazine; 1747 μg L−1 bentazone + 11.49 μg L−1 terbuthylazine; 1009 μg L−1 bentazone + 15.12 μg L−1 terbuthylazine), but the percentage of inhibition was not higher than 17% under any of these tested conditions. The mean growth inhibition observed with the treatment dosing the commercial formulation (Asteca® Mays 30 μg L−1 bentazone + 30 μg L−1 terbuthylazine; Fig. 2B) is practically the same as that obtained for the corresponding condition combining the two AIs at the same concentrations (Fig. 2B), and at the treatment including only the terbuthylazine. No significant differences were found among these treatments (F3,7 = 4.04, p = 0.058). These results suggest that at the tested concentrations, the effect is mainly caused by the AI terbuthylazine and that the co-formulants apparently do not have a relevant role in the overall commercial formulation's toxicity.
Overall, the toxic effects caused by the mixtures in R. subcapitata were not higher than those induced by the individual application of each AI at similar concentrations. In fact, the opposite occurred, as corroborated by the mixture modelling analysis. The isobologram (Fig. 2C) indicates that antagonism occurred throughout the whole mixture response surface (convex curves), which is in line with the model that best fitted the mixture data: CA model with an antagonistic type of deviation (Table 2; CA-S/A), and the strong association between the experimental data and the data predicted by this model (Fig. S1,†R2 = 0.8842). Regarding the S/A deviation of the CA model, the value obtained for the ‘a’ parameter, which is clearly above 0 (a = 1.07, Table 2), confirms the antagonism interpretation [more details in ref. 39]. Considering the mixture assay with the terrestrial model organism B. napus, none of the tested treatments significantly affected germination (F26,54 = 1.41, p = 0.143). However, significant effects were found at the end of the 14 day exposure period regarding other measured parameters (i.e. final average number of plants – F26,54 = 25.43, p < 0.001; leaf number – F26,54 = 33.38, p < 0.001; dry weight – F26,54 = 32.30, p < 0.001). Generally, the plants exposed to concentrations of bentazone higher than 1 mg kg−1, both singly or in mixture with terbuthylazine, were more severely impaired, as shown by a lower number of plants and leaves (Fig. S2†) and lower weight (Fig. 3) by the end of the test. When applied singly, terbuthylazine caused a significant change in the number of leaves only at the highest tested concentration, and the dry weight at the two highest tested concentrations. Considering specifically the final dry weight, growth inhibitions close to 100% were observed in the plants exposed to single concentrations of bentazone higher than 4.18 mg kg−1, or to mixtures of bentazone and terbuthylazine at concentrations higher than 2.12 mg kg−1 and 0.38 mg kg−1, respectively (Fig. 3). Regarding the treatment with the commercial formulation, the number of survived plants is in average very similar to that of the equivalent condition dosing only the AIs. Although there was a trend for a slightly higher total number of leaves and related dry weight, this was not statistically confirmed, which suggests that co-formulants apparently do not have a role in the overall toxicity of the commercial formulation. The modelling of B. napus' dry weight (i.e. the parameter that better relates to the final biomass, due to the size variety of the leaves) responses to the AI mixtures showed the best fit for IA with a dose-ratio dependence deviation (IA-DR, Table 2; Fig. 4). The association between the experimental data and the response predicted by this model was strong (R2 = 0.891, Fig. S3†). The best fit to this particular model generally means that the toxicity depends on the composition of the mixture. In mixtures where bentazone is present at a higher relative dose compared to terbuthylazine, synergism is observed, whereas antagonism occurs especially in those mixtures where bentazone is present at very low relative doses and terbuthylazine at higher relative doses (Fig. 4). Regarding the IA-DR model adjustment, the negative value obtained for the parameter ‘a’ confirms the occurrence of synergism, except for those mixture ratios where significant positive ‘bs’ were obtained, which refer to antagonism [Table 2 (ref. 39)]. This is in agreement with the negative ‘bbent’ (synergism caused by bentazone) and the positive ‘bterb’ (antagonism caused by terbuthylazine). Therefore, and differently from the scenario depicted after mixture toxicity modelling of microalgae responses, some tested mixture ratios were more toxic to B. napus (synergism due mainly to bentazone) than the corresponding concentrations of the herbicides dosed individually.
| r 2 | RMSD | SSE (df) | AIC | P (F-test) | a | b DL | b bent | b terb | |||
|---|---|---|---|---|---|---|---|---|---|---|---|
| R. subcapitata | CA | Baseline | 0.597 | — | 4.824 (32) | 986.09 | <0.001 | — | — | — | — |
| DL | 0.831 | 237020.879 | 2.022 × 10¹² (30) | 959.16 | <0.001 | 2.12 | 0.58 | — | — | ||
| S/A | 0.812 | 246770.746 | 2.253 × 10 12 (31) | 960.12 | <0.001 | 1.07 | — | — | — | ||
| DR | 0.812 | 253650.421 | 2.252 × 10¹² (29) | 966.60 | <0.001 | 0.72 | — | 0.22 | 0.50 | ||
| IA | Baseline | 0.831 | — | 2.023 × 10¹² (32) | 953.08 | <0.001 | — | — | — | — | |
| DL | 0.832 | 236518.759 | 2.014 (30) | 959.00 | <0.001 | 0.13 | 2.47 | — | — | ||
| S/A | 0.831 | 233773.790 | 2.022 × 10¹² (31) | 956.01 | <0.001 | 0.02 | — | — | — | ||
| DR | 0.831 | 240320.686 | 2.021 × 10¹² (29) | 962.49 | <0.001 | 0.01 | — | −0.06 | 0.07 | ||
| B. napus | CA | Baseline | 0.619 | — | 0.112 (35) | −227.76 | <0.001 | — | — | — | — |
| DL | 0.680 | 0.049 | 0.093 (33) | −229.00 | <0.001 | −0.00 | −621.96 | — | — | ||
| S/A | 0.655 | 0.101 | 0.050 (34) | −228.94 | <0.001 | −1.68 | — | — | — | ||
| DR | 0.744 | 0.044 | 0.075 (32) | −234.94 | <0.001 | −0.69 | — | −7.62 | 6.93 | ||
| IA | Baseline | 0.2489 | — | 0.150 (35) | −215.70 | <0.001 | — | — | — | — | |
| DL | 0.695 | 0.048 | 0.090 (33) | −230.92 | <0.001 | −0.06 | −119.12 | — | — | ||
| S/A | 0.658 | 0.050 | 0.100 (34) | −229.31 | <0.001 | −2.30 | — | — | — | ||
| DR | 0.759 | 0.056 | 0.074 (32) | −235.76 | <0.001 | −1.26 | — | −5.22 | 3.96 | ||
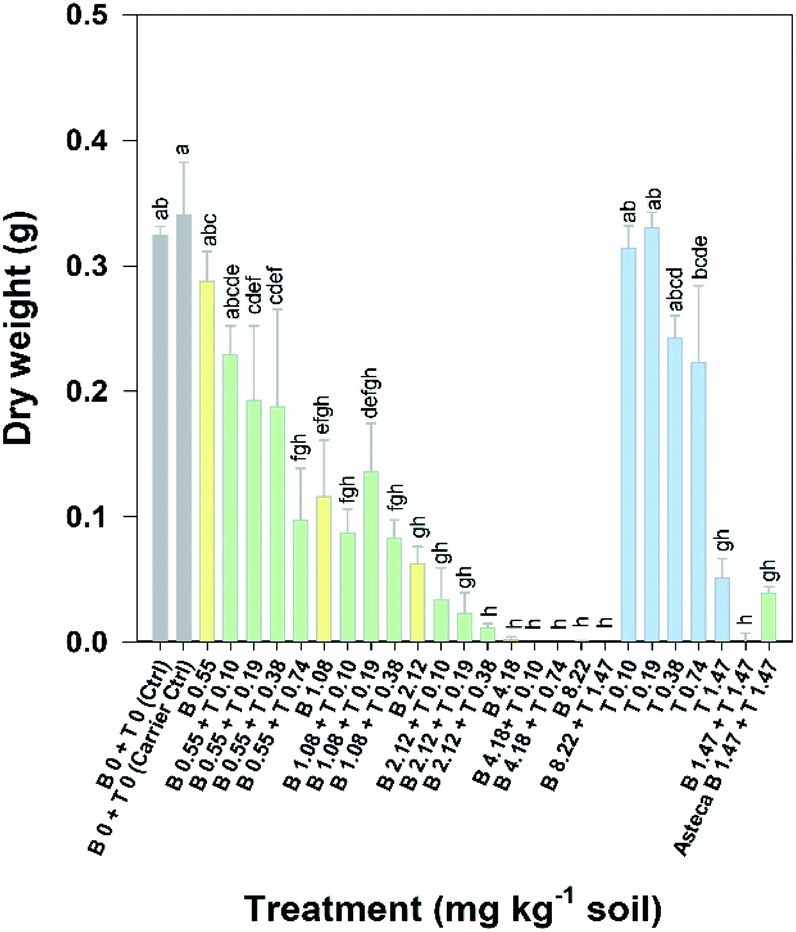 | ||
| Fig. 3 Dry weight of Brassica napus following a 14 day exposure to bentazone (B) and terbuthylazine (T), singly and in mixture, or to Asteca® Mays diluted to the same concentration tested in one of the mixture treatments. The bars stand for the average of three replicates and the error bars for the respective standard error. Significant differences are presented for each treatment (Tukey's test, p < 0.05) using lowercase letters. | ||
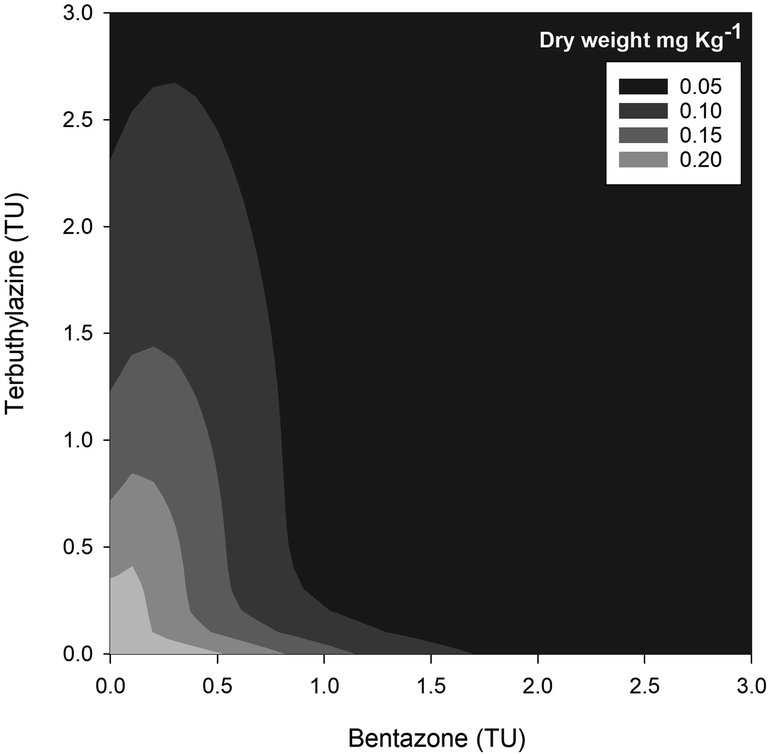 | ||
| Fig. 4 Isobologram illustrating the mixture response surface by Brassica napus following the 14 day exposure to mixtures of bentazone and terbuthylazine as predicted by the IA – dose ratio model, using a TU mixture strength scaling (TU = Ci/ECi) and a grey-scale gradient indicative of the level of the effect (final dry weight in mg kg−1). | ||
Efficacy of mixtures of bentazone with terbuthylazine against a major target species
Significant differences in the growth of P. oleracea were found following the 28 day exposure to bentazone and/or terbuthylazine, considering all the evaluated parameters, i.e. leaf number (F17,40 = 19.75, p < 0.001), plant number (F17,40 = 81.47, p < 0.001), average height (F17,40 = 8.19, p < 0.001) and dry weight (F17,40 = 15.60, p < 0.001). Nevertheless, only 4–5 from the 18 treatments assessed in the mixture assay satisfactorily prevented the growth of the target species, i.e. lowered it by at least 50% compared to the control (see e.g.Fig. 5). Regarding the single terbuthylazine applications, none of the tested application rates were completely effective in inhibiting P. oleracea growth (no significant differences were found regarding all the assessed parameters). Even so, it seems that there was a tendency for a decrease in the dry weight and in the final number of plants per pot at the highest tested concentration (70 g ha−1; Fig. 5). Single applications of bentazone were effective only at 64 g ha−1, as shown by significant effects for the number of plants and dry weight, and at 600 g ha−1 (i.e. one of the recommended application rates of bentazone in Asteca® Mays), as noted by significant effects regarding the number of leaves and plants, height and dry weight (Fig. 5 and S4†). Thus, while the non-target organisms were more sensitive to terbuthylazine than to bentazone (Table 1), the target weed was more sensitive to bentazone. At application rates of 64 g ha−1 bentazone, the growth inhibition calculated for the weed based on the parameter dry weight was 64%. At close application rates of terbuthylazine (70 g ha−1), the growth inhibition was only 47% (dry weight). Curiously, one of the tested mixtures (3.20 g ha−1 bentazone + 0.39 g ha−1 terbuthylazine) potentiated the growth of the target species, as clearly shown by a tendency for an increase in the average height, and a statistically confirmed increase in the number of leaves and dry weight (Fig. 5 and S4†). The comparison of the response obtained in this treatment with all the others, including the corresponding single applications, suggests that these AIs may behave antagonistically when mixed at these specific concentrations. The mixture of bentazone with terbuthylazine was significantly effective in preventing the growth of the target weed only at the highest rates tested (70 g ha−1 of each). The experimental responses obtained for this mixture condition were very similar to those obtained for the equivalent commercial formulation treatment (Fig. 5 and S4†, two last conditions of each graph representing AI mixture vs. commercial formulation: 91 vs. 96%, 85 vs. 95%, 66 vs. 76% and 92 vs. 98% growth inhibition regarding the average number of leaves and plants, height and dry weight, respectively). This indicates that the co-formulants apparently do not have a role in the overall toxicity of the commercial formulation. The 21 day measurements regarding all the parameters except dry weight were similar to those recorded at the end of the exposure (28 days).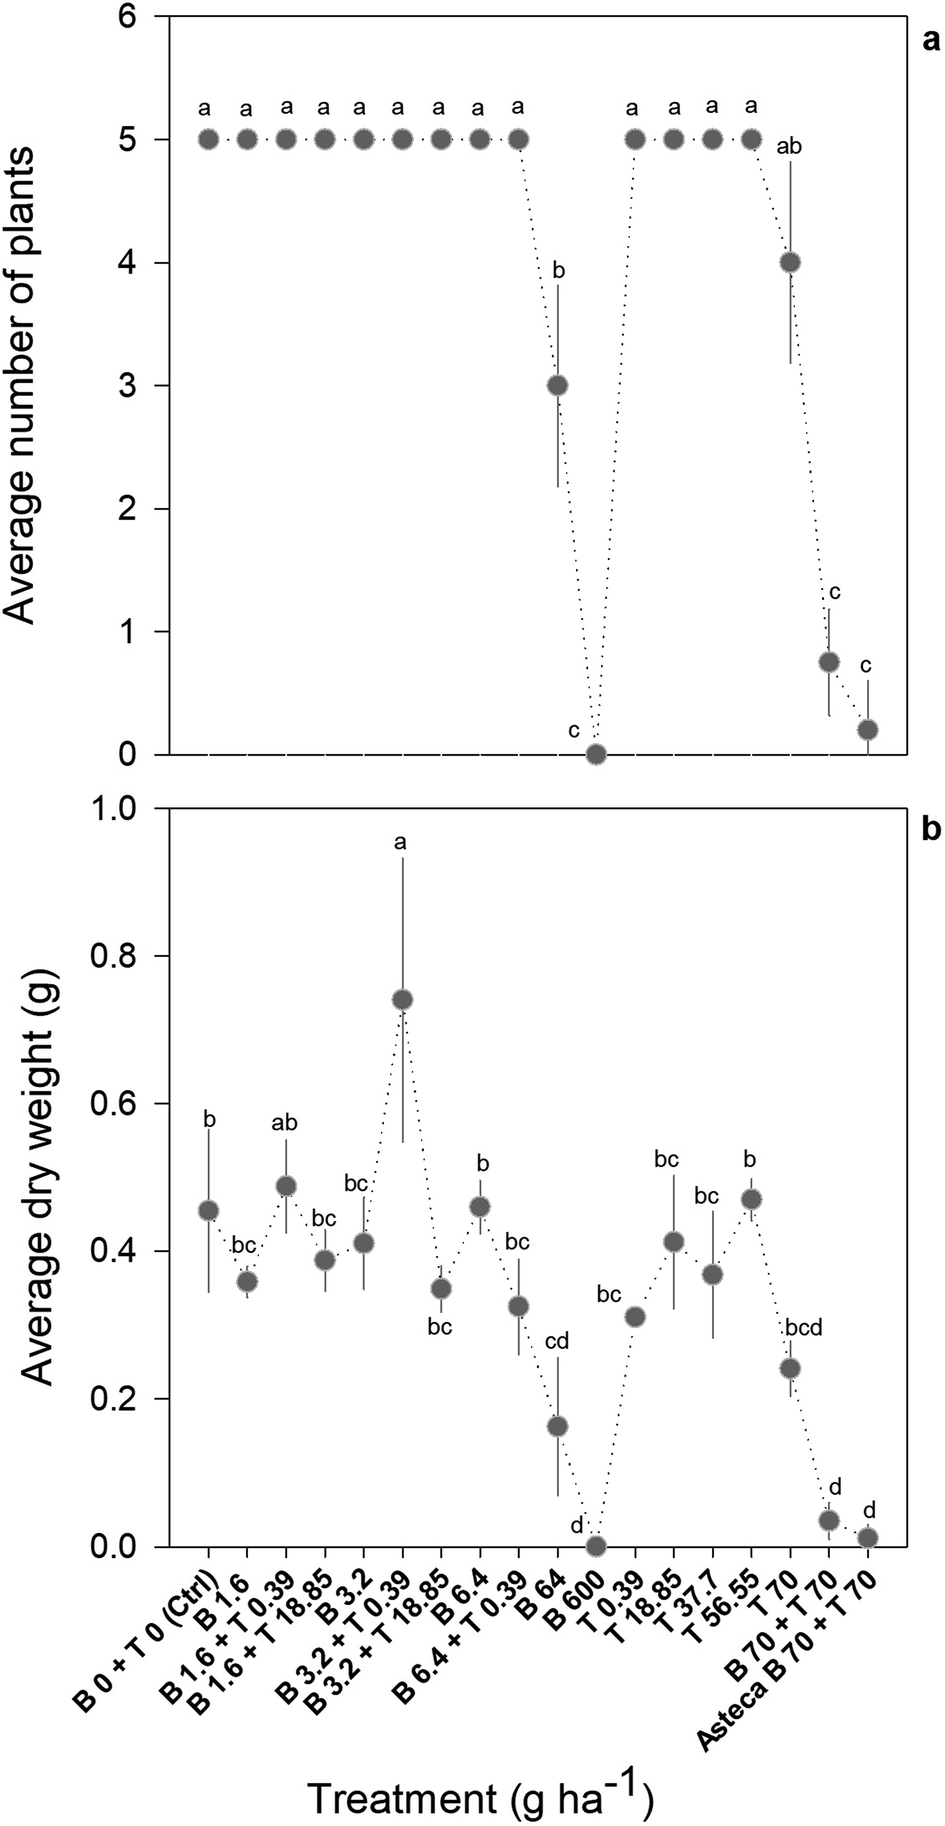 | ||
| Fig. 5 Final number of plants (a) and dry weight (b) of Portulaca oleracea following a 28 day exposure to bentazone (B) and terbuthylazine (T), singly and in mixture, or to Asteca® Mays diluted to the same concentration tested in one of the other treatments. The marks represent the average of three replicates and the error bars stand for the respective standard error. Significant differences among treatments (Tukey's test, p < 0.05) are presented using lowercase letters. | ||
The only tested treatment significantly preventing the growth of the target weed (Fig. 5), and concomitantly representing application rates safe for both aquatic (<EC1) and terrestrial (EC1–EC5) non-target representative species (Fig. 1; see additionally the conversion of concentration units in Table S4†), is the single application of 64 g ha−1 bentazone. However, the growth inhibition obtained for this treatment was approximately 60% (average final dry weight = 0.16 ± 0.09 g, compared to 0.45 ± 0.11 g in controls) and the difference was statistically confirmed only for the number of plants and dry weight. Comparatively, the highest rate of bentazone tested (600 g ha−1, Fig. 5) totally eliminated the target weed. Despite this higher application rate also translating into a surface-water concentration of bentazone safe to the non-target aquatic model (<EC1 calculated for R. subcapitata), it likely represents risk to non-target terrestrial species. Specifically, the corresponding predicted concentration of bentazone in soil is higher than the EC50 calculated for B. napus (Fig. 1 and Table S4†). As mentioned above, one of the recommended application rates of the commercial formulation corresponds to 600 g ha−1 bentazone mixed with 600 g ha−1 terbuthylazine [3 L ha−1 of the concentrated product28]. Interestingly, the mixture assay showed that the single application of bentazone at this concentration is sufficient to completely kill one of the main target weeds of Asteca® Mays. Importantly, while 600 g ha−1 bentazone can represent a risk to the non-target terrestrial representative (PEC in soil higher than the EC50 calculated for B. napus; Fig. 1), the addition of 600 g ha−1 terbuthylazine can also compromise the aquatic non-target (PECsw higher than the estimated EC50 for R. subcapitata; Table S4†). The other experimental treatment that significantly affected the growth of the weed (70 g ha−1 bentazone + 70 g ha−1 terbuthylazine; Fig. 5) caused remarkable levels of inhibition (92%) at corresponding application rates about 10-fold lower than those recommended in the commercial product.
Discussion
The present study addressed the sensitivity of non-target organisms and a target weed to the herbicides bentazone and terbuthylazine, as well as to their mixture. Terbuthylazine hampered more the growth of the non-target organisms used in this study (macrophyte, microalga, monocotyledon and dicotyledon) than bentazone. Differently, the target weed P. oleracea seemed to be slightly more sensitive to the latter (64 g ha−1 bentazone vs. 70 g ha−1 terbuthylazine). This can possibly be related to differences in exposure and uptake routes [e.g. ref. 45]. Both non-target and target organisms were realistically treated in this study. Aquatic non-target organisms (macrophyte and microalgae) were exposed to the herbicides dissolved in the aqueous medium, considering that part of the pesticide reaches edge-of-field waters through processes like runoff and leaching after application of the commercial products, and terrestrial non-target species (monocotyledon and dicotyledon) were exposed to soil contaminated by the herbicides, considering that residues of pesticides adsorb on the soil both by direct application of the products in the soil before the emergence of the crops and by pulverization of the products over the emerged crops. The target weed was pulverized with the herbicides, which resulted in exposure by contact with the aerial part of the plant, in a first stage, and via contact with the contaminated soil (i.e. part of the preparation applied drains and adsorbs on the soil, resulting in subsequent chemical absorption by the roots), in a second stage. Terbuthylazine is a systemic herbicide that is mainly absorbed through the roots, but in part also through the leaves.29 Distinctly, bentazone is a contact herbicide [e.g. ref. 46] readily absorbed through the leaves46 that exerts an effect mainly through the green parts of the plants, thus being generally applied after emergence via foliar application.47 Thus, the foliar application of bentazone in the target weed should have increased its efficacy. Both the time and type of application, as well as variations in the uptake between species (e.g. via leaves and roots or only via roots) are likely related with the observed sensitivity differences. Since Asteca® Mays is a post-emergence herbicide, the mixture of these two herbicides in the commercial product should be linked to the distinct contact and residual actions of bentazone and terbuthylazine, respectively. On the one hand, the contact action will be important to destroy the germinated weeds and, on the other hand, the residual action will prevent the germination of new weeds.Given that bentazone and terbuthylazine have the same mode of action (i.e. inhibition of photosynthesis at PSII), a good fitting of the CA model to the mixture data regarding both the microalga and oilseed rape was primarily expected. Nevertheless, this model adjusted better to the data only for the microalga. A better fitting to the experimental data was found for the IA model in the case of B. napus. Additionally, different types of deviations to the main models were noticed for the two organisms (antagonism throughout the whole mixture response surface for R. subcapitata, and dose-ratio dependence for the terrestrial plant). This means that chemicals interacted in both cases, but while the mixture was always less toxic than the toxicity of the individual compounds in R. subcapitata, specific ratio combinations were more and other less toxic to B. napus.
The application of the commercial product at the recommended rates corresponds to PECsoil values higher than the calculated EC50 for each of the chemicals in B. napus, thus representing a remarkable potential risk to this and likely also to other non-target crop species through off-target soil contamination. Note in addition the relevance of B. napus, herein used as a non-target species model, as a crop species, for instance in the Iberian Peninsula (e.g. ref. 48 and 49), which raises concerns regarding potential infield risks besides the most commonly reasoned outfield risks (e.g. ref. 50). Furthermore, given that these herbicides present different times of degradation in the soil [soil DT50 under field conditions = 7.5 and 21.8 days for bentazone and terbuthylazine, respectively51], and that mixtures at lower levels of these chemicals as tested in this study (maximum of 4.18 mg kg−1 bentazone and 0.38 mg kg−1 terbuthylazine) behave synergistically (IA-DR) for specific ratios, the potential risk to non-target plants should indeed be seriously considered.
Overall, the results of this study suggest that the selected commercial formulation combining bentazone and terbuthylazine has been applied in the environment at application rates much higher than those required to kill the target weed P. oleracea. Application rates 10-fold lower than recommended were totally efficient in inhibiting the growth of the target weed. This overdosing conflicts with a proper policy to efficiently manage the well-known risks of environmental contamination by pesticides and consequent noxious effects in non-target organisms.52 More generally, it conflicts with well-established priorities for the sustainable governance of environmental protection and agricultural production as imprinted for instance in the European Green Deal,53 and particularly in the Farm to Fork strategy aiming for a fair, healthy and environmentally friendly food system.54 Off-target losses occur during application of the pesticides by pulverization in the field (e.g. ref. 55), and this is possibly linked to the recommendation of higher rates. The application in the laboratory is performed in a more controlled environment (e.g. ref. 56), and variables such as immediate transport by wind were not herein considered. Despite that, the application by pulverization in the lab also resulted in some losses to the area surrounding each replicate pot (pots were pulverized individually), and a difference of an order of magnitude in the application rates to compensate off-target losses seems empirically high. Moreover, since off-target losses in the field should also result in increased levels of contamination of field and edge-of-field non-target environments, the assumption of substantial losses should additionally be reflected in supplementary measures to protect these ecosystems.4
The total efficacy of another herbicide at rates 10-fold lower than recommended was also confirmed in a previous study from our lab.21 Although in ref. 21 the commercial formulation combining terbuthylazine with another herbicide (nicosulfuron) showed much lower efficacy than the equivalent mixture of the AIs only in the control of the target weed (P. oleracea), the single application of terbuthylazine at rates 10-fold lower than those recommended in the product label reduced the growth of the plant to nearly null records (growth inhibition = 88%). Herein, the other formulants of Asteca® Mays did not have a relevant role in the overall toxicity of the formulation, but the trend for a good herbicidal performance at much lower rates of AIs than recommended was also observed. The maximum concentration of terbuthylazine tested singly herein (70 g ha−1) caused a 47% dry-weight-based growth inhibition (illustrated in Fig. 5), which reflects a comparatively milder effect that should be likely due to differences in the experimental conditions applied in the two studies (e.g. different soil types). Other cases of efficacy of pesticides against target species at much lower application rates than recommended are found in the literature. For example, multiple studies performed during a 3 year period in the USA showed that half or in some cases even a quarter of the recommended application rates of several post-emergence herbicides (e.g. acifluorfen, bentazone, acifluorfen plus bentazon, and chlorimuron) caused similar weed management success compared to full rates.57 In addition to decreasing potential risks to the environment, the application of lower rates can also reduce the costs of treatment for the farmers (e.g. ref. 17). The results obtained in the present study overall suggest that the single application of only one of the AIs used in Asteca® Mays (i.e. bentazone) at application rates between 64 g ha−1 and 600 g ha−1 (i.e. possibly lower than the application rate proposed in the commercial product – 600/800 g ha−1; yet note that intermediate rates between 64 g ha−1 and 600 g ha−1 have not been tested herein) would be environmentally safer (PECsw < EC1 calculated for R. subcapitata; EC1 < PECsoil > EC50 calculated for B. napus) than the two-way formulation. Namely, although the treatment corresponding to 70 g ha−1 bentazone with 70 g ha−1 terbuthylazine has been very effective against the target weed, this specific application rate of terbuthylazine corresponds to PECsoil and PECsw between the EC20 and the EC50 calculated for B. napus and R. subcapitata, respectively. This PECsw for terbuthylazine is also higher than the estimated EC50 for the other non-target species considered in the present study (L. gibba). This additionally corroborates the argued risks that the application of this herbicide combination may represent to edge-of-field freshwater ecosystems. Moreover, it should be taken into account that no indications of a synergic action of these two AIs were found in any of the mixture treatments tested in the present study towards P. oleracea, which suggests that this mixture used in the commercial product may not represent the most advantageous option for the control of this target weed. Considering the AIs rather than the whole formulation, a commercial product containing only bentazone at application rates lower than those currently used (64–600 g ha−1) seems to be a suitable and environmentally friendlier alternative to treat P. oleracea. Curiously, a commercial product containing only bentazone known as Kaos® is already sold by the same company of Asteca® Mays, and P. oleracea is also one of the main target weeds of this alternative formulation.58 Nevertheless, the recommended application rates of this alternative product also seem to be much higher than needed to kill this weed. Namely, a minimum of 1200 g ha−1 and a maximum of 1920 g ha−1 are recommended for application in maize and rice, respectively.58 These rates correspond to a PECsoil higher than the calculated EC50 for B. napus, and to a PECsw between the EC1 and the EC5 for R. subcapitata.
In addition to the off-target losses of the pesticides during application that depend on weather and also specific conditions of the application site (e.g. ref. 55), the recommendation for use of high rates by the manufacturers is likely to be related to differences in the susceptibility by several target species, as well as to the circumvention of weed resistance (e.g. ref. 59 and 60). While the products are designed to kill all the target species mentioned on the label, including the most tolerant, the potential of weed resistance should also be considered in the selection of the dose. In fact, the effect of the pesticide's dosage in the development of resistance has been debated over the past years (e.g. ref. 61 and 62). For instance, several studies from Powles et al. have shown that recurrent exposure to low doses of the same herbicide may result in herbicide resistance development (e.g. ref. 63–65). It is important to ensure that the application of low rates of herbicides, as suggested in the present study, does not promote the development of weed resistance through an incomplete control of the weeds and hereditary transmission of resistance traits. Strategies other than dose manipulation have been used to tackle weed resistance, like the mixture and the alternation between pesticides with different modes of action, as it is assumed that resistance typically develops due to continuous use of active ingredients with similar toxic mechanisms, which thus increases selection pressure for pesticide-resistant biotypes (e.g. ref. 66). Overall, potential of herbicide resistance for different application rates, as well as herbicide combinations, should be carefully analysed prior to commercialization to optimize the overall efficacy and reduce the risks to non-target flora and fauna.67–70
Current findings highlight the promising applicability of the approach used to improve environmental safety of herbicides at design stages concomitantly considering the efficacy towards target species. Still, it would be important to further test the efficacy of environmentally safer alternative application rates found under field conditions. This is due to a potential variation of specific variables (e.g. temperature, wind, land conditions) affecting the fate and behavior of the pesticides in the field. For further application, the step of environmental safety assessment can be adjusted according to the needs. For instance, to test other types of pesticide products such as insecticides, sensitive non-target insects must be preferred. This step can include more species in case a broader representativeness is desired. Alternatively, and depending on data availability, species sensitivity distributions can be used for a more comprehensive understanding of environmental hazards involved.
Conclusions
This study reinforces the importance of assessing the effects of pesticides in non-target representatives of both the aquatic and terrestrial compartments for appraising their environmental safety. In fact, we show herein by using a marketed commercial formulation combining bentazone and terbuthylazine as a model that licensed application rates of bentazone are safe on non-target aquatic organisms but have a remarkable hazardous potential on non-target terrestrial species. Terbuthylazine represented risk to both aquatic and terrestrial organisms at application rates much lower than recommended. A one-way formulation including bentazone (as an AI), which is actually already available on the market, seems to represent an environmentally safer alternative to the two-way formulation combining bentazone with terbuthylazine in the control of the target weed P. oleracea. Moreover, our results suggest that the recommended application rates of bentazone in any of the commercial formulations are not the most suitable to treat this target weed. In spite of their efficacy against the weed, they represent a potential risk to soil ecosystems. The availability on the market of commercial products specific for each weed species would be theoretically ideal, but most likely not practicable. However, the systematic adjustment of the recommended application rates during design stages considering each target species, by making use of well-developed testing and modelling frameworks as those used in the present study, should certainly be valuable to promote environmental safety within agroecosystems. By picturing our case-study with Asteca® Mays, one can appraise that such an adjustment would translate into a remarkable reduction of approximately 10-fold for bentazone and terbuthylazine reaching off-site ecosystems. If one dramatically hypothesizes that this 10-fold reduction could apply to herbicides in general, the amount of herbicidal AIs applied would decline from approximately 2 thousand tonnes [total of AIs used in 2019 (ref. 71)] to 0.2 thousand tonnes in a year in a small country such as Portugal. The potential benefits of the addressed approach reinforce the importance of testing on the efficacy of proposed alternative formulations under field conditions in further studies.Author contributions
L. Queirós: conceptualization, methodology, investigation, writing. S. Bouguerra: investigation, writing – review and editing. R. Pereira: investigation, writing – review and editing. I. P. E. Macário: investigation. J. I. Santos: investigation. T. Veloso: investigation. F. J. M. Gonçalves: supervision, writing – review and editing, funding acquisition. P. Pereira: supervision, writing – review and editing, funding acquisition. J. L. Pereira: conceptualization, supervision, writing – review and editing, funding acquisition.Conflicts of interest
There are no conflicts to declare.Acknowledgements
Thanks are due to FCT/MCTES for the financial support to CESAM (UIDP/50017/2020 + UIDB/50017/2020 + LA/P/0094/2020) and GreenUPorto (UIDB/05748/2020 and UIDP/05748/2020), through national funds. L. Q., I. P. E. M., J. S. and T. V. are grateful to FCT for their doctoral grants (SFRH/BD/129871/2017, SFRH/BD/123850/2016, SFRH/BD/121341/2016 and SFRH/BD/147346/2019). P. P. is funded by national funds, through FCT under the Scientific Employment Stimulus (Individual Call) [CEECIND/01144/2017].References
- M. Tudi, H. D. Ruan, L. Wang, J. Lyu, R. Sadler and D. Connell, et al., Agriculture Development, Pesticide Application and Its Impact on the Environment, Int. J. Environ. Res. Public Health, 2021, 18(1112), 1–23 Search PubMed.
- F. A. O. Pesticides, Use (agricultural use) FAOSTAT, 2022, available from, https://www.fao.org/faostat/en/#data/RP Search PubMed.
- R. Kumar, M. S. Sankhla, R. Kumar and S. S. Sonone, Impact of Pesticide Toxicity in Aquatic Environment, Biointerface Res. Appl. Chem., 2021, 11(3), 10131–10140 Search PubMed.
- R. S. Prosser, J. C. Anderson, M. L. Hanson, K. R. Solomon and P. K. Sibley, Indirect effects of herbicides on biota in terrestrial edge-of-field habitats: A critical review of the literature, Agric., Ecosyst. Environ., 2016, 232, 59–72 CrossRef CAS.
- EC. Regulation (EC), No 1107/2009 of the European Parliament and of the Coucil, Off. J. Eur. Union, 2009, 309(1), 1–50 Search PubMed.
- S. Haggblade, B. Minten, C. Pray, T. Reardon and D. Zilberman, The Herbicide Revolution in Developing Countries: Patterns, Causes, and Implications, Eur. J. Dev. Res., 2017, 29, 533–559 CrossRef.
- A. Knowles, Recent developments of safer formulations of agrochemicals, Environ., 2008, 28, 35–44 Search PubMed.
- A. Bonanno, V. C. Materia, T. Venus and J. Wesseler, The Plant Protection Products (PPP) Sector in the European Union: A Special View on Herbicides, Eur J Dev Res, 2017, 29(3), 575–595 CrossRef.
- M. J. L. Castro, C. Ojeda and A. F. Cirelli, Advances in surfactants for agrochemicals, Environ. Chem. Lett., 2014, 12(1), 85–95 CrossRef CAS.
- S. N. M. Yusoff, A. Kamari and N. F. A. Aljafree, A review of materials used as carrier agents in pesticide formulations, Int. J. Environ. Sci. Technol., 2016, 13(12), 2977–2994 CrossRef.
- T. Abbas, M. A. Nadem, A. Tanveer and R. Ahmad, Identifying optimum herbicide mixtures to manage and avoid fenoxaprop-p-ethyl resistant Phalaris minor in wheat, Planta Daninha, 2016, 34(4), 787–794 CrossRef.
- S. K. Das, Scope and relevance of using pesticide mixtures in crop protection: a critical review, J Environ Sci Toxicol Res, 2014, 2(5), 119–123 Search PubMed.
- J. M. Green, C. B. Hazel, D. R. Forney and L. M. Pugh, New multiple-herbicide crop resistance and formulation technology to augment the utility of glyphosate, Pest Manage. Sci., 2008 Apr, 64(4), 332–339 Search PubMed.
- J. Bremmer, M. Riemens and M. Reinders, The future of crop protection in Europe, Panel for the Future of Science and Technology, STOA, 2021 Search PubMed.
- K. Leung, E. Ras, K. B. Ferguson, S. Ariëns, D. Babendreier and P. Bijma, et al., Next-generation biological control: the need for integrating genetics and genomics, Biol. Rev., 2020, 95, 1838–1854 CrossRef PubMed.
- B. I. P. B. V. C. Moran and F. B. J. C. V. Lenteren, The status of biological control and recommendations for improving uptake for the future, BioControl, 2018, 63(1), 155–167 CrossRef.
- P. Kudsk, Optimising herbicide dose: A straightforward approach to reduce the risk of side effects of herbicides, Environmentalist, 2008, 28(1), 49–55 CrossRef.
- S. Reichenberger, M. Bach, A. Skitschak and H. G. Frede, Mitigation strategies to reduce pesticide inputs into ground- and surface water and their effectiveness; A review, Sci. Total Environ., 2007, 384(1–3), 1–35 CrossRef CAS PubMed.
- J. Hubert, V. Stejskal, Z. Munzbergova, J. Hajslova and F. H. Arthur, Toxicity and efficacy of selected pesticides and new acaricides to stored product mites (Acari: Acaridida), Exp. Appl. Acarol., 2007, 42, 283–290 CrossRef CAS PubMed.
- M. A. Levchenko, S. E. A. evna, R. K. Bikinyaeva and G. F. Balabanova, Efficacy of acetamiprid and fipronil fly baits against the housefly (Musca domestica L.) under laboratory conditions, Vet World, 2018, 11(7), 953–958 CrossRef CAS PubMed.
- L. Queirós, T. Vidal, A. J. A. Nogueira, F. J. M. Gonçalves and J. L. Pereira, Mixture toxicity assisting the design of eco-friendlier plant protection products: a case-study using a commercial herbicide combining nicosulfuron and terbuthylazine, Sci. Rep., 2018, 8(1), 1–10 Search PubMed.
- A. L. Willmott, R. A. Cloyd and K. Y. Zhu, Efficacy of pesticide mixtures against the western flower thrips (Thysanoptera: Thripidae) under laboratory and greenhouse conditions, J. Econ. Entomol., 2013, 106(1), 247–256 CrossRef CAS PubMed.
- R. Idziak, Z. Woznica and L. Sobiech, Effect of oil and mineral adjuvants on efficacy and physico-chemical properties of foramsulfuron and iodosulfuron spray mixture, Pakistan J Agric Sci, 2013, 50(4), 671–676 Search PubMed.
- D. K. Kaczmarek, T. Rzemieniecki, K. Marcinkowska and J. Pernak, Synthesis, properties and adjuvant activity of docusate-based ionic liquids in pesticide formulations, J. Ind. Eng. Chem., 2019, 78, 440–447 CrossRef CAS.
- Z. Woznica, J. Nalewaja and C. Messersmith, Sulfosulfuron Efficacy Is Affected by Surfactants, pH of Spray Mixture, and Salts, Pestic Formul Appl Syst A New Century Agric Formul Twenty First Vol, ed J. Mueninghoff, A. Viets and R. Downer, West Conshohocken, PA ASTM Int 2001, 2001, pp. 11–22 Search PubMed.
- T. Colin, C. Monchanin, M. Lihoreau and A. B. Barron, Pesticide dosing must be guided by ecological principles, Nat Ecol Evol, 2020, 4(12), 1575–1577 CrossRef PubMed.
- W. Siegfried, O. Viret, B. Huber and R. Wohlhauser, Dosage of plant protection products adapted to leaf area index in viticulture, Crop Prot, 2007, 26(2), 73–82 CrossRef.
- Ascenza® P, Asteca® Mays label, 2021, available from, https://cdn.sanity.io/files/7c8dy2wy/production/ede1b09c6f8f2b550d661eac7972055325db586b.pdf Search PubMed.
- M. Abbaspoor, H. B. Teicher and J. C. Streibig, The effect of root-absorbed PSII inhibitors on Kautsky curve parameters in sugar beet, Weed Res., 2006, 46(3), 226–235 CrossRef CAS.
- C. A. Mallory-Smith and E. J. Retzinger, Revised Classification of Herbicides by Site of Action for Weed Resistance Management Strategies 1, Weed Technol., 2003, 17(3), 605–619 CrossRef CAS.
- J. Zhu, W. L. Patzoldt, O. Radwan, P. J. Tranel and S. J. Clough, Effects of Photosystem-II-Interfering Herbicides Atrazine and Bentazon on the Soybean Transcriptome, Plant Genome, 2009, 2(2), 191–205 CAS.
- L. Queirós, T. Vidal, J. A. Nogueira, F. J. M. Gonçalves and J. L. Pereira, Ecotoxicological assessment of the herbicide Winner Top and its active substances—are the other formulants truly inert?, Ecotoxicology, 2018, 1–11 Search PubMed.
- H. Nichols, Growth media-freshwater, in, Handb. Phycol. Methods Cult. Methods Growth Meas, ed. J. R. Stein, Cambridge University Press, Cambridge, UK, 1973, pp. 16–17 Search PubMed.
- OECD, OECD Guidelines for the Testing of Chemicals. Lemna Sp. Growth Inhibition Test, Test N221, 2006, pp. 1–22 Search PubMed.
- OECD, OECD Guidelines for the Testing of Chemicals. Freshwater Alga and Cyanobacteria, Growth Inhibition Test, Test N201, 2006, pp. 1–26 Search PubMed.
- S. W. Geis, K. L. Leming, E. T. Korthals, G. Searle, L. Reynolds and D. A. Karner, Modifications to the algal growth inhibition test for use as a regulatory assay, Environ. Toxicol. Chem., 2000, 19(1), 36–41 CrossRef CAS.
- M. Kaza, J. Mankiewicz-Boczek, K. Izydorczyk and J. Sawicki, Toxicity assessment of water samples from rivers in central Poland using a battery of microbiotests – A pilot study, Pol. J. Environ. Stud., 2007, 16(1), 81–89 CAS.
- ISO, Soil Quality – Determination of the Effects of Pollutants on Soil Flora - Part 2: Effects of Chemicals on the Emergence and Growth of Higher Plants, TC 190 Soil Qual, 2004, ICS: 13.08 Search PubMed.
- M. J. Jonker, C. Svendsen, J. J. M. Bedaux, M. Bongers and J. E. Kammenga, Significance testing of synergistic/antagonistic, dose level-dependent, or dose ratio-dependent effects in mixture dose-response analysis, Environ. Toxicol. Chem., 2005, 24(10), 2701–2713 CrossRef CAS PubMed.
- J. Linders, P. Adriaanse, R. Allen, E. Capri, V. Gouy and J. Hollis, et al.FOCUS Surface Water Scenarios in the EU Evaluation Process under 91/414/EEC, 2001 Search PubMed.
- EFSA. European Food Safety Authority (EFSA), Data & PERSAM software tool, EFSA and JRC, 2015, available from, https://esdac.jrc.ec.europa.eu/content/european-food-safety-authority-efsa-data-persam-software-tool Search PubMed.
- C. Gardi, L. Montanarella, P. Panagos and F. Micale, Report on the activities realized in 2010 within the Service Level Agreement between JRC and EFSA, as a support of the FATE and Ecoregions working groups of EFSA PPR (SLA EFSA-JRC/2008/01). EFSA Support Publ, 2011 Feb;8(2), available from, http://doi.wiley.com/10.2903/sp.efsa.2011.EN-112.
- R. Hiederer, EFSA Spatial Data Version 1.1 Data Properties and Processing, Publications Office of the European Union EUR, 2012, p. 25546 Search PubMed.
- OECD, OECD guideline for the testing of chemicals Terrestrial Plant Test: Vegetative Vigour Test. Terrestrial Plant Test: vegetative Vigour Test, Test N 227, 2006, pp. 1–21 Search PubMed.
- C. J. Wang and Z. Q. Liu, Foliar uptake of pesticides-Present status and future challenge, Pestic. Biochem. Physiol., 2007, 87(1), 1–8 CrossRef CAS.
- L. Ali, H. Jo, J. T. Song and J. D. Lee, The prospect of bentazone-tolerant soybean for conventional cultivation, Agronomy, 2020, 10(11), 1–16 Search PubMed.
- S. B. Singh-Verma and M. Luib, Bentazon - a new herbicide for chemical weed control in soya beans, PANS Pest Artic News Summ, 1974, 20(1), 129–132 CrossRef CAS.
- C. Batista, L. Barros, A. M. Carvalho and I. C. F. R. Ferreira, Nutritional and nutraceutical potential of rape (Brassica napus L. var. napus) and “tronchuda” cabbage (Brassica oleraceae L. var. costata) inflorescences, Food Chem. Toxicol., 2011, 49(6), 1208–1214 CrossRef CAS PubMed.
- R. Font, M. D. Río-Celestino, E. Cartea and A. De Haro-Bailón, Quantification of glucosinolates in leaves of leaf rape (Brassica napus ssp. pabularia) by near-infrared spectroscopy, Phytochemistry, 2005, 66(2), 175–185 CrossRef CAS PubMed.
- EFSA, Scientific Opinion addressing the state of the science on risk assessment of plant protection products for non-target terrestrial plants, EFSA J., 2014, 12(7), 1–163 Search PubMed.
- K. A. Lewis, J. Tzilivakis, D. J. Warner and A. Green, An international database for pesticide risk assessments and management, Hum. Ecol. Risk Assess., 2016, 22(4), 1050–1064 CrossRef CAS.
- I. Mahmood, S. R. Imadi, K. Shazadi, A. Gul and K. R. Hakeem, Effects of Pesticides on Environment, in Plant, Soil and Microbes, Springer International Publishing, Cham; 2016, pp. 253–269, available from, http://link.springer.com/10.1007/978-3-319-27455-3_13 Search PubMed.
- European Commission, The European Green Deal, Eur. Comm., 2019, 53, (9), 24, https://eur-lex.europa.eu/legal-content/EN/TXT/PDF/?uri=CELEX:52019DC0640%26from=EN Search PubMed.
- European Commission, A Farm to Fork Strategy for a fair, healthy and environmentally-friendly food system, Communication from the Commission to the European Parliament, the Council, the European Economic and Social Committee and the Committee of the Regions (COM(2020) 381 final), Brussels, 2020 Search PubMed.
- Y. Chen, H. Zhu, H. E. Ozkan, R. C. Derksen and C. R. Krause, Spray drift and off-target loss reductions with a precision air-assisted sprayer, Trans. ASABE, 2013, 56(6), 1273–1281 Search PubMed.
- D. Haag and G. Matschonat, Limitations of controlled experimental systems as models for natural systems: A conceptual assessment of experimental practices in biogeochemistry and soil science, Sci. Total Environ., 2001, 277(1–3), 199–216 CrossRef CAS PubMed.
- D. L. Devlin, J. H. Long and L. D. Maddux, Using Reduced Rates of Postemergence Herbicides in Soybeans. Kansas Agric Exp Stn Res Reports, 1993, (12), pp. 834–840 Search PubMed.
- Ascenza® P.. Kaos® label, 2020, available from, https://www.ascenza.pt/products/kaos Search PubMed.
- J. K. Norsworthy, S. M. Ward, D. R. Shaw, R. S. Llewellyn, R. L. Nichols and T. M. Webster, et al., Reducing the Risks of Herbicide Resistance: Best Management Practices and Recommendations, Weed Sci., 2012, 60(SP1), 31–62 CrossRef CAS.
- L. Ulber, H. Nordmeyer and P. Zwerger, Resistance risk assessment within herbicide authorisation - a call for sensitivity data, Pest Manag Sci, 2013, 69(2), 160–164 CrossRef CAS PubMed.
- J. Gressel, Catch 22: All doses select for resistance. when will this happen and how to slow evolution?, ACS Symp. Ser., 2017, 1249, 61–72 CrossRef.
- F. Van den Bosch, N. Paveley, M. Shaw, P. Hobbelen and R. Oliver, The dose rate debate: Does the risk of fungicide resistance increase or decrease with dose?, Plant Pathol., 2011, 60(4), 597–606 CrossRef CAS.
- R. Busi, T. A. Gaines, M. J. Walsh and S. B. Powles, Understanding the potential for resistance evolution to the new herbicide pyroxasulfone: field selection at high doses versus recurrent selection at low doses, Weed Res., 2012, 52(6), 489–499, DOI:10.1111/j.1365-3180.2012.00948.x.
- P. Neve and S. Powles, Recurrent selection with reduced herbicide rates results in the rapid evolution of herbicide resistance in Lolium rigidum, Theor. Appl. Genet., 2012, 110(6), 1154–1166, DOI:10.1007/s00122-005-1947-2.
- S. Manalil, R. Busi, M. Renton and S. B. Powles, Rapid evolution of herbicide resistance by low herbicide dosages, Weed Sci., 2011, 59, 210–217, DOI:10.1614/ws-d-10-00111.1.
- R. A. Cloyd, Pesticide Mixtures and Rotations: Are these Viable Resistance Mitigating Strategies?, Pest Technol., 2010, 4(1), 14–18 Search PubMed.
- M. F. Ferreira, T. Carolina, E. Bracamonte and G. Leonardo, Effects of the herbicide glyphosate on non-target plant native species from Chaco Forest (Argentina), Ecotoxicol. Environ. Saf., 2017, 144(April), 360–368 Search PubMed.
- A. R. Main, E. B. Webb, K. W. Goyne and D. Mengel, Neonicotinoid insecticides negatively affect performance measures of non-target terrestrial arthropods: a meta-analysis, Ecol Appl, 2018, 28(5), 1232–1244 CrossRef PubMed.
- Y. Qi, J. Li, X. Guan, B. Yan, G. Fu and J. He, et al., Effects of herbicides on non-target plant species diversity and the community composition of fallow fields in northern China, Sci. Rep., 2020, 10(1), 1–10, DOI:10.1038/s41598-020-67025-2.
- C. Thiour-Mauprivez, F. Martin-Laurent, C. Calvayrac and L. Barthelmebs, Effects of herbicide on non-target microorganisms: Towards a new class of biomarkers?, Sci. Total Environ., 2019, 684, 314–325, DOI:10.1016/j.scitotenv.2019.05.230.
- Eurostat. Pesticide sales, 2021, available from, https://appsso.eurostat.ec.europa.eu/nui/show.do?query=BOOKMARK_DS-382683_QID_-43E65BDE_UID_-3F171EB0%26layout=PESTICID,L,X,0;TIME,C,X,1;GEO,L,Y,0;UNIT,L,Z,0;INDICATORS,C,Z,1;%26zSelection=DS-382683UNIT,KG;DS-382683INDICATORS,OBS_FLAG;%26rankName1=UNIT_1_2_-1_2 Search PubMed.
Footnote |
| † Electronic supplementary information (ESI) available. See https://doi.org/10.1039/d2va00036a |
| This journal is © The Royal Society of Chemistry 2022 |