Enhancing the luminescence performance of Ca2−xSrxBO3Cl:Eu2+,Dy3+ by substitution of Sr2+ for Ca2+

Junlong Cao , Songsong Ding , Yunpeng Zhou , Xilin Ma and Yuhua Wang *
National & Local Joint Engineering Laboratory for Optical Conversion Materials and Technology of National Development and Reform Commission, Department of Materials Science, Cross-Strait Research and Technology Transfer Center for Optoelectronic Materials & Devices of Lanzhou University and Taiwan Kun Shan University, School of Materials and Energy, Lanzhou University, No. 222, South Tianshui Road, Lanzhou, Gansu 730000, P. R. China. E-mail: caojl2020@lzu.edu.cn; dingss18@lzu.edu.cn; zhouyp18@lzu.edu.cn; maxilin20@lzu.edu.cn; wyh@lzu.edu.cn

Received 8th June 2022 , Accepted 18th July 2022

First published on 22nd July 2022


Abstract

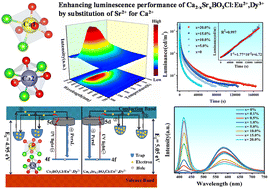
As reusable materials, persistent luminescence (PersL) materials have a wide range of applications in emergency response, information encryption and other fields. However, there is still a lack of commercial PersL materials with a yellow afterglow in current studies. Based on this, a series of Ca2−xSrxBO3Cl:Eu2+,Dy3+ samples were synthesized by a high temperature solid-state method, and then their crystal structure, optical performance and trap properties are discussed in this work. First, EPR and XPS showed that Sr2+ substitution is beneficial for the generation of oxygen vacancy traps, which would improve the luminescence performance of the samples from 12 h to 46 h. Next, through PL and XANES it was found that the characteristic emission of oxygen vacancies and Eu2+ emission presented color-adjustable PL properties, and also produced single matrix white light, which solved the stroboscopic problem of the blue chip in LEDs. In addition, the emission of oxygen vacancies can transfer energy to Eu2+ excitation, which marks the first report on the energy transfer of oxygen vacancies. Finally, the ML properties of the samples were investigated, providing a new method for enhancing the luminescence properties of samples.


Introduction

As science and technology develop by leaps and bounds, energy and environmental issues have posed an increasingly serious challenge to human life, so researchers in relevant fields are committed to seeking environmentally friendly and reusable materials. In this context, as a reusable energy storage material, long persistent luminescence materials have attracted much attention.1–3 Persistent luminescence (PersL) materials have unique properties for storing energy, with afterglow properties of different materials ranging from a few seconds to several days.4,5 Applied in coatings, inks and glass ceramics at first, PersL materials are now being used in fields including emergency escape, defence and military, information encryption and light storage as research develops.6–8 In the current research studies, among PersL materials, which mainly emit short wavelength visible light, SrAl2O4:Eu2+,Dy3+ (green, >24 h),9 CaAl2O4:Eu2+,Nd3+ (blue, >19 h)10 and Y2O2S:Eu3+, Mg2+,Ti4+ (orange-red, >5 h)11 are more mature. These three commercial phosphors can cause damage to human eyes because most of them are cool-coloured phosphors. In fact, compared with other commercial PersL materials, most yellow PersL samples such as SrSi3O5:Eu2+,Dy3+12 and Ca2ZnSi2O7:Eu2+,Dy3+13 have poor chemical stability, low initial brightness and short afterglow time. There is still a lack of yellow PersL phosphor materials due to inadequate research studies on the afterglow luminescence mechanism, and no practical application of yellow PersL phosphors has been reported. In this context, the research and development of novel warm-coloured yellow PersL phosphors is of great importance.

PersL fluorescent materials generally consist of a matrix and an activator, with the latter acting as a luminescence center in the material, and the same activator demonstrates different PersL properties in different substrates.14,15 Eu2+ can exhibit emission from violet to red and even near-infrared wavelengths because its 5d electron orbitals are naked and highly influenced by the crystal field.16 The PersL performance of samples singly doped with Eu2+ is poor, and other trivalent rare earth ions such as Dy3+ and Nd3+ ions need to be co-doped to improve the PersL properties of the sample. Therefore, unequal substitution of Dy3+ and Nd3+ ions would generate a large number of traps, which is beneficial to the improvement of afterglow performance.17,18 For example, Matsuzawa revealed that the afterglow properties of SrAl2O4:Eu2+ (green) could be improved from 10 h to 40 h by co-doping with Eu2+ and Dy3+;9 Wang discovered that the afterglow properties of Li2SrSiO4:Eu2+,Dy3+ (orange-yellow), can be promoted significantly from several minutes to 15 h by co-doping with Eu2+ and Dy3+;19 Wang et al. found that the afterglow properties of Sr3SiO5:Eu2+ could reach 14 h through co-doping with Eu2+ and Dy3+ (yellow).12 However, in the present research studies, the performance of the yellow PersL materials is still not comparable to that of commercial phosphors including SrAl2O4:Eu2+,Dy3+ and Sr2MgSi2O7:Eu2+,Dy3+, so there is an urgent need to find a warm PersL material with excellent performance.

In recent years, the design and modulation of phosphors by replacing anions or ionic groups with solid solution have become one of the research hotspots. Denalt et al. found that the luminescence performance of Ba2−xSrxSiO4:Eu2+ samples could be substantially improved by using the substitution of the same main group ion Sr2+ in Ba2SiO4:Eu2+, which is because Sr2+ substitution increased the thermal stability of phosphors and produced a more rigid crystal structure;20 Xia pointed out that the the fluorescence performance of Ca2(Al1−xMgx)(Al1−xSi1+x)O7:Eu2+ could see significant improvements by replacing the [Al3+–Al3+] structural unit with [Mg2+–Si4+] to facilitate the electron–phonon coupling effect;21 Lin et al. substituted CaYAlO4:Eu2+,Eu3+ phosphors with [Si4+–Al3+], [Ca2+–Y3+] to make the octahedral lattice of AlO6 shrink and the polyhedral lattice of CaO9 expand, so that some of the Eu3+ ions are reduced to Eu2+ and the luminous color of the samples is adjustable;22 Zhou noted that the near-infrared spectrum coverage of BaMgGaxAl10−xO17:Cr3+ was greatly enhanced through the solid solution with Ga3+and Al3+ and the half-peak width increased from 100 nm to 300 nm, and the substitution of Ga3+ for Al3+ led to an increase in CrO bond stress, a decrease in the bond length and an increase in energy level cleavage, resulting in a significant improvement in the optical properties of the sample;23 Ma et al. investigated a 2000% increase in initial afterglow luminance and 350% increase in afterglow time in the BaGa2−xZnxO4:Pr3+ series of samples;24 Xie found that the trap depth of Y3Al5−xGaxO12:Ce3+,V3+ (x = 0–3) could be adjusted by solid solution of Al3+ by Ga3+, resulting in the change of the crystal field intensity. Meanwhile, the solid solution of Ga3+ led to the adjustment of the luminescence color of the sample from green to yellow, which has a good application prospect for optical storage.25

Therefore, in this work a high temperature solid-phase method was used to successfully prepare the Ca2−xSrxBO3Cl:Eu2+,Dy3+ solid solution borate system by replacing Ca2+ with Sr2+ ions of the same main group. The cationic solid solution substitution was adopted to improve the PersL performance of the phosphor so that its PersL performance could be increased from 12 h to 46 h. Finally, samples with different Sr2+ solid solution concentrations were investigated and some explanations were given for the mechanical luminescence properties produced by the samples after solid solution.

Materials and methods

Materials and synthesis

A series of samples were prepared by using the traditional high temperature solid phase method. Raw materials including CaCO3 (A. R.), SrCO3 (A. R.), H3BO3 (A. R.), CaCl2 (A. R.), Eu2O3 (A. R.) and Dy2O3 (A. R.) were taken on the basis of the stoichiometric ratio, and then they were put into an agate mortar to mix evenly after adding a certain amount of alcohol. Next, the mixture was placed in a crucible under the reducing atmosphere of a high-temperature furnace. The samples were cooled to room temperature in the high temperature furnace after heating to 950 °C for 6 hours. Finally, the samples were collected for further research.

Measurements and characterization

The samples were subjected to analysis on a Rigaku D/Max-2400 X-ray diffractometer (XRD) with Cu Kα radiation running from 10° to 80° and the working state of 40 kV and 60 mA. The structure of the experimental product was analyzed using the general structure analysis system (GSAS). HRTEM was performed on an FEI TecnaiF30 TEM operating at 300 kV. EDX and HAADT were used in conjunction to measure the elemental composition. The diffuse reflectance spectrum (DRS) using BaSO4 as a reference substance was recorded on a spectrophotometer. An FS5 spectrofluorometer was adopted to measure photoluminescence (PL), photoluminescence excitation (PLE), PersL spectra and luminescence decay curves of samples. The samples were irradiated under an ultraviolet lamp at 254 nm for 10 min to record their PersL emission spectra, PersL decay curves, TL spectra and PersL images of the samples. The 3D thermoluminescence (TL) spectrum of the sample was obtained using a LTTL-3DS 3D TL spectrometer. The electron paramagnetic resonance (EPR) test was carried out using a JES-FA300 instrument. Analysis of the characteristic emission of Eu ions from samples was performed using the BL02U1 in the Shanghai Synchrotron Radiation Facility. It is worth noting that all samples were measured in a stable environment at room temperature.

Results and discussion

Structure and morphology

Fig. 1a shows the XRD patterns of Ca2−xSrxBO3Cl (0 ≤ x ≤ 30%) under different Sr2+ substitution concentrations. As the substitution concentration of Sr2+ increases, an impurity phase appears in the XRD patterns. The XRD patterns of the samples are pure single-phases except when the substitution concentration of Sr2+ is higher than 20%. The SrBO3 impurity phase occurs when the substitution concentration of Sr2+ is above 20% (the impurity phase SrBO3 is marked with “*”). It is worth noting that the peaks in some positions of the XRD patterns appear because the main phase Ca2BO3Cl and impurity phase SrBO3 overlap to some extent. The presence of the impurity phase will affect the luminescence performance of the main phase, so its luminescence performance will be no longer investigated when the substitution concentration of Sr2+ exceeds 20%. It can be seen that the diffraction peaks in the XRD pattern move in the small angle direction with the increase of Sr2+ doping (as shown in the illustration on the right), which is because Sr2+ (CN = 7, 1.21 Å) can replace the lattice Ca2+ ions when doping because as two elements of the same main group, the ionic radii of Sr2+ and Ca2+ are similar in size.26 In order to obtain the changes in the crystal structure of the samples after replacing Ca2+ with Sr2+ of different concentrations, the structure of the Ca2−xSrxBO3Cl (x = 0, 10%, 20%) matrix was optimized by using GSAS, as exhibited in Fig. S1 (ESI). The three parameters χ2, Rwp and Rp obtained by refining and optimizing the structure of the main phase can demonstrate that the structure optimization result of the main phase has good reliability. The crystal structure of the main phase obtained by structural optimization is shown in Table S1 (ESI). At the same time, the XRD patterns of Ca2−xSrxBO3Cl:0.1%Eu2+,0.1%Dy3+ (0 ≤ x ≤ 20%) with different Sr2+ concentrations are presented in Fig. S2 (ESI). It was found that there was no impurity phase in the series of samples, so their optical properties were studied subsequently.
image file: d2tc02382b-f1.tif
Fig. 1 (a) The XRD patterns of Ca2−xSrxBO3Cl (0 ≤ x ≤ 30%); (b) the structural model of Ca2BO3Cl and the two Ca2+ site positions in the crystal structure; (c) the SEM image of Ca1.8Sr0.2BO3Cl:Eu2+,Dy3+ (the inset depicts the particle size distribution of the sample); (d) the TEM of Ca1.8Sr0.2BO3Cl:Eu2+,Dy3+ (the inset shows the HR-TEM particle size distribution of the sample); (e) the HAADF-STEM and elemental analysis of Ca1.8Sr0.2BO3Cl:Eu2+,Dy3+; and (f) XPS full spectrum and fine spectrum of each element in Ca1.8Sr0.2BO3Cl:Eu2+,Dy3+.

According to the above refined structure, the crystal structure of Ca2BO3Cl was explored. Fig. 1b shows the crystal structure of the Ca2BO3Cl·Ca2BO3Cl crystal belonging to the P121/C1(14) space group with the monoclinic system. As can be seen, there are two Ca positions in Ca2BO3Cl, namely Ca1 and Ca2. The B3+ ion is connected to three O2−, which is a typical sp2 hybrid orbital. At the same time, Ca1 connects 5 O2− and 2 Cl while Ca2 connects 4 O2− and 3Cl. Eu2+ (CN = 7, r = 1.2 Å) and Dy3+ (CN = 7, r = 0.97 Å) parameters are similar to those of Ca2+ (CN = 7, 1.06 Å), so Eu2+ and Dy3+ can replace the position of Ca2+ when doping. But the Ca2+ ion has two lattice places, which means that Eu2+ has two possibilities for substitution. Lattice occupation will be discussed for the photoluminescence spectra below.27

A scanning electron microscope (SEM) and a transmission electron microscope (TEM) were used to characterize the morphology of Ca1.8Sr0.2BO3Cl:Eu2+,Dy3+, as shown in Fig. 1c and d. It can be seen from the SEM image that the particle morphology of the sample is irregular, but its particle size is relatively uniform. The distribution diagram of particle size in the inset demonstrates that the particle size of the sample roughly ranges from 20 μm to 40 μm, with an average size of 32.01 μm, which is suitable for producing excellent afterglow properties. Fig. 1d displays the TEM image of Ca1.8Sr0.2BO3Cl:Eu2+,Dy3+, and the inset is the HR-TEM image and SAED pattern of the sample. According to the HR-TEM image, the crystal lattice of the sample can be clearly observed and the sample has good crystallinity.28 After a certain measurement, the plane spacing of the sample is 0.410 nm, which belongs to the (0 2 1) crystal plane of the sample. In Fig. 1e and f, high-angle annular dark field (HAADF-STEM) and X-ray photoelectron spectroscopy (XRS) were used to analyze the elemental composition and valence state of Ca1.8Sr0.2BO3Cl:Eu2+,Dy3+. From the HAADF, it can be seen that the sample does not have any impurity elements. The illustration depicts the mapping of each element in the sample. XPS showed that all the elements in Ca1.8Sr0.2BO3Cl:Eu2+,Dy3+ are in the expected valence state, which will be discussed in detail in the thermoluminescence section.

Photoluminescence properties

Fig. 2a shows the emission spectra of Ca2−xSrxBO3Cl:Eu2+,Dy3+ excited at 338 nm. Just as illustrated in the figure, the emission spectra of the series of samples consist of two peaks, among which the emission peak at 585 nm is due to an electron transition of Eu2+ from 4f7 to 4f65d1.29 With the increase of the Sr2+ substitution concentration, the full width at half-maximum increases from 20 nm to 41 nm; the emission peak at 470–750 nm is attributed to Eu2+ characteristic emission, and full width at half-maximum decreases from 132 nm to 103 nm. And the IQE of Ca1.8Sr0.2BO3Cl:Eu2+,Dy3+ was 38.06%. The X-ray absorption near-edge spectroscopy (XANES) spectra of Ca1.8Sr0.2BO3Cl:Eu2+ are shown in Fig. 2b. By comparing with the XANES spectra of the BAM:Eu2+,Eu2O3 standard sample, it is found that the peak value of the sample is 6974 eV, which is completely consistent with the peak value of the standard sample, indicating that the characteristic emission peak of the sample is attributed to Eu2+.30 The source of the emission peak at 420 nm is worth exploring. According to the current literature, it is mainly caused by Eu2+ occupying different Ca2+ positions, or by the emission peak of the oxygen vacancies generated in the solid solution process of Ca2+ by Sr2+. To further prove the above two possibilities, a series of Ca2−xSrxBO3Cl samples were prepared under a vacuum environment and reducing atmosphere, respectively, and then their luminescence properties were tested. As shown in Fig. S3 (ESI), solid line in reducing atmosphere, dotted line in vacuum atmosphere. The series of samples without Eu2+ doping also have an emission peak at 420 nm, and the emission peak intensity of the samples prepared under a reducing atmosphere is significantly higher than that under a vacuum atmosphere. Therefore, the first possibility is ruled out and the second possibility must be the reason. Electron paramagnetic resonance (EPR) was performed on the Ca2−xSrxBO3Cl series of samples prepared under a reducing atmosphere, and the test results are displayed in Fig. 2c. According to EPR spectra, the resonance signal of the oxygen vacancies in the Ca2−xSrxBO3Cl series of samples was g = 2.002.31 As the amount of Sr2+ solid solution concentration increases, the number of oxygen vacancies increases because Sr2+ generates a certain amount of oxygen vacancy traps during solid solution, which is caused by oxygen ions entering the lattice gap and generating traps in the lattice. Moreover, the EPR test was carried out on the Ca1.8Sr0.2BO3Cl:Eu2+,Dy3+ sample, which presented the resonance signal not only for oxygen vacancies but also for Eu2+, supporting the presence of Eu2+ in the sample. The electronic structure of Eu2+ is 4f7 (the ground state of 8S7/2), and the spin quantum number of Eu2+ is S = 7/2, which makes the EPR spectrum of the sample present 7 peaks. Meanwhile, it can be seen that the 7 spectral lines of the sample are asymmetrical due to anisotropy caused by the splitting of the crystal field of the sample.32,33
image file: d2tc02382b-f2.tif
Fig. 2 (a) Photoluminescence emission spectra of Ca2−xSrxBO3Cl:Eu2+,Dy3+; (b) XANES spectra of Ca1.8Sr0.2BO3Cl:Eu2+,Dy3+; (c) EPR spectra of Ca2−xSrxBO3Cl (x = 0, 10%, 20%) and Ca1.8Sr0.2BO3Cl:Eu2+,Dy3+; (d) the decay curves of Eu2+ in Ca1.8Sr0.2BO3Cl:xEu2+ (0.1% ≤ x ≤ 4%); (e) the excitation spectra of oxygen vacancies of Ca2−xSrxBO3Cl:Eu2+,Dy3+; and (f) the excitation spectra of Eu2+ in Ca2−xSrxBO3Cl:Eu2+,Dy3+.

It is worth noting that as the amount of Sr2+ increases, as shown in Fig. S4 (ESI) CIE coordinates (Commission Internationale de l'Eclairage), the sample can move from yellow to white and thus a warm white phosphor could be obtained. In addition, with the increase of Sr2+ substitution concentration, emission peaks of oxygen vacancies gradually increase while the emission peak of Eu2+ decreases, which may be relevant to the change of crystal field caused by Sr2+ substitution. As the substitution concentration of Sr2+ increases, the crystal field symmetry of the matrix is reduced, which directly lowers the Eu2+ emission intensity. However, in view that the excitation peaks of Eu2+ and the emission peaks of the oxygen vacancies of the samples overlap to some extent, energy transfer occurs.34,35 Therefore, energy transfer was used to compensate for the reduction in the characteristic emission peak of Eu2+ caused by changes in the crystal field, thus decreasing the reduction rate of Eu2+ emission intensity. Fig. 2d shows the decay curves for the series of samples of Ca1.8Sr0.2BO3Cl:xEu2+. The calculated average lifetime is marked in the decay curve. It can be seen that the average lifetime decreases as the concentration of Eu2+ increases because the oxygen vacancies will transfer energy to Eu2+.36 The characteristic of the sample lies in that white light can be obtained by combining the sample and the UV chip instead of mixing with other phosphors. The electroluminescence spectra under excitation of the 340 nm UV chip are shown in Fig. S5 (ESI), with the best emission peaks located at 420 nm and 585 nm, which is in line with the photoluminescence spectra. On the successive UV chip, the emission peak at 420 nm in the electroluminescence (EL) spectrum of the sample decreases over time while the emission peak at 585 nm remains unchanged, indicating that there is energy transfer from the emission peak of the oxygen vacancies to the emission of Eu2+ and that the LED device has good stability.

Fig. 2e shows the excitation spectra of Ca2−xSrxBO3Cl:Eu2+,Dy3+ emission at 420 nm. The main peak at 338 nm is produced by the oxygen vacancies, and the emission intensity gradually increases as the concentration of Sr2+ solid solution increases. Fig. 2f shows the excitation peak of Eu2+, which belongs to the electron transition of Eu2+ from 4f65d1 to 4f7. Fig. S6 (ESI) displays the normalized excitation spectra of oxygen vacancies and Eu2+, and it is interesting that the excitation spectra of the samples are adjustable after normalizing their excitation peak, which is beneficial for expanding the application fields of the phosphor.

As the concentration of Sr2+ solid solution increases, the emission is gradually blue-shifted because the substitution of Ca2+ by Sr2+ is a large ionic radius substitution, which gives birth to lattice expansion, weakening of the crystal field, an increase in the band gap and reduction in energy level cleavage.37 At the same time, DRS and density functional theory were used to calculate the band gap of the series of samples. The calculated values from DRS and density functional theory (DFT) are exhibited in Fig. S1 and S6 (ESI) respectively. DRS and DFT calculations demonstrate that with the increase of the Sr2+ substitution concentration, the band gap value of the samples increases from 4.95 eV to 5.05 eV. This increase in band gap not only affects the energy level difference between the conduction band of the matrix and the 5d excited state of Eu2+, but also influences the luminescence intensity of Eu2+, which is in accordance with the reduction of Eu2+ characteristic emission. However, the reduction rate of Eu2+ emission will be decreased by using energy transfer. The specific calculation formula is as follows:38

 
(αhv)n = A(hvEg)(1)
 
image file: d2tc02382b-t1.tif(2)
where hv represents the energy of the incident light and α represents the absorption coefficient. It can be concluded that the solid solution of Sr2+ widens the band gap, which is consistent with the results obtained from density functional theory.

Persistent luminescence (PersL) properties

In order to characterise the afterglow properties of the samples, a series of samples were tested for their afterglow properties. All samples were pre-irradiated with a 254 nm UV lamp for 10 min before being tested for afterglow decay, with a threshold value of 0.32 mcd m−2.39Fig. 3a demonstrates the afterglow decay curve of the Ca2−xSrxBO3Cl:Eu2+,Dy3+ series of samples. It can be seen that the afterglow time of samples without solid solution only reaches more than 10 h, but their afterglow time can be increased to 46 h with the increase of Sr2+ solution concentration, which is improved by up to 400%. For the sample with the best afterglow time, a linear fitting of the inverse of the afterglow intensity versus time was performed, and the inset represents the inverse of the afterglow intensity (I−1) versus the afterglow decay time (t) for the Ca1.8Sr0.2BO3Cl:Eu2+,Dy3+ sample, and I−1’t can be well fitted by40
 
I−1 = 1.77 × 10⁻²t + 6.26.(3)

image file: d2tc02382b-f3.tif
Fig. 3 (a) Afterglow decay curves of the Ca2−xSrxBO3Cl:Eu2+,Dy3+ series of samples (the inset indicates the inverse of the afterglow intensity versus time for Ca1.8Sr0.2BO3Cl:Eu2+,Dy3+) and (b–d) afterglow spectra of Ca2−xSrxBO3Cl:Eu2+,Dy3+ (x = 0, 10%, 20%).

The fitting parameter is R2 = 0.997, indicating that the fitting is reliable. As can be seen from the figure, the relationship appears to be linear, which in turn indicates that the traps acting on the afterglow are continuously distributed and that the release of the traps is a continuous and linear process.41,42 We will analyse this in the subsequent TL spectra.

The afterglow spectra of Ca2−xSrxBO3Cl:Eu2+,Dy3+ are exhibited in Fig. 3b–d. Also, in the previous work, the oxygen vacancies exhibited an emission peak at 420 nm, but there was no characteristic emission of oxygen vacancies in the afterglow spectrum. When the solid solution concentration of Sr2+ increases, the number of oxygen vacancies increases and the free electrons captured by traps strengthen, which in turn enhances the afterglow performance of the sample. As for the formation principle of oxygen vacancies, it will be mentioned in the following discussion.

Trap analysis

After performing tests on the afterglow properties of the series of samples, the present work has carried out some tests on the thermoluminescence (TL) spectra of the series of samples. In general, the afterglow phenomenon is inextricably linked to the type of trap in the sample. The type and number of traps have a strong influence on the PesL performance, so we tested the three-dimensional TL spectra of Ca1.8Sr0.2BO3Cl:Eu2+,Dy3+ samples and the results are presented in Fig. 4a. It can be seen that the samples have a wide trap distribution in the temperature range of 300–500 K and that the trap distribution of the samples is continuously distributed.43
image file: d2tc02382b-f4.tif
Fig. 4 (a) 3D-TL spectrum of Ca1.8Sr0.2BO3Cl:Eu2+,Dy3+; TL spectra of (b) Ca2BO3Cl:Eu2+,Dy3+; (c) Ca1.9Sr0.1BO3Cl:Eu2+,Dy3+; and (d) Ca1.8Sr0.2BO3Cl:Eu2+,Dy3+.

The trap depth (E) is calculated with the following equation44

 
E = Tm/500(4)
where Tm represents the temperature peak in the TL spectrum. After calculation, the trap energy level of the Ca1.8Sr0.2BO3Cl:Eu2+,Dy3+ sample is mainly distributed in the range of 0.60–1.00 eV and such a trap depth is suitable for afterglow generation. Fig. 4b–d show the TL spectra of Ca2−xSrxBO3Cl:Eu2+,Dy3+ (x = 0, 10%, 20%) samples after 10 min of excitation and placed for different testing times. It is obvious that as time increases, the intensity of the shallow trap peak decreases and gradually approaches that of the deep trap peak. This result also indicates that the trap distribution of the samples is continuous. The TL spectra of the samples demonstrate that there is no increase in the type of traps in the samples but a change in the number. In the series of samples, traps arise due to Ca2+ equivalent and unequal substitution of Eu2+ and Dy3+, with Dy3+ replacing the Ca2+ in the lattice to form traps.

In addition, according to the principle of trap formation, there are many intrinsic traps in samples during the preparation by the high-temperature solid-phase method, as illustrated in Table 1. It is believed that the afterglow of the sample without solid solution is caused by many trap energy levels in the sample, such as oxygen vacancies and so on. XPS was used to analyze the chemical environment of each element in Ca2−xSrxBO3Cl:Eu2+,Dy3+, as illustrated in Fig. S8 (ESI). Chemical environment analysis of oxygen elements in the samples discovered that the 1s electronic orbital of the oxygen atom can be fitted into three peaks, among which OI is attributed to lattice oxygen, OII to oxygen vacancy and OIII to adsorbed oxygen.45 With the increase of the Sr2+ solid solution concentration, the number of oxygen vacancies increases dramatically, so the number of oxygen ions around Ca2+ decreases due to the reduction of the coordination number, leading to the change of the binding energy.46 At the same time, the increase in oxygen vacancies leads to the greater energy difference between the trap energy level and the bottom of the host conduction band, as well as the greater trap energy level depth. When the trap depth increases, more electrons are captured, which also causes an increase in the number of electrons in the shallow traps. In addition, as the trap depth deepens, the synergistic effect of the increased number of electrons and the slower escape rate of electrons from the traps makes the sample have a stronger initial brightness and longer afterglow time. Therefore, the luminescence intensity and decay time of PersL materials can be improved by adjusting the distribution and depth of traps via the increase of Sr2+ substitution concentration.

Table 1 Point defect reactions for Ca2−xSrxBO3Cl:Eu2+,Dy3+ LPL phosphors
Type (intrinsic) Reaction
Frenkel image file: d2tc02382b-t2.tif
image file: d2tc02382b-t3.tif
image file: d2tc02382b-t4.tif
image file: d2tc02382b-t5.tif
Schottky image file: d2tc02382b-t6.tif

Type (extrinsic) Charge compensation Reaction
Eu2+ → Ca2+ Interstitial Eu2+ + Ca2+ → EuCa
Dy3+ → Ca2+ Interstitial image file: d2tc02382b-t7.tif
Sr2+ → Ca2+ Interstitial Sr2+ + Ca2+ → SrCa


After the substitution of Sr2+ for Ca2+, the number of oxygen vacancy traps increased and the band gap of the sample widened from 4.95 eV to 5.05 eV, resulting in an increase in the afterglow properties of the Ca1.8Sr0.2BO3Cl:Eu2+,Dy3+ sample. Based on the above experimental data and speculation, the schematic diagram of afterglow generation was proposed, as shown in Fig. 5. Under the excitation of the UV light, the electrons in the ground state entered the excited state of the CB and become free electrons, as illustrated in ①. Next, these free electrons were caught by the traps, as displayed in ②. Then, when the excitation light source was removed, the electrons captured by the shallow traps and deep traps returned to the CB under the influence of thermal disturbance, as exhibited in ③. Finally, they returned to the ground state and produced yellow PersL, which is in line with the Dorenbos afterglow mechanism model. The applications of some samples in mechanoluminescence and life will be discussed below.28


image file: d2tc02382b-f5.tif
Fig. 5 The schematic diagram of the PersL mechanism of Ca2BO3Cl:Eu2+,Dy3+ and Ca1.8Sr0.2BO3Cl:Eu2+,Dy3+.

Mechanoluminescence

Ca2BO3Cl is an asymmetric crystal structure. Asymmetric piezoelectric materials will produce piezoelectricity under pressure because the energy band of the material will be tilted and the deep trap will be released, which will compound with the luminescence center to produce mechanoluminescence (ML) properties.47 The traps of the sample caused by Eu2+ and Dy3+ doping will lead to ML, and meanwhile the substitution of Ca2+ by Sr2+ at different concentrations will lead to an increase in the number of traps of the sample, which will improve its ML performance. To explore the ML properties of Ca1.8Sr0.2BO3Cl:Eu2+,Dy3+, the samples in this part were prepared by mixing a certain proportion of PDMS (polydimethylsiloxane) with a curing agent. Fig. 6a demonstrates the 120% stretching of Ca1.8Sr0.2BO3Cl:Eu2+,Dy3+, and the ML phenomenon after stretching was captured by the camera. Fig. 6b displays that when the force of 2 N was applied to the sample, there was yellow light emission in the applied area, and the sample could exhibit good ML properties. Fig. 6c exhibits the ML spectra of Ca1.8Sr0.2BO3Cl:Eu2+,Dy3+ under different pressures. Within the test range (0.1–2 N), the luminescence intensity of the sample increases with the increase of pressure, and the peak position of the ML spectra remains at 585 nm, which is attributed to the 4f7–4f65d1 electron transition of Eu2+. The sample has good potential for engineering applications such as bridge fracture detection, tensile testing, biocompatibility and self-powered fields due to its ML properties.
image file: d2tc02382b-f6.tif
Fig. 6 (a) The image of a tensile test on Ca1.8Sr0.2BO3Cl:Eu2+,Dy3+; (b) the image of the sample with an applied force of 2 N; (c) the ML spectra of Ca1.8Sr0.2BO3Cl:Eu2+,Dy3+ under different force.

Application of Ca2−xSrxBO3Cl:Eu2+,Dy3+

White light emitting diodes (wLEDs) are generally a mixture of red, green and blue (RGB). The sample Ca1.8Sr0.2BO3Cl:Eu2+,Dy3+ has emission peaks at 420 nm and 585 nm under ultraviolet excitation, and then emits a yellow afterglow. On the basis of this performance, an LED device based on Ca1.8Sr0.2BO3Cl:Eu2+,Dy3+ was successfully prepared using a 340 nm UV chip. In addition, the CIE of the pc-LED was tested and the CIE color coordinate values of pc-LED were 0.339, 0.307. Fig. 7a–c show the pictures of the LED without power and under working conditions, respectively. After 10 min of excitation, the device showed a yellow afterglow when the power was disconnected. Fig. 7d–g display the yellow afterglow of the device placed for different times after the power was disconnected. The results show that the device emits white light in the powered state and after disconnection it emits a yellow afterglow with a colour temperature of 3824 K, which conforms to the human sleep index. Thus it is concluded that Ca1.8Sr0.2BO3Cl:Eu2+,Dy3+ can be used as a sleeping lamp.
image file: d2tc02382b-f7.tif
Fig. 7 (a and b) WLED without power supply and working under natural light; (c) wLED working in the night environment; and (d–g) photos of long afterglow placed for different times after power failure.

Conclusion

In conclusion, a new solid solution yellow PersL material Ca2−xSrxBO3Cl:Eu2+,Dy3+ was successfully designed and prepared by a high temperature solid phase method. PL and EPR spectra demonstrated that Sr2+ solid solution could increase the oxygen vacancies in samples, resulting in an emission peak at 420 nm in the series of samples. Eu2+ doping produced an emission peak at 585 nm, which interacted with the emission peak at 420 nm to produce white light. With the increase of the Sr2+ solid solution concentration, the trap depth and width of Ca2−xSrxBO3Cl:Eu2+,Dy3+ are improved significantly, leading to an enhancement in the afterglow performance from 12 h to 46 h and an improvement of ML properties of the samples. Therefore, the sample with the most excellent properties in the series of samples has large potential for application in engineering.

Author contributions

Junlong Cao: experimental design, data collection and interpretation, and writing the manuscript. Songsong Ding and Yunpeng Zhou: data curation and software. Xilin Ma: idea refinement and additional proposal. Yuhua Wang: funding acquisition, writing, review & editing, and supervision.

Conflicts of interest

The authors declare no conflicts of interest.

Acknowledgements

This work was financially supported by the Department of Industry and Information Technology of Gansu Province (18YF1NA104). Thanks to Prof Y. Zhuang for guidance in the 3D thermoluminescence spectrum. Thanks to Prof Xiaolong Li for help in the XANES test.

References

  1. Y. Zhuang, D. Chen, W. Chen, W. Zhang, X. Su, R. Deng, Z. An, H. Chen and R. J. Xie, Light: Sci. Appl., 2021, 10, 132 CrossRef CAS PubMed.
  2. Y. Zhou, T. Seto, Z. Kang and Y. Wang, Dalton Trans., 2021, 50, 11793–11803 RSC.
  3. Y. Zhou, X. Li, T. Seto and Y. Wang, ACS Sustainable Chem. Eng., 2021, 9, 3145–3156 CrossRef CAS.
  4. J. Zhou, Z. Long, Q. Wang, D. Zhou, J. Qiu and X. Xu, J. Am. Ceram. Soc., 2018, 101, 2695–2700 CrossRef CAS.
  5. H. Wu, M. Wang, L. Huai, W. Wang, J. Zhang and Y. Wang, Nano Energy, 2021, 90, 106546 CrossRef CAS.
  6. Y. Wang, P. Feng, S. Ding, S. Tian and Y. Wang, Inorg. Chem. Front., 2021, 8, 3748–3759 RSC.
  7. N. S. M. Viswanath, G. K. Grandhi, H. J. Kim, Y. Zhuang, R.-J. Xie and W. B. Im, Appl. Mater. Today, 2020, 18, 100518 CrossRef.
  8. K. Van den Eeckhout, P. F. Smet and D. Poelman, Materials, 2010, 3, 2536–2566 CrossRef CAS.
  9. T. Matsuzawa, Y. Aoki, N. Takeuchi and Y. Murayama, J. Electrochem. Soc., 1996, 143, 2670–2673 CrossRef CAS.
  10. S. Ding, P. Chen, H. Guo, P. Feng, Y. Zhou, Y. Wang and J. Sun, J. Energy Chem., 2022, 69, 150–160 CrossRef.
  11. Y. Li, M. Gecevicius and J. Qiu, Chem. Soc. Rev., 2016, 45, 2090–2136 RSC.
  12. Z. Wang, Z. Song, L. Ning, Z. Xia and Q. Liu, Inorg. Chem., 2019, 58, 8694–8701 CrossRef CAS PubMed.
  13. L. Jiang, S. Xiao, X. Yang, X. Zhang, X. Liu, B. Zhou and X. Jin, J. Mater. Sci. Eng. B, 2013, 178, 123–126 CrossRef CAS.
  14. S. Ding, H. Guo, P. Feng, Q. Ye and Y. Wang, Adv. Opt. Mater., 2020, 8, 2000097 CrossRef CAS.
  15. J. Hao, L. Cao, Y. Wei, C. Yan and G. Li, Mater. Lett., 2018, 211, 122–125 CrossRef CAS.
  16. L. Li, L. Wondraczek, M. Peng, Z. Ma and B. Zou, Nano Energy, 2020, 69, 104413 CrossRef CAS.
  17. S. Lin, H. Lin, Q. Huang, Y. Cheng, J. Xu, J. Wang, X. Xiang, C. Wang, L. Zhang and Y. Wang, Laser Photonics Rev., 2019, 13, 1900006 CrossRef.
  18. H. Lin, B. Wang, Q. Huang, F. Huang, J. Xu, H. Chen, Z. Lin, J. Wang, T. Hu and Y. Wang, J. Mater. Chem. C, 2016, 4, 10329–10338 RSC.
  19. S. Cheng, X. Xu, J. Han, J. Qiu and B. Zhang, Powder Technol., 2015, 276, 129–133 CrossRef CAS.
  20. K. A. Denault, J. Brgoch, M. W. Gaultois, A. Mikhailovsky, R. Petry, H. Winkler, S. P. DenBaars and R. Seshadri, Chem. Mater., 2014, 26, 2275–2282 CrossRef CAS.
  21. Z. Xia, C. Ma, M. S. Molokeev, Q. Liu, K. Rickert and K. R. Poeppelmeier, J. Am. Chem. Soc., 2015, 137, 12494–12497 CrossRef CAS PubMed.
  22. Y. Zhang, X. Li, K. Li, H. Lian, M. Shang and J. Lin, ACS Appl. Mater. Interfaces, 2015, 7, 2715–2725 CrossRef CAS PubMed.
  23. Y. Zhou, C. Li and Y. Wang, Adv. Opt. Mater., 2022, 2102246 CrossRef CAS.
  24. X. Ma, P. Feng, Y. Wang, S. Ding, S. Tian and Y. Wang, J. Mater. Chem. C, 2022, 10, 1105–1117 RSC.
  25. W. Li, Y. Zhuang, P. Zheng, T. L. Zhou, J. Xu, J. Ueda, S. Tanabe, L. Wang and R. J. Xie, ACS Appl. Mater. Interfaces, 2018, 10, 27150–27159 CrossRef CAS PubMed.
  26. P. Feng, G. Li, H. Guo, D. Liu, Q. Ye and Y. Wang, J. Phys. Chem. C, 2019, 123, 3102–3109 CrossRef CAS.
  27. W. Zeng, Y. Wang, S. Han, W. Chen, G. Li, Y. Wang and Y. Wen, J. Mater. Chem. C, 2013, 1, 3004–3011 RSC.
  28. K. Huang, X. Dou, Y. Zhang, X. Gao, J. Lin, J. Qu and Y. Li, Adv. Funct. Mater., 2021, 31, 2009920 CrossRef CAS.
  29. H. Fang, X. Wei, Z. Wang, J. Cheng, M. Yin and Y. Chen, J. Lumin., 2017, 191, 46–50 CrossRef CAS.
  30. P. J. R. Montes, V. C. Teixeira, D. A. B. Barbosa, C. W. A. Paschoal and M. V. d S. Rezende, J. Alloys Compd., 2017, 708, 79–83 CrossRef CAS.
  31. J. S. Kim, P. E. Jeon, J. C. Choi, H. L. Park, S. I. Mho and G. C. Kim, Appl. Phys. Lett., 2004, 84, 2931–2933 CrossRef CAS.
  32. V. Singh, G. Sivaramaiah, J. L. Rao and S. H. Kim, J. Lumin., 2015, 157, 74–81 CrossRef CAS.
  33. T. Hu, H. Lin, J. Xu, B. Wang, J. Wang and Y. Wang, J. Mater. Chem. C, 2017, 5(6), 1479–1487 RSC.
  34. X. Wang, Z. Qiu, Y. Li, Q. Mi, W. Zhou, S. Ai, J. Xu, Y. Liu and S. Lian, J. Mater. Chem. C, 2019, 7, 5931–5936 RSC.
  35. G. Zhang, D. Wang, B. Lou, C. Ma, A. Meijerink and Y. Wang, Angew. Chem., Int. Ed., 2022, 202207454 Search PubMed.
  36. J. Ueda, P. Dorenbos, A. J. J. Bos, K. Kuroishi and S. Tanabe, J. Mater. Chem. C, 2015, 3, 5642–5651 RSC.
  37. A. Mao, Z. Zhao, J. Wang, C. Yang, J. Ren and Y. Wang, Chem. Eng. J., 2019, 368, 924–932 CrossRef CAS.
  38. Y. Wang, J. Ding, X. Zhou and Y. Wang, Chem. Eng. J., 2020, 381, 122528 CrossRef CAS.
  39. E. Finley and J. Brgoch, J. Mater. Chem. C, 2019, 7, 2005–2013 RSC.
  40. R. Zhou, F. Ma, Y. Yang, T. Deng, J. Li, H. Zhao, J. Sheng and Q. Peng, Inorg. Chem. Front., 2022, 9, 23–34 RSC.
  41. W. Xie, S. R. Zhang, D. Y. Du, J. S. Qin, S. J. Bao, J. Li, Z. M. Su, W. W. He, Q. Fu and Y. Q. Lan, Inorg. Chem., 2015, 54, 3290–3296 CrossRef CAS PubMed.
  42. X. Yang, R. Liu, X. Xu, Z. Liu, M. Sun, W. Yan, D. Peng, C. N. Xu, B. Huang and D. Tu, Small, 2021, 17, e2103441 CrossRef PubMed.
  43. S. Li, J. Luo, J. Liu and J. Tang, J. Phys. Chem. Lett., 2019, 10, 1999–2007 CrossRef CAS PubMed.
  44. Z. Sun, J. Yang, L. Huai, W. Wang, Z. Ma, J. Sang, J. Zhang, H. Li, Z. Ci and Y. Wang, ACS Appl. Mater. Interfaces, 2018, 10, 21451–21457 CrossRef CAS PubMed.
  45. L. Song, P.-P. Li, W. Yang, X.-H. Lin, H. Liang, X.-F. Chen, G. Liu, J. Li and H.-H. Yang, Adv. Funct. Mater., 2018, 28, 1707496 CrossRef.
  46. H. Lin, B. Wang, Q. Huang, F. Huang, J. Xu, H. Chen, Z. Lin, J. Wang, T. Hu and Y. Wang, J. Mater. Chem. C, 2016, 4, 10329–10338 RSC.
  47. M. Zhao, Z. Yang, L. Ning and Z. Xia, Adv. Mater., 2021, 33, e2101428 CrossRef PubMed.

Footnote

Electronic supplementary information (ESI) available: Sample XRD structure refinement and XRD pattern, diffuse reflection and estimated optical bandgap of Ca2−xSrxBO3Cl, emission spectrum of the series of samples prepared under a reducing atmosphere and vacuum environment, CIE chromaticity diagram of samples, and optical cycling performance of PC-LED. See DOI: https://doi.org/10.1039/d2tc02382b

This journal is © The Royal Society of Chemistry 2022