Real-time views of morphological evolution in solution-processed organic photovoltaics

Yanfeng Liu a, Yingzhi Jin b, Yue Wu a and Yufei Zhong *a
aSchool of Materials Science and Engineering (MSE), NingboTech University, No. 1 South Qianhu Road, Ningbo, 315100, P. R. China. E-mail: yufei.zhong@nit.zju.edu.cn
bChina-Australia Institute for Advanced Materials and Manufacturing, Jiaxing University, Jiaxing 314001, P. R. China

Received 26th May 2022 , Accepted 15th July 2022

First published on 18th July 2022


Abstract

The nanoscale morphology of the photoactive layer in solution-processed organic photovoltaics plays a critical role in device performance. Such an intricate morphology is sensitive to the processing conditions during film formation. From such a perspective, in situ characterizations stand out as they are able to provide insights for screening the film's transition from the solution state to the solid state. In this review, we summarize the state-of-the-art in situ characterization methods that are specifically designed to observe the drying kinetics of photoactive layers and discuss how they deepen our understanding of morphological evolution under different processing conditions. In particular, key factors such as the evolution of fine structure and interplay between solutes and solvents upon film formation could be revealed. We therefore use them as indicators to guide the future optimization of film morphology. We believe that a thorough understanding of morphological evolution, such as kinetics of crystallization and phase separation, through the above methodologies, can further push the efficiency of devices.
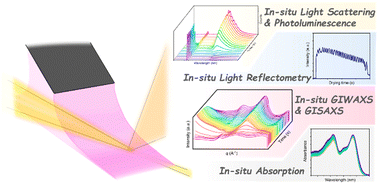

image file: d2tc02185d-p1.tif

Yufei Zhong

Yufei received his PhD from the department of applied chemistry in University of Tokyo under the supervision of Prof. Hashimoto Kazuhito. He carried out his postdoc studies with Dr Tajima Keisuke in Riken, Prof. Aram Amassian in KAUST and Prof. Natalie Banerji in the University of Bern. He now serves as a full professor in NingboTech University in China. His research focuses on molecular self-assembly in solution-processed organic semiconductors and interfacial photophysics in optoelectronics. He aims to understand the fundamental aspects, especially of next-generation photovoltaics and transfer the know-how for realizing their future practical applications.


1. Introduction

Driven by future net-zero purposes, clean and renewable resources are deemed to replace their old fossil-based counterparts. Solar cells that convert solar energy to electricity without extra carbon emission are an ideal option to meet our increasing demand for energy and the vision for reducing our carbon footprint. Organic solar cells (OSCs), with their eye-catching features like light weight, semi-transparency, and flexibility, have attracted extensive attention to date.1–4 In most cases, OSCs use two different organic semiconductors, in the form of polymers or monomers (also known as small molecules), as the electron donors and acceptors to build the photoactive layer. The active layer is sandwiched between the electron and hole transport layers and then two electrodes to form a working device. Upon illumination, photons are absorbed by the donor and acceptor materials in the active layer and they are transformed into charge carriers (electrons and holes), which will be collected by electrodes as photocurrent. The photoactive layer is the most important component in an OSC and it is usually constructed using the concept of bulk heterojunction (BHJ), which is a donor:acceptor (D:A) blend with a fully mixed, yet phase-separated morphology.5–7

For the solution-processed OSCs, the BHJ active layer is relatively easy to fabricate, it is cast into a film from a pre-prepared solution with donor and acceptor materials as solutes. However, solution-processing raises the challenge namely the drying dynamics and the solute–solvent interactions during drying strongly affect the conformation of organic semiconductors, as well as the final morphology of the blend.8–10 The conformational and morphological details in the blend can of course be well-examined by various ex situ methods after deposition, for example, atomic force microscopy (AFM)11,12 and transmission electron microscopy (TEM),13,14 and grazing incidence X-ray scattering-based techniques.15,16 Solvent evaporation, however, is a dynamic process that cannot be studied by ex situ methods, while the information that is contained in this process is of utmost importance to understand how different morphologies are formed, for example, phase separation pathways,17–19 relationship between phase separation and aggregation,20–23 aggregation sequence between donors and acceptors,24–28 possible formation of metastable phases,29 and interactions between solutes and solvents.30,31 Thus, characterizing the film formation dynamics and morphological evolution during the drying process, which is enabled by in situ spectroscopic and X-ray scattering measurements, not only provides valuable information on an in-depth understanding of the morphology formation mechanism, but could also serve as a guideline for constructing the relationship between deposition conditions and performance of solar cells.

In this review, we will start our discussion by giving a brief introduction of the BHJ structure, different film deposition methods, and film drying fundamentals in Section 1. In Section 2, we will present the basic working mechanism and implementation of spectroscopic- and X-ray-based characterization methods that are conducted in in situ mode during film formation. The role of in situ characteristics in studies that reveal the interplay between thermodynamic factors, including solubility, miscibility, and the dynamic factors, such as the rate of solvent evaporation and polymer aggregation, is discussed in Section 3, through a narrative from different material systems to common morphology optimization methods. Based on the reported in situ techniques and the current understanding of morphology control, the further development of in situ characteristics in the direction of probing the evolution of functional microstructure and morphology of semiconductors is proposed. We believe that this review could provide the community with a comprehensive view of what information one can extract and expect from the in situ measurements, which might contribute to the further optimization and upscaling of OSCs.

1.1 Working mechanism of bulk heterojunction

It is nearly impossible for OSCs to generate free charge carriers directly from photons. Instead, an excited electron–hole pair, also known as excitons, will be generated in both donor and acceptor phases. An exciton by itself cannot feed the photocurrent; only the free electron and hole that is split from exciton can complete this task. To split the exciton, the exciton has to diffuse to the D:A interface. According to the literature, the typical diffusion length of the exciton is around 10 to 20 nm.32–34 To guarantee efficient exciton dissociation, the area of D:A interfaces should be maximized and the size of the donor or acceptor phase should also be limited to a range of a few tens of nanometers. After exciton dissociation, the free electron (hole) will diffuse in the pure acceptor (donor) phase until it reaches the electron transport layer (hole transport layer), and is extracted by the cathode (anode) as current. This charge transport process within the active layer, however, favors fewer interfaces and large pure phases between charge-generation sites and electrodes. Thus the concept of BHJ morphology is proposed to balance the aforementioned dilemma.35 It is developed from the donor:acceptor bi-layer heterojunction, which consists of a thin layer of donor material atop another layer of the acceptor.36 Compared to the bi-layer structure, a BHJ has much more D:A interfacial area, which is beneficial for exciton dissociation and device performance. As a result, almost all of the record-breaking OSCs to date were constructed by using such a structure.37–40 The essential role of the sufficient D:A interface is due to the nature of the OSC materials. Excitons that are generated in typical polymer:fullerene systems usually have high binding energy (∼0.3 eV),41,42 meaning the thermal energy (0.025 eV at room temperature) is not sufficient to split these excitons. To do so, the charge transfer process, which can only happen at the D:A interface, kicks in and turns the tightly bound exciton into an intermediate charge transfer state and then into free charge carriers through further delocalization.32,43,44 Besides, the exciton lifetime is relatively short,45 which limits the exciton diffusion length. It means that only the exciton closely located to the D:A interface would have the chance to be involved in dissociation before relaxation.

In addition to a sufficient D:A interface, an interpenetrating network of donor and acceptor domains should also exist in the BHJ structure to enable free charge carrier transport to the electrodes. Meanwhile, many state-of-the-art BHJ solar cells also contain mixed domains in the active layer, which are also advantageous for the charge separation process.46,47 Thus, in general, the ideal BHJ should be a finely mixed, yet phase-separated network, consisting of a nanoscale blend of donor and acceptor phases for efficient exciton dissociation and percolated pathways for efficient charge carrier transport. Here it is worth mentioning that with the advancement of OSC studies, the definition of “ideal morphology” keeps evolving.48 Nevertheless, to form this intricate BHJ structure in a constant manner is not easy, since the morphological parameters like the length scale of the pure phases and the level of mixing all rely on the self-assembly of the solutes during solution casting. as the self-assembly behavior will be different in different material systems where different tendencies of mixing may exist between donors and acceptors, the level of phase separation would thus vary.30,49 Additionally, the solubility difference of donor and acceptor in the deposition solvent would affect their assembly behavior during solvent evaporation.50–52 Furthermore, the aggregation and ordering behaviors of solutes would also be affected by kinetic factors during deposition, such as the solvent evaporation rate and surface tension of the wet film.53–56 Therefore, the final morphology of the BHJ active layer is closely altered by film drying conditions during solution processing.

1.2 Fundamentals of the film drying process and film deposition methods

The drying of the active layer is an evolution from an initially homogeneous solution to a BHJ solid film on substrates. As the solvent evaporates, donor and acceptor molecules start to rearrange themselves and eventually form a partially phase-separated blend. The formation of BHJ films during the above process is rather complicated and cannot be interpreted using one simple mechanism. Based on the Flory–Huggins theory, which is by far the most popular theory to describe the solidification pathway in a solvent:donor:acceptor (S:D:A) ternary system,57–59 the free energy of mixing in this ternary system can be determined by the following equation:
 
image file: d2tc02185d-t1.tif(1)
where φi is the volume fraction of component i, χij is the Flory–Huggins interaction parameter between components i and j, and Ni is related to the degree of polymerization of component i. This equation can be transformed into a phase diagram as shown in Fig. 1a. Each side of the triangle represents the concentration of one of the components. The composition space in the diagram is divided into a stable one-phase region and an unstable two-phase region via the spinodal curve, which indicates the limit of local phase stability. During solvent evaporation, the concentration of the solvent decreases gradually, and this process, also referred to as solvent quenching, is represented by the dashed black line in the diagram.

image file: d2tc02185d-f1.tif
Fig. 1 Schematic phase diagram of (a) ternary mixture of donor, acceptor, and solvent. (b) A sketch that illustrates possible phase separation processes in a donor–acceptor–solvent system during solvent evaporation.

The possible routes of phase separation processes are illustrated in Fig. 1b. The liquid–liquid (L–L) or solid–liquid (S–L) phase separation is driven by solvent evaporation. L–L phase separation begins upon crossing from the one-phase to the two-phase region (spinodal curve in Fig. 1a), while S–L phase separation occurs when either the donor or acceptor component reaches its solubility limit. With different solvent–solute systems, these phase separation processes may occur simultaneously, or one may precede the other. If neither process occurs, the mixture will end up with an intimately mixed morphology, with a minimum level of phase separation.

In addition to the thermodynamic factors mentioned above, the film formation process is also influenced by kinetic factors. The different coating methods, which would introduce distinct mass transfer and flows in the evolving film, can thus lead to different morphological features even in the same BHJ system.60–62 In the following, we will briefly go through three deposition methods that are commonly used in the field of OSCs, namely, spin coating, blade coating, and slot-die coating (Fig. 2).


image file: d2tc02185d-f2.tif
Fig. 2 Sketches of (a) spin coating, (b) blade coating, and (c) slot-die coating process.

Spin coating has been a well-established deposition method in lab-scale research. The coating process is fast and fairly easy to reproduce on small and rigid substrates. The substrate is first fixed on a spinner, and the solution is dropped on the substrate which then starts to rotate. With the help of a centrifugal force, solutions can be spread on the top surface of substrates, and the substrate rotates continuously with the spinner until the film is dry. However, due to the outflow that is caused by the centrifugal force, a certain amount of dispersed liquid will be wasted at the initial stage of spin coating. Besides, the parameters of spin coating are highly interrelated. For example, a higher spinning rate results in a thinner film, but it also increases the speed of airflow above the wet film, which increases solvent evaporation rate as well. The interrelation makes it difficult to distinguish every individual parameter in the quality of the resulting film. Meanwhile, the drying of spin-coated films is different from the films produced by the industrial printing process, meaning that a solar cell that is optimized by spin coating in the lab might end up with different performance in large-scale production.

In contrast to spin coating, blade coating is a cost-efficient coating technique. It is also compatible with both rigid and flexible substrates of various sizes, which makes it an attractive technique for the scale-up of OSCs. As one of the meniscus-guided coating (MGC) techniques,63 the film is coated on the substrate during blade coating with the help of the forward meniscus under the moving blade. Due to the intrinsic directionality of the blade coating, this method may favor the formation of aligned molecular packing. There are two primary deposition regimes in blade coating, namely, the evaporative regime and the Landau–Levich regime.64 The coating speed is relatively low in the evaporative regime, matching the rate of solvent evaporation, and thus film coating and drying happen simultaneously. In the Landau–Levich regime, the coating speed is higher, the film coating and drying become two separate processes, and a thin layer of liquid is first dragged out by viscous force before solvent evaporation. In the evaporative regime, the film thickness decreases with the increased coating speed, and the thickness is very much related to the concentration of the inks, the distance between blade and substrate, and the evaporation rate of the solvent. In the Landau–Levich regime, the thickness increases with the increased coating speed, and it is mainly defined by surface tension and the viscosity of the inks, the surface energy of the substrates, and the geometry of the blade.

Apart from blade coating, there are also other MGC-based methods, such as slot-die coating. It involves a hollow die head that is moving relative to the substrate, the ink is pumped out through the head and held between the head and the substrate by capillary force then translates to a film with a certain speed. The continuous feed of ink during coating makes slot-die coating one of the most prominent MGC methods for industrial roll-to-roll application. In the meantime, compared to blade coating, slot-die deposition is further complicated by the flow rate of this input ink. The unstable flow and the mismatch between flow rate and coating speed would lead to defects such as ribbing and air bubbles in the final film.65 As a result, the quality of the resulting film in the slot-die coating is dependent on a range of factors, including but not limited to the viscosity and surface tension of the ink, ink flow rate, coating speed, and die head geometry.

2. In situ characterization methods

A variety of characterization methods has been introduced to study the microstructure morphology of BHJs. To date, most of the morphological studies were conducted ex situ, which is after the deposition process. These studies deepen our understanding to a great extent, from the basics of morphological structure–device performance relations to the development of different morphological optimization methods. They also point out the sensitivity of morphology to a wide range of variables, such as the chemical structure of materials,11,66 the choice of solvent,67–69 deposition conditions, and annealing processes.70,71 As we mentioned before, the final BHJ morphology is the result of a fine interplay between the donor, acceptor, and solvent during solvent evaporation. Therefore, any factors that can potentially alter this interplay would affect the final morphology, and that is the root cause of the delicacy and complexity of the BHJ morphology. Solvent evaporation is a dynamic process that cannot be studied by ex situ methods, thus in situ measurements are developed to gain insights into the microstructure evolution within the BHJ during film formation. But not all of the ex situ characterization methods can be converted into the in situ mode. To date, only certain techniques that are based on laser reflectometry/scattering, optical spectroscopy, and X-ray scattering are employed in real-time morphological studies.

2.1 Light reflectometry

As the most convenient tool to track solvent evaporation, light reflectometry was firstly introduced in the study of the polymer film thinning process by Heriot et al. in 2005.72 This technique is mainly used to calculate the change of thickness in a drying film as a function of time. As shown in Fig. 3, typical light or laser reflectometry data feature a series of constructive and destructive fringes, which come from the interference between the reflected light from the wet film/air and wet film/substrate interfaces. The condition for constructive interference is
 
2nd[thin space (1/6-em)]cos[thin space (1/6-em)]θ = (2)
where λ is the wavelength of the incident light, n is the refractive index of the wet film (at λ), d is its thickness, θ is the angle of incidence, and m is the order of the fringe. Based on this equation, the thickness change Δd between every two adjacent constructive peaks can be calculated by
 
image file: d2tc02185d-t2.tif(3)
If the refractive index and the final thickness of the film are known, the thickness–time relation can be reconstructed from the interference fringes of the drying film. Although laser reflectometry is easy to conduct, cautions need to be taken when using this method to evaluate film thinning: (1) in the calculation above, we assume that the refractive index is a constant during film drying, which might not be always true in real cases, where molecule crystallization and ordering happen and could potentially alter the optical constants of the study system.74 (2) In the final drying process, where the film will continue to thin but much more slowly, due to the slow evaporation of the residual solvent, correctly identifying the last few interference peaks in the reflectometry data becomes pretty challenging. These two factors might cause deviations in the calculated thickness–time relation to the real thickness thinning process.

image file: d2tc02185d-f3.tif
Fig. 3 A typical laser reflection signal (black), and corresponding thickness evolution (blue) with time from a drying film. Adapted with permission.73 Copyright 2013, Elsevier B.V.

2.2 Laser scattering

Apart from reflectometry, laser or light scattering from a drying film was also widely used to monitor the drying process, which was first implemented by van Franeker et al. in 2015.75,76 The intensity of the scattered signal is related to a series of factors, including the wavelength of the incident light, size of the particle, scattering angle, and refractive index of the components in the studied system. For the drying of the BHJ, during the solvent evaporation, at some point, the donor:acceptor blend will go through the liquid–liquid or solid–liquid phase separation. These phase separations cause a refractive index contrast between two phases, and thus the onset of phase separation can be detected by the onset of light scattering.75,76

If a contrast in the refractive index exists between the particles and the surroundings, scattering intensity is determined to a great extent by the size of the particles.9 Two theories account for the scattering phenomenon, which is the Mie theory for the particle size equal to or larger than λ, and the Rayleigh theory for the particle size smaller than λ/10.77 Considering the domain size of BHJ OSCs are usually located around a few tens of nanometers, their laser scattering should follow the Rayleigh theory, where the intensity of the scattered light increases with the increased domain size. Therefore, in addition to detecting the onset of phase separation, laser scattering could also provide information regarding the relative domain size in the resulting film.

2.3 Absorption and ellipsometry

The UV-vis absorption is extensively used for measuring optical properties, typically the absorbance and vibronic states of organic semiconductors.78–80 Conducting the UV-vis absorption in situ offers the possibility of monitoring polymeric or molecular aggregation during solution processing. The development of aggregates usually leads to the appearance of new features in absorption spectra, such as new vibronic peaks and band edge shifts. The best examples of in situ absorption studies are the film formation process of P3HT-based blends, thanks to the distinct absorption features during the disorder–order transition of P3HT chains. By analyzing the evolution of P3HT absorption spectra under different drying conditions, the onset of polymer aggregation,75,81 aggregation or solidification rate,82,83 and the level of polymer order and intra-chain coupling84,85 can be well-described. While the recently developed D–A co-polymers might not share the same feature with P3HT in terms of the sharp absorption contrast upon solidification, the change of absorbance during film formation still provides valuable information regarding the rate and sequence of polymer aggregation.25,86–88

The absorption spectra during solution processing are usually measured by collecting the transmittance signal through the studied film. The geometry of the setup, however, varies in different labs. As shown in Fig. 4, the beam can either shine perpendicular to the film,81,89 or at a certain incident angle,84,90 while the detector for transmittance can be placed on the other side of the film along the beamline,81,84,89 or on the same side of the incident beam, with a reflective layer at the bottom.75,91 Putting the incident beam and detector on different sides of the sample is a more standard way to measure absorption spectra, since it reduces the interference from the top/bottom interfaces of the sample (Fig. 4a); by tilting the incident light, the reflected signal (interference fringes) can be recorded on a separate detector, which allows the calculation of film thickness at the same time (Fig. 4b). However, putting them on the same side favors the easy integration with the commercialized spin-coater or blade-coater, with the risk of severe interference fringes that might appear on absorption spectra (Fig. 4c).


image file: d2tc02185d-f4.tif
Fig. 4 Cross-section views of typical geometries of in situ absorption setups (a to c), and a typical ellipsometry setup (d). The incident light (LI) went through the sample (pink), and the transmission light (LT) was collected by a detector (blue) and was converted as the absorption spectra. In figure c, a reflecting layer was inserted between the substrate and the sample as a mirror, to reflect the transmission light to the detector. In figure d, the polarization difference between the incident and reflected light can be analyzed by two polarizers (green).

Ellipsometry is a sensitive measurement that is regularly used for thin film characterization. It measures the changes in the phase and amplitude of polarized light that is reflected from the studied sample, and provides information including optical constants, thin film thickness, and compositional changes within the films. As shown in Fig. 4d, A typical ellipsometry setup contains a light source, a detector, and two polarizers which act as a polarization generator and analyzer, respectively. The raw data that are collected by ellipsometry are ellipsometric angles Ψ and Δ, and thus all the information that they can offer is from different fitting processes by theoretical modeling. For example, the film thickness can be fitted via the Cauchy model in the transparent region of the studied sample, while the refractive index n and the absorption coefficient k of the sample are usually fitted via a B-spline model.

The main purposes of conducting ellipsometry in the in situ mode are direct observation of the film thinning process by tracking thin thickness, and monitoring molecule aggregation by analyzing the evolution of absorption coefficient curves. Compared to light reflectometry, in situ ellipsometry is more sensitive and accurate for thickness tracking, whereas for monitoring the aggregation morphology of molecules, in situ ellipsometry and in situ absorption measurements contain similar information, due to the similarity of absorption coefficient curves and corresponding absorption spectra of a given molecule.

2.4 Photoluminescence

Based on the Franck–Condon principle, the photoluminescence (PL) spectrum also contains information about spectral shifts of vibronic peaks, which can be related to the aggregation of polymers as well. While absorption occurs on a timescale of less than 10−15 seconds, the relaxation process from the first excited state to the ground state is much slower (around 10−9 seconds).92 Therefore, compared to the absorption, the corresponding fluorescence provides more information on the interactions of the polymer with surrounding molecules or solvents. This information can be resolved by the changes in the PL intensity and its lifetime.

Fig. 5 shows the geometry of a typical PL setup. The detector that captures PL signals is placed perpendicular to the sample surface, and a laser light source is fixed above the sample surface, with an incident angle of about 45° to the normal. For a given polymer or small molecule solution, its PL intensity can either increase or decrease during solvent evaporation. The increase of PL intensity might come from the increased absorbance around excitation wavelength, or the so-called aggregation-induced emission enhancement.93 The decrease of PL intensity (PL quenching) during the film formation from single-component solutions, or binary blends containing donor and acceptor materials, is usually a result of a few mechanisms that occur at the same time. It includes aggregation-caused quenching and concentration-related quenching. The aggregation-caused quenching can be observed in many chromophores with planar and well-conjugated structures. They exhibit much weaker or quenched luminescence in their aggregated state than in dilute solution. On the other hand, concentration-related quenching can be explained by the Stern–Volmer theory,94 which classifies quenching into two categories, dynamic quenching and static quenching. Dynamic quenching is the result of diffusive encounters between fluorophores and quenchers, while static quenching is due to the formation of the non-radiative complex.


image file: d2tc02185d-f5.tif
Fig. 5 Cross-section views of a typical geometry of in situ PL setup. During the film formation, PL and laser light scattering (LS) signals are captured by the same detector, another detector can be added to record interference fringes.

If the oxidation or laser-induced degradation can be excluded, PL quenching during polymer or BHJ solution drying is dominated by aggregation and concentration quenching. Thus, the recorded PL signal is a direct indication of conformation changes and interactions of donor and acceptor materials. In 2015, Engmann and co-workers firstly reported the in situ PL studies of structure evolution in BHJ OSCs.90 Since then, in situ PL was implemented as a powerful complementary tool in a set number of studies of morphology formation during solution processing.49,81,95–98

Instead of steady-state PL, we recently explored the possibility of conducting in situ time-resolved photoluminescence (TRPL) in studies of BHJ formation.91 The change of photoluminescence quantum yield (PLQY) in the drying process can be measured by TRPL, and different quenching mechanisms during solvent evaporation were well distinguished and discussed separately, which is not possible in steady-state PL.

2.5 Grazing incidence X-ray scattering

The grazing incidence X-ray scattering-based technique has become one of the predominant methods for the characterization of thin film structures.15 There are two major branches that are extensively used in the studies of nanostructures in BHJ films, namely, grazing incidence wide-angle scattering and small-angle X-ray scattering (GIWAXS and GISAXS). The term “grazing incidence” means that a very shallow incident angle for the incoming X-ray beam is applied in both GIWAXS and GISAXS, which is due to the relatively low thickness of organic semiconductor films, and thus the shallow incident angle guarantees a significantly long path for the beam inside the studied film. Conducting these well-established techniques in real time has been demonstrated as an important way to get insights into nanostructure evolution during film formation.

GIWAXS is extensively used in morphological studies in OSCs. However, conducting GIWAXS in real time to study OSC materials during solution processing was firstly reported by Wang et al. in 2010.53 Since then, in situ GIWAXS has been demonstrated as a powerful technique to probe film formation processes by many research groups, such as Barrena and Schabel,54,99–101 Liu and Russel,20,31,60,102–105 Amassian,21,29,55,106–110 and others.19,22,111–114 GIWAXS usually requires a two-dimensional (2D) detector to record the complete scattering patterns. In some articles, GIWAXS is also reported as 2D grazing incidence X-ray diffraction (GIXD). Fig. 6a shows the geometry of a standard GIWAXS setup, and a closer detector makes it possible to access a large angular range. GIWAXS is commonly performed to probe the crystalline structure on the atomic length scale, including the molecular packing direction, crystalline lattice spacing, crystalline correlation length (CCL), and the relative crystallinity of the sample. Based on the orientation of the crystal planes in the sample (parallel and perpendicular to the substrate surface), Bragg peaks with different intensities would appear along the out-of-plane and in-plane direction directions, accordingly. As illustrated in Fig. 6b, the complete 2D pattern varies from a sharp ring to an arc-like or an ellipse-like peak, due to the different molecular orientations in the entire film.115 The 1D line cut profiles from the 2D pattern in the out-of-plane and in-plane directions are used to obtain the peak position and the peak width. Different peak positions indicate different types of stacking, the direction of π–π staking peak indicates the dominant orientation of crystallite, while the crystalline lattice spacing d and CCL can be deduced from the peak position and width.


image file: d2tc02185d-f6.tif
Fig. 6 (a) The geometry of GISAXS and GIWAXS setups. (b) Exemplary diagrams of GIWAXS diffraction patterns, from left to right: sharp ring, arc, and ellipse. Reprinted with permission,16 Copyright 2020, WILEY-VCH Verlag GmbH & Co. KGaA, Weinheim.

Compared to GIWAXS, in GISAXS measurements the distance between detector and sample stage is much larger, usually several meters. Thus, GISAXS provides morphological information on larger length scales, for example, the average domain sizes, and the structural length scale. This information can be extracted by the Guinier analysis by fitting the 1D line cut scattering signal within the Yoneda peak, which is the most prominent peak at qz ≈ 0 on the 2D scattering pattern. In addition to the quantitative analysis of domain sizes, the peak position and the peak width also help to qualitatively estimate the domain sizes.

In both GIWAXS and GISAXS studies, a strong scattering signal is the prerequisite for reliable data interpretation. In in situ GIWAXS studies, the change of intensity and position of the scattering peak from the studied materials is usually taken as the indicator of its crystallization kinetics during solidification, while in in situ GISAXS studies, Guinier plots with high signal-to-noise ratio also benefits the accurate domain size calculation. To ensure a strong scattering intensity in a short acquisition time (less than 1 s for every frame), a high-brightness synchrotron light source is required, which might limit the availability of in situ GIWAXS and GISAXS measurements. Caution needs to be exercised when conducting GIWAXS/GISAXS measurements; these methods only provide the structural information of the crystalline phases, thus, in situ GIWAXS/GISAXS should be combined with other real-time techniques to gain a more complete view of morphological evolution in the BHJ. Nevertheless, kinetically conducting GIWAXS/GISAXS provides a direct probe of the fine structure evolution processes taking place during the BHJ formation.

3. Factors governing morphological evolution

We here in this section start to give some show cases of applying the aforementioned in situ measurements in OSCs, revealing how morphological evolution is influenced by a series of factors, including the composition of solutes, the choice of solvents, deposition temperatures, and other deposition conditions.

3.1 Composition of solutes

3.1.1 Materials. Different organic semiconductors not only have different optical and electrochemical properties; their aggregation behaviors and interactions with adjacent molecules upon drying are also related to their chemical structures. In 2015, Kassar and co-workers systematically compared the structure formation of BHJ thin films formed from the donor polymer pBTTT with different fullerene derivative acceptors, including PC61BM, bisPC61BM, and AK114.30In situ GISAXS, GIWAXS, light reflectometry, and PL measurements were performed during film formation processes via blade coating. White light reflectometry was used to monitor the thickness decreases during solvent evaporation. From the temporal change of the lamellar spacing d100 of polymer crystallites, which was resolved from GIWAXS results, intercalation was observed for PC61BM and AK114 into the pBTTT matrix before or during polymer crystallization, while bisPC61BM was found not to intercalate due to its large size. They found that the intercalation speeds up the drying process, and results in stable morphologies in less than 1 min.

The same group then reported film drying kinetics of two different blends in early 2016, which are P3HT:PC61BM and DPP-TT-T:PC61BM, using a setup including white light reflectometry, laser light scattering, and PL.49 it is worth mentioning that this work is also one of the early reports of the usage of in situ PL on the drying of BHJ, almost published at the same time as Engmann's work.90 As shown in Fig. 7a, P3HT:PC61BM exhibited homogeneous drying in o-dichlorobenzene (o-DCB) solution, evidenced by the linear decay of the integrated PL intensity while the PL behavior of DPP-TT-T:PC61BM in o-xylene:mesitylene solution was different during drying (Fig. 7b). By studying the solubility of DPP-TT-T in o-xylene, the author suggested the fluctuation in the PL decay of DPP-TT-T:PC61BM came from the crystallization of the polymer when the concentration crossed its solubility limit, which indicated that DPP-TT-T underwent gelation in o-xylene.


image file: d2tc02185d-f7.tif
Fig. 7 PL intensity (black) and partial polymer concentration profile (red) during drying of (a) P3HT:PC61BM and (b) DPP-TT-T:PC61BM blends. Adapted with permission.49 Copyright 2016, Royal Society of Chemistry.

In 2016, another comparative study was conducted by Gu and co-workers, where the crystallization behavior of polymer donor P3HT and film thinning during the drying process were investigated by in situ GIWAXS and light reflectometry, respectively, when blended with fullerene- and polymer-based acceptors.22 Chlorobenzene (CB)-based inks were blade-coated on silicon substrates at 35 °C. As shown in Fig. 8a, from the GIWAXS result of pristine P3HT ink drying, four different drying stages can be identified, including dissolved state (stage I), nucleation and growth (stage II), solvent swollen glassy state (stage III), and glassy state (stage IV). When P3HT was blended with the fullerene acceptor PC61BM, the overall crystallization process of P3HT was quite similar to its pristine drying (Fig. 8b). When PNDIT was blended with P3HT, the all-polymer P3HT:PNDIT blend showed similar crystallization behavior during the early stages, while the solvent swollen state was not observed (Fig. 8c). The solvent swollen state was signaled by the plateauing of the peak intensity and the continuously increased peak position (decreased alkyl chain packing distance), while the missing of this stage indicates P3HT continues to crystallize even in the late stage of drying. By estimating the glass transition temperature (Tg) for the P3HT:PC61BM and P3HT:PNDIT blends, the author suggested that the polymer PNDIT significantly reduced the Tg of P3HT:PNDIT, resulting in relatively mobile P3HT chains that were still capable of further crystallization (Fig. 8d); thus a larger phase separation was formed in the all-polymer blend.


image file: d2tc02185d-f8.tif
Fig. 8 Evolution of film thickness (green), integrated peak intensity (red), and peak position (blue) of (100) diffraction peak of P3HT from (a) pristine P3HT solution, (b) P3HT[thin space (1/6-em)]:[thin space (1/6-em)]PC61BM 1[thin space (1/6-em)]:[thin space (1/6-em)]1 solution, (c) and P3HT[thin space (1/6-em)]:[thin space (1/6-em)]PNDIT 1[thin space (1/6-em)]:[thin space (1/6-em)]1 solution during film formation. (d) Schematic of the drying process for polymer:fullerene P3HT:PC61BM and all-polymer P3HT:PNDIT active layers. Adapted with permission.22 Copyright 2016, Wiley-VCH Verlag GmbH & Co. KGaA, Weinheim.

Apart from studying the morphology formation kinetics of D:A blend solution, the in situ setup is also useful for gaining a fundamental understanding of the self-assembly behavior of pristine molecules, for example, the relation between their chemical structure and aggregation behavior upon drying. In 2020, Wedler et al. investigated how the torsional flexibility of the central building blocks in two organic model compounds, namely CT and TT, impacts the formation of ordered structures during film formation.116 As shown in Fig. 9a, CT and TT have similar D–ADA–D type structures, the only difference between them is that TT has a more flexible central unit, compared to a planar unit than is found in CT. In situ absorption and PL measurements during spin coating revealed that the film formation took place in four similar stages for both compounds, but the time scales of aggregation were remarkably different. It took less than one second for the rigid CT, while it took minutes for the flexible TT (Fig. 9b and c). Thus, the CT molecules were kinetically frozen in the conformation when aggregation stopped, while a continuous transformation into ordered structures was observed in the case of TT. The author suggested that a certain amount of backbone flexibility is beneficial for establishing ordered structure upon drying, even though aggregate formation concurs with a planarization process.


image file: d2tc02185d-f9.tif
Fig. 9 (a) Chemical structures of CT and TT. The spectral position of absorption and PL peaks from (b) CT and (c) TT during film formation. Adapted with permission.116 Copyright 2020, American Chemical Society.
3.1.2 Donor:acceptor ratio in binary blends. The blend stoichiometry between donor and acceptor greatly influences the performance of BHJ solar cells as it not only affects the overall absorbance of the active layer, but also the crystalline order, phase separation, and phase purity within the resulting films. In 2011, the effect of the D[thin space (1/6-em)]:[thin space (1/6-em)]A ratio of polymer[thin space (1/6-em)]:[thin space (1/6-em)]fullerene blend on the microstructure evolution was first investigated by Sanyal and co-workers.100 The film formation processes of P3HT[thin space (1/6-em)]:[thin space (1/6-em)]PC61BM blends with ratios of 1[thin space (1/6-em)]:[thin space (1/6-em)]0.5, 1[thin space (1/6-em)]:[thin space (1/6-em)]0.8, and 1[thin space (1/6-em)]:[thin space (1/6-em)]2 were studied by in situ GIWAXS during blade coating. The intensity and shape of the (100) diffraction peak of P3HT were used to study the impact of the blend ratio on the layer formation. The crystallization process of P3HT can be estimated by quantifying the integrated intensity of the (100) peak, while the orientation distribution of crystallites can be estimated through the mosaic spread of the intensity. As shown in Fig. 10, the blends with three studied ratios showed similar intensity evolution as a function of drying time, whereas the mosaicity evolution of the blends with low PC61BM content (1[thin space (1/6-em)]:[thin space (1/6-em)]0.5 and 1[thin space (1/6-em)]:[thin space (1/6-em)]0.8) was remarkably different from that of the blend with high PC61BM content (1[thin space (1/6-em)]:[thin space (1/6-em)]2). The mosaicity remained low and constant during the drying process in the 1[thin space (1/6-em)]:[thin space (1/6-em)]2 blend, for the blend with 1[thin space (1/6-em)]:[thin space (1/6-em)]0.5 and 1[thin space (1/6-em)]:[thin space (1/6-em)]0.8 ratios, the mosaicity considerably increased to a maximum and was followed by a gradual decrease. The small mosaicity reflected a relatively small orientation distribution of P3HT crystallites relative to the substrate plane. Combined with ex situ morphological studies on the resulting dry films, the author suggested that an increased PC61BM content favors the development of regular edge-on P3HT crystallites during drying.
image file: d2tc02185d-f10.tif
Fig. 10 Evolution of (a) integrated intensity and (b) mosaicity of the (100) diffraction peak of P3HT in blends with different D:A ratios. Adapted with permission.100 Copyright 2011, American Chemical Society.

In 2013, Chou and co-workers extended the real-time studies of D:A ratios to the spin coating method for the first time, combining GISAXS with GIWAXS and light reflectometry.117 The widely used P3HT and PC61BM were chosen to form the binary system, with PC61BM content varying from 0 wt% to 100 wt% with a constant increment of 12.5 wt%. As usual, the P3HT lamellar crystallization was monitored by GIWAXS, and the film thickness was tracked by light reflectometry while the phase separation of PC61BM from P3HT was detected by GISAXS. Fig. 11a shows the crystallization kinetics, represented by the intensity of the (100) diffraction peak of P3HT in GIWAXS, and the phase separation kinetics, represented by the intensity of the PC61BM aggregation feature at low q-ranges in GISAXS, of P3HT:PC61BM with 37.5 wt% of PC61BM. The almost concurrent variations of GIWAXS and GISAXS intensities as a function of time indicate a strong interplay between crystallization and phase separation. The GIWAXS/GISAXS results of all the studied D:A ratios with the corresponding device performance are summarized in Fig. 11b. The film formation slowed down with increasing PC61BM content up to 50 wt% of PC61BM content, as the presence of PC61BM appears to hinder the crystallization of P3HT. Phase separation was more pronounced for the blends with a PC61BM content between 25 wt% and 37.5 wt%, corresponding to the highest as-casted power conversion efficiency (PCE). As PC61BM content increased to 50 wt% and above, the P3HT crystallization was initiated closer to the end of the drying process and appeared to be stunted as the film formation was about to stop, leading to the formation of a glassy solid solution.


image file: d2tc02185d-f11.tif
Fig. 11 (a) The plot of the normalized crystallization and aggregation peak intensities as a function of the spinning time during the spin coating of P3HT:PC61BM with 37.5 wt% of PC61BM (upper), and thickness evolution during the spin coating of pure CB and the corresponding P3HT:PC61BM ink. (b) Summary of the lamellar crystallization, mosaicity, phase separation, formation time (Δtformation, which was deduced from the corresponding peak intensity–drying time plot, see the light green inset in upper left figure) of blend films with different PC61BM contents, and PCEs of the corresponding devices. Adapted with permission.117 Copyright 2013, Wiley-VCH Verlag GmbH & Co. KGaA, Weinheim.
3.1.3 Ternary blends. Although the BHJ solar cells with one donor and one acceptor have set impressive performance records, this binary concept still suffers occasionally with the trade-off between high performance and thick active layers for more light harvest. On the other hand, ternary blend OSCs featuring multiple light-harvesting materials in one active layer have been developed as a promising strategy to further improve the performance of OSCs. In a typical ternary blend, a third component is selected to complement the absorption band of its binary host. In addition, rationally selecting the third component also helps to improve charge transport, and more importantly, the blend film morphology.118,119

Efforts have been made to understand and optimize the morphology formation of the ternary blends. In 2017, Baran et al. demonstrated high-efficient solar cells using a ternary approach where polymer donor P3HT was blended with a non-fullerene acceptor (NFA) IDTBR,120 and a second NFA was chosen as the second acceptor (A2).27In situ GIWAXS and UV-vis absorption during spin coating of P3HT:IDTBR:A2 from CB were conducted to probe the role of the A2 in the ternary blends. GIWAXS results suggest that P3HT crystallized at the very end of the solvent evaporation in all studied ternary blends, evidenced by the late increase of the P3HT(100) diffraction peak (Fig. 12a and b). The unperturbed P3HT crystallization can be understood by the fact that P3HT reaches supersaturation in solution and starts to crystallize earlier than all of the other components. This relatively early crystallization of P3HT was then evidenced by absorption measurements during spin coating, where the increase of the P3HT absorption peak around 605 nm was prior to that of the IDTBR peak, which is around 675 nm (Fig. 12c and d). With additional differential scanning calorimeter (DSC) and ex situ GIWAXS measurements, the author concluded that the optimal ternary blend in this study is composed of partially miscible three-phase microstructure, where an unperturbed P3HT phase hosts a molecular dispersion of IDFBR molecules, and an IDTBR-rich crystalline phase which also contains parts of IDFBR. Following analysis regarding charge transport and recombination in this optimized ternary blend suggests that the interface between P3HT and IDFBR in their mixed region act as an energetic barrier to charge recombination, which contributes to the enhanced open-circuit voltage (VOC) of the ternary device.


image file: d2tc02185d-f12.tif
Fig. 12 (a) The contour plot of integrated diffraction peaks during spin coating of a P3HT:IDTBR:IDFBR ternary solution. (b) The plot of integrated scattering intensity of P3HT(100) lamellar peak (solid lines) and solvent scattering (dashed lines) with the drying time of three ternary blends. (c) Selected absorption spectra of P3HT:IDTBR:IDFBR, which highlight P3HT and IDTBR aggregation processes during spin coating, and (d) corresponding absorbance changes of P3HT at 605 nm and IDTBR at 675 nm. Adapted with permission.27 Copyright 2017, Springer Nature Publishing AG.

In addition to P3HT, polymers with alternating donor and acceptor units (D–A) were also extensively used in both binary and ternary OSCs.121 Mao et al. studied the morphology formation process of a high-efficient ternary system based on a newly developed D–A co-polymer PBDB-T-2F (also known as PM6)37 blend with two NFAs, which are IT-4F and COi8DFIC via blade coating.28 The in situ ellipsometry is utilized to probe the molecular ordering sequences in the ternary system. During the solvent evaporation, the polarized beam was reflected by the sample and then reached the detector, where the phase and amplitude difference before and after the reflection can be detected, and the film thickness and optical information of the sample can be extracted, including reflective index n and absorption coefficient k. Fig. 13a–d show the absorption coefficient spectra evolution of PBDB-T-2F[thin space (1/6-em)]:[thin space (1/6-em)]IT-4F[thin space (1/6-em)]:[thin space (1/6-em)]Coi8DFIC during film formation with a blend ratio of 1[thin space (1/6-em)]:[thin space (1/6-em)]0.8[thin space (1/6-em)]:[thin space (1/6-em)]0.2. Four different molecular ordering stages were identified according to the red shifts of the absorption peaks. On the bases of the intrinsic absorption features of each component, the peaks of the ternary absorption spectra were assigned to the PBDB-T:IT-4F blend from 620 to 630 nm, IT-4F from 680 to 730 nm, and Coi8DFIC from 780 to 840 nm, respectively. The ordering of IT-4F was stated from stage II, evidenced by the red shift of its absorption peak, while the ordering of Coi8DFIC was missing until stage III, where the red shift can finally be observed. This delayed Coi8DFIC ordering indicates Coi8DFIC would mainly exist at the interface of PBDB-T-SF and IT-4F phases. This assumption was then confirmed by wetting coefficient analysis, and the resulting morphology led to a high PCE with a superior storage lifetime.


image file: d2tc02185d-f13.tif
Fig. 13 Evolution of absorption coefficient k during the film formation of PBDB-T-2F:IT-4F:Coi8DFIC in different stages (a–d). Adapted with permission.28 Copyright 2019, American Chemical Society.

In 2020, Zhong et al. extended the real-time morphological studies of the ternary all-polymer system during slot-die coating.31 Compared to other ternary systems, gaining insights into the ternary all-polymer blend morphology is particularly challenging, as polymer diffusion and aggregation occurred through complex chain folding and unfolding processes, which are more complicated than ternary blends with small molecules. To unravel how the third polymer critically impacts the ternary morphology, the author combined in situ GIWAXS with static morphological measurements and device performance analysis in SC3:PCE10:N2200 blends with different PCE10 contents as the second donor. The time evolution of scattering signals is shown in Fig. 14. The sharp (010) π–π stacking peak and (h00) (h = 1, 2, 3) laminar stacking peak were used to track the SC3 ordering in SC3-related blends. In SC3:N2200 blend the (010) and (100) peaks appeared simultaneously, and these peaks were kept in the dried film while in the SC3:PCE10 and SC3:PCE10:N2200 solution mixtures, the SC3 (h00) peaks disappeared by the end of the crystallization process, indicating that the high-order lamellar stacking of SC3 crystal nuclei was eliminated. The author suggested that this phenomenon was due to the compatibilization effect of PCE10, which mediates the repulsive force between the high-crystalline SC3 phase and the low-crystalline N2200 phase. As the result, a well-mixed morphology between PCE10 and N2200 was achieved, which is beneficial to charge transfer in the ternary blend. This work highlights the role of interplay between the crystalline regions and weakly/non-crystalline regions on the morphology of all-polymer BHJ, which can be tuned by introducing another polymer as a compatibilizer.


image file: d2tc02185d-f14.tif
Fig. 14 Evolution of GIWAXS out-of-plane sector profiles of SC3[thin space (1/6-em)]:[thin space (1/6-em)]N2200 (2[thin space (1/6-em)]:[thin space (1/6-em)]1), PCE10[thin space (1/6-em)]:[thin space (1/6-em)]N2200 (2[thin space (1/6-em)]:[thin space (1/6-em)]1), SC3[thin space (1/6-em)]:[thin space (1/6-em)]PCE10 (1[thin space (1/6-em)]:[thin space (1/6-em)]1), and SC3[thin space (1/6-em)]:[thin space (1/6-em)]PCE10[thin space (1/6-em)]:[thin space (1/6-em)]N2200 (1[thin space (1/6-em)]:[thin space (1/6-em)]1[thin space (1/6-em)]:[thin space (1/6-em)]1) blends during drying. Adapted with permission.31 Copyright 2020, Wiley-VCH Verlag GmbH & Co. KGaA, Weinheim.

3.2 The choice of solvents

3.2.1 Main solvents. The choice of main solvents used for BHJ deposition can significantly influence the morphology of the active layer and the resulting solar cell performance. Solvents with low boiling points tend to evaporate rapidly, which could “freeze” the molecules into thermal-nonequilibrium conformations in the dry film. Whereas the high boiling point solvents offer plenty of time for the reorganization of molecules, which in some cases leads to donor–acceptor demixing and gives a more phase-separated blend. Besides the drying kinetics, the quality of solvent regarding the solute (good or bad solvent) plays an equally important role in the final morphology of the blend. The aggregation/conformation of a given polymer can be influenced by its solubility in different solvents, which results in different morphological features in the dry film.

An early real-time study regarding the influence of different main solvents on the drying kinetics and device performance was conducted by Hernandez and co-workers in 2015.82 P3HT:PC61BM dissolved in solvents with different vapor pressures were blade-coated, and their film formation processes were monitored by continuously recorded absorption spectra. As shown in Fig. 15a, the change of maximum wavelength (λmax) (spectral red-shift) of the absorption band during film formation was plotted as a function of time, and the slope of the sigmoidal curves was calculated to be representative of evaporation rates. Results showed that the solidification rate decreases with the decreased vapor pressure of the solvent, and the device fabricated in the solvent with the lowest vapor pressure, which is a mixed solvent of o-DCB and chloroform (CF), achieved the highest PCE (Fig. 14b).


image file: d2tc02185d-f15.tif
Fig. 15 (a) Evolution of during the film formation of P3HT:PC61BM blade-coated in different solvents. (b) The plot of corresponding device performance with the vapor pressure of solvents. Adapted with permission.82 Copyright 2015, Elsevier B.V.

The solvent effect on the D–A co-polymer PTB7 was studied by Manley et al. in 2017.50 The microstructure evolution of pristine PTB7 during spin coating was probed by in situ GIWAXS. The evolution of the PTB7 lamellar (100) and π–π stacking (010) peaks were analyzed with simultaneous reflectometry data to monitor film thickness. A series of solvents with increased boiling points: CF (61 °C), CB (131 °C), and o-DCB (180 °C) were used to dissolve PTB7. Fig. 16 showed that the rate of the sharp film thinning processes decreased with the increased solvent boiling point, while the duration of aggregation processes for these films was likely independent of the solvents, since all three films showed rapid crystallization transitions around 3 seconds. The time onsets of the crystallization, however, are all concurrent with their sharp film thinning processes, indicating that crystallization kinetics was limited to the rapid solvent drying transition, which in turn was governed by boiling point. The author further studied the PTB7 film formation when 1 v% (volume percentage) solvent additives were added to the main solvent CB, and significantly longer crystallization processes were observed from minutes to hours. The author suggested that additive-dependent film formation rates highlighted the important role of specific additive–polymer interactions in the film formation process. In the follow-up work, the author further extended in situ GIWAXS analysis of the solvent and additive effects on various polymers and small molecules for OSCs,122 which provided a valuable reference and a detailed guide for the rational design of new materials.


image file: d2tc02185d-f16.tif
Fig. 16 (a) Evolution of in-plane (left) and out-of-plane (right) cuts of PTB7 crystalline domain in films deposited from CF, CB, and DCB. (b) The plot of normalized (100) lamellar peak intensity with drying time. (c) Plot of the peak position of the out-of-plane (010) peak with drying time. (d) Evolution of film thickness during spin coating. Adapted with permission.50 Copyright 2017, Wiley-VCH Verlag GmbH & Co. KGaA, Weinheim.

Most of the main solvents that are currently used for OSC fabrication are chlorinated, which are both toxic and energy intensive to synthesize. Thus, the use of green solvents with lower toxicity is preferable. Zhu and co-workers comparatively investigated the morphology–performance relation of the all-polymer PTzBI-Si:N2200 blends deposited in CB and 2-methyl tetrahydrofuran (MTHF), which is an environmentally friendly solvent.105 Surprisingly, solar cells that were fabricated in MTHF showed superior performance to that in CB. Ex situ morphological results showed that the as-cast blend in MTHF contains fine fibrous structures, while CB processed film showed large aggregations induced by crystallite agglomeration (Fig. 17a). To probe the formation of such a different morphology, in situ GIWAXS and GISAXS were concocted during the slot-die coating of the active layers. Both donor and acceptor polymer were of good crystalline order, as sharp (100) peaks in the in-plane direction and (010) peaks in the out-of-plane could be observed in pristine samples. As shown in Fig. 17b, the change of correlation length and crystallization process happened simultaneously during the drying from CB and MTHF solutions, but with different time durations. In CB processing, the wet film dried much more slowly than that in the MTHF solution. The author concluded that the longer sedimentation of polymers in CB afforded a longer time for agglomeration, leading to large-sized aggregations whereas the quick-drying in MTHF processing freezes the thin film kinetically, which can only induce long N2200 fibrils, leading to a more ideal morphology, with much weaker bimolecular recombination and enhanced hole mobility, resulting in improved device performance.


image file: d2tc02185d-f17.tif
Fig. 17 (a) the AFM height images of as-cast PTzBI-Si:N2200 blends in CB and MTHF. (b) Summary of GIWAXS ((100) and (010) peak intensity, crystalline lattice distance, and CCL) and GISAXS (correlation length) results of CB and MTHF inks during solidification. Adapted with permission.105 Copyright 2019, Wiley-VCH Verlag GmbH & Co. KGaA, Weinheim.
3.2.2 Co-solvents. The blend film which is coated with a single solvent sometimes results in a non-ideal morphology, which could reduce the device performance. Thus, additional methods to manipulate morphology are usually required. The use of solvent additives, in some cases referred to as co-solvents or mixed solvents,67 during solar cell fabrication has been proven as a convenient yet efficient strategy to obtain an ideal BHJ morphology in OSCs.123

The first real-time study that paid attention to the role of the solvent mixture was conducted by Schmidt-Hansberg in 2011.54 In addition to the mixed solvent, other processing conditions that can potentially influence film morphology were also studied by in situ GIWAXS during blade coating. Results showed that the addition of cyclohexanone as an “unfriendly solvent” for both P3HT and PC61BM to the main solvent CB induced partial P3HT aggregation in solution, evidenced by the broader orientation distribution of P3HT crystallites in the very early stage of film formation. The author suggested that this pre-aggregation enhanced the vertical charge transport along the polymer backbones and π–π stacking direction, which consequently led to more efficient solar cells. Since then, many real-time studies were conducted that were specific to probing the working mechanism behind various kinds of additives, such as o-DCB, 1,8-diiodooctane (DIO), 1,8-octanedithiol (ODT), 1-chloronapthalene (CN), diphenyl ether (DPE), etc.

o-DCB was usually used as the deposition solvent of active layers but owing to its high boiling point (179 °C), it was also used as the solvent additive, especially in diketopyrrolopyrrole (DPP)-based material systems. In 2012, the effect of o-DCB during the slot-die coating of pDPP:PC71BM was investigated by Liu and co-workers using in situ GIWAXS and GISAXS.102 The blend was dissolved in a mixed solvent of o-DCB[thin space (1/6-em)]:[thin space (1/6-em)]CF with 1[thin space (1/6-em)]:[thin space (1/6-em)]4 v/v. The high boiling point o-DCB was known as a good solvent for PC71BM and the low boiling point CF was a good solvent for both pDPP and PC71BM. The film thinning showed two sequential processes which came from a fast CF evaporation at the beginning, followed by the slow evaporation from the o-DCB rich solution. The crystallization of pDPP was only observed in the slow film thinning process, which indicates the morphology evolution mainly occurred during o-DCB evaporation. A four-stage morphological development was depicted after analyzing GIWASX and GISAXS data in detail. pDPP fibrils were first formed during the early stage of o-DCB evaporation, followed by the formation of pDPP crystalline networks when most of the CF was gone. The remaining pDPP further crystallized, accompanied by the segregation of PC71BM. Thus, a multi-length scale morphology was formed simply from the boiling point difference between the main solvent and additive, and the differences in the solubility of the components in these two solvents. In the follow-up work published in 2015, the same group further studied the drying process of DPPBT:PC71BM slot-died in CF with different amounts of o-DCB.20 As shown in Fig. 18a, in the drying of 5 v% o-DCB solvent mixture, DPPBT ordered rapidly as evidenced by its consciously increased (100) diffraction peak, accompanied by a rapid decrease of d spacing, indicating that DPPBT was highly swollen with solvent. As the concentration of o-DCB increased to 20 v% and 50 v%, the ordering of DPPBT still occurred in solution but for a longer time, and the extent of polymer swelling was less than that in 5 v% o-DCB. The d-spacing almost remain constant and then decreased rapidly. The author concluded that for the blend with low o-DCB content (5 v% in this case), the solubility limit of DPPBT is reached before the formation of domains, while for the blend with high o-DCB content (20 v% and 50 v%), the DPPBT already exhibits pre-aggregation in solution state. More importantly, combined with in situ GISAXS (Fig. 18b), where the kinetics of phase separation could be detected, they found that the phase separation occurred before polymer crystallization in the low o-DCB case, and for high o-DCB content, phase separation and crystallization occurred at the same time.


image file: d2tc02185d-f18.tif
Fig. 18 (a) In situ GIWAXS and (b) GISAXS scattering profiles of DPPBT:PC71BM drying process from CF with 5 v%, 20 v%, and 5 v% o-DCB. Adapted with permission.20 Copyright 2015, WILEY-VCH Verlag GmbH & Co. KGaA, Weinheim.

A similar correlation between the volume fraction of o-DCB and the sequence between phase separation and polymer aggregation was later observed by van Franeker et al. in 2016, and Pelse et al. in 2020. Instead of using X-ray-related real-time measurements, van Franeker et al. conducted in situ laser scattering for the detection of liquid–liquid phase separation, and in situ absorption for the onset of polymer aggregation.75 By analyzing the PDPP5T:PC71BM film formation process during spin coating from CF with different o-DCB volume ratios, the author found that for the blend without o-DCB or with less than 2% o-DCB, the onset of liquid–liquid phase separation happened before polymer aggression, while for o-DCB volume concentration larger than 2%, phase separation occurred concurrently with aggregation (Fig. 19). Pelse et al. also observed the use of o-DCB might move the drying mechanism away from the liquid–liquid pathway to the solid–liquid mechanism which was driven by polymer aggregation.18


image file: d2tc02185d-f19.tif
Fig. 19 Schematic phase diagram revealing the relationship between the initial co-solvent content and the sequence of phase separation and polymer aggregation. o-DCB volume concentration larger than 2% prevented large-scale liquid–liquid phase separation. Adapted with permission.75 Copyright 2015, Springer Nature Publishing AG.

DIO is one of the widely used solvent additives in the OSC community, and as the result, there are quite a lot of real-time studies that probe the working mechanism of DIO in different material systems, including small molecule:fullerene,21,29,107,124 polymer:fullerene,23,95,125,126 polymer:NFA,104,113 and all-polymer blends.60,127

The role of DIO in the drying of small molecule blends was firstly investigated by Perez and co-workers in 2013.29 By conducting in situ GIWAXS during spin coating p-DTS(FBTTh2)2:PC71BM in CB without or with 0.4 v%, the formation of a metastable intermediate phase of p-DTS(FBTTh2)2 in the initial drying process was observed when DIO was present (Fig. 20), this metastable phase was then gradually transformed to the final structure, which showed a narrower peak width and higher intensity compared to that in the dried film without DIO. The author pointed out that the promoted crystallization of p-DTS(FBTTh2)2 seems like a common feature seen in polymer:PCBM blends, which were attributed to the high boiling point of DIO allowing more time for polymer ordering, but in this work, the observation of rapid metastable polymorph during film formation indicates the different working mechanisms exist for DIO in different material systems, although the outcome might be similar. In 2015, Engmann et al. investigated the influence of different volume ratios of DIO on the structure evolution of the same small molecule:fullerene system.124 The formation of metastable polymorph was also observed in blends with DIO. They found that at a small DIO amount (0.3 v%), the additive promoted crystallinity by plasticization of the nearly dry film, allowing molecule ordering over extended times. For blends with larger DIO concentration (0.6 v% and above), the characteristic length scale of the phase separation as shown by in situ GISAXS increased a lot. The author attributed this to the suppression of nucleation, which led to larger crystal sizes for increased additive concentration.


image file: d2tc02185d-f20.tif
Fig. 20 Evolution of GIWAXS signal during film formation of (a) p-DTS(FBTTh2)2:PC71BM without DIO, which showed a rapid film formation, and (b) with 0.4 v% DIO, where a metastable polymorph was initially formed and gradually transformed to a different structure. Adapted with permission.29 Copyright 2013, Wiley-VCH Verlag GmbH & Co. KGaA, Weinheim.

The real-time studies regarding DIO in polymer:fullerene blends started in 2016,95 when Güldal et al. investigated film formation of DPP-TT-T:PC61BM with DIO by using the multi-probe setup reported in their earlier work.49 The DIO was found as a good solvent for both polymer DPP-TT-T and fullerene PC61BM. As the result, the aggregation of PC61BM, as well as the gelation of DPP-TT-T in the host solvent were both reduced as the increased DIO concentration, which was evidenced by reduced laser scattering increases, and smoother PL quenching profiles of blends with DIO upon drying (Fig. 21). The role of DIO on a BDT-based co-polymer system PBDTTT-C-T:PC71BM was studied by Bokel et al. in 2017.126Ex situ morphological characterizations showed that DIO broadens the distribution of domain sizes through introduction of smaller length domains and increases the phase purity, but unlike the small molecule cases above, the presence of DIO did not significantly affect the orientation or crystallinity of the polymer. Real-time GISAXS results suggested that in the case of PBDTTT-C-T, the role of DIO is to enable near-equilibrium liquid–solid phase separation, resulting in the morphology with small and pure domains, while the absence of DIO resulted in rapid solvent evaporation, which pushed the phase separation towards a more liquid–liquid-like pathway. This observation is quite similar to what van Franeker et al. and Pelse et al. observed in the cases of using o-DCB as the additive.18,75 In the case of the all-polymer blend PTzBI:N2200, which was investigated by Zhong et al. in 2019,60 the presence of DIO was found to delay the emergence of polymer crystals, and a more increased CCL was observed for the blend with DIO upon drying, indicated that DIO promotes better crystal packing, which is different from Bokel's case, where the polymer ordering was not affected by the presence of DIO. However, the intensity of (100) diffraction peak was much lower in the wet film with DIO in comparison with that in DIO free film; the author argued that this was more likely due to the much stronger X-ray absorption of DIO compared to that of the polymers. In a recent study based on the PM6:IT-4F, Zhan et al. studied the role of DIO on the crystallization kinetics of PM6:IT-4F by conducting in situ GIWAXS measurements (Fig. 22).104 The ex situ GIWAXS indicated an approximate 1.5 times enhancement of PM6 crystallization with DIO. The in situ GIWAXS results showed a delayed polymer crystallization and a prolonged film formation, which is a common feature seen in many BHJ blends with additives. By analyzing the crystallization process of PM6 using the isothermal Johnson–Mehl–Avrami–Kolmogorov fitting, the author suggested that the addition of DIO increased the nucleation rate during the nucleation and growth stage, and the secondary crystallization process which induced by DIO provides opportunities for nuclei to crystallize into fibers to form a tie chain to build up a network structure. Thanks to the improved morphology, solar cells with 0.3% DIO achieved more efficient exciton separation and reduced recombination, contributing to a higher short-circuit current density (JSC).


image file: d2tc02185d-f21.tif
Fig. 21 Evolution of DPP-TT-T:PC61BM drying was measured by (a and b) laser scattering and (c and d) PL. Figure (b) and (c) are laser scattering and PL evolutions that are plotted over a longer time. Adapted with permission.95 Copyright 2016, Royal Society of Chemistry.

image file: d2tc02185d-f22.tif
Fig. 22 Evolution of GIWAXS results of (a) DIO-free sample and (b) sample with 0.3 v% DIO. Peak intensity, distance, crystal coherence length, and solvent peak intensity were estimated by fitting (100) diffraction peaks in the in-plane direction and CB peaks. (c) Avrami fitting and (d) relative crystal quantity as a function of time. Adapted with permission.104 Copyright 2021, American Chemical Society.

The role of additive ODT and CN was comparatively studied by Richter's group by using a series of in situ measurements, including ellipsometry, UV-vis absorption, GIWAXS, GISAXS, and PL.84,90,108 In the case of P3HT:PC61BM, ODT acted as the bad solvent for P3HT while CN acted as the good solvent. By comparing evolution with thickness and absorption, which indicated the onset of polymer aggregation, the earlier onset of aggregation was observed in both additives.84 The difference does exist in the drying processes of blends containing CN and OTD, as the good solvent CN could maintain partial P3HT solvation while ODT cannot, resulting in a slow and continuous evolution of polymer structure, but this prolonged polymer swelling did not improve the final order of the film with CN. The author suggested that regardless of whether the additive is a good or bad solvent of P3HT, they all promote earlier phase separation by degrading the solvent quality. In 2014, they extended the real-time study of the influence of CN and ODT in the P3HT:PC61BM system by conducting in situ GIWAXS and GISAXS.108 Both additives significantly increased the total crystalline fraction in blend films. By comparing the evolution of the (100) peak width (Fig. 23a), which is inversely related to the characteristic grain size, from the drying of pristine P3HT solution, additive-free BHJ solution, BHJ solution with CN, and BHJ solution with ODT, they found that both additives restored the bulk crystallization that is inhibited by PC61BM. Interestingly, when comparing the GIWAXS evolution with the absorption change during the drying of BHJ with ODT and CN, an uncorrelated diffraction order and optical order were observed in the case of ODT, where the evolution of the absorption spectra ends abruptly while there is extensive continuing growth in the GIWAXS pattern (Fig. 23b). The author suggested that the optical order and crystalline diffraction probed the different aspects of the system: optically measured aggregation related to the local order, whereas crystalline diffraction related to the lamellar order. This conclusion was further confirmed by another work from the same group.126In situ GISAXS results suggested that the film with CN was mainly developed from two phases: a crystalline P3HT and a mixed amorphous phase, while the BHJ development with ODT was more complex, as a three-phase model, which was composed of a crystalline P3HT, a mixed amorphous P3HT and PC61BM, and a mixed ODT and PC61BM phase, was needed to describe the GISAXS evolution (Fig. 23c and d).


image file: d2tc02185d-f23.tif
Fig. 23 (a) Evolution of the full width at half maximum (FWHM) of (100) diffraction peaks during the drying of different samples. (b) Comparison of time evolution of GIWAXS signals and absorption spectra. Time evolution of the total scattering invariant (TSI), which is deduced from in situ GISAXS, during the drying of BHJs with (c) CN and (d) ODT as the additive. Adapted with permission.108 Copyright 2015, Wiley-VCH Verlag GmbH & Co. KGaA, Weinheim.

Based on the understanding of CN and ODT on the film formation of P3HT:PC61BM, in 2017, the same systems were used as models to demonstrate the real-time PL studies of structure evolution in OSCs,90 which is among the first real-time PL study of this kind. By using a quenching sphere model to fit the integrated PL intensity evolution during P3HT:PC61BM drying, the onset of gelation prior to polymer aggregation was detected. By extending the fitting to the blends with CN and ODT as additives, the ratio between characteristic domain size and exciton diffusion length during solidification was estimated, and the calculated domain sizes in the resulting films are in good agreement with other morphological results.

In addition to a single solvent additive, the film formation process involving binary additives was also investigated by several groups. In 2015, McDowell and co-workers examined film formation of p-DTS(FBTTh2)2:PC71BM spin-coated from CB with 0.4% volume fraction of DIO and 2.5% weight fraction of polystyrene (PS).21In situ GIWAXS results showed that PS favored formation of p-DTS(FBTTh2)2 crystallites in the early stage of spin coating, and extended CB evaporation time, but the extended evaporation was not sufficient to achieve optimal morphology. The existence of DIO further extended film formation time, and allowed crystalline rearrangement of the donor phase, which led to optimal phase separation and improved performance. Similar structural evolution behavior induced by binary additives was also observed by Chen et al., who used a combination of ODT and DIO as the binary additive to optimize the OSC performance of a polymer:NFA system based on FTAZ:ITIC-Th.113 According to their in situ GIWAXS results, ODT was found to control nucleation of the crystal at the beginning stage of film formation, while DIO worked on the entire film-forming process to control crystal growth.

3.3 Deposition temperature

Changing deposition temperature is also a useful strategy to optimize BHJ morphologies. This method is most relevant to polymers and small molecules that display strong temperature-dependent aggregation (TDA) behavior, such as PffBT4T, PBDB-T, PM6, Y6, and their derivatives.38,86,121,128,129 By controlling the temperature of solutions and substrates, the ordering of polymer could be manipulated to achieve optimal nanostructure in the BHJ. Besides, temperature also influences the viscosity of processing inks, which in turn determines how mobile polymer chains are in solution, and eventually influences the blend morphology.

The first real-time study regarding the film formation kinetics under different temperatures was conducted by Schmidt-Hansberg and co-workers in 2009.130 The blend film of P3HT:PC61BM in o-DCB was blade-coated under the temperature of 15, 25, and 40 °C. Different drying processes were recorded by white light reflectometry. Combined with AFM images, a systematic dependency of P3HT:PC61BM film morphology on the drying process related to the drying time and temperature was observed. Lower temperature resulted in a longer drying time and probably a lower solubility of organic semiconductors, which caused bigger domains in the dry blends. In 2011, the same group further probed the temperature-related film formation of P3HT:PC61BM by using in situ GIWAXS.99 The time evolution of P3HT(100) diffraction peak indicated that a lower temperature induced a slower crystallization, a reduced (100) crystallinity (Fig. 24a), and a larger fraction of misaligned crystallites (Fig. 24b). The author emphasized that the “crystallinity” that was deduced from (100) diffraction peak could only represent the lamellar order of the polymer along the out-of-plane direction, rather than the quality of π–π stacking, which is more relevant to the device performance. Ex situ GIWAXS along the in-plane direction showed that the crystallinity and ordering of the π–π stacking increase significantly with lower drying temperature, evidenced by the increased intensity of the P3HT(020) peak with the decreased processing temperature (Fig. 24c). Thus, the author concluded that the P3HT:PC61BM drying at a lower temperature led to a good π–π assembly and a broader orientational distribution of P3HT.


image file: d2tc02185d-f24.tif
Fig. 24 Evolution of (a) the integrated intensity of the P3HT(100) diffraction peak and (b) mosaicity of P3HT, which was deduced from the (100) peak width, during blade coating of P3HT:PC61BM at different substrate temperatures. (c) Ex situ GIWAXS data along the in-plane direction of the dry films coated at different temperatures. Adapted with permission.99 Copyright 2011, Wiley-VCH Verlag GmbH & Co. KGaA, Weinheim.

The temperature-related ordering behavior of P3HT during solidification was further studied by other in situ measurements including absorption and PL. In 2014, Abdelsamie and co-workers firstly demonstrated in situ UV-vis absorption measurements during spin coating of organic semiconductors.89 In their work, they found that spin-coated well-dissolved P3HT solution (65 °C) resulted in rapid film formation, with a series of featureless absorption spectra, while spin-coated pre-aggregated P3HT solution (25 °C) resulted in absorption spectra with distinct vibronic peaks, and AFM results showed that the formation of P3HT fibrils can only be achieved in films cast from solution in room temperature. In the real-time absorption study conducted by Reichenberger et al.,85 they found that spin coating at a temperature below the characteristic temperature Tc could enhance the formation of aggregates with strong intra-chain coupling. Spectra evolution indicated that the formation of nuclei in the initial stages for substrate temperatures below Tc could responsible for this enhancement. In 2018, Buchhorn and co-workers developed a setup that allowed quasi-simultaneous detection of absorption and PL during the spin coating process.81 Evolution of the absorption and emission spectra and the relative PLQY during the drying process of P3HT at different temperatures, were analyzed by this setup (Fig. 25). The amount of PL redshift between the start of spin coating and the onset of P3HT aggregation was found to be lower for higher processing temperature, along with that the PLQY values prior to the P3HT aggregation were decreased with the increased processing temperature. The author suggested that this might indicate an increased conjugation length of P3HT in wet film at a lower temperature.


image file: d2tc02185d-f25.tif
Fig. 25 Evolution of (a) normalized PL (top) and absorption (bottom) spectra of P3HT spin-coated from CB at different temperatures. (b) Evolution of optical density (OD) of the absorption band from aggregated P3HT, peak position of emission maxima, and PLQY during film formation at different temperatures. Adapted with permission.81 Copyright 2018, American Chemical Society.

In addition to P3HT, the temperature effect on film formation of another polymer PffBT4T-2OD was particularly studied, as it exhibited a distinct TDA behavior. In 2016, Ro and co-workers studied the kinetics of blade-coated film structure evolution of PffBT4T-2OD:PC71BM with additive DIO at the optimal temperature (90 °C) and a temperature (55 °C) just below the aggregation threshold.131Ex situ GIWAXS showed that the film coated at 90 °C favored the edge-on orientation, while film coated at 55 °C favored the face-on orientation. In in situ GIWAXS, the crystal development of PffBT4T-2OD was observed in early drying at 55 °C, while in the case of 90 °C, significant diffraction only happened in the late drying stage. Thus, the author attributed the temperature-dependent orientation in the blade-coated films to the comprehensive film drying nucleated at the air/film interface in the 90 °C drying, and the pre-formed solution aggregate deposition in the case of 55 °C. Bi et al. examined the kinetics of crystallization of blade-coated PffBT4T-2OD at different processing conditions.112 Polymer film formations at 80, 100, and 110 °C were studied by in situ GIWAXS (Fig. 26). In addition to the faster polymer aggregation at a higher temperature, the FWHM values of the (100) diffraction peak in the film stage (end of solvent evaporation) indicated an increased CCL with processing temperature. The relative nucleation quantity, which was estimated from FWHM and peak intensity, decreased with the increased temperature, indicating a higher number of polymer nuclei at a relatively low temperature. The author emphasized that massive nucleation of the polymer would result in limited crystal growth, which can greatly influence the final film crystalline morphology.


image file: d2tc02185d-f26.tif
Fig. 26 Evolution of (a) circularly integrated line curves and (b) corresponding 2D plots of the crystalline domain evolution for PffBT4T-2OD blade-coated in o-DCB at different temperatures. (c) Evolution of the (100) diffraction peak locations, FWHMs, and intensities. Adapted with permission.112 Copyright 2018, American Chemical Society.

3.4 Other deposition conditions

From the discussions above we showed how film formation processes and final morphologies could be influenced by solvents and temperatures. In this section we will discuss other deposition conditions that could also alter the film-forming kinetics. In 2013, Bergqvist et al. studied lateral solvent evaporation rates during spin coating and blade coating by conducting white light reflectometry in real time.73 TQ1:PC61BM in o-DCB was used as the deposition ink. By mapping variations in the average frequency of the interference fringes, the author found that for spin coating, the center area had a relatively constant but lower solvent evaporation rate and then increased towards the edges (Fig. 27a), resulting in a non-constant thickness over the entire film. This is in accordance with intuition as the speed of airflow during spinning is larger on the edges than that in the center area. In the case of blade coating, an extra air flow perpendicular to the coating direction was introduced (Fig. 27b), and an increased evaporation rate was observed in the lower part of the sample. A similar observation was done by Chou and co-workers in TIPS-pentacene solution during spin coating, where the rate of solvent evaporation increased with the spinning speed (Fig. 28a).55 More importantly, two crystallization processes (a fast crystallization process at the first and then followed by a slow crystallization) were identified by in situ GIWAXS. As shown in Fig. 28b and c, the onset of the fast crystallization was delayed, and the duration of the slow crystallization was prolonged with the decreased spinning speed, while the duration of the fast crystallization showed less relevance. The delayed crystallization could be understood as less solvent was spin-out from the substrate at the very beginning of the low-speed spinning, and the reduced solvent evaporation rate was responsible for the extended second crystallization. Combined with steady-state GIWAXS and microscopical results, the author concluded that the slowing down of the second crystallization kinetics at a low spinning speed allowed pentacene to form larger crystalline domains, while the high spinning speed resulted in higher nucleation density and much smaller domains.
image file: d2tc02185d-f27.tif
Fig. 27 Variation in the average frequency of the interference fringes during (a) spin coating and (b) blade coating processes. The bottom plots are the line-cuts along the red lines in the upper images. Adapted with permission.73 Copyright 2013, Elsevier B.V.

image file: d2tc02185d-f28.tif
Fig. 28 (a) Wet film thickness after 1 second of spin coating and the rate of solvent evaporation as the function of spinning speed. (b) Evolution of the normalized (001) peak intensity as a function of time during spin coating at 1000 and 2000 rpm. (c) The duration of different processes during film formation at different spinning speeds. Adapted with permission.55 Copyright 2014, Royal Society of Chemistry.

In addition to manipulating the rate of evaporation by the spinning speed, concurrently changed deposition temperatures, solvents, and the concentration of inks could also fine-tune film drying kinetics and morphologies, as demonstrated by Zhao et al. and Zhao et al., respectively. In the work published in 2016, device performances and morphologies of PTB7:PC71BM-based devices fabricated by spin coating and blade coating were systematically compared by Zhao and co-workers.56 They found that the solvent drying rate in blade coating is usually slower than spin coating when inks were deposited with the same solute concentration. By doubling the solute concentration and raising the base temperature of the blade-coater, the film thinning occurred more rapidly, and an almost identical morphology as well as device performance was achieved in the blade-coated devices, compared to the spin-coated counterparts with champion PCEs. In 2020, Zhao and co-workers investigated the film formation kinetics of PM6:Y6 during slot-die coating with elevated temperatures and different solvents.86 Similar to PffBT4T-2OD, the PM6 polymer also has distinct TDA feature, and thus it is not surprising that PM6:Y6 coated by hot slot-die exhibited a higher degree of crystallinity and smaller phase separation compared to that blend coated at room temperature, while the optimal coating temperatures varied when processing solvents were changed. By analyzing the change of absorbance of PM6 during drying from the in situ absorption, as shown in Fig. 29a and b, the duration of film drying and PM6 aggregation under different temperature/solvent combinations were extracted. Results showed that the optimal temperature/solvent combinations always led to the same drying and polymer aggregation kinetics, and eventually, similar morphologies in corresponding blends (Fig. 29c).


image file: d2tc02185d-f29.tif
Fig. 29 (a) Evolution of absorption spectra during slot-die at optimal temperature/solvent combinations. (b) Absorbance change of PM6 during PM6:Y6 blend film formation (top figure), film drying time (middle) and PM6 aggregation time (bottom) at different conditions, and (c) corresponding TEM images of the blends at optimal conditions. Adapted with permission.86 Copyright 2020, Wiley-VCH Verlag GmbH & Co. KGaA, Weinheim.

With the rapid development of OSC, real-time film-forming studies are applied beyond the aforementioned processing conditions and deposition methods. For example, in 2018 Guo and co-workers studied the film formation process of P3HT:PC61BM in a brush-coating process. The changes of triphase contact lines during coating at different speeds were continuously recorded by a camera, and the shape of this contact line was found to be related to the crystal sizes and polymer orientations within the blend films.132 Guan et al. reported the vacuum-assisted drying in the PHT4:IT-4Cl blend. As indicated by in situ reflectometry, the drying process was accelerated in a vacuum, resulting in a film with smoother topography.133 In 2021, Yuan and co-workers introduced a carefully designed blade with micro-cylinder arrays, and the morphologies and device performances of PM6:Y6 blends deposited via patterned blade coating (PBC) and normal blade coating (NBC) were compared at different coating speeds.87 The device fabricated by PBC at low speed achieved the highest PCE, which was attributed to the improved crystallinity of PM6 and Y6, more compact molecular stacking, appropriate domain size, and higher domain purity. The crystallization kinetics of PM6 and Y6 during PBC and NBC were then compared by in situ absorption (Fig. 30). The 0–0 peak of Y6 in PCB low-speed (PCB-LS) coating showed the most rapid red-shift, indicated PCB at lower speed enabled rapid crystallization of Y6, and an elongated aggregation process was observed after this fast spectral red-shift in both low-speed coating, which could be seen as a sign of its sufficient crystallization process. Moreover, the most pronounced red-shift of PM6 and Y6 under PBC-LS conditions indicated crystallinity enhancement of blend films, which was well in accordance with their GIWAXS results.


image file: d2tc02185d-f30.tif
Fig. 30 (a) Evolution of absorption spectra during different coating conditions, and (b) the corresponding plots of spectral position and normalized absorbance of PM6 and Y6 absorption peaks. Adapted with permission.87 Copyright 2021, WILEY-VCH Verlag GmbH & Co. KGaA, Weinheim.

4. Summary of the in situ techniques to date

GIWAXS and GISAXS have been demonstrated particularly useful in a lot of real-time morphological studies. Thanks to the grazing incidence geometry and the strong synchrotron radiation, GIWAXS could access the crystal structure on the atomic length scale, which is indispensable for analyzing crystalline evolution in organic semiconductors. This advantage of GIWAXS, however, also brings the limitation of this technique. Apart from the limited availability of synchrotron light source, GIWAXS could only provide information on the crystalline phase, the representative of GIWAXS results from the low-crystallinity organic semiconductor could be limited. Caution should be exercised when analyzing the crystallinity evolution upon film formation by tracking the integrated (100) diffraction peak intensity, which seems a common interpretation in many in situ studies. As discussed by Sanyal et al.,99 the (100) crystallinity could be less relevant to the quality of nanomorphology from the performance point of view, since the (010) π–π stacking is sometimes more related to, for example, the charge transport properties. GISAXS was specifically used to probe the nanoscale phase separation in the blend film, and thus many real-time investigations using GIWAXS simultaneously address both small (ordering of crystalline phase) and large length scale regime (phase separation) with additional GISAXS measurement. GISAXS requires scattering contrast between components, which is almost universally existed in BHJ blends with more than two different materials, while the contrast between the amorphous phase and the crystalline phase in the same materials is usually not enough for GISAXS measurements, which limits its application in the real-time study on the drying of pristine films.

In situ absorption (and ellipsometry) measurements were also extensively used to probe the aggregation and ordering of organic semiconductors during both pristine and BHJ film formation, by tracking the evolution (both spectra position and absorbance) of corresponding vibronic peaks. Compared to GIWAXS, the setup of absorption measurement is simpler and more versatile, and it is not limited by crystalline samples whereas some studies found that the formation of optical order, which is deduced from absorption spectra, and the diffraction order, which is derived from GIWAXS, are not always correlated, indicates these two measurements reflect different aspects of order in the studied system.

Similar to absorption, in situ PL measurement is fairly easy to conduct, due to the simplicity of the setup. A lot of information can be extracted from the temporal evolution of PL spectra during film formation. In addition to changes in the polymer conformation during solvent evaporation, in situ PL is particularly useful to probe the level of interactions of donor–acceptor and solute–solvent in the meantime. The pioneering work of Engmann et al. showed the potential of the in situ PL measurement, where they quantitatively revealed the average fluorophore–quencher distance by fitting the PL quenching profile during BHJ formation. But unfortunately, this is also the only work to date that analyzes the PL evolution of BHJ formation in such detail. Part of the reason could be the challenge of the accurate interpretation of PL data, since the reduction of PL intensity is due to a variety of molecular interactions, including molecular rearrangement, energy transfer, collisional quenching, or the formation of non-radiative complex. Thus, it is important to distinguish these PL quenching pathways in the studied system. From this point of view, conducting TRPL in real time could be informative, as we have shown that it is capable of differentiating static quenching and dynamic quenching mechanisms, which could provide valuable hints regarding different interactions that are happening during BHJ formation. In addition to probing quenching mechanisms, the evolution of PLQY can be calculated by TRPL as well, and we have also demonstrated that the amount of PLQY decrease during solidification could be correlated to the device's voltage loss. This assumption correlates well with recent publications that highlight the role of highly luminescent low-bandgap materials in decreasing voltage loss and enhancing PCE of OSCs.134,135

5. Conclusions and future outline

This review summarized the fundamental aspects of different spectroscopy and X-ray scattering-based methods which have been successfully utilized to probe the structure evolution during solution processing. Selective literature studies were chronologically presented as examples to demonstrate the role of in situ measurements in deepening the understanding of the influence of various processing conditions on the morphology evolution of organic photovoltaic films. Although for some cases where the film formation processes are relatively simple, the in situ tests may be replaced by the combination of steady-state measurements only on the solution and the film states, more cases in this review have demonstrated that BHJ formation processes contain multiple stages especially when various morphological optimization methods are involved. More importantly, film formation kinetics such as the time and sequential stage of aggregation are decisive to the final morphology of the blend, and this information can only be accessed by real-time measurements. Through such measurements, the factors governing final morphology during the liquid–solid transition could be revealed. Specifically, we knew that in most cases, the crystallization process of molecules happened at the very late stage of the solvent evaporation, when its solubility limit in the processing solvent was crossed. The rate of crystallization decreased with the increased boiling point of the solvent, and thus the use of solvent additives with high boiling points could prolong the film formation and induce a slower crystallization process. However, real-time studies showed that this prolonged crystallization did not necessarily lead to enhanced crystallinity, as the phase separation mechanism could also be altered. Even if the crystallinity dose increased, it could be done through different mechanisms from simply prolonged crystallization timescale, to promoting the formation of metastable polymorph or increasing nucleation rate. Thus, the role of solvent additive in improving device performance is heavily dependent on the specific additive–polymer interactions in the film formation process. The solubility difference of polymer in the main solvent and additive was identified as a key factor to achieve multi-length scale morphology. Changing processing temperature could alter polymer ordering behaviors as well, but again, in different ways depending on material systems. P3HT-based BHJ processed in low temperature achieved better π–π staking thus a good device performance, while in PffBT4T-2OD-based BHJ, relatively lower temperature (80 °C) promoted massive polymer nucleation, resulting in limited crystal growth space and better device performance with reduced domain sizes. Different film formation kinetics that is induced by varying the coating methods and conditions are also reported to influence the crystallinity and roughness of the resulting films. In a ternary BHJ, the sequence of aggregation of polymers was found to play an important role in the geometry of ternary morphology. Overall, in situ studies offer a rational guide to understanding mechanisms behind various morphological optimization methods, which is crucial not only for the performance optimization of OSCs, but also for its up-scaling in the near future.

From the development of the in situ studies on the different processing conditions of OSCs, in situ studies ranged from incorporating simple techniques like light reflectometry towards more advanced techniques like GIWAXS and GISAXS, and from a single-probe study to a multi-probe study that conducted multiple in situ techniques at the same time. As a result, the information one can get from in situ measurements evolved dramatically, from a simple thickness detection of the film to nanostructure evolutions of organic semiconductors and interplays between solvents and solutes during solidification. The current in situ techniques have been proven as important tools to gain insights into the nanostructure formation under various processing conditions. However, unlike techniques based on microscopy, most of the morphological information one can extract from in situ measurements is indirect, which might bring over/underestimates to the conclusions.9 Correlating the results from current in situ techniques with the theoretical modeling of morphology formation could open up new insights into BHJ formation mechanisms, as demonstrated by Negi et al.136 Beyond the real-time morphological study, in situ techniques could probe more, as efforts have been made to incorporate more ex situ measurements to the in situ toolbox. In addition to our efforts in in situ TRPL study, an exciting example is presented by Wilson and Wong, who conducted transient absorption (TA) in real time, to study the exciton dynamics during solidification of pseudoisocyanine.137 Although it is challenging to incorporate the pump–probe beam path into the in situ mode, considering the important role of TA measurement in the fundamental physics of OSC operation, in situ TA could provide a new pathway to study how the photophysical properties evolve during the formation of functional films. With the development of new in situ techniques and keep exploring the full potentials of current in situ setups. We believe that in situ characterization methods must play a substantial role in the further development of OSC in morphological understanding and potentially in the fundamental physics of solution-processed functional devices.

Conflicts of interest

There are no conflicts to declare.

Acknowledgements

Y. Liu thanks the funding support from NingboTech University under grant No. 20220322Z0059 and Y. Liu and Y. Zhong acknowledge funding supported by the Zhejiang Provincial Natural Science Foundation of China under Grant No. LY22E020010.

References

  1. O. Inganas, Adv. Mater., 2018, 30, 1800388 CrossRef PubMed.
  2. I. Ramirez, M. Causa, Y. Zhong, N. Banerji and M. Riede, Adv. Energy Mater., 2018, 8, 1703551 CrossRef.
  3. F. Zhang, O. Inganäs, Y. Zhou and K. Vandewal, Nat. Sci. Rev., 2016, 3, 222–239 CrossRef CAS.
  4. Z. Hu, J. Wang, X. Ma, J. Gao, C. Xu, K. Yang, Z. Wang, J. Zhang and F. Zhang, Nano Energy, 2020, 78, 105376 CrossRef CAS.
  5. Y. Huang, E. J. Kramer, A. J. Heeger and G. C. Bazan, Chem. Rev., 2014, 114, 7006–7043 CrossRef CAS PubMed.
  6. C. J. Brabec, S. Gowrisanker, J. J. M. Halls, D. Laird, S. J. Jia and S. P. Williams, Adv. Mater., 2010, 22, 3839–3856 CrossRef CAS PubMed.
  7. G. Dennler, M. C. Scharber and C. J. Brabec, Adv. Mater., 2009, 21, 1323–1338 CrossRef CAS.
  8. A. J. Pearson, T. Wang and D. G. Lidzey, Rep. Prog. Phys., 2013, 76, 022501 CrossRef PubMed.
  9. N. S. Güldal, T. Kassar, M. Berlinghof, T. Unruh and C. J. Brabec, J. Mater. Res., 2017, 32, 1855–1879 CrossRef.
  10. L. J. Richter, D. M. DeLongchamp and A. Amassian, Chem. Rev., 2017, 117, 6332–6366 CrossRef CAS PubMed.
  11. Y. Liu, D. Tang, K. Zhang, P. Huang, Z. Wang, K. Zhu, Z. Li, L. Yuan, J. Fan, Y. Zhou and B. Song, ACS Omega, 2017, 2, 2489–2498 CrossRef CAS PubMed.
  12. R. Hansson, L. K. E. Ericsson, N. P. Holmes, J. Rysz, A. Opitz, M. Campoy-Quiles, E. Wang, M. G. Barr, A. L. D. Kilcoyne, X. Zhou, P. Dastoor and E. Moons, J. Mater. Chem. A, 2015, 3, 6970–6979 RSC.
  13. X. Yang, J. Loos, S. C. Veenstra, W. J. H. Verhees, M. M. Wienk, J. M. Kroon, M. A. J. Michels and R. A. J. Janssen, Nano Lett., 2005, 5, 579–583 CrossRef CAS PubMed.
  14. M. Pfannmoller, H. Flugge, G. Benner, I. Wacker, C. Sommer, M. Hanselmann, S. Schmale, H. Schmidt, F. A. Hamprecht, T. Rabe, W. Kowalsky and R. R. Schroder, Nano Lett., 2011, 11, 3099–3107 CrossRef CAS PubMed.
  15. P. Muller-Buschbaum, Adv. Mater., 2014, 26, 7692–7709 CrossRef PubMed.
  16. A. Mahmood and J. L. Wang, Sol. RRL, 2020, 4, 2000337 CrossRef CAS.
  17. S. Kouijzer, J. J. Michels, M. van den Berg, V. S. Gevaerts, M. Turbiez, M. M. Wienk and R. A. Janssen, J. Am. Chem. Soc., 2013, 135, 12057–12067 CrossRef CAS PubMed.
  18. I. Pelse, J. L. Hernandez, S. Engmann, A. A. Herzing, L. J. Richter and J. R. Reynolds, ACS Appl. Mater. Interfaces, 2020, 12, 27416–27424 CrossRef CAS PubMed.
  19. S. A. Schneider, K. L. Gu, H. Yan, M. Abdelsamie, Z. Bao and M. F. Toney, Chem. Mater., 2021, 33, 5951–5961 CrossRef CAS.
  20. F. Liu, S. Ferdous, E. Schaible, A. Hexemer, M. Church, X. Ding, C. Wang and T. P. Russell, Adv. Mater., 2015, 27, 886–891 CrossRef CAS PubMed.
  21. C. McDowell, M. Abdelsamie, K. Zhao, D.-M. Smilgies, G. C. Bazan and A. Amassian, Adv. Energy Mater., 2015, 5, 1501121 CrossRef.
  22. X. Gu, H. Yan, T. Kurosawa, B. C. Schroeder, K. L. Gu, Y. Zhou, J. W. F. To, S. D. Oosterhout, V. Savikhin, F. Molina-Lopez, C. J. Tassone, S. C. B. Mannsfeld, C. Wang, M. F. Toney and Z. Bao, Adv. Energy Mater., 2016, 6, 1601225 CrossRef.
  23. D. Yang, S. Grott, X. Jiang, K. S. Wienhold, M. Schwartzkopf, S. V. Roth and P. Müller-Buschbaum, Small Methods, 2020, 4, 2000418 CrossRef CAS.
  24. A. J. Pearson, T. Wang, A. D. F. Dunbar, H. Yi, D. C. Watters, D. M. Coles, P. A. Staniec, A. Iraqi, R. A. L. Jones and D. G. Lidzey, Adv. Funct. Mater., 2014, 24, 659–667 CrossRef CAS.
  25. X. Yi, Z. Peng, B. Xu, D. Seyitliyev, C. H. Y. Ho, E. O. Danilov, T. Kim, J. R. Reynolds, A. Amassian, K. Gundogdu, H. Ade and F. So, Adv. Energy Mater., 2020, 10, 1902430 CrossRef CAS.
  26. R. Zhang, Y. Yan, Q. Zhang, Q. Liang, J. Zhang, X. Yu, J. Liu and Y. Han, ACS Appl. Mater. Interfaces, 2021, 13, 21756–21764 CrossRef CAS PubMed.
  27. D. Baran, R. S. Ashraf, D. A. Hanifi, M. Abdelsamie, N. Gasparini, J. A. Rohr, S. Holliday, A. Wadsworth, S. Lockett, M. Neophytou, C. J. Emmott, J. Nelson, C. J. Brabec, A. Amassian, A. Salleo, T. Kirchartz, J. R. Durrant and I. McCulloch, Nat. Mater., 2017, 16, 363–369 CrossRef CAS PubMed.
  28. Y. Mao, C. Guo, D. Li, W. Li, B. Du, M. Chen, Y. Wang, D. Liu and T. Wang, ACS Appl. Mater. Interfaces, 2019, 11, 35827–35834 CrossRef CAS PubMed.
  29. L. A. Perez, K. W. Chou, J. A. Love, T. S. van der Poll, D. M. Smilgies, T. Q. Nguyen, E. J. Kramer, A. Amassian and G. C. Bazan, Adv. Mater., 2013, 25, 6380–6384 CrossRef CAS PubMed.
  30. T. Kassar, N. S. Güldal, M. Berlinghof, T. Ameri, A. Kratzer, B. C. Schroeder, G. L. Destri, A. Hirsch, M. Heeney, I. McCulloch, C. J. Brabec and T. Unruh, Adv. Energy Mater., 2016, 6, 1502025 CrossRef.
  31. W. Zhong, Q. Hu, L. Ying, Y. Jiang, K. Li, Z. Zeng, F. Liu, C. Wang, T. P. Russell, F. Huang and Y. Cao, Sol. RRL, 2020, 4, 2000148 CrossRef CAS.
  32. P. W. M. Blom, V. D. Mihailetchi, L. J. A. Koster and D. E. Markov, Adv. Mater., 2007, 19, 1551–1566 CrossRef CAS.
  33. S. Fabiano, Z. Chen, S. Vahedi, A. Facchetti, B. Pignataro and M. A. Loi, J. Mater. Chem., 2011, 21, 5891–5896 RSC.
  34. C. R. McNeill, S. Westenhoff, C. Groves, R. H. Friend and N. C. Greenham, J. Phys. Chem. C, 2007, 111, 19153–19160 CrossRef CAS.
  35. A. Wadsworth, Z. Hamid, J. Kosco, N. Gasparini and I. McCulloch, Adv. Mater., 2020, 32, 2001763 CrossRef CAS PubMed.
  36. J. C. Bernède, H. Derouiche and V. Djara, Sol. Energy Mater. Sol. Cells, 2005, 87, 261–270 CrossRef.
  37. J. Yuan, Y. Q. Zhang, L. Y. Zhou, G. C. Zhang, H. L. Yip, T. K. Lau, X. H. Lu, C. Zhu, H. J. Peng, P. A. Johnson, M. Leclerc, Y. Cao, J. Ulanski, Y. F. Li and Y. P. Zou, Joule, 2019, 3, 1140–1151 CrossRef CAS.
  38. W. Zhao, D. Qian, S. Zhang, S. Li, O. Inganäs, F. Gao and J. Hou, Adv. Mater., 2016, 28, 4734–4739 CrossRef CAS PubMed.
  39. S. Li, L. Ye, W. Zhao, S. Zhang, S. Mukherjee, H. Ade and J. Hou, Adv. Mater., 2016, 28, 9423–9429 CrossRef CAS PubMed.
  40. C. Li, J. Zhou, J. Song, J. Xu, H. Zhang, X. Zhang, J. Guo, L. Zhu, D. Wei, G. Han, J. Min, Y. Zhang, Z. Xie, Y. Yi, H. Yan, F. Gao, F. Liu and Y. Sun, Nat. Energy, 2021, 6, 605–613 CrossRef CAS.
  41. S. Gélinas, O. Paré-Labrosse, C.-N. Brosseau, S. Albert-Seifried, C. R. McNeill, K. R. Kirov, I. A. Howard, R. Leonelli, R. H. Friend and C. Silva, J. Phys. Chem. C, 2011, 115, 7114–7119 CrossRef.
  42. J. Kern, S. Schwab, C. Deibel and V. Dyakonov, Phys. Status Solidi RRL, 2011, 5, 364–366 CrossRef CAS.
  43. F. Gao and O. Inganas, Phys. Chem. Chem. Phys., 2014, 16, 20291–20304 RSC.
  44. L. G. Kaake, J. J. Jasieniak, R. C. Bakus, 2nd, G. C. Welch, D. Moses, G. C. Bazan and A. J. Heeger, J. Am. Chem. Soc., 2012, 134, 19828–19838 CrossRef CAS PubMed.
  45. S. D. Dimitrov, B. C. Schroeder, C. B. Nielsen, H. Bronstein, Z. Fei, I. McCulloch, M. Heeney and J. R. Durrant, Polymers, 2016, 8, 14 CrossRef.
  46. S. Mukherjee, C. M. Proctor, G. C. Bazan, T.-Q. Nguyen and H. Ade, Adv. Energy Mater., 2015, 5, 1500877 CrossRef.
  47. J. A. Bartelt, Z. M. Beiley, E. T. Hoke, W. R. Mateker, J. D. Douglas, B. A. Collins, J. R. Tumbleston, K. R. Graham, A. Amassian, H. Ade, J. M. J. Fréchet, M. F. Toney and M. D. McGehee, Adv. Energy Mater., 2013, 3, 364–374 CrossRef CAS.
  48. A. Melianas, V. Pranculis, D. Spoltore, J. Benduhn, O. Inganäs, V. Gulbinas, K. Vandewal and M. Kemerink, Adv. Energy Mater., 2017, 7, 1700888 CrossRef.
  49. N. S. Güldal, T. Kassar, M. Berlinghof, T. Ameri, A. Osvet, R. Pacios, G. Li Destri, T. Unruh and C. J. Brabec, J. Mater. Chem. C, 2016, 4, 2178–2186 RSC.
  50. E. F. Manley, J. Strzalka, T. J. Fauvell, N. E. Jackson, M. J. Leonardi, N. D. Eastham, T. J. Marks and L. X. Chen, Adv. Mater., 2017, 29, 1703933 CrossRef PubMed.
  51. D. K. Susarova, A. E. Goryachev, D. V. Novikov, N. N. Dremova, S. M. Peregudova, V. F. Razumov and P. A. Troshin, Sol. Energy Mater. Sol. Cells, 2014, 120, 30–36 CrossRef CAS.
  52. I. Jalan, L. Lundin and J. van Stam, Materials, 2019, 12, 3889 CrossRef CAS PubMed.
  53. T. Wang, A. D. F. Dunbar, P. A. Staniec, A. J. Pearson, P. E. Hopkinson, J. E. MacDonald, S. Lilliu, C. Pizzey, N. J. Terrill, A. M. Donald, A. J. Ryan, R. A. L. Jones and D. G. Lidzey, Soft Matter, 2010, 6, 4128–4134 RSC.
  54. B. Schmidt-Hansberg, M. Sanyal, M. F. G. Klein, M. Pfaff, N. Schnabel, S. Jaiser, A. Vorobiev, E. Muller, A. Colsmann, P. Scharfer, D. Gerthsen, U. Lemmer, E. Barrena and W. Schabel, ACS Nano, 2011, 5, 8579–8590 CrossRef PubMed.
  55. K. Wei Chou, H. Ullah Khan, M. R. Niazi, B. Yan, R. Li, M. M. Payne, J. E. Anthony, D.-M. Smilgies and A. Amassian, J. Mater. Chem. C, 2014, 2, 5681–5689 RSC.
  56. K. Zhao, H. Hu, E. Spada, L. K. Jagadamma, B. Yan, M. Abdelsamie, Y. Yang, L. Yu, R. Munir, R. Li, G. O. N. Ndjawa and A. Amassian, J. Mater. Chem. A, 2016, 4, 16036–16046 RSC.
  57. S. Nilsson, A. Bernasik, A. Budkowski and E. Moons, Macromolecules, 2007, 40, 8291–8301 CrossRef CAS.
  58. M. Shao, J. K. Keum, R. Kumar, J. Chen, J. F. Browning, S. Das, W. Chen, J. Hou, C. Do, K. C. Littrell, A. Rondinone, D. B. Geohegan, B. G. Sumpter and K. Xiao, Adv. Funct. Mater., 2014, 24, 6647–6657 CrossRef CAS.
  59. L. Zhang, N. Yi, W. Zhou, Z. Yu, F. Liu and Y. Chen, Adv. Sci., 2019, 6, 1900565 CrossRef PubMed.
  60. W. Zhong, Q. Hu, Y. Jiang, Y. Li, T. L. Chen, L. Ying, F. Liu, C. Wang, Y. Liu, F. Huang, Y. Cao and T. P. Russell, Sol. RRL, 2019, 3, 1900032 CrossRef.
  61. L. Zhang, B. Lin, B. Hu, X. Xu and W. Ma, Adv. Mater., 2018, 30, 1800343 CrossRef PubMed.
  62. Y.-H. Chang, S.-R. Tseng, C.-Y. Chen, H.-F. Meng, E.-C. Chen, S.-F. Horng and C.-S. Hsu, Org. Electron., 2009, 10, 741–746 CrossRef CAS.
  63. X. Gu, L. Shaw, K. Gu, M. F. Toney and Z. Bao, Nat. Commun., 2018, 9, 534 CrossRef PubMed.
  64. M. Le Berre, Y. Chen and D. Baigl, Langmuir, 2009, 25, 2554–2557 CrossRef CAS PubMed.
  65. F. Jakubka, M. Heyder, F. Machui, J. Kaschta, D. Eggerath, W. Lövenich, F. C. Krebs and C. J. Brabec, Sol. Energy Mater. Sol. Cells, 2013, 109, 120–125 CrossRef CAS.
  66. T. J. Aldrich, S. M. Swick, F. S. Melkonyan and T. J. Marks, Chem. Mater., 2017, 29, 10294–10298 CrossRef CAS.
  67. F. Zhang, K. G. Jespersen, C. Björström, M. Svensson, M. R. Andersson, V. Sundström, K. Magnusson, E. Moons, A. Yartsev and O. Inganäs, Adv. Funct. Mater., 2006, 16, 667–674 CrossRef CAS.
  68. B. Walker, A. Tamayo, D. T. Duong, X.-D. Dang, C. Kim, J. Granstrom and T.-Q. Nguyen, Adv. Energy Mater., 2011, 1, 221–229 CrossRef CAS.
  69. J. Zhao, Y. Li, G. Yang, K. Jiang, H. Lin, H. Ade, W. Ma and H. Yan, Nat. Energy, 2016, 1, 15027 CrossRef CAS.
  70. G. Li, Y. Yao, H. Yang, V. Shrotriya, G. Yang and Y. Yang, Adv. Funct. Mater., 2007, 17, 1636–1644 CrossRef CAS.
  71. Z. Li, X. Xu, W. Zhang, X. Meng, W. Ma, A. Yartsev, O. Inganas, M. R. Andersson, R. A. Janssen and E. Wang, J. Am. Chem. Soc., 2016, 138, 10935–10944 CrossRef CAS PubMed.
  72. S. Y. Heriot and R. A. Jones, Nat. Mater., 2005, 4, 782–786 CrossRef CAS PubMed.
  73. J. Bergqvist, S. A. Mauger, K. Tvingstedt, H. Arwin and O. Inganäs, Sol. Energy Mater. Sol. Cells, 2013, 114, 89–98 CrossRef CAS.
  74. M. Campoy-Quiles, M. Schmidt, D. Nassyrov, O. Peña, A. R. Goñi, M. I. Alonso and M. Garriga, Thin Solid Films, 2011, 519, 2678–2681 CrossRef CAS.
  75. J. J. van Franeker, M. Turbiez, W. Li, M. M. Wienk and R. A. Janssen, Nat. Commun., 2015, 6, 6229 CrossRef CAS PubMed.
  76. J. J. van Franeker, D. Westhoff, M. Turbiez, M. M. Wienk, V. Schmidt and R. A. J. Janssen, Adv. Funct. Mater., 2015, 25, 855–863 CrossRef CAS.
  77. W. Schärtl, in Light Scattering from Polymer Solutions and Nanoparticle Dispersions, ed. W. Schärtl, Springer Berlin Heidelberg, Berlin, Heidelberg, 2007, pp. 1–24 DOI:10.1007/978-3-540-71951-9_1.
  78. F. Bencheikh, D. Duché, C. M. Ruiz, J.-J. Simon and L. Escoubas, J. Phys. Chem. C, 2015, 119, 24643–24648 CrossRef CAS.
  79. K. Zhou, Q. Zhao, R. Zhang, X. Cao, X. Yu, J. Liu and Y. Han, Phys. Chem. Chem. Phys., 2017, 19, 32373–32380 RSC.
  80. C. Scharsich, R. H. Lohwasser, M. Sommer, U. Asawapirom, U. Scherf, M. Thelakkat, D. Neher and A. Köhler, J. Polym. Sci. Pol. Phys., 2012, 50, 442–453 CrossRef CAS.
  81. M. Buchhorn, S. Wedler and F. Panzer, J. Phys. Chem. A, 2018, 122, 9115–9122 CrossRef CAS PubMed.
  82. J. L. Hernandez, E. Reichmanis and J. R. Reynolds, Org. Electron., 2015, 25, 57–65 CrossRef CAS.
  83. M. Reichenberger, S. Baderschneider, D. Kroh, S. Grauf, J. Köhler, R. Hildner and A. Köhler, Macromolecules, 2016, 49, 6420–6430 CrossRef CAS.
  84. N. Shin, L. J. Richter, A. A. Herzing, R. J. Kline and D. M. DeLongchamp, Adv. Energy Mater., 2013, 3, 938–948 CrossRef CAS.
  85. M. Reichenberger, D. Kroh, G. M. M. Matrone, K. Schötz, S. Pröller, O. Filonik, M. E. Thordardottir, E. M. Herzig, H. Bässler, N. Stingelin and A. Köhler, J. Polym. Sci. Pol. Phys., 2018, 56, 532–542 CrossRef CAS.
  86. H. Zhao, H. B. Naveed, B. Lin, X. Zhou, J. Yuan, K. Zhou, H. Wu, R. Guo, M. A. Scheel, A. Chumakov, S. V. Roth, Z. Tang, P. Muller-Buschbaum and W. Ma, Adv. Mater., 2020, 32, 2002302 CrossRef CAS PubMed.
  87. J. Yuan, D. Liu, H. Zhao, B. Lin, X. Zhou, H. B. Naveed, C. Zhao, K. Zhou, Z. Tang, F. Chen and W. Ma, Adv. Energy Mater., 2021, 11, 2100098 CrossRef CAS.
  88. R. Ma, C. Yan, P. W.-K. Fong, J. Yu, H. Liu, J. Yin, J. Huang, X. Lu, H. Yan and G. Li, Energy Environ. Sci., 2022, 15, 2479–2488 RSC.
  89. M. Abdelsamie, K. Zhao, M. R. Niazi, K. W. Chou and A. Amassian, J. Mater. Chem. C, 2014, 2, 3373–3381 RSC.
  90. S. Engmann, F. A. Bokel, H. W. Ro, D. M. DeLongchamp and L. J. Richter, Adv. Energy Mater., 2016, 6, 1502011 CrossRef.
  91. Y. Liu, A. Yangui, R. Zhang, A. Kiligaridis, E. Moons, F. Gao, O. Inganäs, I. G. Scheblykin and F. Zhang, Small Methods, 2021, 5, 2100585 CrossRef CAS PubMed.
  92. A. Köhler and H. Bässler, in Electronic Processes in Organic Semiconductors, ed. A. Köhler and H. Bässler, 2015, pp. 193–305 DOI:10.1002/9783527685172.ch3.
  93. Z. Zhao, B. He and B. Z. Tang, Chem. Sci., 2015, 6, 5347–5365 RSC.
  94. J. R. Lakowicz, in Principles of Fluorescence Spectroscopy, ed. J. R. Lakowicz, Springer US, Boston, MA, 2006, pp. 277–330 DOI:10.1007/978-0-387-46312-4_8.
  95. N. S. Güldal, M. Berlinghof, T. Kassar, X. Du, X. Jiao, M. Meyer, T. Ameri, A. Osvet, N. Li, G. L. Destri, R. H. Fink, H. Ade, T. Unruh and C. J. Brabec, J. Mater. Chem. A, 2016, 4, 16136–16147 RSC.
  96. R. Sun, J. Guo, Q. Wu, Z. Zhang, W. Yang, J. Guo, M. Shi, Y. Zhang, S. Kahmann, L. Ye, X. Jiao, M. A. Loi, Q. Shen, H. Ade, W. Tang, C. J. Brabec and J. Min, Energy Environ. Sci., 2019, 12, 3118–3132 RSC.
  97. Y. Yu, R. Sun, T. Wang, X. Yuan, Y. Wu, Q. Wu, M. Shi, W. Yang, X. Jiao and J. Min, Adv. Funct. Mater., 2020, 31, 2008767 CrossRef.
  98. J. Liu, J. Han, Q. Liang, J. Xin, Y. Tang, W. Ma, X. Yu and Y. Han, ACS Omega, 2018, 3, 7603–7612 CrossRef CAS PubMed.
  99. M. Sanyal, B. Schmidt-Hansberg, M. F. G. Klein, A. Colsmann, C. Munuera, A. Vorobiev, U. Lemmer, W. Schabel, H. Dosch and E. Barrena, Adv. Energy Mater., 2011, 1, 363–367 CrossRef CAS.
  100. M. Sanyal, B. Schmidt-Hansberg, M. F. G. Klein, C. Munuera, A. Vorobiev, A. Colsmann, P. Scharfer, U. Lemmer, W. Schabel, H. Dosch and E. Barrena, Macromolecules, 2011, 44, 3795–3800 CrossRef CAS.
  101. F. Buss, B. Schmidt-Hansberg, M. Sanyal, C. Munuera, P. Scharfer, W. Schabel and E. Barrena, Macromolecules, 2016, 49, 4867–4874 CrossRef CAS.
  102. F. Liu, Y. Gu, C. Wang, W. Zhao, D. Chen, A. L. Briseno and T. P. Russell, Adv. Mater., 2012, 24, 3947–3951 CrossRef CAS PubMed.
  103. S. Pröller, F. Liu, C. Zhu, C. Wang, T. P. Russell, A. Hexemer, P. Müller-Buschbaum and E. M. Herzig, Adv. Energy Mater., 2016, 6, 1501580 CrossRef.
  104. J. Zhan, L. Wang, M. Zhang, L. Zhu, T. Hao, G. Zhou, Z. Zhou, J. Chen, W. Zhong, C. Qiu, S. Leng, Y. Zou, Z. Shi, H. Zhu, W. Feng, M. Zhang, Y. Li, Y. Zhang and F. Liu, Macromolecules, 2021, 54, 4030–4041 CrossRef CAS.
  105. L. Zhu, W. Zhong, C. Qiu, B. Lyu, Z. Zhou, M. Zhang, J. Song, J. Xu, J. Wang, J. Ali, W. Feng, Z. Shi, X. Gu, L. Ying, Y. Zhang and F. Liu, Adv. Mater., 2019, 31, 1902899 CrossRef CAS PubMed.
  106. D.-M. Smilgies, R. Li, G. Giri, K. W. Chou, Y. Diao, Z. Bao and A. Amassian, Phys. Status Solidi RRL, 2013, 7, 177–179 CrossRef CAS.
  107. M. Abdelsamie, N. D. Treat, K. Zhao, C. McDowell, M. A. Burgers, R. Li, D. M. Smilgies, N. Stingelin, G. C. Bazan and A. Amassian, Adv. Mater., 2015, 27, 7285–7292 CrossRef CAS PubMed.
  108. L. J. Richter, D. M. DeLongchamp, F. A. Bokel, S. Engmann, K. W. Chou, A. Amassian, E. Schaible and A. Hexemer, Adv. Energy Mater., 2015, 5, 1400975 CrossRef.
  109. Y. J. Kim, S. Lee, M. R. Niazi, K. Hwang, M. C. Tang, D. H. Lim, J. S. Kang, D. M. Smilgies, A. Amassian and D. Y. Kim, ACS Appl. Mater. Interfaces, 2020, 12, 36417–36427 CrossRef CAS PubMed.
  110. Y. Zhong, R. Munir, J. Li, M.-C. Tang, M. R. Niazi, D.-M. Smilgies, K. Zhao and A. Amassian, ACS Energy Lett., 2018, 3, 1078–1085 CrossRef CAS.
  111. X. Gu, J. Reinspach, B. J. Worfolk, Y. Diao, Y. Zhou, H. Yan, K. Gu, S. Mannsfeld, M. F. Toney and Z. Bao, ACS Appl. Mater. Interfaces, 2016, 8, 1687–1694 CrossRef CAS PubMed.
  112. Z. Bi, H. B. Naveed, Y. Mao, H. Yan and W. Ma, Macromolecules, 2018, 51, 6682–6691 CrossRef CAS.
  113. J. Chen, Z. Bi, X. Xu, Q. Zhang, S. Yang, S. Guo, H. Yan, W. You and W. Ma, Adv. Sci., 2019, 6, 1801560 CrossRef PubMed.
  114. I. Pelse, A. L. Jones, L. J. Richter and J. R. Reynolds, Chem. Mater., 2021, 33, 657–667 CrossRef CAS.
  115. D. M. DeLongchamp, R. J. Kline, D. A. Fischer, L. J. Richter and M. F. Toney, Adv. Mater., 2011, 23, 319–337 CrossRef CAS PubMed.
  116. S. Wedler, C. Zhou, G. C. Bazan, F. Panzer and A. Kohler, J. Phys. Chem. Lett., 2020, 11, 9379–9386 CrossRef CAS PubMed.
  117. K. W. Chou, B. Yan, R. Li, E. Q. Li, K. Zhao, D. H. Anjum, S. Alvarez, R. Gassaway, A. Biocca, S. T. Thoroddsen, A. Hexemer and A. Amassian, Adv. Mater., 2013, 25, 1923–1929 CrossRef CAS PubMed.
  118. J. H. Kim, C. Schaefer, T. Ma, J. Zhao, J. Turner, M. Ghasemi, I. Constantinou, F. So, H. Yan, A. Gadisa and H. Ade, Adv. Energy Mater., 2018, 9, 1802293 CrossRef.
  119. L. Ye, W. Jiang, W. Zhao, S. Zhang, D. Qian, Z. Wang and J. Hou, Small, 2014, 10, 4658–4663 CrossRef CAS PubMed.
  120. S. Holliday, R. S. Ashraf, A. Wadsworth, D. Baran, S. A. Yousaf, C. B. Nielsen, C. H. Tan, S. D. Dimitrov, Z. Shang, N. Gasparini, M. Alamoudi, F. Laquai, C. J. Brabec, A. Salleo, J. R. Durrant and I. McCulloch, Nat. Commun., 2016, 7, 11585 CrossRef CAS PubMed.
  121. Z. Zheng, H. Yao, L. Ye, Y. Xu, S. Zhang and J. Hou, Mater. Today, 2020, 35, 115–130 CrossRef CAS.
  122. E. F. Manley, J. Strzalka, T. J. Fauvell, T. J. Marks and L. X. Chen, Adv. Energy Mater., 2018, 8, 1800611 CrossRef.
  123. C. McDowell, M. Abdelsamie, M. F. Toney and G. C. Bazan, Adv. Mater., 2018, 30, 1707114 CrossRef PubMed.
  124. S. Engmann, F. A. Bokel, A. A. Herzing, H. W. Ro, C. Girotto, B. Caputo, C. V. Hoven, E. Schaible, A. Hexemer, D. M. DeLongchamp and L. J. Richter, J. Mater. Chem. A, 2015, 3, 8764–8771 RSC.
  125. F. Liu, W. Zhao, J. R. Tumbleston, C. Wang, Y. Gu, D. Wang, A. L. Briseno, H. Ade and T. P. Russell, Adv. Energy Mater., 2014, 4, 1301377 CrossRef.
  126. F. A. Bokel, S. Engmann, A. A. Herzing, B. A. Collins, H. W. Ro, D. M. DeLongchamp, L. J. Richter, E. Schaible and A. Hexemer, Chem. Mater., 2017, 29, 2283–2293 CrossRef CAS.
  127. Y. Lin, S. Dong, Z. Li, W. Zheng, J. Yang, A. Liu, W. Cai, F. Liu, Y. Jiang, T. P. Russell, F. Huang, E. Wang and L. Hou, Nano Energy, 2018, 46, 428–435 CrossRef CAS.
  128. Y. Liu, J. Zhao, Z. Li, C. Mu, W. Ma, H. Hu, K. Jiang, H. Lin, H. Ade and H. Yan, Nat. Commun., 2014, 5, 5293 CrossRef CAS PubMed.
  129. Y. Qin, Y. Xu, Z. Peng, J. Hou and H. Ade, Adv. Funct. Mater., 2020, 30, 2005011 CrossRef CAS.
  130. B. Schmidt-Hansberg, M. F. G. Klein, K. Peters, F. Buss, J. Pfeifer, S. Walheim, A. Colsmann, U. Lemmer, P. Scharfer and W. Schabel, J. Appl. Phys., 2009, 106, 124501 CrossRef.
  131. H. W. Ro, J. M. Downing, S. Engmann, A. A. Herzing, D. M. DeLongchamp, L. J. Richter, S. Mukherjee, H. Ade, M. Abdelsamie, L. K. Jagadamma, A. Amassian, Y. Liu and H. Yan, Energy Environ. Sci., 2016, 9, 2835–2846 RSC.
  132. C. Guo, X. Gao, F. J. Lin, Q. Wang, L. Meng, R. Bian, Y. Sun, L. Jiang and H. Liu, ACS Appl. Mater. Interfaces, 2018, 10, 39448–39454 CrossRef CAS PubMed.
  133. W. Guan, D. Yuan, J. Wu, X. Zhou, H. Zhao, F. Guo, L. Zhang, K. Zhou, W. Ma, W. Cai, J. Chen, L. Ding and L. Hou, J. Semicond., 2021, 42, 030502 CrossRef CAS.
  134. A. Classen, C. L. Chochos, L. Lüer, V. G. Gregoriou, J. Wortmann, A. Osvet, K. Forberich, I. McCulloch, T. Heumüller and C. J. Brabec, Nat. Energy, 2020, 5, 711–719 CrossRef CAS.
  135. D. Qian, Z. Zheng, H. Yao, W. Tress, T. R. Hopper, S. Chen, S. Li, J. Liu, S. Chen, J. Zhang, X. K. Liu, B. Gao, L. Ouyang, Y. Jin, G. Pozina, I. A. Buyanova, W. M. Chen, O. Inganas, V. Coropceanu, J. L. Bredas, H. Yan, J. Hou, F. Zhang, A. A. Bakulin and F. Gao, Nat. Mater., 2018, 17, 703–709 CrossRef CAS PubMed.
  136. V. Negi, O. Wodo, J. J. van Franeker, R. A. J. Janssen and P. A. Bobbert, ACS Appl. Energy Mater., 2018, 1, 725–735 CrossRef CAS.
  137. K. S. Wilson and C. Y. Wong, J. Phys. Chem. A, 2018, 122, 6438–6444 CrossRef CAS PubMed.

This journal is © The Royal Society of Chemistry 2022