
 Open Access Article
 This Open Access Article is licensed under a Creative Commons Attribution-Non Commercial 3.0 Unported Licence
Nanosecond kinetics of multiphoton upconversion in an optically trapped single microcrystal†
Hanchang
Huang‡
 a,
Maohui
Yuan‡
ab,
Shuai
Hu
a,
Yanyi
Zhong
a,
Wenda
Cui
ac,
Chuan
Guo
*ac,
Changqing
Song
ac,
Guomin
Zhao
ac and
Kai
Han
*ad
a,
Maohui
Yuan‡
ab,
Shuai
Hu
a,
Yanyi
Zhong
a,
Wenda
Cui
ac,
Chuan
Guo
*ac,
Changqing
Song
ac,
Guomin
Zhao
ac and
Kai
Han
*ad
aCollege of Advanced Interdisciplinary Studies, National University of Defense Technology, Changsha, 410073, China. E-mail: 13661107098@163.com; hankai0071@nudt.edu.cn
bDepartment of Physics and Chemistry, PLA Army Academy of Special Operations, Guangzhou, 510507, China
cHunan Provincial Key Laboratory of High Energy Laser Technology, Changsha, 410073, China
dState Key Laboratory of Pulsed Power Laser Technology, Changsha, 410073, China
First published on 18th May 2022
Abstract
Recently, erbium-doped nanomaterials have been demonstrated to achieve multiband upconversion luminescence (UCL) via high excitation power and material alteration. In such a scenario, a large number of energy levels of rare-earth ions are populated, emitting light at characteristic wavelengths. However, understanding how the energy flows between these energy levels after intense excitation is rarely studied. Here, we built a setup that can optically trap single microcrystals (MCs) in solution, and record time-resolved luminescence at a nanosecond timescale. Under 976 nm nanosecond laser excitation, we observed UCL (white light) from a single β-NaYF4:Yb/Er microcrystal (MC). Surprisingly, the Er3+ ions are populated through four-photon upconversion (UC) processes, except for the traditional two-photon UC processes. Two populating pathways of the four-photon UC processes were observed, i.e. pathway A (4I15/2 → 4I11/2 → 4F7/2 → 2H11/2 → 4S3/2 → 2G7/2 → 4G11/2 → 2H9/2 → 4F5/2 → 2K13/2) and pathway B (4I15/2 → 4I11/2 → 4I13/2 → 4F9/2 → 2H9/2 → 2D5/2), and A was more efficient than B. Our results suggest that pathway A (which occurs first) can promote the operation of pathway B by non-radiative relaxation processes (nRPs) and back energy transfer (BET). This can provide a method to study the kinetic process of UC systems, which may facilitate the application of MCs in color displays and waveguide-based optical devices in the future.
Introduction
Lanthanide-doped UC nanomaterials convert low-energy infrared photons into visible or ultraviolet emissions,1 and have wide applications in the areas of biological engineering,2,3 optical devices,4–9 security,10,11 super-resolution nanoscopes,12,13 and lasers.14–16 Their optical properties and emission behaviours can be effectively tuned by lanthanide doping,17 crystal shape,18 organic surface modifications,19–22 and multilayer core–shell structures.21,23Traditionally, we understand the spectroscopic behaviours by exciting an assembly of MCs with various orientations. This gives strong emission signals but smooths out their individual behaviours such as anisotropic properties,24,25 making the particle interaction difficult to study.26 To understand how the single MCs emit, we either align them well or excite only a single one. Spin-coating MCs onto a substrate provides a platform to isolate them. We observed multiband emission (nearly white color) in a single NaYF4:Yb/Er crystal on the substrate via intense continuous laser excitation,27 compared to the traditional green (522 and 542 nm) and red (654 nm) major emission bands in the visible range.17 However, UCL properties can be influenced by their surrounding environments, such as the substrate28 and the air-sensitive interface.29 Thus, for some materials, their emission vastly changes when depositing them on the substrate from the solution. However, studying the emission properties of a single crystal in solution is quite challenging due to its unpredictable movement in the fluid environment.
Here, we propose a novel setup that combines optical tweezers (OTs) and spectroscopic capability, called optical trapping time-resolved photoluminescence spectroscopy (OT-TRPLS). The OTs can trap and manipulate microscopic objects using focused lasers by forming localized hot spots in space,30 which have been widely applied in fluid mechanics,31 fluorescent manipulations,32 cell fusion,33 temperature monitoring,34,35 and real-time manipulation of micro-objects.36 Using the OTs setup, we can achieve a controllable displacement of a single MC along the long axis (see Fig. 1b), which allows the constant incident laser position to avoid particle and substrate interactions. At the same time, this setup is equipped with an advanced time-resolved photoluminescence device that can measure spectral evolution down to the nanosecond timescale. Using OT-TRPLS, we can study the temporal evolution and emission of the excited state population, using pulsed excitation laser sources.
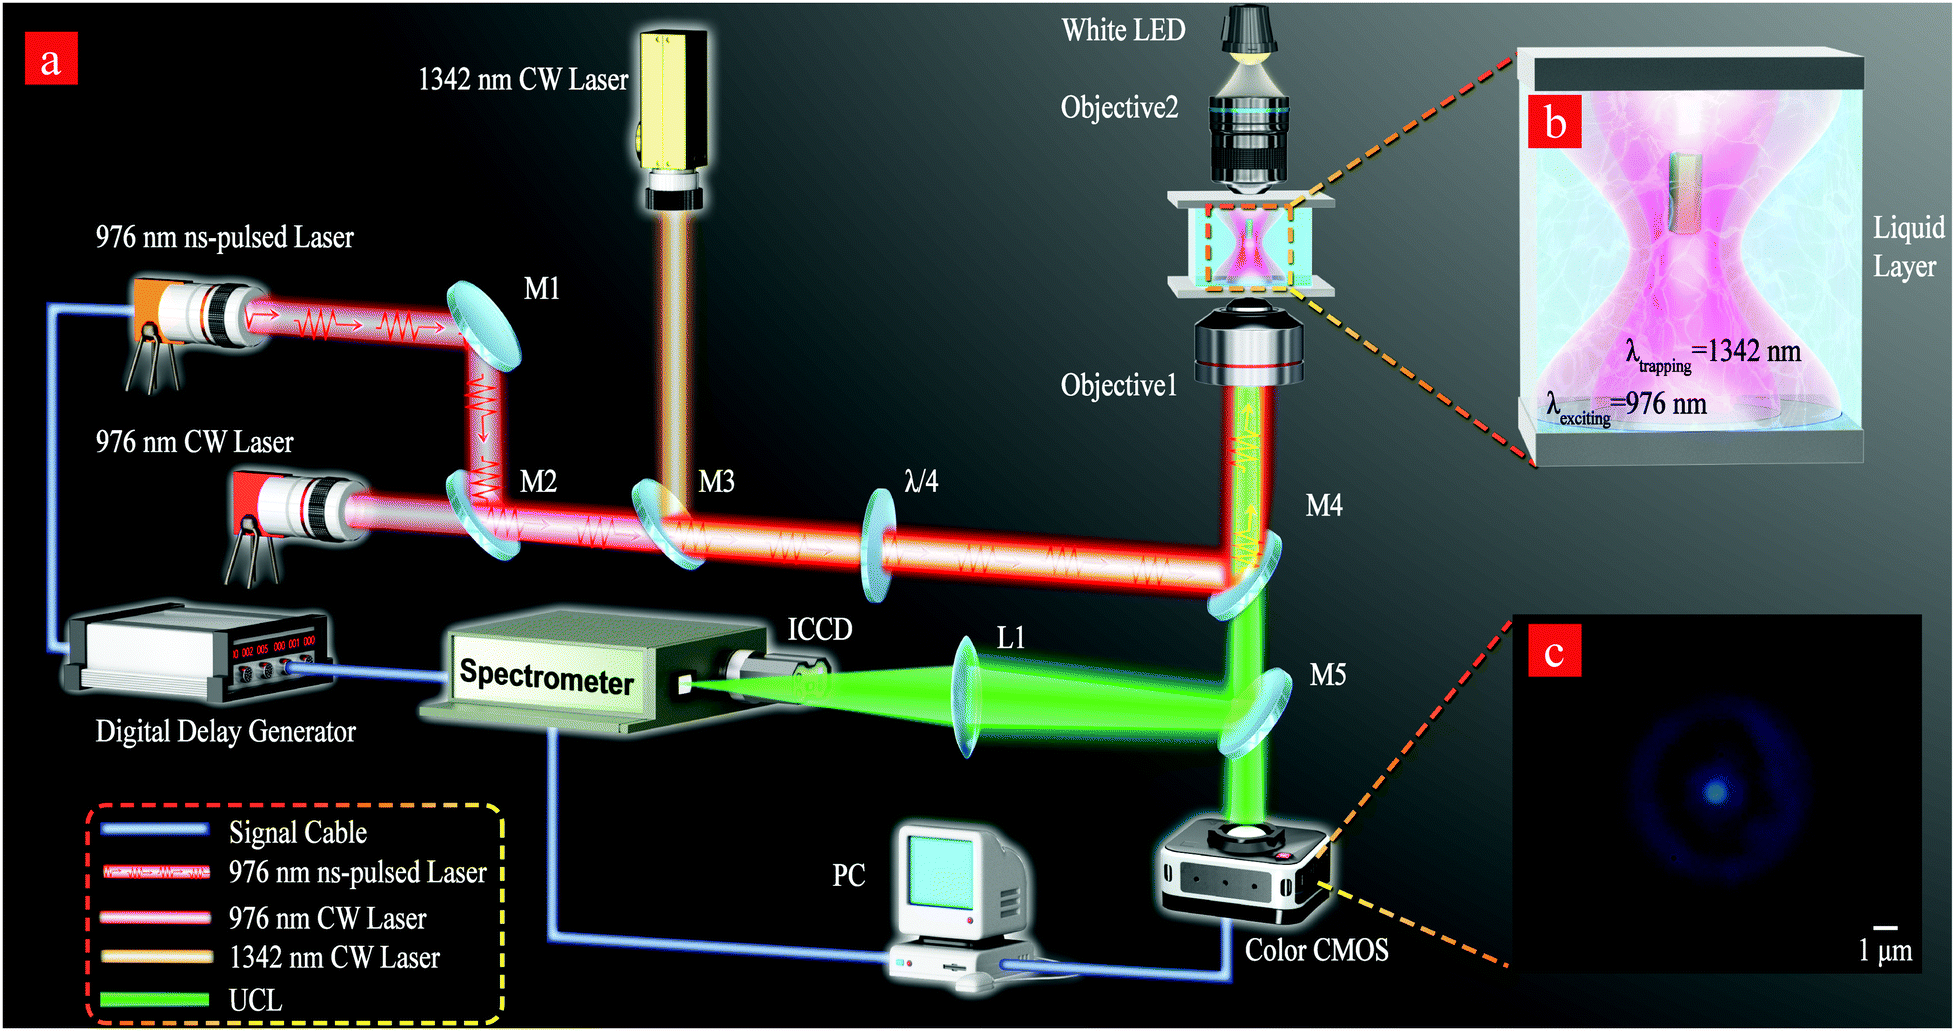 | ||
Fig. 1 (a) Schematics of the experimental setups for UCL detection under laser excitation. The main components are as follows: M1: planar reflective silver mirror; M2: polarization beam combining mirror for a 976 nm laser; M3: beam combining mirror for a 976 nm laser and 1342 nm laser; M4: dichroic mirror for short wave pass; and M5: 50![[thin space (1/6-em)]](https://www.rsc.org/images/entities/char_2009.gif) :50 beamsplitter. All lasers were coaxial before reaching the objective lens. Objective 1 is an oil lens with a numerical aperture of 1.3 and a magnification of 100×. Objective 2 has a numerical aperture of 0.25 and a magnification of 10x. (b) Schematic of optical trapping and exciting β-NaYF4 in an aqueous fluid chamber. (c) Real-time monitoring of the captured single β-NaYF4 using a CMOS camera under 976 nm laser excitation. :50 beamsplitter. All lasers were coaxial before reaching the objective lens. Objective 1 is an oil lens with a numerical aperture of 1.3 and a magnification of 100×. Objective 2 has a numerical aperture of 0.25 and a magnification of 10x. (b) Schematic of optical trapping and exciting β-NaYF4 in an aqueous fluid chamber. (c) Real-time monitoring of the captured single β-NaYF4 using a CMOS camera under 976 nm laser excitation. | ||
F. Frenzel et al. have investigated the power density-dependent multiband emission of NaYF4:Yb/Er,37 which demonstrated the existence of four-photon UC processes. Indeed, the kinetic multiband UCL population and emission processes are complex, making them difficult to identify and predict.38 Recently, Laurence et al. proposed the kinetic modeling of the time-resolved response for UCL of NaYF4:Yb/Er NCs.39 Using continuous wave (CW) and pulsed periodic excitation modes, the emission spectral properties of NaYF4:Yb3+/Er3+ NCs were characterized, respectively.40–42 However, a detailed study is needed to verify the kinetic processes of the multiband UCL in Yb3+/Er3+ codoped materials under pulsed laser excitation. The difficulties are as follows: (1) the pulsed excitation has a high peak power density but low total energy, so it is difficult for the pulsed excitation to achieve sustained multiband UCL like CW saturation excitation; (2) to efficiently record the transient spectra for such multiband UCL, short pulse duration, and high time-resolved and spectra-resolved collection platforms are needed. Our OT-TRPLS diagnostic platform allows for effective kinetic studies of the multiband emission of single NaYF4:Yb3+/Er3+ in solution.
In this work, we have first built a platform that can achieve 3D spatial control of single MCs with OTs and simultaneously excite the single MCs in solution with ns-pulsed lasers. Using the home-built platform, we have measured both the stable state and transient optical spectrum at nanosecond time resolution. A full-color multiband UCL was clearly observed in NaYF4:Yb3+/Er3+ MCs under 980 nm ns-pulse laser excitation. The stochastic photon emission (SPEM) has also been simultaneously detected for the multiband UCL, which was characterized by a nanosecond time-resolved spectrum. Finally, the detailed kinetic population processes and multiband UCL transition pathways were also demonstrated.
Experimental
Synthesis of β-NaYF4:Yb3+/Er3+ (20/2 mol%) MCs
β-NaYF4:Yb3+/Er3+ (20/2 mol%) MCs were prepared by the hydrothermal method. According to the doping ratio, 1 mmol of the corresponding rare earth chloride salt was dissolved in 15 mL of deionized water and stirred ultrasonically until the solution became transparent. 4 mmol EDTA-2Na was added to the mixed solution and stirred thoroughly for 30 minutes. Then 4 mmol NaF was added and stirred for 30 minutes until the solution resembled a jelly appearance. The above mixtures were annealed at 180 °C for 12 hours in a hydrothermal reactor and then cooled down to room temperature. The final products were washed three times with ethanol and deionized water, respectively.Physical characterization
The highly monodisperse, monocrystalline β-NaYF4:Yb3+/Er3+ (20/2 mol%) MCs were characterized by scanning electron microscopy (SEM) and were found to have a cross-sectional width of ∼0.9 μm and an overall length of ∼2 μm (see Fig. S1a, ESI†). The X-ray diffraction (XRD) results demonstrated that these NaYF4 MCs are β-phase crystalline, as shown in Fig. S1b (ESI†).Photoluminescence measurements
The experimental setup is shown in Fig. 1a for recording the kinetic UCL decay process under 976 nm ns-pulsed laser excitation or the steady-state spectra under 976 nm CW laser excitation. An optical trap is created by a 1342 nm CW laser and the single MCs are trapped by the gradient optical force (shown in Fig. 1b). Optical tweezers enable a 3D manipulation of the single MCs by an electric displacement stage. A color complementary metal oxide semiconductor (CMOS) camera is used to monitor the in situ optical trapping process, which is shown in Fig. 1c. The 1342 nm laser forms optical tweezers that move single MCs to a place where there is no influence from other MCs. Since Er3+ and Yb3+ ions do not absorb at 1342 nm,43,44 the use of 1342 nm laser trapping has no influence on the investigation of multiband UCL. In the experiment, we did not observe UCL signals when we trapped the single MCs using a 1342 nm laser. The steady-state spectral signal is detected upon 976 nm CW laser excitation. The spectral signal of temporal evolution under ns-pulsed laser excitation is detected using a spectrometer equipped with an image intensified charge-coupled device (ICCD) camera. The 976 nm ns-pulsed laser with a pulse width of 10 ns was irradiated at a repetition rate of 20 Hz. The time delays and triggering were controlled using a digital delay generator, which was calibrated with a photodiode and oscilloscope. The irradiated power density of 976 CW laser excitation is ∼2.3 MW cm−2. The peak irradiated power density of 976 nm ns-pulse laser excitation with a pulse width of 10 ns is ∼0.65 GW cm−2.Results and discussion
As shown in Fig. 2, we collected spectra of the UCL at an integration time of 2 ms for single β-NaYF4:Yb3+/Er3+ (20/2 mol%) MCs, which are trapped by OTs under 976 nm excitation in different modes. In the spectrum, not only two common UCL processes at green (522 nm, 541 nm) and red (654 nm) are observed, but some new UCL processes at other wavelengths can also be detected, thus leading to obvious multiband UCL phenomena upon 976 nm CW laser excitation. For the 976 nm ns-pulsed laser excitation, multiband UCL can be partly detected at an integration time of 2 ms. The peak power density is higher with ns-pulsed excitation compared to CW excitation. Therefore, pulsed excitation should have resulted in significant UCL. However, only some partial multiband emissions under ns-pulsed excitation have been observed at 2 ms integration time compared to the CW excitation. The pulse-excited single MCs have completed full UCL within an integration time of 2 ms. It is necessary to further reduce the integration time to study the kinetic properties. This is an effective way to investigate the reason why only a fraction of the multiband emission is detected under ns-pulsed laser excitation compared to the UCL under CW laser excitation. To investigate the kinetics between different Er3+ levels, we subsequently focused on the main peaks, which can be clearly distinguished from each other without a spectral deconvolution to separate signal contributions from neighbouring, spectrally overlapping bands. A diagram (Fig. S2, ESI†) relying on Judd–Ofelt analyses45–49 and previous studies27,37 were used for clarifying the complex population processes of the Yb3+–Er3+ system, which involves energy transfer (ET), Er3+–Yb3+ BET, and nRPs. | ||
| Fig. 2 Spectra of a single NaYF4: Yb (20%)/Er (2%) under different excitation modes trapped by optical tweezers. | ||
To improve the time resolution further, as shown in Fig. S3a (ESI†) and Fig. S3f (ESI†), the temporal spectra for CW laser excitation and ns-pulsed laser excitation are plotted respectively at a gate width of 100 ns integration time. It can be seen from the time trace in Fig. S3b–e (ESI†) and Fig. S3g–j (ESI†) that for both CW and ns-pulsed laser excitations, a distinct SPEM phenomenon is observed from the UCL of the single UC MCs when the integration gate width is at the 100 ns scale. For the excitation of the Yb3+–Er3+ co-doped system at a 980 nm laser, the Yb3+ ions build up many (electron) populations at the 2F5/2 level. With the help of Yb3+ ions, the energy is transferred to Er3+ ions. Lee, Eunsang et al. suggested that the SPEM phenomenon is caused by some dark Er3+ ions during the delay between the consecutive emission events.50 Although the SPEM phenomenon can be observed at a high temporal resolution, the shape and intensity of the spectra are relatively consistent when repeatedly sampled and superimposed on the spectra themselves at the same moment after excitation, which implies that stable kinetic processes are included in these spectral signals. Repeatedly superimposing spectral signals at the same moment after ns-pulse excitation provides valid access to study the UC pathways for single UC MCs.
To obtain the temporal evolution of spectra at the 100 ns time scale, we performed 500 accumulations of spectral signals at the same moment after excitation, and the results are shown in Fig. 3. Despite the existence of the SPEM phenomenon, the effective emissions of UCL at different wavelengths can still be observed in a certain sequence (see Fig. 3a) by accumulating the spectra 500 times at the same moment after the ns-pulsed laser excitation. The different emission sequence indicates a specific establishment pathway of (electron) populations in the UC process on the nanosecond time scale. As Fig. 3b shows, we successfully obtained transient spectra of multi-band UCL under ns-pulsed excitation. The excitation of single UC MCs by nanosecond pulses successfully made the various energy levels of the Er3+ ion activated, which can help study the kinetic process of multi-band UCL. In the previous study, we have a preliminary determination of the energy level sources of UCL at different central wavelengths in multiband emission, as shown in Fig. S2 (ESI†). We observed the effective emission sequence of UCL at different wavelengths in Fig. 3a. According to it, we further obtained the schematic diagram of the establishing process of the populations for multiband emission as shown in Fig. 4.
 | ||
| Fig. 3 Temporal evolution of spectra recorded using superimposed transient signals at the same moment 500 times in the wavelength range 375 < λ < 838 nm. The 0 moment is the starting point of the pulse excitation. (a) Temporal evolution of spectra in a step of 0.1 μs from moment 0. (b) Transient spectra for different time periods with an integration time of 5 μs. | ||
 | ||
| Fig. 4 Schematic representation of the transition kinetics on the first 1.1 μs after the excitation of a nanosecond pulse. The yellow part of the area shows the process of establishing populations and the blue part shows the radiative transition at each energy level. | ||
The UCL process takes place in a certain photophysical pathway and is related to the populations of the energy level. According to previous studies, two main populating pathways exist for UC.50–55 Pathway A is 4I15/2 → 4I11/2 → 4F7/2 → 2H11/2 → 4S3/2 → 2G7/2 → 4G11/2 → 2H9/2 → 4F5/2 → 2K13/2. Pathway B is 4I15/2 → 4I11/2 → 4I13/2 → 4F9/2 → 2H9/2 → 2D5/2. UCL at 522 nm (2H11/2 → 4I15/2) is emitted first within 100 ns after excitation, and no other emission is seen clearly at the same time (see Fig. 3a). It reveals that the pathway A population occurred first and thus leads to the initial 522 nm UCL. The corresponding populating channel is 4I15/2 → 4I11/2 → 4F7/2 → 2H11/2. Comparatively, for pathway B, the nRP of 4I11/2 → 4I13/2 (Er3+) is relatively slow, which results in no effective population accumulation at the 4I13/2 energy level in a short time (100 ns) through the process of 4I15/2 → 4I11/2 → 4I13/2. A similar situation was also found in the time trace date of UCL by Lee et al.50
Additionally, effective emissions centered at 542 nm (4S3/2 → 4I15/2), 505 nm (4G11/2 → 4I13/2), and 384 nm (4G11/2 → 4I15/2) can be detected at time periods of 100 ns to 200 ns after ns-pulsed laser excitation (see Fig. 3a), which indicates that the efficient (electron) populations have accumulated in the 4S3/2 and 4G11/2 energy levels (see Fig. 4). This implies that the effective 542 nm emission of the UCL is derived from the 2H11/2 → 4S3/2 → 4I15/2 population channel owing to the effective accumulations in the 2H11/2 energy level between 0 and 100 ns after excitation. Furthermore, the UCL processes at 505 nm and 384 nm are derived from the continuous operation of 4S3/2 → 2G7/2 → 4G11/2. In addition, the above two UCLs are both derived from the 4G11/2 level transition. Fig. 5 further shows the kinetic decay curves for the 384 nm and 505 nm emissions, which exhibit a consistent trend confirming that they originate from the same excited-state of Er3+. The evolution temporal spectra in the 0–200 ns range demonstrate that the process (4I15/2 → 4I11/2 → 4F7/2 → 2H11/2 → 4S3/2 → 2G7/2 → 4G11/2) in pathway A continues to populate a higher excited-state and the UCL generated from pathway B is still not efficient.
 | ||
| Fig. 5 Normalized intensity kinetic decay curves of UCL at different wavelengths and at (a) 4G11/2, (b) 2P3/2 and (c) 2H9/2 energy levels. | ||
Effective emissions at 402 nm (2P3/2 → 4I13/2), 470 nm (2P3/2 → 4I11/2), 410 nm (2H9/2 → 4I15/2), and 558 nm (2H9/2 → 4I13/2) can be observed in the time range of 200 ns to 300 ns after ns-pulsed laser excitation (Fig. 3a), which indicates that the effective (electron) populations have accumulated at the 2P3/2 and 2H9/2 energy levels. As Fig. 5b and c shows, the kinetic curves of 402 nm and 470 nm, as well as 410 nm and 558 nm, have the same trend. Compared to the lifetime (see Table S1, ESI†) from the previous studies,46–48 the differences in UCL lifetimes in Fig. 5 may be due to the differences in irradiation power densities and pathways.38 The (electron) populations are accumulated presumably in the 2P3/2 and 2H9/2 energy levels populated by the 4G11/2 → 2H9/2 → 4F5/2 → 2K13/2 → 2P3/2 process of pathway A (Fig. 4). Although the 4I15/2 → 4I11/2 → 4I13/2 → 4F9/2 → 2H9/2 → 2D5/2 → 2P3/2 process of pathway B may accumulate (electron) population at the 2P3/2 and 2H9/2 energy levels, this process would accumulate (electron) population at the 4F9/2 and 4G7/2 (through the nRP of 2D5/2 → 4G7/2, see Fig. 4) levels. However, the effective emission at 430 nm (4G7/2 → 4I11/2) and 654 nm was not observed in the time range of 0 ns to 300 ns after laser excitation. Therefore, within 300 ns after excitation, pathway A operates more efficiently, and no efficient operation of pathway B is observed.
At 300 ns to 400 ns after ns-pulsed laser excitation, 654 nm emission (4F9/2 → 4I15/2) emerges. According to previous reports,50–55 the red UCL (654 nm) results from three pathways: (1) the ETU process of 4I13/2 → 4F9/2; (2) the BET process of 4G11/2 → 4F9/2; and (3) the nRP of 4S3/2. Shin et al. found that the red emission (655 nm) of core/shell UCNPs with the structure NaYF4:Yb3+, and Er3+/NaYF4 could be modulated by emission depletion (ED) of the intermediate state that interacts resonantly with an infrared beam (1540 nm).51 This study illustrates the significance of the pathway of 4I13/2 → 4F9/2 for generating red light (654 nm). Based on the above discussion, in the 0–300 ns range, the nRP of 4I11/2 → 4I13/2 is slow, which results in no effective (electron) populations accumulated at the 4I13/2 energy level and the process of 4I15/2 → 4I11/2 → 4I13/2 → 4F9/2 → 4I15/2 could not operate effectively to produce 654 nm emission. However, we can also observe emissions at 505 nm, 402 nm, and 568 nm, which all could contribute to the populations at the 4I13/2 level. One of the possibilities for the appearance of red light (654 nm) at 300–400 ns after excitation is that a gradual increase in emissions (505 nm, 402 nm, and 568 nm) over time leads to an increase in populations at the 4I13/2 energy level and thus facilitates the population process of 4I13/2 → 4F9/2, which allows for the 654 nm emission. Furthermore, in the 0–300 ns range after ns-pulsed laser excitation, 505 nm, 402 nm (2P3/2 → 4I13/2), and 568 nm (2H9/2 → 4I13/2) emissions all originate from the accumulation of (electron) populations at 4G11/2, 2P3/2, and 2H9/2 energy levels by the 4I15/2 → 4I11/2 → 4F7/2 → 2H11/2 → 4S3/2 → 2G7/2 → 4G11/2 → 2H9/2 → 4F5/2 → 2K13/2 → 2P3/2 process in pathway A. Thus, the operation of pathway A is available to provide the (electron) populations for the operation of pathway B.
Anderson and Berry et al. suggested an intimate connection between NIR-to-red and NIR-to-blue UC. A different mechanism was proposed by them, involving a three-step ETU process, exciting Er3+ to 4G/2K manifold, followed by a single Er3+ → Yb3+ BET step to populate Er3+(4F9/2).54,55 The observation of 505 nm and 384 nm emissions indicates that the 4G11/2 energy level has accumulated (electron) populations while the 654 nm emission is first observed in the 300–400 ns after excitation, which implies that the BET process (4G11/2 → 4F9/2) is possible. In the 0–300 ns range after excitation, it is pathway A that populates the 4G11/2 (Er3+) energy level, which is followed by an Er3+ → Yb3+ BET step to populate Er3+ (4F9/2) in the 300–400 ns range after excitation. This process indicates that pathway A can further populate the intermediate levels of pathway B, which facilitates the operation of pathway B.
In the 0–300 ns range after ns-pulsed excitation, the observation of the 542 nm emission indicates that the nRP of 4S3/2 → 4F9/2 may occur to facilitate the 654 nm emission (4F9/2 → 4I15/2). Jung et al. excited the UCNPs with 488 nm and 980 nm lasers, respectively. They found that the percentage of red light under 488 nm excitation was significantly lower than that under 980 nm excitation.53 Berry et al. found that the direct excitation in the green-emitting state, 4S3/2 and 2H11/2, into the 4F7/2 level at 442 nm results in very weak red emission (656 nm), relative to the green emissions (522 nm and 542 nm). However, they were able to obtain UCL with a high red-to-green ratio using 943 nm laser excitation.54 Therefore, it suggests that the nRP of 4S3/2 → 4F9/2 is not the main process for the establishment of populations under 656 nm emission.
In the 400 ns to 500 ns range after ns-pulsed laser excitation, 430 nm emission (4G7/2 → 4I11/2) is observed which indicates that the process of 2H9/2 → 2D5/2 → 4G7/2 has run effectively. Because the 654 nm emission is already observable at 300 ns to 400 ns after excitation, it implies that the process of 4F9/2 → 2H9/2 is taking place currently. The observation of 456 nm (4F5/2 → 4I15/2), 496 nm (4F7/2 → 4I15/2), and 767 nm (2P3/2 → 4S3/2) emissions indicates that the process of pathway B populates the energy levels of 2H9/2 and 2D5/2, and the nRP of 2D5/2 → 2D7/2, 2H9/2 → 4F5/2 and 4F5/2 → 4F7/2 prompts 456 nm, 496 nm and 767 nm emissions.
At the 500 ns to 800 ns time scale, the observation of 443 nm (4F3/2 → 4I15/2), 803 nm (4I9/2 → 4I15/2), and 482 nm emissions (2K15/2 → 4I13/2) indicates that 4F3/2, 4I9/2, and 2K15/2 energy levels are accumulated effective populations. The accumulation of populations at the 4I9/2 energy level implies that the ETU process of 4I9/2 → 4F3/2 has operated, and the observation of 443 nm emission (4F3/2 → 4I15/2) indicates that the ETU process (4I9/2 → 4F3/2) prompts the populations of the 4F3/2 energy level. The ETU process (4I9/2 → 4F3/2) relies on an nRP (4F9/2 → 4I9/2) at the 4F9/2 energy level and the 4F9/2 energy level is one of the energy levels through which pathway B passes and not the pathway A passes. Therefore, we tend to classify the process as a branch of the B pathway. During this time, the ETU process is fully operational, and a certain number of electrons have accumulated at each energy level in the Er3+ ion. With the relaxation of the 2F5/2 energy level on the Yb3+ ion accumulated by ns-pulsed excitation, (electron) populations at each energy level within the Er3+ ion gradually increase under the ETU process and multiphoton relaxation. At 500 ns to 1.1 μs after excitation, 482 nm, 617 nm (2P3/2 → 4F9/2 or 4G11/2 → 4I11/2), 575 nm (2G7/2 → 4I11/2), 585 nm (4G9/2 → 4I11/2), 640 nm (2G7/2 → 4I9/2), 817 nm (2H9/2 → 4I9/2), and 700 nm (2H9/2 → 4I11/2) emissions are observed. These UCL processes at these wavelengths are difficult to observe upon low power excitation and the intensities of these UCL processes are low upon high power excitation. We think that there are two possibilities: (1) the emissions of UCL processes at these wavelengths are so weak that it is difficult for detectors to detect them; (2) only the accumulation of a certain number of populations at these energy levels results in radiative transition at these wavelengths. The production of multiband emission is more dependent on the increasing number of (electron) populations at the energy level under saturation excitation. Within 1.1 μs excitation, the various energy levels within the Er3+ ion can form effective electron populations and known multiband emissions can occur in all.
The effective populations can be established at each energy level in the Er3+ ion within 1.1 μs after ns-pulsed excitation. As shown in Fig. 3b, the transient spectra within 45 μs after excitation show a more distinct multiband UCL throughout this time. Moreover, we observe the transient spectrograms over a longer time range. As shown in Fig. 6, we can observe that the multi-band UCL fades with time after ns-pulsed excitation. In the late stage of the UCL decay, the main emission peaks of UCL are still at 522 nm, 542 nm, and 654 nm. In the time range of 150–200 μs after ns-pulsed laser excitation, multiband UCL is already difficult to observe. While the emission at 522 nm, 542 nm, and 654 nm can still be observed at 450–500 μs after ns-pulsed laser excitation. The total intensities of these three emissions over time are significantly higher than the total intensities of the other emissions in multiband UCL. This explains the insignificance of the multi-band emission at a longer integration time under ns-pulsed laser excitation, which is shown in Fig. 2. We attribute this phenomenon to the high irradiation power density and low total energy of the ns-pulsed laser excitation mode. After a single UC MC is ns-pulsed excited, many photons are absorbed by the Yb3+ ion for a short time, and many electrons transition to 2F5/2. Then, many electrons relax in the high-energy state of the Yb3+ ion, and the ET process is stronger currently, which generates the efficient multiband UCL of Er3+ ions. When the relaxation of electron population on the total Yb3+ ion weakens, the ET process gradually diminishes, and the multiband UCL disappears.
 | ||
| Fig. 6 Superimposed on the transient fluorescence spectrum at the same moment in time, the spectra were all acquired as a superimposition of the spectra of 500 transients. The 0 moment is the starting point of the pulsed excitation. The time spectrum acquired with an integration time of 50 μs. | ||
Conclusions
In summary, we investigated the nanosecond kinetic processes of multiband UCL from single β-NaYF4 MCs based on our self-built OT-TRPLS platform. The efficient multiband UCL and SPEM are successfully observed through the high temporal time resolution and minimum 100 ns integration duration. We have obtained the evolution of the kinetic multiband UCL spectra from the single MCs. Even with the SPEM phenomenon, there is still a certain emission sequence of UCL emissions, which indicates that different UCL emissions originate from different photophysical pathways. We further derived the photophysical pathways of the emitting UCL based on the sequence of appearance of the UCL at different wavelengths. We find that pathway B runs slowly (limited by the nRP transition of 4I11/2 → 4I13/2) and pathway A can achieve efficient UCL emission faster. In addition, pathway A would provide populations for path B to generate multiband UCL, which would facilitate the realization of pathway B. Our study will improve the understanding of the kinetic process of multiband UCL and promote its application.Conflicts of interest
There are no conflicts of interest to declare.Acknowledgements
We acknowledge the financial support from the Science and Technology Innovation Program of Hunan Province (2021RC3074). We are also thankful for the discussions with Dr Zhongyang Xing, Dr Jiangbin Zhang and Dr Tongcheng Yu.Notes and references
- F. Auzel, Chem. Rev., 2004, 104, 139–173 CrossRef CAS PubMed.
- S. Chen, A. Z. Weitemier, X. Zeng, L. He, X. Wang, Y. Tao, A. J.-Y. Huang, Y. Hashimotodani, M. Kano, H. Iwasaki, L. K. Parajuli, S. Okabe, D. B.-L. Teh, A. H. All, I. Tsutsui-Kimura, K. F. Tanaka, X. Liu and T. J. McHugh, Science, 2018, 359, 679–684 CrossRef CAS PubMed.
- S. H. Nam, Y. M. Bae, Y. I. Park, J. H. Kim, H. M. Kim, J. S. Choi, K. T. Lee, T. Hyeon and Y. D. Suh, Angew. Chem., Int. Ed., 2011, 50, 6093–6097 CrossRef CAS PubMed.
- Y. Zhang, L. Huang and X. Liu, Angew. Chem., Int. Ed., 2016, 55, 5718–5722 CrossRef CAS PubMed.
- P. Zhang, H. Chen, Y. Yang, D. Zhao, Z. Jia, K. Zheng, G. Qin and W. Qin, J. Alloys Compd., 2018, 753, 725–730 CrossRef CAS.
- L. Liang, Y. Liu, C. Bu, K. Guo, W. Sun, N. Huang, T. Peng, B. Sebo, M. Pan, W. Liu, S. Guo and X. Z. Zhao, Adv. Mater., 2013, 25, 2174–2180 CrossRef CAS PubMed.
- T. Sun, X. Chen, L. Jin, H.-W. Li, B. Chen, B. Fan, B. Moine, X. Qiao, X. Fan, S. Tsang, S. F. Yu and F. Wang, J. Phys. Chem. Lett., 2017, 8, 5099–5104 CrossRef CAS.
- K. Suresh, A. Bankapur, S. Chidangil, H. Madhyastha, K. Sa-kai and S. D. George, J. Mater. Chem. C, 2021, 9, 8606–8614 RSC.
- H. Li, F. Wei, Y. Li, M. Yu, Y. Zhang, L. Liu and Z. Liu, J. Mater. Chem. C, 2021, 9, 14757–14765 RSC.
- J. M. Meruga, A. Baride, W. Cross, J. J. Kellar and P. S. May, J. Mater. Chem. C, 2014, 2, 2221–2227 RSC.
- Y. Zhang, L. Zhang, R. Deng, J. Tian, Y. Zong, D. Jin and X. Liu, J. Am. Chem. Soc., 2014, 136, 4893–4896 CrossRef CAS PubMed.
- Y. Liu, Y. Lu, X. Yang, X. Zheng, S. Wen, F. Wang, X. Vidal, J. Zhao, D. Liu, Z. Zhou, C. Ma, J. Zhou, J. A. Piper, P. Xi and D. Jin, Nature, 2017, 543, 229–233 CrossRef CAS PubMed.
- Q. Zhan, H. Liu, B. Wang, Q. Wu, R. Pu, C. Zhou, B. Huang, X. Peng, H. Ågren and S. He, Nat. Commun., 2017, 8, 1058 CrossRef PubMed.
- J. Chen, Y. Peng, X. Li, W. Chen, H. Huang, L. Lin and D. Chen, J. Mater. Chem. C, 2019, 7, 4109–4117 RSC.
- X. Chen, L. Jin, W. Kong, T. Sun, W. Zhang, X. Liu, J. Fan, S. F. Yu and F. Wang, Nat. Commun., 2016, 7, 10304 CrossRef CAS PubMed.
- H. Zhu, X. Chen, L. M. Jin, Q. J. Wang, F. Wang and S. F. Yu, ACS Nano, 2013, 7, 11420–11426 CrossRef CAS.
- F. Wang and X. Liu, J. Am. Chem. Soc., 2008, 130, 5642–5643 CrossRef CAS PubMed.
- C. Ou, X. Ding, Y. Li, C. Zhu, M. Yu, L. Xie, J. Lin, C. Xu and W. Huang, J. Phys. Chem. C, 2017, 121, 14803–14810 CrossRef CAS.
- T. Riuttamäki, I. Hyppänen, J. Kankare and T. Soukka, J. Phys. Chem. C, 2011, 115, 17736–17742 CrossRef.
- Y. Wang, K. Liu, X. Liu, K. Dohnalová, T. Gregorkiewicz, X. Kong, M. C.-G. Aalders, W. J. Buma and H. Zhang, J. Phys. Chem. Lett., 2011, 2, 2083–2088 CrossRef CAS.
- S. Han, Z. Yi, J. Zhang, Q. Gu, L. Liang, X. Qin, J. Xu, Y. Wu, H. Xu, A. Rao and X. Liu, Nat. Commun., 2021, 12, 3704 CrossRef CAS PubMed.
- S. Han, R. Deng, Q. Gu, L. Ni, U. Huynh, J. Zhang, Z. Yi, B. Zhao, H. Tamura, A. Pershin, H. Xu, Z. Huang, S. Ahmad, M. Abdi-Jalebi, A. Sadhanala, M. L. Tang, A. Bakulin, D. Beljonne, X. Liu and A. Rao, Nature, 2020, 587, 594–599 CrossRef CAS PubMed.
- F. Vetrone, R. Naccache, V. Mahalingam, C. G. Morgan and J. A. Capobianco, Adv. Funct. Mater., 2009, 19, 2924–2929 CrossRef CAS.
- J. Kim, R. Chacón, Z. Wang, E. Larquet, K. Lahlil, A. Leray, G. Colas-des-Francs, J. Kim and T. Gacoin, Nat. Commun., 2021, 12, 1943 CrossRef CAS PubMed.
- P. Rodríguez-Sevilla, L. Labrador-Páez, D. Wawrzyńczyk, M. Nyk, M. Samoć, A. K. Kar, M. D. Mackenzie, L. Paterson, D. Jaque and P. Haro-González, Nanoscale, 2016, 8, 300–308 RSC.
- P. Rodríguez-Sevilla, H. Rodríguez-Rodríguez, M. Pedroni, A. Speghini, M. Bettinelli, J. G. Solé, D. Jaque and P. Haro-González, Nano Lett., 2015, 15, 5068–5074 CrossRef PubMed.
- M. Yuan, R. Wang, C. Zhang, Z. Yang, W. Cui, X. Yang, N. Xiao, H. Wang and X. Xu, J. Mater. Chem. C, 2018, 6, 10226–10232 RSC.
- X. Zhou, X. Xia, B. E. Smith, M. B. Lim, A. B. Bard, A. Pant and P. J. Pauzauskie, ACS Appl. Mater. Interfaces, 2019, 11, 22817–22823 CrossRef CAS PubMed.
- K. Nomura, M. Umezawa, K. Tezuka, T. Tasaki, K. Okubo and K. Soga, J. Lumin., 2021, 239, 118394 CrossRef CAS.
- D. G. Grier, Nature, 2003, 424, 810–816 CrossRef CAS PubMed.
- O. Aarøen, E. Riccardi and M. Sletmoen, RSC Adv., 2021, 11, 8730–8740 RSC.
- S. Wang, B. Chen, A. Itagaki, F. Ishiwari, T. Fukushima, H. Masuhara and T. Sugiyama, J. Mater. Chem. C, 2021, 9, 7545–7554 RSC.
- X. Wang, S. Chen, Y. T. Chow, C. Kong, R. A. Li and D. Sun, RSC Adv., 2013, 3, 23589 RSC.
- Y. Kang, B. Zheng, C. Li, Z. Zhang, H. Tang, Q. Wu and D. Pang, Anal. Chem., 2020, 92, 1292–1300 CrossRef CAS PubMed.
- P. Rodríguez-Sevilla, Y. Zhang, P. Haro-González, F. Sanz-Rodríguez, F. Jaque, J. G. Solé, X. Liu and D. Jaque, Adv. Mater., 2016, 28, 2421–2426 CrossRef PubMed.
- I. T. Leite, S. Turtaev, X. Jiang, M. Šiler, A. Cuschieri, P. S.-J. Russell and T. Čižmár, Nat. Photonics, 2017, 12, 33–39 CrossRef.
- F. Frenzel, C. Würth, O. Dukhno, F. Przybilla, L. M. Wiesholler, V. Muhr, T. Hirsch, Y. Mély and U. Resch-Genger, Nano Res., 2021, 14, 4107–4115 CrossRef CAS.
- A. Teitelboim, B. Tian, D. J. Garfield, A. Fernandez-Bravo, A. C. Gotlin, P. J. Schuck, B. E. Cohen and E. M. Chan, J. Phys. Chem. C, 2019, 123, 2678–2689 CrossRef CAS.
- T. A. Laurence, Y. Liu, M. Zhang, M. J. Owen, J. Han, L. Sun, C. Yan and G. Liu, J. Phys. Chem. C, 2018, 122, 23780–23789 CrossRef CAS.
- X. Zhang, R. Gao, Z. Wang, Y. Zhang, Y. Hu, L. Sun, L. Fu, X. Ai and J. Zhang, Chem. Phys. Lett., 2021, 779, 1388880 CrossRef.
- Y. Han, J. Yang, S. Wang, Z. Cheng, F. Song and T. Liu, J. Lumin., 2021, 236, 118114 Search PubMed.
- D. V. Pominova, A. V. Ryabova, K. G. Linkov, I. D. Romanishkin, S. V. Kuznetsov, J. A. Rozhnova, V. I. Konov and V. B. Loschenov, Laser Phys., 2016, 26, 084001 CrossRef.
- G. Yao, C. Lin, Q. Meng, P. S. May and M. T. Berry, J. Lumin., 2015, 160, 276–281 CrossRef CAS.
- C. Renero-Lecuna, R. Martín-Rodríguez, R. Valiente, J. González, F. Rodríguez, K. W. Krämer and H. U. Güdel, Chem. Mater., 2011, 23, 3442–3448 CrossRef CAS.
- R. T. Wegh, E. V.-D. Van Loef, G. W. Burdick and A. Meijerink, Mol. Phys., 2003, 101, 1047–1056 CrossRef CAS.
- D. K. Sardar, J. B. Gruber, B. Zandi, J. A. Hutchinson and C. W. Trussell, J. Appl. Phys., 2003, 93, 2041–2046 CrossRef CAS.
- D. G. O'Shea, J. M. Ward, B. J. Shortt, M. Mortier, P. Féron and S. N. Chormaic, EPJ Appl. Phys., 2007, 40, 181–188 CrossRef.
- Z. X. Cheng, S. J. Zhang, F. Song, H. C. Guo, J. R. Han and H. C. Chen, J. Phys. Chem. Solids, 2002, 63, 2011–2017 CrossRef CAS.
- X. Chen, E. Ma and G. Liu, J. Phys. Chem. C, 2007, 111, 10404–10411 CrossRef CAS.
- E. Lee, M. Jung, Y. Han, G. Lee, K. Shin, H. Lee and K. T. Lee, J. Phys. Chem. C, 2017, 121, 21073–21079 CrossRef CAS.
- K. Shin, T. Jung, E. Lee, G. Lee, Y. Goh, J. Heo, M. Jung, E. Jo, H. Lee, M. Kim and K. T. Lee, Phys. Chem. Chem. Phys., 2017, 19, 9739–9744 RSC.
- C. Lee, H. Park, W. Kim and S. Park, Phys. Chem. Chem. Phys., 2019, 21, 24026–24033 RSC.
- T. Jung, H. L. Jo, S. H. Nam, B. Yoo, Y. Cho, J. Kim, H. M. Kim, T. Hyeon, Y. D. Suh, H. Lee and K. T. Lee, Phys. Chem. Chem. Phys., 2015, 17, 13201–13205 RSC.
- M. T. Berry and P. S. May, J. Phys. Chem. A, 2015, 119, 9805–9811 CrossRef CAS PubMed.
- R. B. Anderson, S. J. Smith, P. S. May and M. T. Berry, J. Phys. Chem. Lett., 2014, 5, 36–42 CrossRef CAS PubMed.
Footnotes |
| † Electronic supplementary information (ESI) available. See DOI: https://doi.org/10.1039/d2tc01288j |
| ‡ These authors contributed equally to this work and should be considered co-first authors. |
| This journal is © The Royal Society of Chemistry 2022 |