
 Open Access Article
 This Open Access Article is licensed under a Creative Commons Attribution-Non Commercial 3.0 Unported Licence
Scintillating thin film design for ultimate high resolution X-ray imaging†
Laura
Wollesen
 ab,
Federica
Riva
ab,
Paul-Antoine
Douissard
a,
Kristof
Pauwels
a,
Thierry
Martin
a and
Christophe
Dujardin
*b
ab,
Federica
Riva
ab,
Paul-Antoine
Douissard
a,
Kristof
Pauwels
a,
Thierry
Martin
a and
Christophe
Dujardin
*b
aESRF – The European Synchrotron, 71 avenue des Martyrs, 38000 Grenoble, France
bInstitut Lumière Matière, UMR5306 Université Lyon 1-CNRS, Université de Lyon, 69622 Villeurbanne cedex, France. E-mail: christophe.dujardin@univ-lyon1.fr
First published on 16th May 2022
Abstract
Thin single crystalline film (SCF) scintillators are essential when performing high resolution X-ray imaging with micron to sub-micron resolution. Especially when high energy X-rays are required for the experiment, the absorption efficiency is reduced considerably due to the limited thickness of the SCF. The absorption efficiency can be maximized by tailoring the SCF to have a high density and effective Z number. However, the quest to find these optimized scintillators is both time consuming and expensive when performing material screening. By combining simulations performed using the Geant4 package with subsequent analytical calculations, we propose an efficient simulation tool. Geant4 simulations predict the spatial distribution of the deposited energy in the SCF and the analytical calculations mimic the blurring introduced by the microscope optics. Using our simulation method, we evaluated the performances of a selection of scintillating screens, extending from state-of-the-art to various potential scintillators for incoming X-rays with energies between 5 and 100 keV. To efficiently evaluate and compare the performance of (potential) scintillators for high resolution X-ray imaging experiments, we propose a figure of merit, which includes the modulation transfer function at 500 lp mm−1 (corresponding to 1 μm features) and the energy deposited in the SCF. Our simulations also demonstrate the crucial role of the substrate for the spatial resolution performance of the device.
Introduction
X-ray imaging techniques applied at synchrotron sources are powerful tools to investigate 3D structures without using destructive analysis. Two-dimensional pixelized detectors are today preferred for imaging experiments,1,2 but also for many other X-ray applications like absorption3 and various scattering experiments.1,2,4 Current X-ray imaging techniques can by coupling optics with the detector resolve micrometer details even of dense and/or large specimens such as fossils.5,6 A spectacular example that displays the performance of such a technique was recently presented. Intact human organs, such as a covid infected lung, were successfully imaged using hierarchical phase contrast tomography.7 By first scanning the whole lung with low resolution and subsequently going to higher resolution for the interesting areas regional changes in the tissue architecture of the covid infected lung was identified. For this experiment, the smallest voxel size was 2 μm, which was sufficient to resolve the desired features at X-ray energies up to 78 keV. High X-ray energies are indeed required in such experiments in order to penetrate large (or very dense) specimens and reduce the sample absorption, which is otherwise detrimental to the phase contrast. Many X-ray imaging experiments often require a detector system with spatial resolution down to micrometer or even sub-micrometer scale. In addition, it must be efficient over a wide range of X-ray energies and X-ray fluxes to be applicable for different types of samples demanding low to very high X-ray energies to fit the requirements in terms of X-ray penetration in the object. Detectors based on an indirect X-ray detection scheme are the only candidates potentially meeting these challenging criteria. They combine a converter screen, microscope optics and an imaging Charged Coupled Device (CCD) or Complementary metal–oxide–semiconductor (CMOS) camera.8,9 The converter screen is a scintillator, which absorbs X-ray photons and converts them into multiple optical photons, generally UV or visible. An optical image is thus formed, which is enlarged by the optics and finally projected through the lenses onto the camera. Scintillators can be produced from a variety of materials and technologies. Powders or ceramic phosphors, such as Gd2O2S:Tb10 (often referred to as GOS, Gadox or P43), are often the most economical solution. They can provide a large field of view but do not combine efficiency and spatial resolution because of their diffusive aspect. Crystalline microcolumnar scintillators allow for a thick scintillator and thereby an increased absorption efficiency at high X-ray energies while maintaining a decent spatial resolution. Nevertheless, existing technologies, such as microcolumnar CsI:Tl11 and microstructured CsI:Tl screens,12 do not currently reach micrometer spatial resolution. In order to reach micrometer to sub-micrometer spatial resolution in X-ray imaging experiments, single crystalline film (SCF) scintillators are therefore required.8,9,13 This could either be scintillators grown by liquid phase epitaxy14–18 or polished wafers.19 In this case, it is crucial that the film thickness remains in the order of the depth of focus of the optics, otherwise the image will be partly out of focus reducing the resolution. However, reducing the film thickness decreases the X-ray absorption in the SCF considerably. The optimum SCF scintillator thickness is therefore a balance between the desired SCF X-ray absorption efficiency and spatial resolution both with respect to the applied X-ray beam energies. The absorption efficiency of scintillators is proportional to the density and effective atomic number of the material,9 which is why in high resolution X-ray imaging communities there is an ongoing quest for thin films fulfilling these criteria.The European Synchrotron Radiation Facility (ESRF) recently upgraded its storage ring to become the first high energy 4th generation synchrotron source in operation, the Extremely Brilliant Source (ESRF-EBS).20 This upgrade led to drastic improvements in both coherence and brilliance of the source. As a result, the synchrotron beamlines are able to run experiments at higher X-ray energies (e.g. up to 350 keV at the new BM18 EBSL3 beamline,21 ESRF) following the 10 to 100-fold gain in X-ray flux. In order to fully exploit the possibilities offered by this new generation of synchrotrons and reach the ultimate performance of the scintillators by combining optimized spatial resolution and stopping power, investigation of a new generation of SCF scintillators is now required. Unfortunately the variety of parameters to take into account, combined with varying experimental conditions at the beamlines render the material screening not efficient.
Because preparing real scintillating screens is time and money consuming, we propose in this contribution an efficient simulation tool, which combines the spatial distribution of the deposited energy in SCFs and the impact of the optical transfer for various numerical apertures of the optics. Experiments have been performed to validate our approach. As a result, we define a figure of merit evaluating (potential) scintillator screens and propose a selection of optimal SCFs for various X-ray energy configurations for high resolution X-ray imaging experiments at synchrotrons. We also identify the crucial role of choosing the X-ray energy in relation to the K-edge energies of elements comprised in the SCF as well as the substrate, which both have a huge impact on the final image resolution and the energy deposition. The simulation tool presented here is a very useful guide for material selection toward the preparation of scintillating SCFs showing ultimate performances in the field of high resolution X-ray imaging.
Simulation tool
The proposed simulation tool aims at evaluating the X-ray imaging performances of the SCFs focusing on their spatial resolution limitations and X-ray stopping power. The former depends on the absorption processes in the screen combined with the light collection through the optics and the latter on the energy deposition that is driven by the composition and the geometry of the screen, i.e. the SCF film and the substrate. The light yield, as well as the matching of emission wavelength with the cameras spectral sensitivity do not impact the spatial resolution, but only the statistics that can be compensated by increasing the exposure time. In addition, the light yield of scintillators often highly depends on the synthesis method leading potentially to various types of defects, impurities. For the state-of-the-art SCF scintillators it can therefore vary from sample to sample which cannot be predicted. Because we are focusing our interest to the energy deposition impact on the spatial resolution, we have considered the same proportionality factor between the deposited energy and the number of emitted optical photons.It is based on Geant4, a well-established Monte Carlo simulation package22 and subsequent analytical calculations. Geant4 is predicting the spatial distribution of deposited energy in the SCF, which is a result of the material interacting with the incoming monochromatic X-rays. This results in a mapping of the deposited energy that provides the ultimate scintillator response. Analytical calculations then compute the blurring by optical transport of the resulting image including diffraction of light and out-of-focus contributions. The resulting Line Spread Function (LSF) and Modulation Transfer Function (MTF) can then be extracted. We assume to be in a configuration where the camera itself does not influence the spatial resolution, which is the case when the effective pixel size and pitch are significantly smaller than the resolution limit. An overall scheme representing the applied principles is presented in Fig. 1 and each step will be evaluated in the following sections.
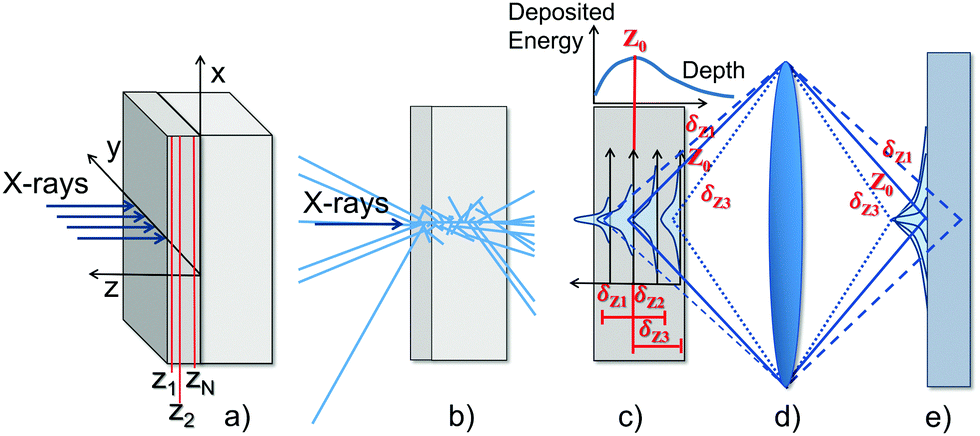 | ||
| Fig. 1 Schematic presentations of: (a) Geometry and axis conversion applied in the simulation tool. (b) Geant 4, Monte Carlo simulation tracking the incident X-rays and the resulting secondary particles. The tracking reveal the spatial distribution of deposited energy in the SCF, which (we assume) correspond to the scintillator response. (c) Matrix describing the energy distribution for the depth of the scintillator. (d) Optics blurring estimated by taking the output from the simulation and use it as input for the analytical calculations. (d) Final response on the detector assumed as the sum of the response to every plane in the scintillator. | ||
Since we are targeting high resolution imaging at synchrotron, the simulations are performed using monochromatic X-rays at various energies (5–100 keV). In the case of fast or ultrafast imaging where the resolution can be compromised a pink beam (non-monochromatic X-ray beam) can be applied to obtain a higher X-ray flux.23 However, this is out of scope for this study but could easily be implemented in the tool for a future new study.
Geant4 configuration
The SCF geometry is defined as a rectangular box of thickness tS and a lateral length of 1.4 cm. For consistency, all simulations presented in this study were performed with tS = 5 μm. The SCF is supported by a second 150 μm thick box representing the substrate corresponding to the currently applied substrates in high resolution X-ray imaging. The SCF has a surface normal to the incoming X-ray beam along the z-axis and when running the simulation a monochromatic one-dimensional X-ray beam distributed along the y-direction hits the SCF perpendicularly to its surface (see Fig. 1a).For the energy deposition mapping, the size of the bins is defined as 0.1 μm in the x-direction and 0.2 μm in the z-direction. These bin sizes are a compromise between resolution and noise. In addition, since solid state aspects such as phonons and exciton migrations are not included in the Geant4 simulations a too small bin size could compromise the accuracy of the results. Due to the symmetry of the geometry no binning is set in the y-direction. The low energy Livermore Physics model24,25 was selected for the simulations. Every primary X-ray and generated secondary cascading particle are tracked individually (see Fig. 1b) with a production threshold for secondary particles at 250 eV. This threshold is not critical for our model since we are studying a diffraction-limited resolution, which is larger than the attenuation length of electrons at 250 eV.
The materials applied for the SCFs and substrates are defined by the density and the elemental stoichiometry. Depending on these two parameters the program estimates the probability of a particle traveling in the material to interact with a specific kind of atom and potentially deposit energy, while the concepts of crystals, namely the electronic band structure as well as phonons, are not included. For the state-of-the-art scintillators: GGG, LSO and LAG, the relevant λemis when they are doped with their usual dopants: GGG:Eu, LSO:Tb and LAG:Ce are applied. For the prospective scintillating SCFs, the λemis was chosen to be 615 nm. The emission from different dopants is rarely just one wavelength but for the sake of simplicity of the optics calculations (described in next section) the commonly most intense or relevant emission wavelength for the specific dopant has been used. In the case of Europium the two main peaks are usually 595 and 710 nm but a wavelength of 615 nm was applied as a compromise. A list of all the materials and the information applied for the simulations and optics calculations (stoichiometry, density, λemis, refractive index) are summarized in Table 1.
| Name | Short name | Chemical formula | Dopant | λ emis [nm] | Density [g cm−3] | n | Substrate |
|---|---|---|---|---|---|---|---|
| Gd–Al–Perovskite | GAP | GdAlO3 | Eu | 615 | 7.50 | 1.97 | YAP |
| Lu–Oxide | Lu2O3 | Lu2O3 | Eu | 615 | 9.50 | 1.935 | Lu2O3 |
| Lu–Orthosilicate | LSO | Lu2SiO5 | Tb | 550 | 7.40 | 1.82 | YbSO |
| Lu–Al–Garnet | LAG | Lu3Al5O12 | Ce | 540* | 6.73 | 1.84 | YAG |
| Gd–Ga–Garnet | GGG | Gd3Ga3O12 | Eu | 615 | 7.10 | 1.97 | GGG |
| Gd–Lu–Al–Perovskite | GdLuAP | Gd0.5Lu0.5AlO3 | Eu | 615 | 8.00 | 1.935 | YAP |
| Pb–Titanate | PTO | PbTiO3 | Eu | 615 | 7.95 | 2.70 | SrTiO3 |
The energy map provided by Geant4, is a two-dimensional matrix containing the spatial distribution of the energy deposited in the SCF. Every line corresponds to the LSF obtained at a different depth (zi) in the SCF (Fig. 1c). The LSF and MTF as a function of the z-coordinate, the total LSF and MTF (without any consideration of the optical effects) can be deduced, as well as the energy deposited in the SCF as a function of depth (Edep(zi)).
Optics calculations
The modelling of the optical transport to the camera is based on the analytical model described by Hopkins,26 which calculates the response of an aberration-free optical system. Taking into account the diffraction of light and the defect of focus (δz), the optical transfer function (OTF) of a defocused optical system is calculated as a convergent series of Bessel functions. The image from each plane is blurred by the optics as a function of the position of the plane along the thickness of the SCF (Fig. 1d). Assuming the system is focused at a certain position, z0 (the focal plane), the planes within a thickness dz equal to the depth of field (DoF), around z0 are projected as a focused image and thus only blurred by the diffraction of light. The planes outside dz are additionally blurred as a function of the distance from z0 (denoted δz). The total MTF is then calculated as the average of every plane in the SCF, weighted by the deposited energy in the ith slice (Edepi) while assuming the system is focused on the jth bin in z: | (1) |
Results and discussion
Investigated materials
The materials under investigation in this study are the state-of-the-art SCF scintillators (formulas and applied parameters are given in Table 1): LSO:Tb on YbSO, GGG:Eu on GGG and freestanding LAG:Ce that are intensively applied on X-ray imaging beamlines.27 LAG:Ce can also be grown by Liquid Phase Epitaxy (LPE) on YAG substrates17 and for the sake of comparing the different SCFs it is here simulated on a YAG substrate. Furthermore, the three more recently explored high density SCFs: Lu2O3:Eu on undoped Lu2O3,28 GAP:Eu on undoped YAP29 and PbTiO3:Eu on undoped SrTiO3 are included as prospective materials for ultimate high density SCFs.Energy deposition
As discussed above, achieving ultimate spatial resolution (∼1 μm or better) requires SCFs of thickness thinner than 10 μm rendering the X-ray absorption critical, especially when applying high energy X-rays. The X-ray absorption efficiency affects the Detective Quantum Efficiency (DQE) of the system and should therefore be considered when examining the overall performance of SCF potential scintillators.In low dimensional systems, the effective energy deposition differs from the attenuated energy due to the escape of X-ray fluorescence and even hot electrons and Auger electrons in the particular case of nanoscintillators.30,31 The effective energy deposited in the investigated SCFs has been extracted from our simulations at X-ray energies from 15 to 100 keV (Fig. 2b). Its comparison to the attenuated energy in the freestanding SCFs using the photon cross section database from NIST32 (Fig. 2a) highlights notable differences at high energy, mainly at energies higher than the K-edge, where the escape of secondary X-rays increases for both the film and substrate.
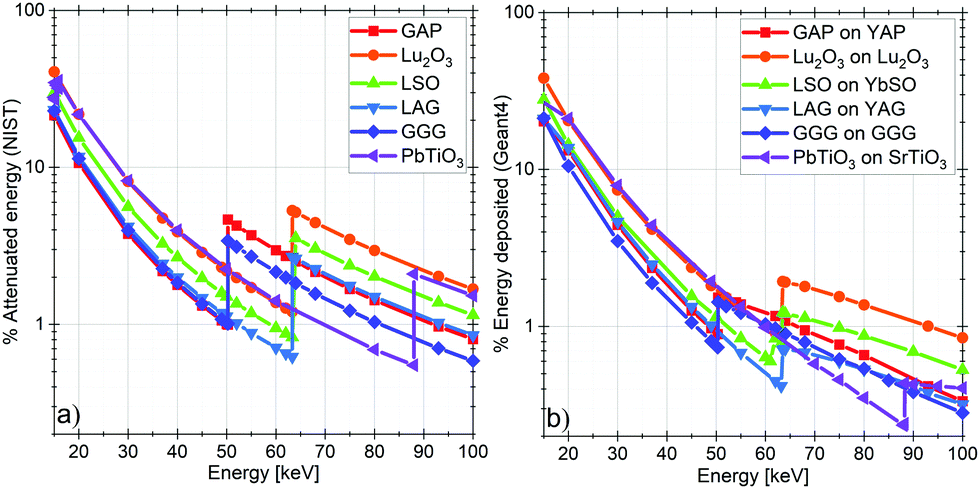 | ||
| Fig. 2 (a) Percentage of the incident beam energy attenuated by various kinds of 5 μm thick SCFs, calculated using data from the NIST database.32 (b) Percentage of the incident beam energy deposited in various 5 μm SCFs supported by 150 μm substrates, calculated by tracking all the secondary X-rays and electrons using our application based on the Monte Carlo Geant4 toolkit. | ||
The attenuation as computed from the photon cross section provides a fair approximation of the effective deposited energy at X-ray energies below the K-edge energies of the high Z elements comprised in the SCF. When the X-ray energy exceeds these K-edge energies in the SCF, the modelling of X-ray fluorescence photons is thus needed to obtain an accurate estimate of the energy deposit. Secondary X-rays can indeed easily escape the thin SCF and do thereby not deposit their energy in the SCF. On the opposite, when the X-ray photons interact in the substrate, the secondary particles generated there can possibly reach the SCF and deposit energy, potentially far from the primary interaction.
Spatial resolution and contrast
The MTF describes the spatial response of a system by combining the concept of resolution and contrast. The spatial resolution of a system quantifies the smallest features that can be fully resolved. It generally corresponds to the spatial frequency for which the MTF equals ∼10% taking into account the definition of the Rayleigh criteria for the diffraction limit. The contrast or modulation is defined as:33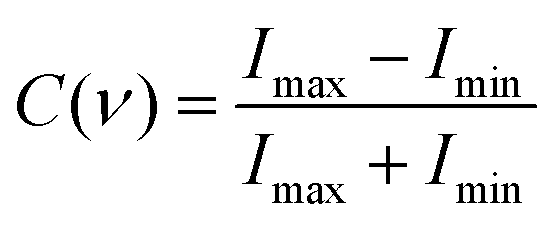 | (2) |
The MTF basically provides the transmission of contrast through the system at different spatial frequencies. The counterpart of the MTF, the LSF is helpful to further understand specific trends in the MTFs because it directly shows the spatial distribution of detected optical photons around the position of the primary interaction between the X-ray photon and the SCF. The energy of the incoming X-rays has a significant impact on the spatial distribution of deposited energy in the SCF and thereby the obtainable spatial resolution and contrast of the final image. Generally, when increasing the X-ray energy, the generated secondary particles deposit energy at an increasing distance from the initial point of interaction, resulting in a decreasing contrast. It is thus crucial to consider the major impacts on the contrast occurring when applying X-rays of energies close to the K-edge of the elements comprised in the SCF and substrate. In the next subsections we will then present and discuss quantitative improvement and degradation of the contrast for a selected set of relevant materials, restricting the description to the energy deposition effect.
Influence of X-ray fluorescence
We performed simulations of the standard SCF, namely LAG:Ce supported by YAG substrate to highlight the effects on the LSF and MTF when imaging is performed with X-ray energies below and above the K-edge of the heaviest element of the substrate (resp. the SCF), here Y at 17.04 keV (resp. Lu at 63.31 keV).As shown in Fig. 3b, increasing the X-ray energy above the substrate K-edge of Y initiates a sharp decrease of ∼20% in contrast. This drop in the MTF close to 0 lp mm−1, corresponds to the increase of the tails in the LSF (Fig. 3a).
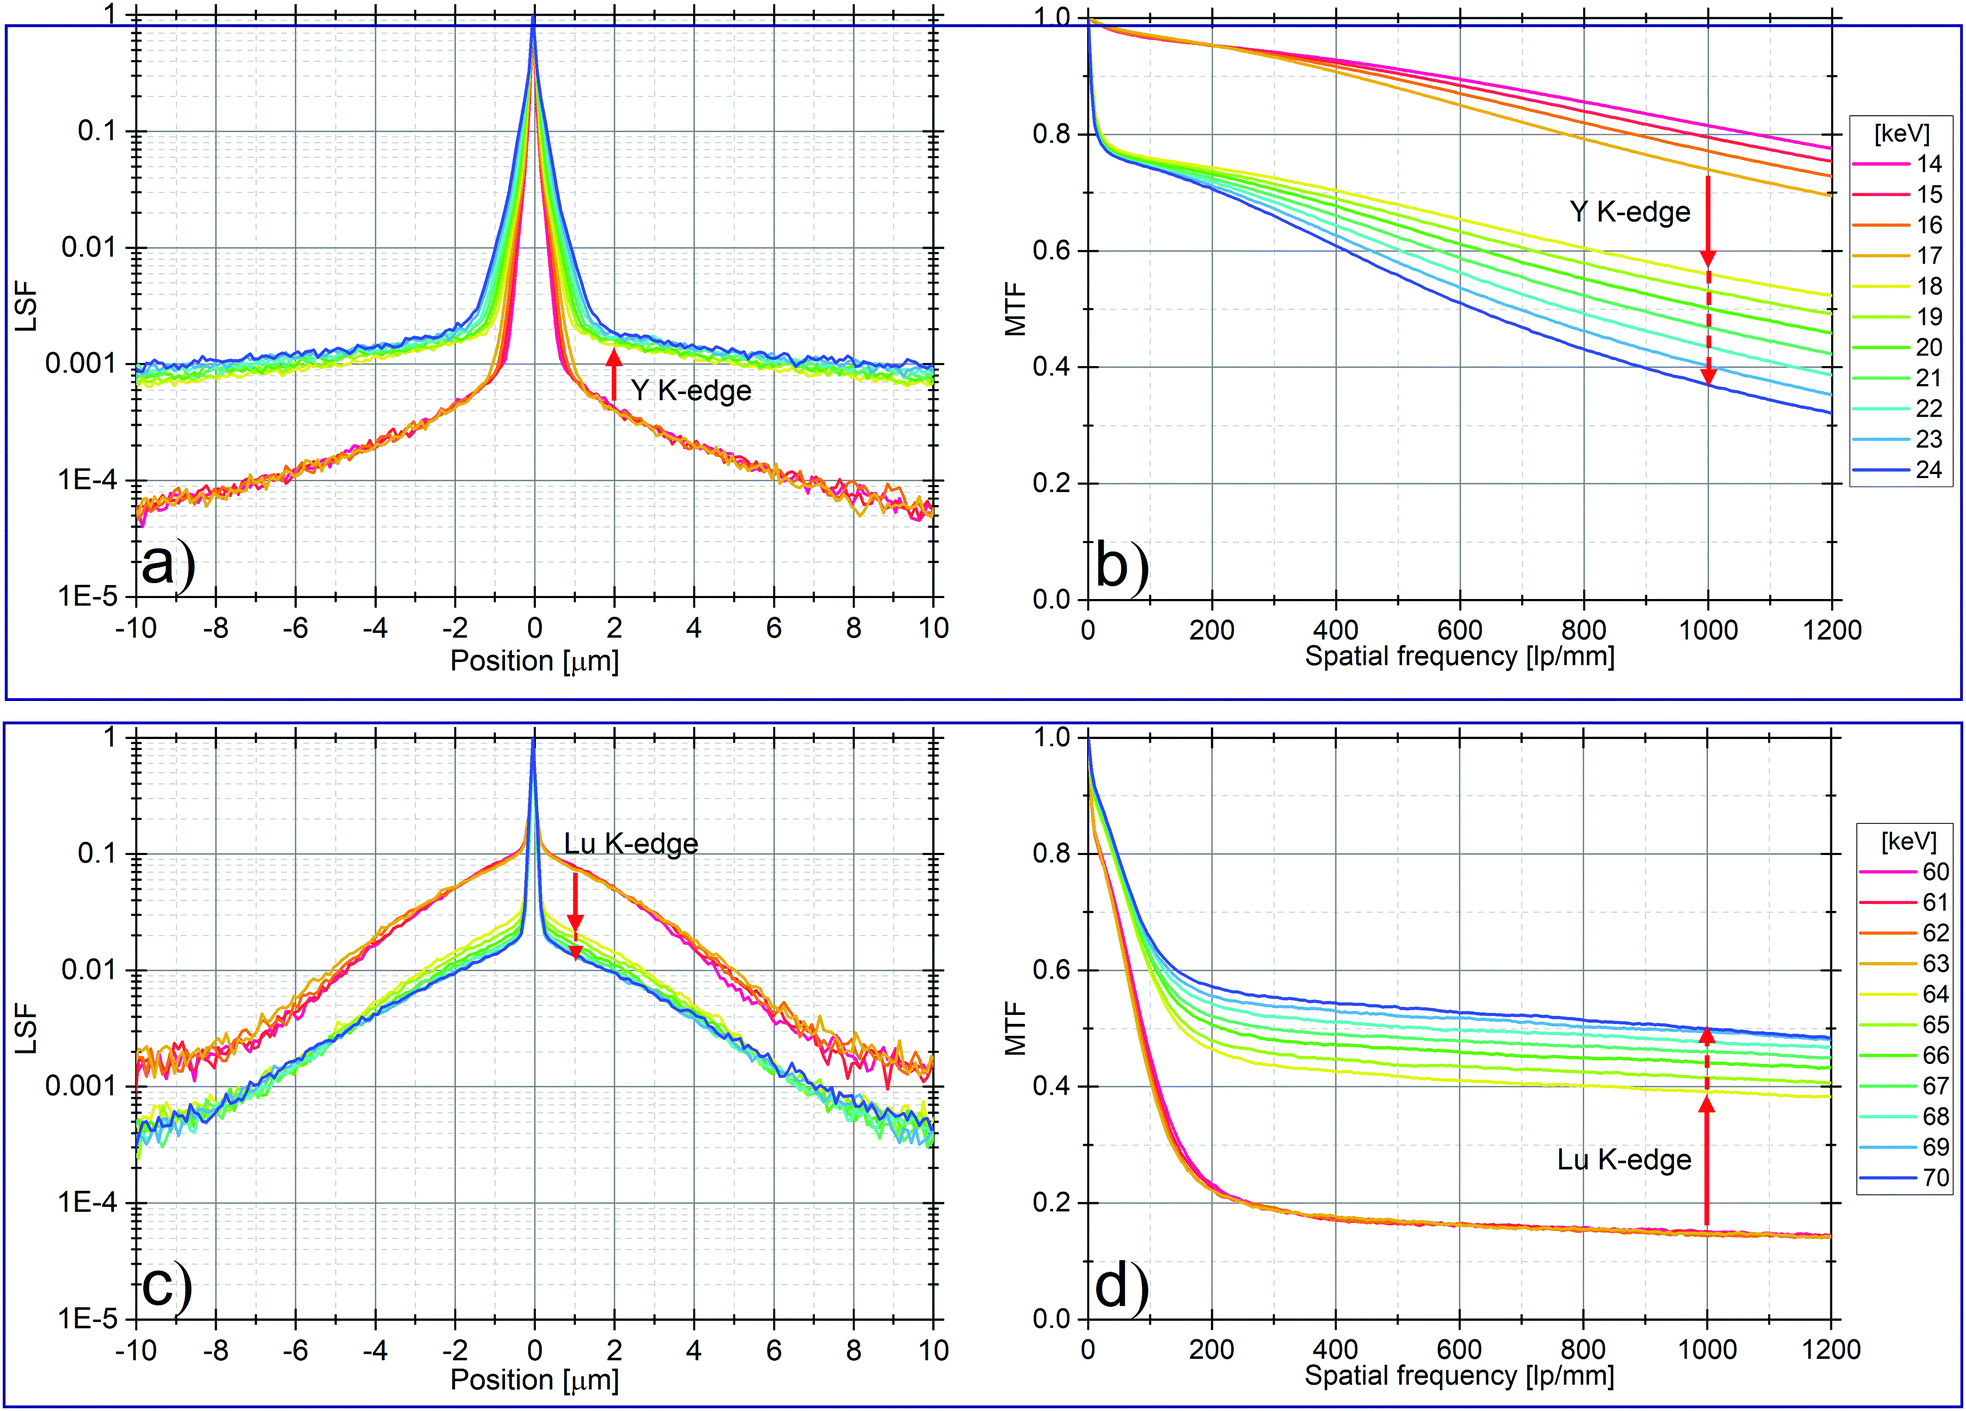 | ||
| Fig. 3 Simulated LSFs (left) and MTFs (right) for a 5 μm LAG:Ce SCF supported by 150 μm YAG substrate. (a and b) X-ray energies from 14 to 24 keV. K-edge energy of Y is 17.04 keV. (c and d) X-ray energies from 60–70 keV. K-edge of Lu is 63.3 keV. | ||
By isolating the contributions from the different particle types of the LSF, we note that a significant number of secondary X-rays deposit energy far from the initial interaction point when the incoming X-ray energy exceed the substrate K-edge. This is in agreement with fluorescent X-rays generated in the substrate and then interacting in the SCF. The isolated LSFs representing the contributions from the different particle types is presented in Fig. S1 (ESI†).
As shown in Fig. 3d, when exceeding the Lu K-edge energy there is a sudden increase in contrast of ∼25% of the MTF. Further increase of the X-ray energy induces a continuous increase in contrast until it stabilizes around 70 keV with an additional gain of ∼10%. In the corresponding LSF (Fig. 3c) the effect is observed as a sudden decrease of the tails followed by a continuous decrease between 0.3 and 4 μm with increasing X-ray energy. The isolated LSFs for the contribution of different particles types are presented in Fig. S2 (ESI†). All types of generated electrons (primary and secondary photoelectrons and resulting electrons from electron–electron scattering) deposit more of their energy very close to the initial point of interaction when exceeding the SCF K-edge.
The sudden decrease of the tails is the result of the increased probability of the photoelectric effect when the incoming X-ray beam have energy above the SCF K-edge. This effect is especially present after normalization of the LSF, which is how to normally display it. The X-ray fluorescence mostly escapes from the SCF and do not contribute considerably to the image. Meanwhile, the photoelectrons have a sufficiently low energy resulting in short attenuation length, leading them to deposit energy very close to the initial point of interaction.
The continuous improvement is caused by photoelectrons created from primary X-ray interactions and subsequent electrons from electron–electron scattering events. We ascribe this effect to the increase of local energy deposition due to the increase of the X-ray beam energy. Indeed, the energy of the primary photoelectron will be ∼0.7 to 6.7 keV (assuming they are created from 64–70 keV primary X-ray photons and the K-shell of Lu) the attenuation length will typically be shorter than 0.5 μm (CSDA, NIST34), thereby containing the resulting energy deposit very close to the initial point of interaction.
Combined influence of SCF and substrate
We demonstrated above the opposite contribution of the SCF and the substrate on the MTF when the X-ray energy exceeds the K-edge of their heaviest element. For some scintillators, the substrate and the host structure of the SCF can be of the same type, such as GGG:Eu supported by undoped GGG substrates. For this particular scintillating screen, we have simulated the LSF and MTF for X-ray energies around 48–58 keV (Gd K-edge at 50.24 keV). Fig. 4 shows that when exceeding the Gd K-edge it combines the two opposite effects, but acting at different frequencies, as observed in the previous section. There is the sharp decrease of the MTF at low frequencies below 150 lp mm−1 caused by the substrate fluorescence, while at higher frequencies the contrast is significantly increased owing to the photoelectrons created in the SCF. When further increasing the X-ray energy, the contrast above ∼200 lp mm−1 is slowly increased due to the increased energy deposition close to the initial point of interaction until it stabilizes and starts to decrease again for higher energies.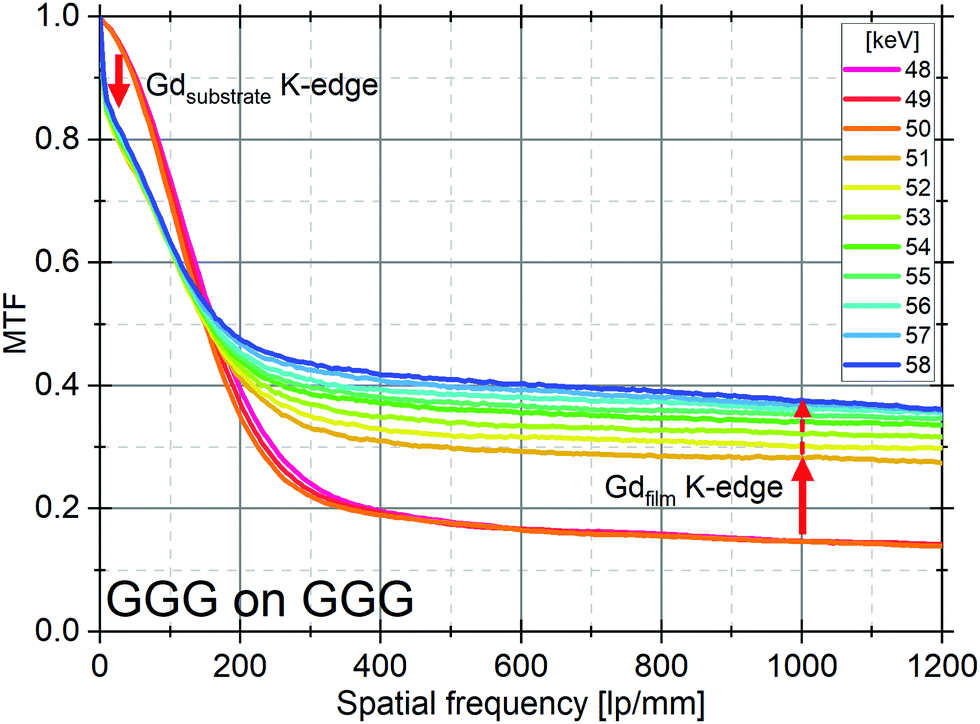 | ||
| Fig. 4 Simulated MTFs for a 5 μm GGG:Eu SCF supported by 150 μm GGG substrate. X-ray energies from 48 to 58 keV. K-edge energy of Gd is 50.24 keV. | ||
When the X-ray energy exceeds the Gd K-edge energy two effects occur. First, the X-ray absorption cross section increases by about one order of magnitude, and second the probability of X-ray fluorescence also drastically increases. If absorption occurs in the substrate, part of the resulting X-ray fluorescence may be reabsorbed far from the primary interaction in the SCF, resulting in degradation of the low frequency contrast. When absorption occurs in the SCF, the dominant effect is the significant improvement of the absorption, generating photoelectrons interacting almost locally due to the small mean free path of such electrons, which corresponds to the ideal situation (high absorption and local energy deposition). Of course, X-ray fluorescence also occurs but its re-absorption will mainly occur out of the SCF. In this latter case, an improved contrast at high frequency is expected, and the degradation of the image is dominated by the optics. Further, the continuous improvement when the X-ray energy increases above the K-edge is caused by the increase of the local energy deposition.
Blurring by optics
The deposited energy is converted into optical photons in the SCF through the scintillation mechanism. Due to the thickness of the SCF, the scintillation “image” is blurred while projected onto the camera by the microscope optics. Fig. 5 demonstrates the significant contribution of this blurring. At low energies especially, the optical blurring strongly degrades the exceptional spatial resolution that would be expected by only taking into account the energy deposit contribution. At high energies however, most of the MTF degradation is caused by the energy distribution in the SCF. Notice at 60 keV the MTF is better for GGG compared to LSO, especially without blurring, since we are above the Gd K-edge but still below the Lu K-edge. In the figure, a numerical aperture (NA) of 0.80 is chosen. For sake of completeness, the influence of the NA at various X-ray energies is presented in Fig. S3 (ESI†).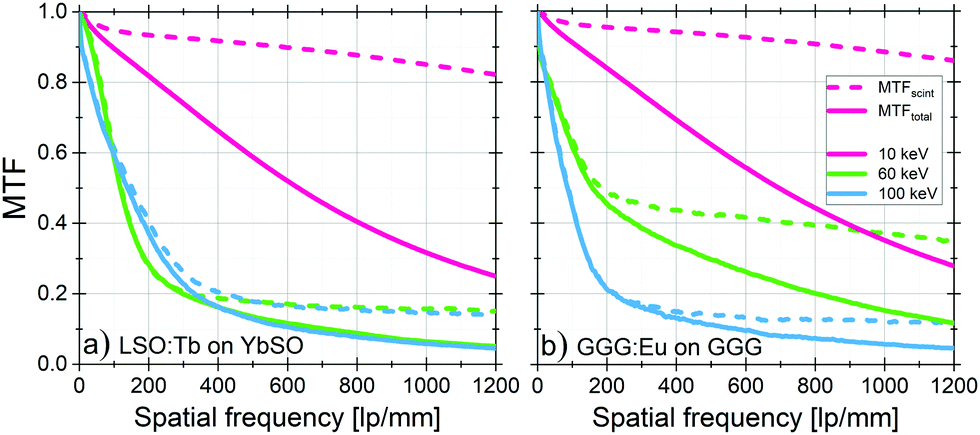 | ||
| Fig. 5 MTFtot (solid lines) and MTFscint (dashed lines) for 5 μm films supported by 150 μm substrates, evaluated for NA = 0.80 at different X-ray energies. The corresponding SCF, substrate and X-ray energies selected for the simulations are indicated in the figure. | ||
Figure of merit
It is not straightforward to evaluate the achievable performance of scintillating screens due to the overwhelming combination of factors which influence it. We thus propose a figure of merit (FoM) in order to estimate the best compromise between a sharp image and an efficient detector: | (3) |
This allows us to evaluate the materials as a function of X-ray energy, while simultaneously considering the spatial resolution, contrast (including blurring by optics) and absorption efficiency. The value of the MTF at 500 lp mm−1 is applied because it describes how well 1 μm sized features are resolved. The performance of the complete detector system will of course be best described by the Detective Quantum Efficiency (DQE).
The figure of merit for the evaluated SCFs are presented at energies from 5 to 100 keV in Fig. 6. We can see that below 50 keV and from 64 to 95 keV, Lu2O3 is material which performs the best, while between 50 keV and 64 keV GAP is superior. PbTiO3 is similar to Lu2O3 between 20 and 50 keV and best above 95 keV.
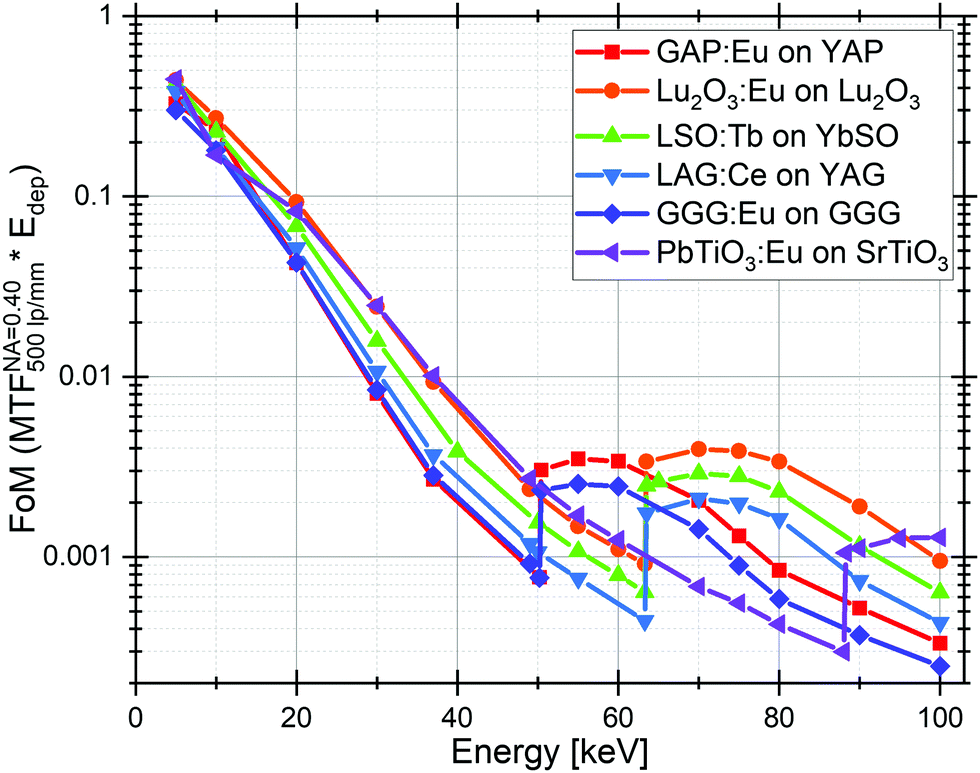 | ||
| Fig. 6 The proposed figure of merit (FoM) calculated from the contrast in the MTF blurred by optics (NA = 0.40) at 500 lp mm−1 and the energy deposited in the SCF. Values are extracted from simulations at X-ray energies from 5–100 keV for 5 μm SCFs supported by 150 μm substrates. | ||
The proposed figure of merit is the appropriate tool for investigating unexplored materials and find better alternatives to the state-of-the-art scintillators. It allows to perform a thorough screening of materials before attempting to produce them but is of course not able to predict if a material will be scintillating in practice. However, this figure of merit gives a limited vision of the potential scintillator performance especially because it only takes into account the MTF for a single spatial frequency (500 lp mm−1). A more fulfilling figure of merit could be created by using an integration of the MTF over all spatial frequencies instead. For illustration, figure of merit are presented at 100 and 1000 lp mm−1 in Fig. S4 (ESI†).
Additionally, to truly examine and compare already existing scintillators one should consider other parameters like the light yield and adequate matching of the emission spectrum with the spectral sensitivity of the applied detector.
Experimental validation
In order to validate the proposed simulation method, MTF of several scintillating SCFs was evaluated experimentally with the slanted edge method.35,36 A 525 μm thick GaAs edge carefully cleaved and positioned 1–3 mm away from the scintillator was used to absorb part of the X-ray beam. Acquired edge images were corrected by flat-field and dark images and the edge spread function (ESF) was computed. Subsequently, the derivative gives the LSF and a Fast Fourier Transform provides the MTF.33 Fig. S5 (ESI†) gives an illustration of the method.The complete detector system comprises: the scintillator under investigation combined with microscope optics (numerical aperture (NA) of 0.4 and 10× magnification) followed by a 3.3× eyepiece magnification and either a PCO2000 camera (Fig. 7a and b) or PCO edge 4.2 (Fig. 7d) having respectively a pixel size of 7.4 μm and 6.5 μm. The measurements were performed using monochromatic synchrotron radiation at the beamline BM05 at the ESRF using a Si(111) crystal with energy resolution of ΔE/E ≈ 10−4.37
 | ||
| Fig. 7 Experimentally measured (continuous lines) and simulated (dashed lines) MTFs for various scintillating SCFs supported by substrates at (a) 16 keV and (b) 18 keV. MTFs obtained from simulations (c) and experiments (d) for an ∼11.5 μm GdLuAP:Eu scintillating SCF supported by 150 μm YAP, at X-ray energies from 16 to 25 keV. All experiments were performed with monochromatic X-ray beam at BM05, ESRF. | ||
Fig. 7a and b show good agreement between simulations and experimental data. As predicted by the simulations, the MTFs of all the considered scintillators are similar at 16 keV (Fig. 7a) while at 18 keV (Fig. 7b) a sudden reduction of the contrast close to 0 lp mm−1 is observed for scintillators with Y-based substrates (K-edge of Y is 17.04 keV). It is noteworthy that some of the experimentally obtained MTFs in Fig. 7 are out-competing the simulations. This can be attributed to the effect of phase contrast which artificially enhances the contrast and thereby the MTF.
In order to further validate the predicted behavior of the MTFs at energies around the substrate K-edge we have applied the slanted edge method on a ∼11.5 μm GdLuAP:Eu SCF supported by 150 μm YAP substrate.29 The experimental MTFs in Fig. 7b found for X-ray energies from 16–25 keV are again in good agreement with the simulations. The MTF undergoes a sharp decrease close to 0 lp mm−1 when exceeding the substrate K-edge energy. When further increasing the X-ray energy, the contrast decreases also as expected. However, when carefully comparing the MTFs from simulations (Fig. 7c) with the experiments (Fig. 7d) a difference up to 15% in contrast is observed. Several reasons can explain this. GdLuAP SCFs are found to undergo birefringence, which degrade the MTF. By rotating the SCF perpendicular to the X-ray beam, the degree of birefringence varies and the optimum MTF affected the least by birefringence can thereby be found.29 The MTFs in Fig. 7(d) is recorded at what we found to be the optimum rotation angle. Since the rotation is manually adjusted the truly optimum angle may not be used, which then results in a slight degradation of the MTF. Furthermore, the YAP substrate scintillates slightly and to filter out this emission a bandwidth filter (634 nm, FWHM: 70 nm) was inserted in the optical path. If part of this emission was not fully filtered out it could have partly degraded the MTF. Also, the observed deviation between simulations and experiments can simply be caused by a slight defect of focus in the optics. The experiment nevertheless confirm in a large extent the observed trends in the simulations.
Conclusion
We presented the principles of our simulation tool based on Geant4 and subsequent analytical calculations and applied it to investigate the behavior of the MTFs especially at X-ray energies close to the K-edges of elements in the SCF and substrate. Exceeding the K-edge energy of an element in the SCF gives rise to an increase in the MTF above ∼200 lp mm−1 whereas for a substrate element the MTF is reduced close to 0 lp mm−1. These trends are assigned to the increased probability of the photoelectric effect combined with short attenuation length of the created photoelectrons and substrate fluorescence, respectively. The latter trend was confirmed by experimental data collected using monochromatic synchrotron radiation and we plan to measure and validate the effect around the K-edge energy of high Z elements comprised in the SCF in future work. Simulations including blurring introduced by microscope optics was presented and shortly discussed. It is clear that especially at low energy the optics strongly reduce the MTF, where at higher energies most of the degradation is caused by the energy distribution in the SCF. We also proposed a figure of merit to evaluate potential scintillators in terms of spatial resolution and contrast but also absorption efficiency. Of the investigated SCFs, Lu2O3 and PbTiO3 may outperform the other investigated SCFs below 50 keV and above 64 keV while between 50 and 64 keV GAP is the best compromise. At 100 keV and above PbTiO3 is the better choice. We believe that such an approach is a great support for the scintillating screen development aiming to reach ultimate performances.Author contributions
L. W. and F. R. designed and conducted the modeling of the imaging response of the thin scintillating films. F. R., and P.-A. D. fabricated the films for experimental validation. L. W., P.-A. D. and K. P. performed the X-ray imaging validation experiments and data analysis. T. M. and C. D. conceived and designed the project.Conflicts of interest
There are no conflicts to declare.Acknowledgements
Part of this work was performed in the frame of the ESRF-EBS Detector Development Plan (DDP), T1C: High resolution scintillators for imaging detectors. The authors thank the beamline staff at BM05, ESRF.Notes and references
- M. Kutsal, P. Bernard, G. Berruyer, P. Cook, R. Hino, A. Jakobsen, W. Ludwig, J. Ormstrup, T. Roth and H. Simons, et al. , IOP Conf. Ser.: Mater. Sci. Eng., 2019, p. 012007 Search PubMed.
- J. Wright, C. Giacobbe and M. Majkut, Curr. Opin. Solid State Mater. Sci., 2020, 24, 100818 CrossRef CAS.
- I. Kantor, J.-C. Labiche, E. Collet, L. Siron, J.-J. Thevenin, C. Ponchut, J. Borrel, T. Mairs, C. Marini and C. Strohm, et al. , J. Synchrotron Radiat., 2014, 21, 1240–1246 CrossRef CAS PubMed.
- T. Narayanan, M. Sztucki, T. Zinn, J. Kieffer, A. Homs-Puron, J. Gorini, P. Van Vaerenbergh and P. Boesecke, J. Appl. Crystallogr., 2022, 55, 98–111 CrossRef CAS PubMed.
- M. Cotte, P.-O. Autran, C. Berruyer, C. Dejoie, J. Susini and P. Tafforeau, Synchrotron Radiat. News, 2019, 32, 34–40 CrossRef.
- P. Tafforeau, R. Boistel, E. Boller, A. Bravin, M. Brunet, Y. Chaimanee, P. Cloetens, M. Feist, J. Hoszowska and J.-J. Jaeger, et al. , Appl. Phys. A, 2006, 83, 195–202 CrossRef CAS.
- C. Walsh, P. Tafforeau, W. Wagner, D. Jafree, A. Bellier, C. Werlein, M. Kühnel, E. Boller, S. Walker-Samuel and J. Robertus, et al. , Nat. Methods, 2021, 1–10 Search PubMed.
- P. A. Douissard, A. Cecilia, X. Rochet, X. Chapel, T. Martin, T. van de Kamp, L. Helfen, T. Baumbach, L. Luquot, X. Xiao, J. Meinhardt and A. Rack, J. Instrum., 2012, 7, P09016–P09016 Search PubMed.
- A. Koch, C. Raven, P. Spanne and A. Snigirev, JOSA A, 1998, 15, 1940–1951 CrossRef CAS.
- E.-J. Popovici, L. Muresan, A. Hristea-Simoc, E. Indrea, M. Vasilescu, M. Nazarov and D. Y. Jeon, Opt. Mater., 2004, 27, 559–565 CrossRef CAS.
- S. R. Miller, V. Gaysinskiy, I. Shestakova and V. V. Nagarkar, Penetrating Radiation Systems and Applications VII, 2005, p. 59230F Search PubMed.
- A. Sahlholm, O. Svenonius, P. Wiklund and J. Linnros, Selection of Dimensions and Geometry of a Structured Scintillator for X-ray Imaging, 2009 Search PubMed.
- T. Martin and A. Koch, J. Synchrotron Radiat., 2006, 13, 180–194 CrossRef CAS PubMed.
- A. Cecilia, V. Jary, M. Nikl, E. Mihokova, D. Hänschke, E. Hamann, P.-A. Douissard, A. Rack, T. Martin and B. Krause, et al. , Radiat. Meas., 2014, 62, 28–34 CrossRef CAS.
- P.-A. Douissard, A. Cecilia, T. Martin, V. Chevalier, M. Couchaud, T. Baumbach, K. Dupré, M. Kühbacher and A. Rack, J. Synchrotron Radiat., 2010, 17, 571–583 CrossRef CAS PubMed.
- T. Martin, P.-A. Douissard, M. Couchaud, A. Cecilia, T. Baumbach, K. Dupre and A. Rack, IEEE Trans. Nucl. Sci., 2009, 56, 1412–1418 CAS.
- P.-A. Douissard, T. Martin, F. Riva, Y. Zorenko, T. Zorenko, K. Paprocki, A. Fedorov, P. Bilski and A. Twardak, IEEE Trans. Nucl. Sci., 2016, 63, 1726–1732 CAS.
- Y. Zorenko, P.-A. Douissard, T. Martin, F. Riva, V. Gorbenko, T. Zorenko, K. Paprocki, A. Iskalieva, S. Witkiewicz and A. Fedorov, et al. , Opt. Mater., 2017, 65, 73–81 CrossRef CAS.
- J. Tous, K. Blazek, M. Nikl and J. Mares, J. Phys.: Conf. Ser., 2013, 192017 CrossRef.
- P. Raimondi, Synchrotron Radiat. News, 2016, 29, 8–15 CrossRef.
- D. Chenevier and A. Joly, Synchrotron Radiat. News, 2018, 31, 32–35 CrossRef.
- S. Agostinelli, J. Allison, K. A. Amako, J. Apostolakis, H. Araujo, P. Arce, M. Asai, D. Axen, S. Banerjee and G. Barrand, et al. , Nucl. Instrum. Methods Phys. Res., Sect. A, 2003, 506, 250–303 CrossRef CAS.
- A. Mittone, L. Fardin, F. Di Lillo, M. Fratini, H. Requardt, A. Mauro, R. A. Homs-Regojo, P.-A. Douissard, G. E. Barbone and J. Stroebel, et al. , J. Synchrotron Radiat., 2020, 27, 1347–1357 CrossRef CAS PubMed.
- J. Apostolakis, M. Pia, S. Giani, P. Nieminen, M. Maire and L. Urban, Geant4 low energy electromagnetic models for electrons and photons, 1999 Search PubMed.
- V. Ivanchenko, J. Apostolakis, A. Bagulya, H. B. Abdelouahed, R. Black, A. Bogdanov, H. Burkhard, S. Chauvie, G. A.-P. Cirrone and G. Cuttone, et al. , Prog. Nuclear Sci. Technol., 2011, 2, 898–903 CrossRef.
- H. Hopkins, Proc. R. Soc. London, Ser. A, 1955, 231, 91–103 Search PubMed.
- A. Rack, Synchrotron Radiat. News, 2020, 33, 20–28 CrossRef.
- F. Riva, T. Martin, P. Douissard and C. Dujardin, J. Instrum., 2016, 11, C10010 CrossRef.
- F. Riva, P.-A. Douissard, T. Martin, F. Carlá, Y. Zorenko and C. Dujardin, CrystEngComm, 2016, 18, 608–615 RSC.
- A.-L. Bulin, A. Vasil'ev, A. Belsky, D. Amans, G. Ledoux and C. Dujardin, Nanoscale, 2015, 7, 5744–5751 RSC.
- A.-l Bulin, M. Broekgaarden, F. Chaput, V. Baisamy, J. Garrevoet, B. Busser, D. Brueckner, A. Youssef, J.-l Ravanat, C. Dujardin, V. Mottoâ-Ros, F. Lerouge, S. Bohic, L. Sancey and H. Elleaume, Adv. Sci., 2020, 2001675, 2001675 CrossRef PubMed.
- M. Berger, J. Hubbell, S. Seltzer, J. Chang, R. Coursey, J. S. Sukumar, D. Zucker and K. Olsen, NIST Standard Reference Database 8 (XGAM), 2010, https://www.nist.gov/pml/xcom-photon-cross-sections-database.
- G. D. Boreman, Modulation transfer function in optical and electro-optical systems, SPIE Press, Bellingham, WA, 2001, vol. 4 Search PubMed.
- M. Berger, J. Coursey, M. Zucker and J. Chang, NIST Standard Reference Database 124 (estar), 2017, https://physics.nist.gov/PhysRefData/Star/Text/ESTAR-u.html.
- Y. M. Zhu, V. Kaftandjian, G. Peix and D. Babot, Appl. Opt., 1995, 34, 4937–4943 CrossRef CAS PubMed.
- E. Samei, M. J. Flynn and D. A. Reimann, Med. Phys., 1998, 25, 102–113 CrossRef CAS PubMed.
- E. Ziegler, J. Hoszowska, T. Bigault, L. Peverini, J. Massonnat and R. Hustache, AIP Conf. Proc., 2004, 436–439 CrossRef.
Footnote |
| † Electronic supplementary information (ESI) available. See DOI: https://doi.org/10.1039/d2tc01274j |
| This journal is © The Royal Society of Chemistry 2022 |