
 Open Access Article
 This Open Access Article is licensed under a Creative Commons Attribution-Non Commercial 3.0 Unported Licence
Monitoring osmotic pressure with a hydrogel integrated optofluidic microlaser†
Randall Ang
Jie
,
Xuerui
Gong
,
Zhen
Qiao
* and
Yu-Cheng
Chen
 *
*
School of Electrical and Electronics Engineering, Nanyang Technological University, 50 Nanyang Ave., Singapore 639798, Singapore. E-mail: yucchen@ntu.edu.sg
First published on 4th May 2022
Abstract
Osmotic pressure plays a key function in many biological systems and biointerfaces; however, it is often challenging to monitor minute osmotic changes from the micron to the nanoscale. Unlike conventional methods, which mostly rely on measurements of deformations, here we proposed a method to detect osmotic pressure by analysing laser emission from dye-doped hydrogel droplets encapsulated in a Fabry–Pérot optical micro-resonator. Taking advantage of enhanced light–matter interactions, subtle osmotic changes were revealed through lasing wavelength shifts as a result of the optical path length difference. Dynamic monitoring of osmotic pressures was also recorded through lasing spectra. Finally, we showcase how the spatial information in the form of transverse modes could provide information related to refractive index distribution and three-dimensional structural changes of hydrogel droplets due to osmotic pressure. The ability to detect osmotic pressure with optofluidic lasers illuminates the potential for on-chip sensing of body fluids and cellular environments.
Introduction
Osmotic pressure is the minimum pressure required to prevent the flow of water through a semipermeable membrane across a concentration gradient. It is a biophysical cue that modulates cellular functions from plants1 to bacteria and archea.2 As our body consists of various fluid compartments, osmotic pressure is inevitably present in intracellular, extracellular, and interstitial spaces between cells and blood vessels. One such example is colloid osmotic pressure induced by albumin on the capillary wall that separates the plasma and interstitial fluid. Under high osmotic pressure, our body tends to undergo osmoregulation to maintain constant osmotic pressure, preventing cells from rupturing.3 As such, changes in osmotic pressure will significantly affect a cell's volume and stiffness, as well as cellular behaviours and differentiation.4Conventional methods for detecting osmotic pressure, such as the use of an osmometer for freezing point depression or vapour pressure measurement,5 however, provide less spatiotemporal information. To curb this problem, methods harnessing optical principles such as fluorescence6 and Förster resonance energy transfer (FRET)7 have been developed to investigate osmotic pressure in biological systems. Different materials have also been proposed to detect osmotic changes in living systems, for instance, hydrogels are capable of swelling in water due to their unique porous features8 and the ability to absorb water via hydrophilic functional groups. These characteristics paved the way for hydrogels to be used as highly versatile and smart biomaterials in response to external physical and chemical stimuli.9–11 By monitoring the size changes or deformations of fluorescent hydrogel particles, osmotic pressure as well as cellular forces could be calculated correspondingly.12–14
Despite having many ways to monitor osmotic pressure, it is often challenging to monitor minute osmotic changes at the micron to the nanoscale. To amplify subtle physical changes, optical resonators are known for their sensitive detection at the nanoscale.15–17 Due to the strong light–matter interactions and light confinements provided by an optical cavity, subtle physical changes could be amplified during repeated interactions within the cavity.18–21 Active resonators, particularly optofluidic lasers, have garnered widespread attention due to their distinctively prominent emission signal as compared to conventional light characteristics.22–25 Subtle structural changes, including molecular structure, polarization, and cellular structures, could therefore be significantly amplified and observed, and distinguished through output laser emission.26–30 Lasing emission can be detected easily due to signal amplification, narrow emission linewidth, and unique threshold behaviours.31
In this study, we demonstrate the possibility of monitoring osmotic pressure by taking advantage of an active optical resonator. A hybrid Fabry–Pérot (FP) microlaser formed by hydrogel microdroplets sandwiched in two distributed Bragg reflector (DBR) mirrors is introduced, as shown in Fig. 1a. The structure of the hydrogel serves as the key in FP cavity in controlling ions or molecules flowing in/out of the pump region of the microlaser. By inducing osmotic pressure within the cavity, the hydrogel microdroplets will experience an outward water flux and shrink, causing a change in droplet size and hence optical path length through the surrounding medium and the droplet, which can be detected via a resonance wavelength shift. Here we investigate how the presence of osmotic pressure within the optical microcavity will result in a blueshift in the lasing spectrum. Temporal profiles of the osmotic pressure were recorded through the lasing spectra. Finally, we showed how the spatial information in the form of transverse modes can provide details on the small structural changes of the hydrogel droplet due to osmotic pressure. The combination of both spectral and spatial information offers a microcavity as a novel method for ionic and osmotic pressure sensing. The findings show that the hybrid FP hydrogel microlaser can be utilized to quantify osmotic pressure in the nanoscale and detect spatial variations on the hydrogel droplet.
 | ||
| Fig. 1 (a) Schematic diagram of using a hybrid FP hydrogel microlaser to investigate osmotic pressure by sandwiching hydrogel droplets in between two highly reflective mirrors. When PEGDA 575 solution is added into the cavity, the hydrogel droplet will shrink due to increased osmotic pressure. (b) The lasing emission will then be captured for any wavelength shift to quantify osmotic pressure. (c) Lasing spectra of hydrogel droplets under different pump energy densities (off-set y-axis). (d) Spectrally integrated output intensity and linewidth as a function of pump energy density. | ||
Results and discussion
Concept and principle
Fig. 1a illustrates the concept of osmotic detection through a hybrid FP microlaser cavity, where polyacrylamide (PAM) hydrogel droplets are attached to the surface of the bottom mirror. To achieve lasing, Fluorescein-o-methyacrylate (F–MA) was selected as the gain material for all the PAM hydrogel droplets throughout the entire work. The hydrogel droplet was first immersed inside an aqueous environment while a 488 nm pulsed laser was used to excite the hydrogel droplet in the FP cavity. Subsequently, the emitted laser from the hybrid FP cavity was recorded with a spectrometer for further investigation (a schematic of the optical system is depicted in Fig. S1 of the ESI†). Poly(ethylene glycol) diacrylate (PEGDA) solution was then added to the microcavity to induce osmotic pressure, causing the droplet to shrink. It is essential to note that the surface of the hydrogel droplet acts as a selectively permeable membrane due to its porous interface. The pore size can be adjusted by manipulating the monomer to water ratio of the hydrogel. When the larger molecular size of PEGDA comes into contact with the hydrogel surface, it would be unable to penetrate the smaller pore size of the hydrogel, resulting in pressure being applied from the surface (Refer to Note S1 (ESI†) for a more detailed comparison between the polyacrylamide hydrogel pore size and PEGDA 575 molecular size.) The exerted pressure will then cause an outward flow of water across the porous membrane until osmotic equilibrium is attained. In this study, osmotic pressure was calculated based on the concentration of PEGDA through the well–known Van’t Hoff's equation as shown below:| Π = icRT | (1) |
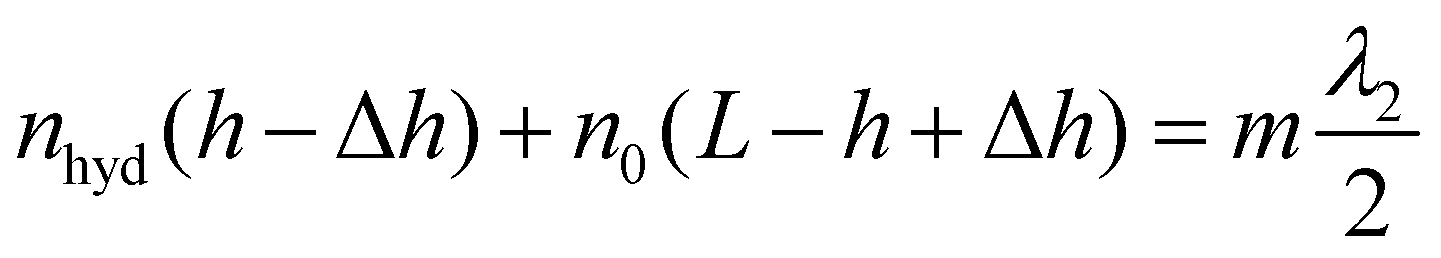
As a result of osmotic pressure, a blueshift of the lasing wavelength would be observed due to the decreased height of the microdroplet (Fig. 1b). According to the standing wave condition in a cavity, the oscillation wavelengths before and after introducing osmotic pressure satisfy the following equations.
Initial condition:
 | (2) |
After introducing osmotic pressure:
 | (3) |
 | (4) |
Spectral analysis of lasing emission
As a control group, we examined the lasing characteristics of a hybrid FP hydrogel microlaser without introducing osmotic pressure. Initially, the hydrogel droplet was immersed in distilled water/glycerol solution (Fig. 1a). Note that the distilled water/glycerol solution possesses the same refractive indices (RI) as that of the PEGDA solution to be added later. Fig. 1c shows the lasing spectrum which consists of narrow spectra that represent resonance modes of the FP cavity. These resonance modes have sharp distinct spectral lines due to the oscillation of light within the cavity where stimulated emission is intensified. The spectrally integrated lasing intensities and linewidths were measured under different pump energy densities as shown in Fig. 1d, revealing a clear threshold behaviour at 85.9 μJ mm−2, where lasing will only occur beyond this value. The linewidth of a peak is defined by the full width at half maximum (FWHM). When the pump energy density is below the lasing threshold, the linewidth is broader due to fluorescence emission. Narrow linewidths were obtained when the pump energy density is above the lasing threshold.Next, we discuss the relationship between osmotic pressure and lasing wavelength shift. As shown in Fig. 2a, when a 38.9 mM PEGDA solution was added, osmotic pressure occurred and a blueshift of 1.45 nm was observed in the laser emission spectrum. The result shows that such a microlaser is indeed sensitive to osmotic pressure around a hydrogel droplet. We further investigated how the blueshift value changes with increasing osmotic pressures, in which PEGDA solutions with various concentrations were employed to control different osmotic pressures. Fig. 2b depicts the relationship of the blueshift values plotted with respect to the experienced osmotic pressure, from 0.09, to 0.24, 0.36, 0.47, 0.71, 0.95, 1.19, 1.42, 1.66, 1.90 and 2.37 MPa. Note that the osmotic pressures were calculated by using eqn (1). Details for the calculated osmotic pressure for different concentrations of PEGDA are provided in Table S1 (ESI†). The minimum detectable wavelength shift was obtained under an osmotic pressure of 0.09 MPa. The fact that the blueshift value increases with the enhancement of the osmotic pressure indicates that a hydrogel microlaser possesses the capability to record the surrounding osmotic pressure.
 | ||
| Fig. 2 (a) Lasing emission spectrum of the hydrogel droplet before and after osmotic pressure by adding PEGDA 575 (0.09 MPa), showing a blueshift in the lasing peak. The inset depicts the bright field images of the hydrogel droplets. (b) Wavelength shifts recorded under different induced osmotic pressure and corresponding concentration of PEGDA 575 used. (c) Cross-sectional illustration of a hydrogel droplet sandwiched in between the FP cavity (left) and its simulated 2D/3D electric field distribution of FP lasing modes (right). (d) Cross-sectional illustration of the hydrogel droplet after shrinking (left) and its simulated 2D/3D electric field distribution (right). | ||
Optical simulations were also performed to show that a blueshift is originated from the decrease in the height of the droplet, in which two different sizes of hydrogel droplets were considered. Fig. 2c and d show the cross-sectional views of two FP cavities sandwiching hydrogel droplets of different sizes. For the hydrogel droplet with a height of 14.75 μm and bottom diameter of 38.0 μm, the oscillation wavelength of a first-order mode locates at 570.97 nm. When considering the reduced size of the droplet due to the introduced osmotic pressure, the oscillation wavelength of the first-order mode blueshifts to 569.36 nm given the reduced height of 14.2 μm and bottom diameter of 37.0 μm. The blueshift value is approximately 1.61 nm, which agrees well with the experimental result in Fig. 2a.
We then explored the temporal changes of the wavelength shifts after introducing osmotic pressure. Fig. 3a depicts how the spectral map blueshifts in 7 s after adding a PEGDA solution with a concentration of 0.194 M, in which 1.50 nm of blueshift was observed. We then compared the wavelength shifts for 3 different concentrations of PEGDA solutions within the same time interval, as shown in Fig. 3b. We observed that during the first second (1 s), no wavelength shift was observed under different concentrations of PEGDA solution. Thereafter, the lasing wavelengths began to shift at different rates under different concentrations. At the 2 s mark, the highest concentration of PEGDA (0.584 M) caused a blueshift of 1.52 nm, while the lowest concentration (0.194 M) resulted in a blueshift of 0.27 nm. At the end of the 7 s mark, we observed a total wavelength shift of 4.54 nm, 2.32 nm, and 1.50 nm for 0.584 M, 0.496 M, and 0.194 M PEGDA, respectively. Considering the fact that the wavelength is proportionally related to the optical path length, it is deduced that the spectral shift which changes with time is originated from the gradual change in optical path length under osmotic pressure. By measuring the wavelength shift after inducing osmotic pressure, we could determine the changes in the height of the hydrogel droplets according to eqn (3). Referring to the plot in Fig. 3c, we observed that the change in height has a linearly increasing relationship with the wavelength shift. Based on eqn (4), we further plotted the relationship between the change in height and the osmotic pressure, as shown in Fig. 3d. The linear relationship proves that the change in height for different osmotic pressures exerted could be predicted by measuring the blueshifts of a hybrid FP hydrogel microlaser.
 | ||
| Fig. 3 (a) Temporal recording of the spectral map under osmotic pressure with the addition of PEGDA of 0.194 M concentration. (b) Dynamic graph of the wavelength shift for different concentrations of PEGDA used under the same time period of 7 s. (c) Plotted graph of calculated height change with respect to the measured wavelength shift. (d) Plotted graph depicting the relationship between height change with respect to induced osmotic pressure. | ||
To investigate the effect of different material properties, we investigated the effects of osmotic pressure on varying monomer/water ratios of the hydrogel droplet. This was done by adjusting the monomer/water ratio from 20% to 50% under the same osmotic pressure of 1.89 MPa. Interestingly, we observed that the blueshifts of the lasing spectrum increased significantly as the monomer ratio increased (Fig. S2, ESI†). This result shows that osmotic pressure is highly dependent on the total polyacrylamide percentage (%T), which will determine the pore size of the hydrogel. The higher the monomer ratio, the smaller the hydrogel pore size, and hence fewer PEGDA molecules will be able to enter the hydrogel, ensuring a greater osmotic pressure. In addition, we also investigated how osmotic pressure will vary depending on the temperature of the surroundings. We observed that there was a slight increase in osmotic pressure as the temperature increased from 25 °C to 65 °C (Fig. S2, ESI†). The trend corresponds well with the Van’t Hoff equation (eqn (1)) which shows that when the temperature is high, the osmotic pressure will be higher due to the increase in kinetic energy of PEGDA molecules.
Barcode analysis of spatial modes
In addition to the spectral properties, the spatial features of the lasing emission were also analysed by capturing the transverse modes. Due to the high correlation with the physical properties of a sample within a cavity, transverse modes also possess the potential to sense the osmotic pressure around a hydrogel droplet. In order to clearly resolve the output transverse modes, a hyperspectral imaging system was used to distribute the transverse modes into their respective wavelengths (Fig. 4a). Due to the near-sphere-cap shape of a hydrogel droplet, most of the laser modes observed were Ince Gaussian (IG) modes. We then explored how the hyperspectral images of transverse modes change after introducing osmotic pressure. As shown in Fig. 4b and c, we observed that there were more transverse modes at the initial condition (Fig. 4b). However, the number of modes decreased slightly under an osmotic pressure of 0.47 MPa (after the addition of 0.194 M PEGDA solution), as presented in Fig. 4b. We also defined the order of a laser mode (N = p for IGpm mode) to further show the change. The highest order of the laser modes at the initial stage was 5 (Fig. 4c), while the highest order observed after osmotic pressure was 4 (Fig. 4d). Meanwhile, the total number of orders defined by decreased from 15 to 10, where Ni is the order of the i-th mode in a hyperspectral image. The decrements analyzed above were originated from the shrinking in size of the droplet after introducing osmotic pressure.
 | ||
| Fig. 4 (a) Illustration of the hyperspectral laser imaging set-up. (b) and (c) Bright-field image (Left), far-field laser emission pattern (Middle), and hyperspectral images of laser modes (Right) of a hydrogel droplet (b) at the initial condition and (c) under osmotic pressure of 0.47 MPa. Scale bars: 25 μm. (d) Generation of a barcode from the hyperspectral image. The colour legend represents order of laser modes. (e) Barcode generation before (Top) and after introducing osmotic pressure of 0.47 MPa (Bottom). (f) Barcode generation before (Top) and after introducing osmotic pressure of 1.90 MPa (Bottom). Scale bars: 25 μm. | ||
Herein, we also utilized a barcode method to efficiently monitor the laser modes obtained from the experiment, in which we created a colour chart to visualize the mode orders (Fig. 4d). After distinguishing the order of the laser modes, we converted them into the respective coloured barcode (bottom row in Fig. 4d). The wavelength scales of all barcodes were adjusted to uniformity from 545 nm to 550 nm; meanwhile, the widths of all bars were fixed. The barcode method was then employed to compare and investigate how different osmotic pressure would affect the transverse modes of lasing emission. First, we compared two distinctively different osmotic pressures of 0.47 MPa and 1.90 MPa. Under higher osmotic pressure, some barcodes would disappear as compared with those under the initial conditions (see Fig. S3 (ESI†) for more osmotic pressure barcodes generated). In addition, the highest order of the barcode would become lower as the concentration of PEGDA increased. This shows that the increasing amount of osmotic pressure induced on the hydrogel does translate to decreasing the total order of modes. This section shows that the hyperspectral image provides observable spatial variations when the size of the hydrogel droplet changes. The barcode method is also extremely useful for analysing modes as it simplifies the hyperspectral image while keeping the information intact. Note that the initial condition of the laser barcode is difficult to maintain the same as the size of the printed droplet would have slight differences.
Conclusion
In this work, we explored the potential of the hybrid FP hydrogel microlaser to study the osmotic pressure phenomenon by taking advantage of the sensitive spectral and spatial features of lasing emission. Dye-doped hydrogel droplets were printed onto a highly reflective mirror and sandwiched inside a FP cavity to detect sensitive information from lasing signals when osmotic pressure is induced. Osmotic pressure caused the droplet to shrink in size due to a net outward water flux which corresponded to a blueshift in wavelength. By adjusting the osmotic pressure through PEGDA solutions, we showed that the extent of blueshift presents a linearly increasing relationship with osmotic pressure induced. Furthermore, we also demonstrated the possibility of predicting the change in thickness of the hydrogel droplet just by observing the wavelength shift. This demonstrates the sensitivity of the lasing wavelength to the change in optical path length, which is a unique feature of the FP microlaser. Due to the whole-body interactions between the electromagnetic field and hydrogel droplet in the FP cavity, laser modes observed from the lasing emission contain information related to the refractive index distribution and 3D structural changes of the hydrogel droplet.Scientifically, we investigated how light–matter interactions in the microcavity can reflect changes in osmotic pressure. We demonstrated the potential of utilizing the hybrid FP hydrogel microlaser to test and quantify osmotic pressure in the nanoscale and detect spatial variations. The simulation of osmotic conditions inside the FP cavity also confirms the effectiveness of the hydrogel microlaser in detecting osmotic pressure while allowing us to better predict and hypothesize the outcome when using other biofluids. Practically, the proposed concept can be transferred to detect various ions or small metabolite molecules through modification of hydrogel polymers. The ability to detect osmotic pressure with optofluidic lasers illuminates the potential for on-chip ionic sensing in body fluids (sweat, tears, serum) and the cellular environment.
Methods and materials
Materials and chemicals
The dye used in this paper is Fluorescein O-methacrylate (Sigma Aldrich #568864). For the hydrogel, the monomer used was Acrylamide (Sigma Aldrich #A9099), N,N′-methylenebis(acrylamide) (Sigma #146072) was selected as the crosslinker, and 2-hydroxy-4′-(2-hydroxyethoxy)-2-methylpropiophenone (Sigma #410896) was used as the photoinitiator for polymerisation. Glycerol (Sigma Aldrich # G5516) was used for the adjustment of the refractive indices. Poly(ethylene glycol) diacrylate 575 (Sigma Aldrich #437441) was used to induce osmotic pressure.Optical setup
All optical pumping was achieved by a pulsed ns-laser (EKSPLA NT230) integrated with an optical parametric oscillator (pulse duration: 5 ns, repetition rate: 50 Hz). The pump laser was tuned to 488 nm based on the absorption wavelength of fluorescein O-methyacrylate. Bright-field images of samples were captured using a microscope system (Nikon Ni2) with a 10 × 0.3 NA objective used. An imaging software (Nikon's NIS Elements AR 5.11.01) was used for image acquisition and analysis, while the emission spectrum and hyperspectral images were collected with a CCD (Andor Kymera 328i) then observed with an imaging spectrometer (Newton 970 EMCCD).Droplet fabrication
0.475 g of acrylamide and 0.025 g of N,N′-methylenebis(acrylamide) were dissolved into 0.5 mL of Tris buffer to form the precursor solution. 60 mg of photo-initiator and 2 mg of fluorescein O-methyacrylate were then added into the precursor solution before undergoing an ultrasonic bath for 30 minutes. The solution was then vortexed to mix well. The final dye concentration was 2 mM. The prepared precursor was added into a printer and printed onto a dielectric mirror (Evaporation Coatings Inc., USA). The printed hydrogel was then UV-cured for 10 seconds before adding a second dielectric mirror on top. Spacers of silica beads were added in between the cavity to ensure a fixed cavity length of 16μm. The top mirror had a high reflectivity at 510 nm to 600 nm and high transmission around 460 nm to 480 nm, while the bottom mirror had a slightly wider reflection band.Preparation of osmotic inducing fluid
PEGDA 575 (Sigma Aldrich # 437441) and distilled water were mixed to prepare a total of 11 different concentrations. To ensure that the refractive index of the surrounding medium does not change before and after PEGDA was added, a mixture of glycerol and distilled water was prepared, and the refractive index was measured using the refractometer (Reichert Digital Brix/RI-Check).Simulations
Electric field distribution of FP modes and the respective eigen-wavelengths were calculated with the finite element method using COMSOL Multiphysics software. A 2D axisymmetric model eigenfrequency study under the electromagnetic waves, frequency–domain interface (wave optics module) was selected. The geometries of the hydrogel droplet model were of spherical cap shape and the refractive index is estimated to be 1.45.Conflicts of interest
The authors have no conflicts of interest to declare.Acknowledgements
This research is supported by A*STAR under its AME IRG Grant (Project No. A20E5c0085). We would like to thank the lab support from Centre of Bio-Devices and Bioinformatics and Centre for Optoelectronics and Biophotonics in NTU.References
- M. Dubois and D. Inzé, J. Exp. Bot., 2020, 71, 1706–1722 CrossRef CAS PubMed.
- M. B. Burg and J. D. Ferraris, J. Biol. Chem., 2008, 283, 7309–7313 CrossRef CAS PubMed.
- S. Natelson and E. A. Natelson, Proc. Natl. Acad. Sci. U. S. A., 1975, 93–108 Search PubMed.
- M. Guo, A. F. Pegoraro, A. Mao, E. H. Zhou, P. R. Arany, Y. Han, D. T. Burnette, M. H. Jensen, K. E. Kasza and J. R. Moore, Proc. Natl. Acad. Sci. U. S. A., 2017, 114, E8618–E8627 CAS.
- K. Kiyosawa, Biophys. Chem., 2003, 104, 171–188 CrossRef CAS PubMed.
- H. M. Taïeb, D. S. Garske, J. Contzen, M. Gossen, L. Bertinetti, T. Robinson and A. Cipitria, Sci. Rep., 2021, 11, 1–13 CrossRef PubMed.
- W. Zhang, L. Bertinetti, K. G. Blank, R. Dimova, C. Gao, E. Schneck and P. Fratzl, Angew. Chem., Int. Ed., 2021, 60, 6488–6495 CrossRef CAS PubMed.
- E. M. Ahmed, J. Adv. Res., 2015, 6, 105–121 CrossRef CAS PubMed.
- Y. Li, G. Huang, X. Zhang, B. Li, Y. Chen, T. Lu, T. J. Lu and F. Xu, Adv. Funct. Mater., 2013, 23, 660–672 CrossRef CAS.
- P. Lavrador, M. R. Esteves, V. M. Gaspar and J. F. Mano, Adv. Funct. Mater., 2021, 31, 2005941 CrossRef CAS.
- X. Dou, N. Mehwish, C. Zhao, J. Liu, C. Xing and C. Feng, Acc. Chem. Res., 2020, 53, 852–862 CrossRef CAS PubMed.
- M. Dolega, M. Delarue, F. Ingremeau, J. Prost, A. Delon and G. Cappello, Nat. Commun., 2017, 8, 1–9 CrossRef PubMed.
- S. Mok, S. Al Habyan, C. Ledoux, W. Lee, K. N. MacDonald, L. McCaffrey and C. Moraes, Nat. Commun., 2020, 11, 1–11 CrossRef PubMed.
- W. Lee, N. Kalashnikov, S. Mok, R. Halaoui, E. Kuzmin, A. J. Putnam, S. Takayama, M. Park, L. McCaffrey and R. Zhao, Nat. Commun., 2019, 10, 1–14 CrossRef PubMed.
- Y.-F. Xiao and Q. Gong, Sci. Bull., 2016, 61, 185–186 CrossRef.
- J. Vučković, M. Lončar, H. Mabuchi and A. Scherer, Phys. Rev. E: Stat., Nonlinear, Soft Matter Phys., 2001, 65, 016608 CrossRef PubMed.
- F. Vollmer and L. Yang, Nanophotonics, 2012, 1, 267–291 CAS.
- D.-Q. Yang, J.-h Chen, Q.-T. Cao, B. Duan, H.-J. Chen, X.-C. Yu and Y.-F. Xiao, Light: Sci. Appl., 2021, 10, 1–8 CrossRef PubMed.
- A. M. Armani, R. P. Kulkarni, S. E. Fraser, R. C. Flagan and K. J. Vahala, Science, 2007, 317, 783–787 CrossRef CAS PubMed.
- T. Lu, H. Lee, T. Chen, S. Herchak, J.-H. Kim, S. E. Fraser, R. C. Flagan and K. Vahala, Proc. Natl. Acad. Sci. U. S. A., 2011, 108, 5976–5979 CrossRef CAS PubMed.
- Y. Zhi, X. C. Yu, Q. Gong, L. Yang and Y. F. Xiao, Adv. Mater., 2017, 29, 1604920 CrossRef PubMed.
- Q. Chen, M. Ritt, S. Sivaramakrishnan, Y. Sun and X. Fan, Lab Chip, 2014, 14, 4590–4595 RSC.
- H. Zhang, P. Palit, Y. Liu, S. Vaziri and Y. Sun, ACS Appl. Mater. Interfaces, 2020, 12, 26936–26942 CrossRef CAS PubMed.
- H. Zhang, A. Balram, D. D. Meng and Y. Sun, ACS Photonics, 2017, 4, 621–625 CrossRef CAS.
- T. Sano, J. Black, S. Mitchell, H. Zhang and H. Schmidt, Opt. Lett., 2020, 45, 5978–5981 CrossRef CAS PubMed.
- Z. Qiao, H. Xu, N. Zhang, X. Gong, C. Gong, G. Yang, S. Y. Chew, C. Huang and Y. C. Chen, Adv. Sci., 2022, 9, 2103550 CrossRef CAS PubMed.
- C. Gong, Z. Qiao, Z. Yuan, S. H. Huang, W. Wang, P. C. Wu and Y. C. Chen, Adv. Sci., 2021, 8, 2100096 CrossRef CAS PubMed.
- Z. Yuan, X. Cheng, Y. Zhou, X. Tan, X. Gong, H. Rivy, C. Gong, X. Fan, W.-J. Wang and Y.-C. Chen, ACS Photonics, 2020, 7, 1908–1914 CrossRef CAS.
- C. Zhang, H. Dong, C. Zhang, Y. Fan, J. Yao and Y. S. Zhao, Sci. Adv., 2021, 7, eabh3530 CrossRef PubMed.
- M. Gao, C. Wei, X. Lin, Y. Liu, F. Hu and Y. S. Zhao, Chem. Commun., 2017, 53, 3102–3105 RSC.
- X. Fan and S.-H. Yun, Nat. Methods, 2014, 11, 141 CrossRef CAS PubMed.
Footnote |
| † Electronic supplementary information (ESI) available. See DOI: https://doi.org/10.1039/d2tc00913g |
| This journal is © The Royal Society of Chemistry 2022 |