 Open Access Article
Rhodamine 6G and 800 intermolecular heteroaggregates embedded in PMMA for near-infrared wavelength shifting†
Javier
Castillo-Seoane
,
Lola
Gonzalez-Garcia‡
,
José M.
Obrero-Perez
,
Francisco J.
Aparicio
,
Ana
Borrás
 ,
Agustín R.
González-Elipe
 ,
Ángel
Barranco
 * and
Juan R.
Sanchez-Valencia
 *
*
Institute of Materials Science of Seville (US-CSIC), Americo Vespucio 49, 41092 Seville, Spain. E-mail: angelbar@icmse.csic.es; jrsanchez@icmse.csic.es
First published on 30th March 2022
Abstract
The opto-electronic properties of small-molecules and functional dyes usually differ when incorporated into solid matrices with respect to their isolated form due to an aggregation phenomenon that alters their optical and fluorescent properties. These spectroscopic modifications are studied in the framework of the exciton theory of aggregates, which has been extensively applied in the literature for the study of molecular aggregates of the same type of molecules (homoaggregation). Despite the demonstrated potential of the control of the heteroaggregation process (aggregation of different types of molecules), most of the reported works are devoted to intramolecular aggregates, complex molecules formed by several chromophores attached by organic linkers. The intramolecular aggregates are specifically designed to hold a certain molecular structure that, on the basis of the exciton theory, modifies their optical and fluorescent properties with respect to the isolated chromophores that form the molecule. The present article describes in detail the incorporation of Rhodamine 6G (Rh6G) and 800 (Rh800) into polymeric matrices of poly-(methyl methacrylate), PMMA. The simultaneous incorporation of both dyes results in an enhanced fluorescent emission in the near-infrared (NIR), originating from the formation of ground-state Rh6G–Rh800 intermolecular heteroaggregates. The systematic control of the concentration of both rhodamines provides a model system for the elucidation of the heteroaggregate formation. The efficient energy transfer between Rh6G and Rh800 molecules can be used as wavelength shifters to convert effectively the light from visible to NIR, a very convenient wavelength range for many practical applications which make use of inexpensive commercial detectors and systems.
Introduction
The control of the opto-electronic properties of functional dyes and small-molecules is the key for current technological applications such as solar cells, organic-light emitting diodes (OLEDs) or thin film transistors.1,2 However, the properties of those isolated molecules can strongly differ from those encountered in solution or solid matrices.3,4 Thus, other energetic considerations different from the typical Jablonsky diagrams for isolated molecules come into play such as the inter- or intra-molecular exciton energy splitting of the excited states of the chromophores involved.1 The underlying exciton theory dates back to 1960s and was originally developed by Kasha5 and Davidov.6 The strong dipolar coupling produces large changes in the absorbance and fluorescence bands of the chromophores,1,3,7 implying the formation of a ground-state aggregate (homo or hetero if it implies one or more than one type of molecules, respectively).Recently, numerous authors have intended the incorporation of highly luminescent dyes into organic and inorganic matrices for applications such as solid-state lasing, optoelectronics or solar cells.8,9 Yet the luminescent behaviour and the quantum efficiency of most dyes are influenced by the aggregation state which, in turn, depends strongly on the hosting medium.10–14 Unfortunately, aggregation is usually accompanied by an undesired decrease in the quantum yield of the molecules.1,12,15
In recent years, Near Infrared (NIR) dyes have been gaining importance not only for photonic and optoelectronics, but also for biological applications.16–20 Rhodamines (Rh), the most studied family of synthetic dyes with luminescent quantum yields close to unity,21 have expanded their absorption and fluorescence spectra from the visible to the NIR region, up to 950 nm.22 A typical NIR Rhodamine is Rh800, in which the substitution for a cyano group in the xanthene structure produces a red-shift of ca. 100 nm as compared with the corresponding molecule with a carboxyphenyl group, i.e. Rh101.23 Unfortunately, this NIR shift for the Rh800 produces an undesired decline in the quantum yield of this molecule.23
In recent decades, many research endeavours have been focused on the application of the exciton theory to understand the phenomenon of homoaggregation, i.e., the formation of aggregates of the same molecule.11,12,24,25 This, in turn, has enabled the chemical design of intramolecular homoaggregates with tailored optoelectronic properties.26,27 In contrast, and despite its demonstrated potential, few examples can be found in the literature about the aggregation of different chromophores in the so-called heteroaggregation process.1,7,28–32 In addition, heteroaggregation can be used as an alternative method to red-shift the fluorescent emission by the incorporation of several types of chromophores within a common host. Depending on several factors such as concentration and geometry between adjacent fluorescent molecules, the excitation can be transferred from one molecule to the other.33 This approach has been used in numerous fields,33,34 where the experimental observations have been typically analysed by the Förster Resonant Energy Transfer (FRET) theory.35 It is important to remark that for small interchromophoric distances, a ground-state heteroaggregate is formed and hence the fluorescence properties cannot be analyzed by the routinely applied FRET model.36 In the literature, very few intermolecular heteroaggregates have been reported, probably because their formation, which usually modifies the absorbance bands (both in wavelength and molar absorptivity), is not usually corroborated.37,38
Recently, we have shown that the incorporation of Rh800 molecules and another dye molecule of the xanthene family (RhX) in SiO2 thin films deposited by Glancing Angle Deposition (GLAD) depicts a singular non Förster energy transfer process characterised by an intense NIR fluorescence band (corresponding to Rh800) for light absorbed by the RhX molecule.39,40 This behaviour was explained by the formation of a new type of RhX and Rh800 heteroaggregates.39,40 In this article, we go a step further and study the incorporation of Rh6G and Rh800 molecules to poly(methyl methacrylate) (PMMA) matrices. PMMA is the most broadly applied optical host and represents a perfect candidate for this purpose due to its transparency along the whole visible-NIR range.41–43 We systematically vary the concentration of both rhodamines providing a model system for the elucidation of the heteroaggregate formation. Thus, we firstly present the results for the monomolecular system and compare them with the bimolecular Rh6G–Rh800 system. Then, the steady-state and time-resolved photoluminescent properties are characterised and analysed providing a univocal footprint of the strong dipolar interaction between Rh6G and Rh800 molecules. This complete approach reveals the association of the molecules in the form of ground-state Heteroaggregates with Enhanced Acceptor Luminiscence (HEAL).
Experimental
Rh6G–Rh800 PMMA thin films
Rh6G and Rh800 dyes and PMMA were purchased from Sigma Aldrich and were used as received. PMMA thin films containing Rhodamine molecules were prepared by using a spin-coater model Laurell WS-400. A solution of PMMA, Rh6G, and Rh800 in acetone was dispensed on glass slides and then spun at 2000 rpm (accel = 2000 rpm s−1) for 30 s. The spun solution was obtained by mixing equal volumes of: (i) a PMMA solution at a concentration of 10% (w/v), (ii) a Rhodamine 6G and (iii) a Rh800 solution, with concentrations of each dye at 2 × 10⁻⁴ M (referred to as 1), 6 × 10⁻⁴ M (2), and 2 × 10⁻³ M (3). From now on, we will refer to these samples with two numbers: the first is the Rh6G concentration and the second the Rh800. In this way, sample 1-3 was deposited by using the lowest concentration solution of Rh6G (2 × 10⁻⁴ M or 1) and the highest concentration of Rh800 (2 × 10⁻³ M or 3). The label “0” indicates the absence of the corresponding rhodamine, i.e., the monomolecular system. The spin-coated samples were heated in an Ar atmosphere for 12 h at 80 °C to evaporate the solvent.To calculate the actual concentration of every rhodamine in the PMMA layer, we used the following relation:44
 | (1) |
Methods
UV-visible absorption spectra in the transmission mode were recorded with a Cary 100 spectrometer for Rh6G–Rh800/PMMA thin films deposited on glass plates.Fluorescence spectra (recorded both under steady-state and time-resolved conditions) were recorded in a Jobin-Yvon Fluorolog3 spectrofluorometer. Steady-state measurements were performed using the Front-Face (FF) configuration. This configuration is extensively used in the literature to minimize reabsorption effects and provides an important tool to characterize accurately samples with high light absorption.46 Measurements were done by using grids of 2 nm for the excitation and emission monochromators. The samples were excited with 480 and 640 nm, within the absorption bands of Rh6G and Rh800, respectively. The scattering of the excitation light of 480 and 640 nm was avoided by using a cut-on filter at 500 nm and 675 nm, respectively. The fluorescence spectra have been corrected using calibration curves to take into account the spectral response of the detector, gratings, and other spectrometer components. The reported calibration curves have been obtained and tested by using a high number of samples and a calibrated photodetector in the NIR.
Time resolved measurements were recorded by means of the Time-Correlated Single-Photon Counting technique (TCSPC). The excitation was performed by nanoLED sources at 465 and 625 nm with a repetition rate of 1 MHz. The spectra were recorded in a right angle configuration with the sample tilted at 55–60° with respect to the excitation source, to avoid direct excitation reflections. The grids used to record the emission spectra varied from 4 to 8 nm, depending on the fluorescence intensity of the sample. The scattering signal from the LED was further avoided using a cut-on filter in the same way as for the steady-state measurements. The fluorescence decay curves were collected up to 10![[thin space (1/6-em)]](https://www.rsc.org/images/entities/char_2009.gif) 000 counts at the maximum emission channel. The lifetime of the samples was determined by using the software DAS6 provided by Horiba Jobin Yvon that takes into account the Instrument Response Function (IRF). The IRF signal was measured using a PMMA thin film without any dye deposited on the glass.
000 counts at the maximum emission channel. The lifetime of the samples was determined by using the software DAS6 provided by Horiba Jobin Yvon that takes into account the Instrument Response Function (IRF). The IRF signal was measured using a PMMA thin film without any dye deposited on the glass.
The quantum yield was calculated using Mello's method.23,47 The measurements were recorded by means of a calibrated integrating sphere from Horiba with a coating made of optical Spectralon® with a reflectance >99% over the studied range (400–900 nm). It integrates a Teflon sample holder tilted at 30° to maximize the incident radiation. A neutral density filter was used to avoid the detector saturation (c.p.s. below 1E6). All spectra were corrected for the sphere and detector responses.
Results and discussion
UV-Vis absorption study of PMMA homo- and hetero-doped with Rh6G and Rh800
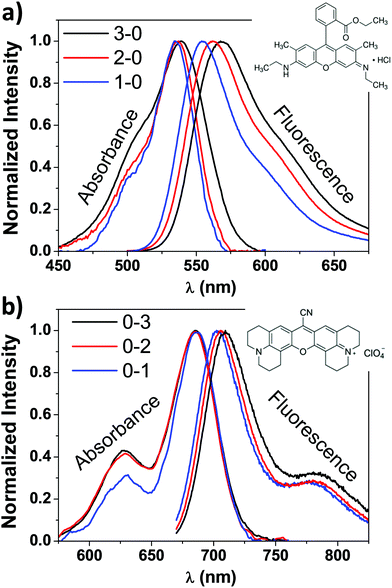
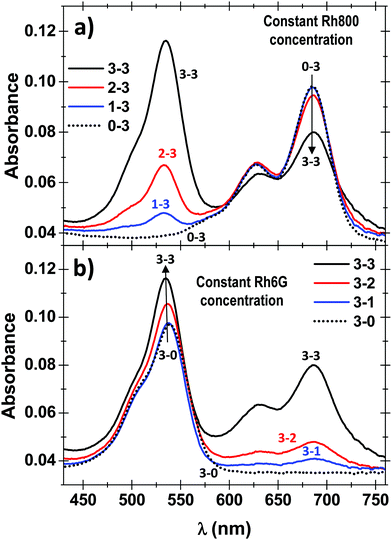
For comparative purposes, we first present the results corresponding to PMMA doped with one type of dye molecules, i.e. Rh6G or Rh800. Fig. 1 shows the absorbance (left) and fluorescence (right) spectra of PMMA films doped with Rh6G (a) and Rh800 (b). The spectra are normalised to the absorbance/fluorescence maxima to reveal changes in the shape of the peaks. The absorbance spectra depict the typical bands of each rhodamine located at ca. 530 and 500 nm for the Rh6G and 685 and 625 nm for the Rh800. At higher Rh6G concentrations (Fig. 1a, black curve), an increment of the relative intensity of the shoulder at 500 nm and a shift to longer wavelengths of the main peak are produced. By contrast, the increase in the concentration of Rh800 induces a different behaviour, mainly characterised by an increase of the relative intensity of the band at 625 nm. In addition, Fig. 1 also shows their fluorescence spectra, which follow a similar trend for both molecules. The fluorescence shifts to longer wavelengths with the concentration of every molecule from 553 to 570 and from 702 to 711 nm for Rh6G and Rh800, respectively. This trend combined with the change of absorbance bands is well reported in the literature and highlights the formation of homoaggregates of both molecules embedded within the PMMA polymeric matrix.13–15,48,49PMMA thin films heterodoped with both rhodamines present the two groups of absorbance bands described above. This can be observed in Fig. 2, which compares the absorbance spectra for a film containing a high concentration of Rh800 molecules and a variable concentration of Rh6G (a), and vice versa (b). As expected, the spectra in panel (a) are characterised by an increase in the absorbance bands of the Rh6G as the concentration increases. However, the absorbance of the Rh800 band decreases significantly as the amount of Rh6G increases (it needs to be noted that the Rh800 concentration is fixed). This behaviour indicates that the presence of Rh6G molecules affects the molar absorptivity of the Rh800 and suggests that the two molecules are interacting strongly. It is also notable in Fig. 2(b) that the PMMA films doped with a fixed/variable amount of Rh6G/Rh800 molecules present an opposite behaviour, whereby the progressive increase in Rh800 concentration produces an increase in the molar absorptivity of the Rh6G.
The significant changes in the absorption spectra of the heterodoped Rh6G–Rh800 PMMA system indicate the formation of ground-state hetero-aggregates characterised by a strong intermolecular interaction due to a small distance separation. According to the exciton theory and although this separation depends on the dipolar transition moments of the chromophores, the orientation factor and refractive index of the medium (as will be described in the next section), a commonly mentioned value in the literature for the separation of the chromophores in an aggregate is below 1–2 nm.1,5,6,28 Therefore, as described by this theory, the excited electrons localize preferentially around the Rh6G molecules as the molar absorptivity of this molecule increases in the presence of Rh800.7,29,32 The comparison of the absorbance spectra shows that the area of the sample with the maximum amount of both dyes (3–3) is 11% greater than the sample 3–0 (the same concentration of Rh6G but absence of Rh800). However, the contribution to the absorbance band from the Rh800 tail, that partially overlaps with the Rh6G absorption band, indicates that this value is lower, and in the worst scenario, the area of sample 3–3 is 4% higher than 3–0. Thus, it can be concluded that an excess between 4–11% of the excited electrons in the heteroaggregates localize preferentially around the Rh6G molecules. Hence, taking into account the previous considerations about the strong dipole–dipole interaction between Rh6G and Rh800 chromophores, a long-range mechanism such as Förster or a radiative energy transfer can be discarded as the main one responsible of the absorbance modifications described.37,38,46
Exciton theory for the formation of heterodimers
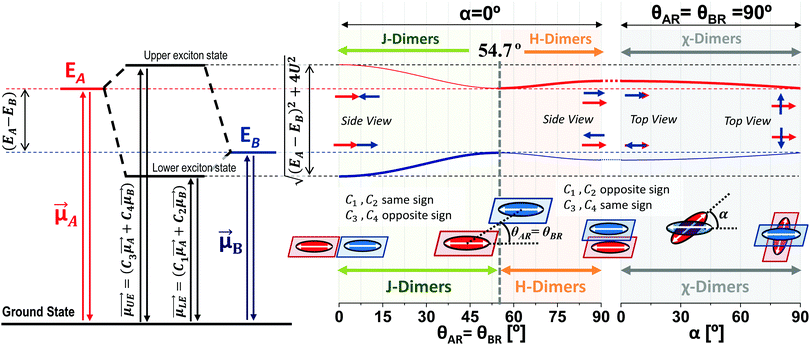
According to the exciton theory, the formation of aggregates induces a shift in their absorbance bands and a change of their molar absorptivity, as shown in Scheme 1.1,5–7,28–32 The Scheme describes the modification of the energy levels of heterodimers (horizontal black dashed lines) of two generic molecules A and B with respect to the isolated monomeric species (red and blue horizontal dashed lines). In this new heterodimer formation scenario, the energy of the electronic transition is shifted to the blue and red with respect to the energy transition of the corresponding monomers of molecules A and B, respectively (with the energy of the electronic transition higher for the molecule A). Depending on the arrangement of the transition dipoles of the molecules, the spectroscopic modifications of the dimers (with respect to monomers) are very different.1,5–7,29,32 The orientation factor κ is used to describe the different geometries that a dimer can adopt (see Scheme 1):κ = cos![[thin space (1/6-em)]](https://www.rsc.org/images/entities/char_2009.gif) α − 3cosθAR·cosθBR α − 3cosθAR·cosθBR | (2) |
Different from the case of homoaggregates, the transition dipole moments of the new exciton states in a heterodimer are a linear combination of the transition dipoles of the monomeric units: as can be seen in Scheme 1, the lower and upper exciton transition dipoles are  and
and  , respectively.29 For H-heterodimers, the constants C1 and C2 (C3 and C4) have opposite (same) signs whereas for J-heterodimers the contrary occurs. As shown in Fig. 2, the absorptivity of the Rh6G/Rh800 band is increased/decreased as the concentration of both dyes increases (see the black curve in Fig. 2a and b). As the dipole moment is proportional to the squared root of the molar absorptivity, the upper exciton state possesses a higher dipole moment than the lower one. This behaviour is characteristic of H-type heterodimers. It is worth remarking that differently from H-homodimers, in which the transition dipole moment to the lower exciton band is zero (even for the case of perfect H-heterodimers, sandwich), the transition dipole to the lower exciton state is different than zero. This is very relevant since perfect H-heterodimers are fluorescent, contrarily to the case of perfect H-homodimers.1,7,29
The exciton splitting (U) for heterodimers (see Scheme 1) is related to the observed energy difference (ΔEObs, obtained through the absorbance bands) and the energy levels of monomers of molecules A and B (EA and EB) as:
 | (3) |
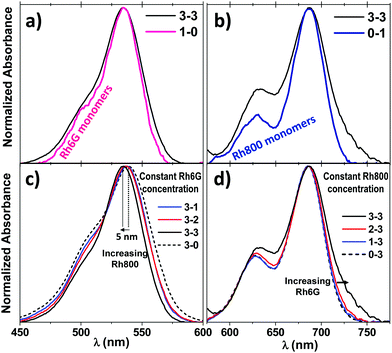
Fig. 3(a and b) show the normalised absorbance spectra of the PMMA samples doped with the highest amount of both molecules and the corresponding comparison with samples doped with monomers of Rh6G (1–0, Fig. 3(a)) and Rh800 (0–1, Fig. 3(b)). It can be noted that the shift of the absorbance bands of Rh6G and Rh800 for sample 3–3 with respect to the corresponding monomers is extremely low. This fact makes the energy difference in the heterodimer (ΔEObs) almost equal to the energy difference of the monomeric species (EA−EB), and consequently the energy splitting (U) is very low. After a careful deconvolution of the peaks, the obtained splitting energy for this sample is U = 0.03 eV, a value remarkably small for the phenomena described in Fig. 2. According to the Simpson–Peterson relation, the splitting energy is related to the geometry of the dimers as:50
 | (4) |
The red-shift of the Rhodamine 6G absorbance band that is usually observed with the increment of the Rh6G concentration (see for example Fig. 1a) is also drastically affected by the presence of Rh800. Fig. S1 (ESI†) shows the normalised Rh6G absorbance band for a constant Rh800, where it can be noted that the red-shift is decreased as the Rh800 concentration increases, from 3.8 nm to 2.4 nm in the absence and presence of the maximum amount of Rh800 molecules, respectively. Furthermore, the gradual shift of the Rh6G (Rh800) absorbance band as the Rh800 (Rh6G) concentration increases, occurs as expected for the formation of heterodimers. This effect can be seen in Fig. 3(c and d) for the highest concentration of Rh6G and a variable amount of Rh800 (c) and vice versa (d). The Rh6G main absorbance band shows a hypsochromic shift of ca. 5 nm while the shoulder at a lower wavelength gradually decreases as the Rh800 concentration increases (for a constant concentration of Rh6G) as expected for the formation of heterodimers. Meanwhile, although the Rh800 main absorbance band is not apparently shifted, the tail at higher wavelengths is enhanced as the Rh6G concentration increases (for a constant concentration of Rh800).
The spectroscopic deviations observed from the expected for a well-defined (in terms of geometry) heteroaggregate, would indicate an equilibrium between homo- and hetero-dimers or higher order aggregates with a certain distribution of geometries in the layers, therefore hindering a proper observation of the sole heterodimer spectroscopic characteristics. Despite the simplicity of the heterodimer model, it needs to be highlighted that although it is not possible to conclude a certain preferential geometry of heterodimers, the behaviour of the Rh6G–Rh800 system follows the trends described by the exciton theory and, therefore, supports the formation of heteroaggregates.1,5–7,28–32
Steady-state fluorescence
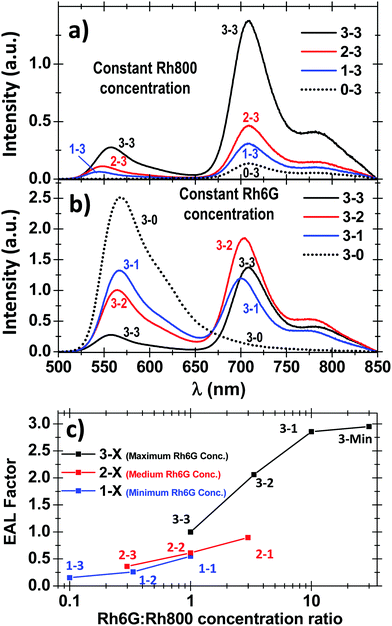
As expected for the formation of heterodimers, not only the absorbance bands of the Rh6G–Rh800 system are modified but also their fluorescent properties. Fig. 4 presents the fluorescence spectra of the samples shown in Fig. 2. It can be observed that, independently of the concentration of Rh6G and Rh800 molecules, the spectra show two intense peaks around 560 nm (associated with the Rh6G) and 705 nm (Rh800) when using an excitation wavelength of 480 nm (within the absorption band of the Rh6G molecule). It is noteworthy in these spectra that for most concentrations, the NIR band of Rh800 is higher than the fluorescence band of Rh6G, although the excitation light used is within the absorbance band of the latter molecule. This behaviour indicates a very efficient energy transfer between Rh6G–Rh800 molecules that converts the visible light at 480 nm to the NIR at 710 nm in one single step. We have shown previously that this effective energy transfer only occurs in solid samples and that aqueous or ethanol solutions of Rh6G and Rh800 dyes do not present this fluorescence peak in the NIR when excited at 480 nm.39,40As discussed in the previous section, contrary to the case of H-homodimers, the H-type heterodimers are fluorescent. This is very convenient, since the use of Rh800 molecules to get an intense fluorescent emission in the NIR is a challenging issue because the quantum yield of this molecule is one of the lowest among the xanthene family.23,49 It needs to be remarked that a certain contribution from a radiative energy transfer or a Förster resonance energy transfer process (due to rhodamines very far from each other that do not form heteroaggregates) cannot be discarded due to the partial overlap between the Rh6G emission and Rh800 absorbance.
The fluorescent samples reported here behave as wavelength shifters that can effectively convert light from 480 to NIR at 710 nm. From a practical point of view, the NIR fluorescence can be enhanced just by adjusting the relative concentration of each dye. Fig. S2 (ESI†) shows the complete study of the fluorescence of all samples by using the excitation source at 480 nm and 640 nm and the comparative fluorescence in the Rh800 region, to visualize easily the fluorescence intensity in the NIR. The fluorescence intensity also depends on the intensity of the absorbance bands: for example, if the Rh6G absorbance band is intense and the Rh800 is weak, our wavelength shifter would increase the intensity of the NIR emission by exciting at 480 nm with respect to 640 nm. Such an assertion is not that simple and depends on the homo- and hetero-aggregation process described before, but it aids in understanding the process. A useful parameter to quantify this effect is the Enhanced Acceptor Luminescence (EAL) factor, which is defined as the relative fluorescence intensity of the NIR (acceptor in analogy with a Förster resonance process) measured by exciting at 480 nm divided by the one exciting at 640 nm.40 In this sense, an EAL factor higher than 1 indicates that the NIR emission is higher by exciting the heteroaggregates at the lower wavelength absorption band. Fig. 4(c) shows the EAL factors obtained for the different samples studied as a function of the relative concentration between Rh6G and Rh800 (in logarithmic scale). It can be easily noted that for all curves (remember that each colour curve indicates a constant Rh6G concentration), the EAL factor increases as the relative Rh6G![[thin space (1/6-em)]](https://www.rsc.org/images/entities/char_2009.gif) :
:![[thin space (1/6-em)]](https://www.rsc.org/images/entities/char_2009.gif) Rh800 concentration increases. For the lower Rh6G concentrations (red and blue curves), the EAL factor value is very low, in all cases below 1. However, for the highest amount of Rh6G (black curve), the EAL factor is higher, reaching a value of 2.9 for sample 3–1 (see also the spectra in Fig. S2, ESI†). To check whether this EAL factor can be further increased, an additional sample with a lower Rh800 concentration (3 times lower than 3–1) was fabricated (sample 3-Min) and the corresponding absorbance and fluorescence spectra are shown in Fig. S3 (ESI†). It can be noted that the EAL factor is not significantly increased for the sample 3-Min as it can be seen in Fig. 4(c). These results are in concordance with our previous results about the formation of the so-called Heteroaggregates with Enhanced Acceptor Luminescence or HEAL, where a very high/low concentration of Rh6G/Rh800 was required for their formation.39,40
Rh800 concentration increases. For the lower Rh6G concentrations (red and blue curves), the EAL factor value is very low, in all cases below 1. However, for the highest amount of Rh6G (black curve), the EAL factor is higher, reaching a value of 2.9 for sample 3–1 (see also the spectra in Fig. S2, ESI†). To check whether this EAL factor can be further increased, an additional sample with a lower Rh800 concentration (3 times lower than 3–1) was fabricated (sample 3-Min) and the corresponding absorbance and fluorescence spectra are shown in Fig. S3 (ESI†). It can be noted that the EAL factor is not significantly increased for the sample 3-Min as it can be seen in Fig. 4(c). These results are in concordance with our previous results about the formation of the so-called Heteroaggregates with Enhanced Acceptor Luminescence or HEAL, where a very high/low concentration of Rh6G/Rh800 was required for their formation.39,40
It needs to be remarked that the EAL factor does not take into consideration the intensity of the absorbance bands at the excitation wavelength. A comparison between the EAL factors presented in Fig. 4c) and the normalised EAL factors (EALNORM), which divide the intensity of the corresponding fluorescence intensity by the absorbance at the excitation wavelength, is presented in Fig. S4 (ESI†). The general trend for the EALNORM factor is opposite to the non-normalised one, i.e. this factor decreases as the Rh6G![[thin space (1/6-em)]](https://www.rsc.org/images/entities/char_2009.gif) :
:![[thin space (1/6-em)]](https://www.rsc.org/images/entities/char_2009.gif) Rh800 relative ratio increases for the same amount of Rh6G. One important conclusion of this EALNORM Factor is that the highest values are achieved for the highest Rh6G and Rh800 concentrations (3–3).
Rh800 relative ratio increases for the same amount of Rh6G. One important conclusion of this EALNORM Factor is that the highest values are achieved for the highest Rh6G and Rh800 concentrations (3–3).
4. Time-resolved fluorescence
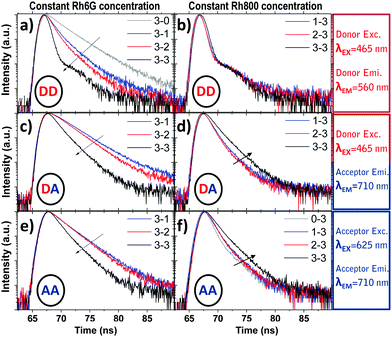
The time-decay profiles measured for PMMA thin films doped with one type of rhodamine follow the expected trend with the concentration characteristic of a homoaggregation process. For the lowest rhodamine concentration (1), the profiles have been adjusted with a biexponential curve with average lifetimes of 3.37 ns and 2.39 ns for Rh6G and Rh800, respectively (see the extracted and average lifetimes for the homodoped system in Table S2, ESI† bottom) and can be attributed to monomers of each rhodamine such as occurs in diluted ethanol solutions (3.99 and 2.07 ns for Rhodamine 6G and 800, respectively).52,53 Increasing the concentration leads to a decrease in the lifetime from 3.37 to 2.68 ns for Rh6G and from 2.39 to 0.86 ns for Rh800. This decreasing tendency of lifetime has been largely studied for rhodamines and is usually ascribed to the formation of dimers or higher aggregates.54For the heterodoped system, with the presence of two types of fluorescent molecules, time-dependent studies were carried out at two excitation wavelengths, 465/625 nm, and recorded two emission wavelengths at 560/710 nm, corresponding to the absorption and emission of the Rh6G/Rh800 (Donor/Acceptor in analogy to a Förster resonant process), respectively. The measurements are divided into three parts: excitation at 465 nm and emission at 560 nm: (Donor Excitation–Donor Emission, DD), excitation at 465 nm and emission at 710 nm (Donor Excitation–Acceptor Emission, DA) and excitation at 625 nm and emission at 710 nm (Acceptor Excitation–Acceptor Emission, AA).
Fig. 5 shows the time decay curves for these three cases: DD (top, a and b), DA (middle, c and d), and AA (bottom, e and f) for a fixed concentration of Rh6G (the highest, 3) and variable amounts of Rh800 (left, a, c and e) and vice versa (right, b, d and f). Fig. 5(a and b) (DD) show a monotonic decrease of the excited state lifetime while increasing the Rh800 concentration (a, for a constant concentration of Rh6G) whereas an increase in the Rh6G concentration (Rh800 constant) does not produce any change in the curves (b). Fig. 5(c) (DA) reveals again a decrease in the lifetime as the Rh800 concentration increases. Contrarily, the increase of the Rh6G concentration (d) induces an increment of the lifetime. The tendency in Fig. 5(e and f) (AA) is similar to DA (c and d). At first sight, the decrease in the lifetime observed in the left panels (a, c and e) for a variable amount of Rh800 is consistent with a quenching process provoked by the acceptor molecules. However, the increment of the lifetime observed at the acceptor emission wavelength (d and f) can be only understood as a result of the heteroaggregation. It is also remarkable that the increase of the acceptor lifetime with the Rh6G concentration (d and f) will have a direct impact on the determination of fluorescent quantum yields, which will be discussed in the following section.
The simplified energy level models for every case recorded in Fig. 5 (DD, DA, and AA) are shown in Scheme 2. According to them, the electrons in the upper exciton state are non-radiatively transferred to the lower state with a rate constant kDA. The population of the upper excited state is described by the following equations:55,56
 | (5) |
 | (6) |
| IDD(t) ∝ DDD(t) = D0·e−(kD+kDA)·t | (7) |
 | (8) |
 | (9) |
 | ||
| Scheme 2 Simplified exciton energy states for the formation of a heterodimer. Three cases have been represented depending on the excitation and emission wavelengths. DD: Exc. 465 nm, Em. 560 nm; DA: Exc. 465 nm, Em. 710 nm; AA: Exc. 625 nm, Em. 710 nm. Dotted arrows indicate the electron promotion for every case; the rest of the downward arrows represent the decay rates, kDA, kD, and kA, (the two latter decays are fluorescent) and those observed for every case are orange; the solid/dashed arrows represent the processes contributing/not contributing for every case to the decay curve of the excited heterodimer (see eqn (10)–(12)). | ||
However, several considerations deviate the behaviour of eqn (7)–(9): (i) even for homo-molecular systems, the decay curves need a two-exponential to fit the curves. Therefore, an additional exponential term in eqn (7) and (9), with rate constants  and
and  are needed; (ii) the existence of different homo or heteroaggregates with similar decay rates and/or the direct excitation of the acceptor through the donor wavelength makes the pre-exponential factor different for the positive and negative terms of eqn (8); (iii) the previous equations describe the energy level and decay rules for Rh6G and Rh800 heterodimers, not higher order aggregates. For this reason, we expect a deviation from the previous equations, as the Rh6G and Rh800 concentrations are very different.
These considerations modify eqn (7)–(9) as follows:
 | (10) |
 | (11) |
 | (12) |
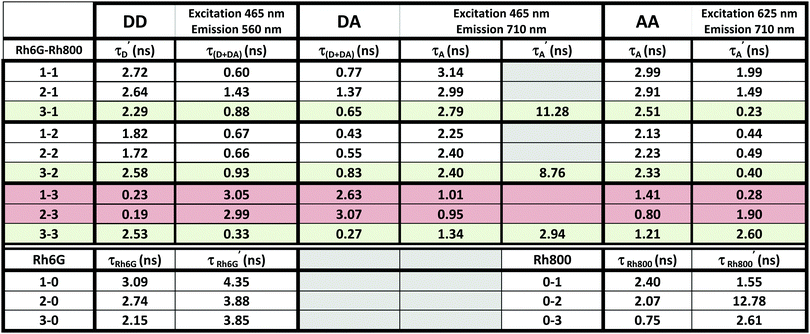
Table 1 shows the fitting parameters of the decay curves, according to eqn (10)–(12) relative to the cases DD, DA, and AA. The table shows the lifetime instead of the decay rates:
The complete table with the rest of the fitting parameters (preexponential factors, P, and Relative Amplitudes, RA) and the fitted curves and statistical analysis, χ-square and standard deviation, are shown in ESI† Table S2 and Fig. S5–S7. In all cases, the χ-square is below 2, supporting the fairness of the fitting. It is worth mentioning that for the DA cases, the software always found a good adjustment by fitting the decay curves with a positive and negative preexponential factor, as shown in Table S2 (ESI†). Eqn (11) contains a negative factor caused by the exponential filling of the lower exciton energy state from the upper one. This results in a rise-time decay profile that cannot be adjusted by the sum of the positive exponential decays. Only the samples with the highest concentration of Rh800, 1–3 and 2–3, deviate from this behaviour, and the fitting needed two positive preexponential factors (highlighted in red in Table 1 and Table S2, ESI†). This is likely caused by the formation of mixtures of homo- and hetero-aggregates with more complex behaviour. Moreover, to obtain an appropriate fitting of the decay curves of the samples with the highest concentration of Rh6G (3–1, 3–2, and 3–3), a third exponential term was needed. The weight of the third exponential term (in the DA case) for samples 3–1 and 3–2 is very low (around 3% of the relative amplitude) and with a very long associated lifetime. This third exponential term is added to improve the fitting (without this term the χ-square is higher around 2.5–3) since with a two-exponential curve, the tail at longer times was poorly adjusted. However, the third exponential factor for case 3–3 presents a much higher relative amplitude and the lifetime is more consistent with the formation of higher aggregates. In fact, this associated lifetime matches with the  found for the AA measurements (excitation/emission at 625/710 nm). This latter behaviour indicates a mixture of heteroaggregates and/or higher aggregates, expected for such higher Rh6G and Rh800 concentrations.
The validity of the model is proved not only by the existence of this rise-time associated to the negative preexponential factor in the fitting of the DA measurements (excitation/emission at 465/710 nm), but by the agreement of the lifetimes extracted from the different measurements. According to Eqn (10)–(12), the obtained rates (and thus lifetimes) for the DA measurements, must match with the lifetimes fitted for the cases DD (465/560 nm) and AA (625/710 nm). The rates extracted from these latter cases correspond to the (kD + kDA) for the negative exponential term and (kA) for the positive one. As can be seen in Table 1, the lifetimes extracted from the case DA (kD + kDA and kA) are in a very good concordance with those extracted from the cases DD and AA.
Another important aspect is found when comparing the relative intensities of the preexponential factors associated to the heteroaggregates (τ(D+DA) and τA) that are observed in the measurements DD and AA (see Table S2, ESI†), which reveal the number of species that are forming heteroaggregates and then taking part in the energy transfer. The relative intensity of (τD+DA) and (τA) continuously increases with the Rh6G and Rh800 concentration, being 96.3% and 86.7% for the higher concentration (3–3). All of these aspects clearly support the accuracy of the model proposed for the energy transfer.
5. Quantum yield measurements
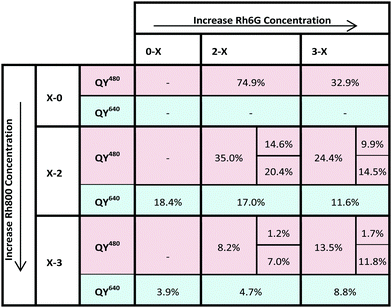
The quantum yield (QY) is a measure of the efficiency of a fluorescent process and is defined as the ratio between the number of emitted and absorbed photons. Table 2 gathers the quantum yields measured for the PMMA thin films doped with Rh6G–Rh800. It can be noted that the QY for samples containing one type of rhodamine (Rh6G, X–0 and Rh800, 0–X) decreases as the dye concentration increases. This typical homoaggregation behaviour reduces the QY from 74.9 to 32.9% for Rh6G, and from 18.4 to 3.9% for Rh800. Concretely, this significant decrease of the Rh800 QY would hinder the achievement of a high intensity of NIR emission from this molecule by itself.For the hetero-system Rh6G–Rh800, the quantum yields can be measured at two excitation wavelengths, 480 (QY480) and 640 nm (QY640). The results for the measurements at these two wavelengths are shown in Table 2. The two fluorescence bands observed by exciting at 480 nm can be used to separate the quantum yield contribution corresponding to the emission range of Rh6G (520–650 nm) and Rh800 (650–850 nm). This feature is shown in Table 2 by splitting the QY480 values.
QYs along a column correspond to samples with a fixed amount of Rh6G and a variable amount of Rh800 (increasing from top to bottom). Along a row, QYs correspond to samples with a fixed amount of Rh800 and a variable concentration of Rh6G (increasing from left to right). Along the second and third columns, it can be observed that an increase in the amount of Rh800 molecules produces a decrease in the overall QY480, from 74.9 to 8.2% for (2–X) and from 32.9 to 13.5% for (3–X). It is remarkable that the increase of Rh800 concentration in the samples containing a lower amount of Rh6G (2–X, less aggregates) results in a much stronger decrease in the QY480 than for samples containing a higher amount of Rh6G (3–X).
The tendency along the middle row (X–2) is similar to that reported before, in which the QY640 decreases as the amount of Rh6G molecules increases. However, the tendency is opposite for the higher concentration of Rh800 molecules (X–3): in comparison with the PMMA homo-doped with Rh800 (0–3), the presence of Rh6G increases significantly the quantum yield, from 3.9 to 8.8%, more than double, for the highest concentration of both (3–3). The modification of the QY640 between the Rh800 homodoped and the corresponding row (in the table) in the heterodoped systems represent an additional proof of the presence of Rh6G–Rh800 heteroaggregates with different fluorescent properties. In a pure Förster resonance energy transfer, the quantum yield of the acceptor molecules (in this case the QY640) cannot be modified, since the dipolar interaction is weak. However, this behaviour does not discard a certain contribution from a radiative or resonant energy transfer process due to the partial overlap between the Rh6G emission and Rh800 absorption.
Another outstanding characteristic is the relative contribution of the QY480 to the emission range of Rh6G and Rh800. For a fixed amount of Rh800 (for example, the middle row X–2), the contribution to the total QY480 from the Rh6G area is still important, but it decreases strongly for the highest concentration of Rh800 (bottom row X–3). I.e., the relative contribution to the QY480 from the Rh800 emission for the 3–2 and 3–3 samples is around 60% (14.5%/24.4%) and 88% (11.8%/13.5%), respectively. This behaviour indicates that the heteroaggregates formed at the highest concentration of both molecules possess an enhanced luminescence in the Near Infrared region.
To get a clearer idea about the efficiency of the fluorescent process, Fig. 6 shows three pictures of the studied samples illuminated with visible light (a) and with UV light at 350 nm (b and c). Fig. 6(c) presents the same configuration as (b) but taking the picture through a filter that blocks the light below 650 nm. Using 350 nm as the excitation source is equivalent to 480 nm since at this wavelength only the Rh6G presents an absorption band (although less intense). The arrangement of the samples is similar to Table 2: from left to right and top to bottom increases the Rh6G and Rh800, respectively. Fig. 6(b) shows that the intensity of light decreases from top to bottom, showing that the overall QY480 is decreasing with the amount of Rh800. At the same time, the intensity of light in the NIR increases from left to right, indicating an opposite behaviour: for a constant Rh800, the NIR emission obtained by exciting with light in the Rh6G absorption range, increases with the amount of this latter molecule.
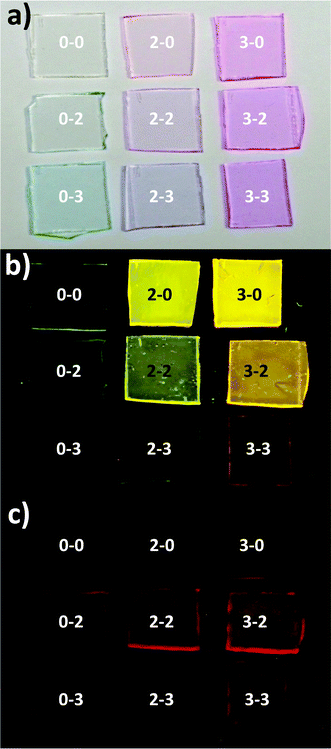 | ||
| Fig. 6 Pictures of the Rh6G–Rh800/PMMA thin films illuminated with visible light (a), and with light at 350 nm (b and c). Fig. 5(c) presents the same configuration as (b), but through a filter that cuts the light below 650 nm. The actual concentrations are: 0–0, [Rh6G] = [Rh800] = 0; 2–0, [Rh6G] = 6.73 mM, [Rh800] = 0; 3–0, [Rh6G] = 22.40 mM, [Rh800] = 0; 0–2, [Rh6G] = 0, [Rh800] = 6.72 mM; 2–2, [Rh6G] = 6.71 mM, [Rh800] = 6.71 mM; 3–2, [Rh6G] = 22.73 mM, [Rh800] = 6.67 mM; 0–3, [Rh6G] = 0, [Rh800] = 22.38 mM; 2–3, [Rh6G] = 6.66 mM, [Rh800] = 22.32 mM; 3–3, [Rh6G] = 22.19 mM, [Rh800] = 22.19 mM. | ||
Conclusions
We have studied the optical and fluorescent properties of Rh6G and Rh800 molecules embedded in PMMA thin films. The UV-Vis absorbance spectra reveal significant modifications in the absorption bands associated with the molecules. In particular, the molar absorptivity of the Rh800 band is reduced as the amount of Rh6G increases for a fixed concentration of Rh800, whereas the Rh6G one is increased as the concentration of Rh800 rises. This behaviour indicates that the two types of rhodamine molecules form ground-state heteroaggregates,35–38 which have been analyzed by using the exciton theory.1,5,7 The modifications of the molar absorptivity of the dyes point to the formation of H-type heterodimers. However, the simultaneous existence of homo and heteroaggregates with a certain distribution of geometries in the PMMA layers hinders proper characterization of the bands and, consequently, of the geometric characteristics of the heteroaggregates.Contrarily to the case of homoaggregation, the H-type heterodimers are fluorescent.1,29 The heterodoped PMMA layers present two intense fluorescence bands when using an excitation source within the absorption of Rh6G. For most concentrations, the NIR band intensity is significantly higher than the lower wavelength one, indicating a very effective energy transfer between Rh6G–Rh800 molecules. Besides, the increase of the molar absorptivity of the Rh6G band indicates that the heteroaggregates can enhance even more the absorption of light at 480 nm, favouring the light collection. Thus, the fluorescent samples reported here behave as wavelength shifters, converting effectively the visible light at 480 nm to the NIR at 710 nm in one single step, despite the low quantum yield of the Rh800 molecule, one of the lowest among the xanthene family. To quantify the effectiveness of this energy transfer, we have defined the Enhanced Acceptor Luminescence (EAL) factor, reporting values as high as 2.9. These results are in very good correspondence with previous publications about the formation of the so-called Heteroaggregates with Enhanced Acceptor Luminescence or HEAL.39,40
We analysed the time-dependent characteristics of the samples and propose a time-decay model for the population of the exciton states in the heterodimers. The fittings are in very good agreement with the model proposed, which predicts a rise time profile in the decay curves. Besides, the quantum yield analysis revealed that the formation of the heteroaggregates modifies the efficiency of the energy transfer. We have confirmed that the QY480 (measured by exciting within the Rh6G absorption band) presents a significantly higher contribution in the NIR than in the visible region. The most significant case is the PMMA sample doped with the highest concentration of both molecules, which presents a total QY480 of 13.5%, with an enhanced luminescence in the NIR region of 11.8% (87% of relative amplitude) of the total.
We have proven for the first time an efficient energy transfer between Rh6G and Rh800 molecules embedded in PMMA polymeric matrices, which can be used as wavelength shifters to effectively convert the light from the visible range below 500 nm to the NIR above 700 nm. This energy transfer, governed by the formation of ground-state heteroaggregates, can be easily controlled by adjusting the rhodamine concentration. In particular, the wavelength shifting to the NIR reported is very convenient for a number of practical applications, which make use of inexpensive commercial detectors and systems.
Conflicts of interest
There are no conflicts to declare.Acknowledgements
We thank the projects PID2019-110430GB-C21 and PID2019-109603RA-I00 funded by MCIN/AEI/10.13039/501100011033 and by “ERDF (FEDER) A way of making Europe”, by the “European Union”. We also thank the Consejería de Economía, Conocimiento, Empresas y Universidad de la Junta de Andalucía (PAIDI-2020 through projects US-1263142, US-1381057, AT17-6079, P18-RT-3480), and the EU through cohesion fund and FEDER 2014–2020 programs for financial support. JS-V thanks the University of Seville through the VI PPIT-US and Ramon y Cajal Spanish National program. FJA also thanks the EMERGIA Junta de Andalucía program. The projects leading to this article have received funding from the EU H2020 program under the grant agreement 851929 (ERC Starting Grant 3DScavengers).Notes and references
- D. Bialas, E. Kirchner, M. I. S. Röhr and F. Würthner, J. Am. Chem. Soc., 2021, 143, 4500–4518 CrossRef CAS PubMed.
- O. Ostroverkhova, Chem. Rev., 2016, 116, 13279–13412 CrossRef CAS PubMed.
- J. Gierschner, J. Shi, B. Milián-Medina, D. Roca-Sanjuán, S. Varghese and S. Park, Adv. Opt. Mater., 2021, 9, 2002251 CrossRef CAS.
- J. Gierschner and S. Y. Park, J. Mater. Chem. C, 2013, 1, 5818–5832 RSC.
- M. Kasha, H. R. Rawls and M. Ashraf El-Bayoumi, Pure Appl. Chem., 1965, 11, 371–392 CAS.
- A. S. Davydov, Sov. Phys. Usp., 1964, 7, 145 CrossRef.
- D. Bialas, A. Zitzler-Kunkel, E. Kirchner, D. Schmidt and F. Würthner, Nat. Commun., 2016, 7, 1–11 Search PubMed.
- A. J. C. Kuehne and M. C. Gather, Chem. Rev., 2016, 116, 12823–12864 CrossRef CAS PubMed.
- G. Griffini, Front. Mater., 2019, 6, 29 CrossRef.
- X. Cai and B. Liu, Angew. Chem., Int. Ed., 2020, 59, 9868–9886 CrossRef CAS PubMed.
- T. Brixner, R. Hildner, J. Köhler, C. Lambert and F. Würthner, Adv. Energy Mater., 2017, 7, 1700236 CrossRef.
- F. Lopez-arbeloa, V. Martinez-martinez, T. Arbeloa and I. Lopez-arbeloa, J. Photochem. Photobiol., C, 2007, 8, 85–108 CrossRef CAS.
- J. R. Sánchez-Valencia, I. Blaszczyk-Lezak, J. P. Espinós, S. Hamad, A. R. González-Elipe and A. Barranco, Langmuir, 2009, 25, 9140–9148 CrossRef PubMed.
- J. R. Sánchez-Valencia, A. Borrás, A. Barranco, V. J. Rico, J. P. Espinós and A. R. González-Elipe, Langmuir, 2008, 24, 9460–9469 CrossRef PubMed.
- F. L. Arbeloa, V. Martínez, T. Arbeloa and I. L. Arbeloa, in Reviews in Fluorescence 2008, ed. C. D. Geddes, Springer, New York, NY, 2010, vol. 2008, pp. 1–35 Search PubMed.
- Z. Chang, F. Liu, L. Wang, M. Deng, C. Zhou, Q. Sun and J. Chu, Chin. Chem. Lett., 2019, 30, 1856–1882 CrossRef CAS.
- C. T. Jackson, S. Jeong, G. F. Dorlhiac and M. P. Landry, iScience, 2021, 24, 102156 CrossRef CAS PubMed.
- S. Zhu, R. Tian, A. L. Antaris, X. Chen and H. Dai, Adv. Mater., 2019, 31, 1900321 CrossRef PubMed.
- S. Sun, L. Ma, J. Wang, X. Ma and H. Tian, Natl. Sci. Rev., 2021, nwab085 Search PubMed.
- T. Zhang, X. Ma and H. Tian, Chem. Sci., 2020, 11, 482–487 RSC.
- D. Magde, G. E. Rojas and P. G. Seybold, Photochem. Photobiol., 1999, 70, 737–744 CrossRef CAS.
- L. Wang, W. Du, Z. Hu, K. Uvdal, L. Li and W. Huang, Angew. Chem., Int. Ed., 2019, 58, 14026–14043 CrossRef CAS PubMed.
- A. Alessi, M. Salvalaggio and G. Ruzzon, J. Lumin., 2013, 134, 385–389 CrossRef CAS.
- Y. Deng, W. Yuan, Z. Jia and G. Liu, J. Phys. Chem. B, 2014, 118, 14536–14545 CrossRef CAS PubMed.
- N. J. Hestand and F. C. Spano, Acc. Chem. Res., 2017, 50, 341–350 CrossRef CAS PubMed.
- J. Chen, T. Zhang, S. Wang, R. Hu, S. Li, J. S. Ma and G. Yang, Spectrochim. Acta, Part A, 2015, 149, 426–433 CrossRef CAS PubMed.
- B. Liu, H. Zhang, S. Liu, J. Sun, X. Zhang and B. Z. Tang, Mater. Horiz., 2020, 7, 987–998 RSC.
- E. Kirchner, D. Bialas and F. Würthner, Chem. – Eur. J., 2019, 25, 11294–11301 CAS.
- B. Z. Packard, D. D. Toptygin, A. Komoriya and L. Brand, J. Phys. Chem. B, 1998, 102, 752–758 CrossRef CAS.
- P. Ensslen, Y. Fritz and H.-A. Wagenknecht, Org. Biomol. Chem., 2014, 13, 487–492 RSC.
- E. Kirchner, D. Bialas, F. Fennel, M. Grüne and F. Würthner, J. Am. Chem. Soc., 2019, 141, 7428–7438 CrossRef CAS PubMed.
- S. F. Völker, A. Schmiedel, M. Holzapfel, K. Renziehausen, V. Engel and C. Lambert, J. Phys. Chem. C, 2014, 118, 17467–17482 CrossRef.
- L. Wu, C. Huang, B. P. Emery, A. C. Sedgwick, S. D. Bull, X.-P. He, H. Tian, J. Yoon, J. L. Sessler and T. D. James, Chem. Soc. Rev., 2020, 49, 5110–5139 RSC.
- M. Dimura, T. O. Peulen, C. A. Hanke, A. Prakash, H. Gohlke and C. A. Seidel, Curr. Opin. Struct. Biol., 2016, 40, 163–185 CrossRef CAS PubMed.
- T. H. Förster, Ann. Phys., 1948, 437, 55–75 CrossRef.
- R. S. Knox, J. Biomed. Opt., 2012, 17, 011003 CrossRef PubMed.
- S. Bernacchi, Nucleic Acids Res., 2001, 29, 62e–662 CrossRef PubMed.
- K. Kikuchi, in Nano/Micro Biotechnology, ed. I. Endo and T. Nagamune, Springer, Berlin, Heidelberg, 2010, pp. 63–78 Search PubMed.
- J. R. Sánchez-Valencia, J. Toudert, L. González-García, A. R. González-Elipe and A. Barranco, Chem. Commun., 2010, 46, 4372 RSC.
- J. R. Sánchez-Valencia, F. J. Aparicio, J. P. Espinós, A. R. Gonzalez-Elipe and A. Barranco, Phys. Chem. Chem. Phys., 2011, 13, 7071 RSC.
- M. Zettl, O. Mayer, E. Klampaftis and B. S. Richards, Energy Technol., 2017, 5, 1037–1044 CrossRef.
- B. Zhang, H. Soleimaninejad, D. J. Jones, J. M. White, K. P. Ghiggino, T. A. Smith and W. W. H. Wong, Chem. Mater., 2017, 29, 8395–8403 CrossRef CAS.
- N. Adarsh and A. S. Klymchenko, Nanoscale, 2019, 11, 13977–13987 RSC.
- C. On, E. K. Tanyi, E. Harrison and M. A. Noginov, Opt. Mater. Express, 2017, 7, 4286 CrossRef CAS.
- Physical Properties of Polymers Handbook, ed., J. E. Mark, Springer, New York, NY, 2007 Search PubMed.
- J. R. Lakowicz and B. R. Masters, J. Biomed. Opt., 2008, 13, 029901 CrossRef.
- L. Porrès, A. Holland, L.-O. Pålsson, A. P. Monkman, C. Kemp and A. Beeby, J. Fluoresc., 2006, 16, 267–273 CrossRef PubMed.
- V. Martínez Martínez, F. López Arbeloa, J. Bañuelos Prieto, T. Arbeloa López and I. López Arbeloa, J. Phys. Chem. B, 2004, 108, 20030–20037 CrossRef.
- K. Sekiguchi, S. Yamaguchi and T. Tahara, J. Phys. Chem. A, 2006, 110, 2601–2606 CrossRef CAS PubMed.
- M. Kasha, Radiat. Res., 2012, 178, AV27–AV34 CrossRef CAS PubMed.
- B. Z. Packard, A. Komoriya, D. D. Toptygin and L. Brand, J. Phys. Chem. B, 1997, 101, 5070–5074 CrossRef CAS.
- D. Magde, R. Wong and P. G. Seybold, Photochem. Photobiol., 2002, 75, 327–334 CrossRef CAS PubMed.
- S. Daehne, U. Resch-Genger and O. S. Wolfbeis, Near-Infrared Dyes for High Technology Applications, Springer Science & Business Media, 2012 Search PubMed.
- J. P. Cassidy, J. A. Tan and K. L. Wustholz, J. Phys. Chem. C, 2017, 121, 15610–15618 CrossRef CAS.
- S. Lindhoud, A. H. Westphal, C. P. M. van Mierlo, A. J. W. G. Visser and J. W. Borst, Int. J. Mol. Sci., 2014, 15, 23836–23850 CrossRef PubMed.
- S. P. Laptenok, J. W. Borst, K. M. Mullen, I. H. M. van Stokkum, A. J. W. G. Visser and H. van Amerongen, Phys. Chem. Chem. Phys., 2010, 12, 7593 RSC.
Footnotes |
| † Electronic supplementary information (ESI) available: Tables S1 and S2, Figures S1–S7. See DOI: https://doi.org/10.1039/d1tc06167d |
| ‡ Present address: INM–Leibniz Institute for New Materials, Campus D2 2, 66123 Saarbrücken, Germany. |
| This journal is © The Royal Society of Chemistry 2022 |

