
 Open Access Article
 This Open Access Article is licensed under a
 Creative Commons Attribution 3.0 Unported Licence
Thorough investigation on the high-temperature polymorphism of dipentyl-perylenediimide: thermal expansion vs. polymorphic transition†
Francesco
Marin
a,
Serena
Tombolesi
a,
Tommaso
Salzillo
 *b,
Omer
Yaffe
b and
Lucia
Maini
*a
*b,
Omer
Yaffe
b and
Lucia
Maini
*a
aDipartimento di Chimica “G. Ciamician”, via Selmi 2, Università di ologna, 40126 Bologna, Italy. E-mail: l.maini@unibo.it
bDepartment of Chemical and Biological Physics, Weizmann Institute of Science, Herzl Street 234, 76100 Rehovot, Israel. E-mail: tommaso.salzillo@unibo.it
First published on 3rd May 2022
Abstract
N,N′-Dipentyl-3,4,9,10-perylendiimide (PDI-C5) is an organic semiconducting material which has been extensively investigated as model compound for its optoelectronic properties. It is known to be highly thermally stable, that it exhibits solid-state transitions with temperature and that thermal treatments lead to an improvement in its performance in devices. Here we report a full thermal characterization of PDI-C5 by combination of differential scanning calorimetry, variable temperature X-ray diffraction, hot stage microscopy, and variable temperature Raman spectroscopy. We identified two high temperature polymorphs, form II and form III, which form respectively at 112 °C and at 221 °C and we determined their crystal structure from powder data. Form II is completely reversible upon cooling with low hysteresis, while form III revealed a different thermal behaviour upon cooling depending on the technique and crystal size. The crystal structure features of the different polymorphs are discussed and compared, and we looked into the role of the perylene core and alkyl chains during solid-state transitions. The thermal expansion principal axis of PDI-C5 crystal forms is reported showing that all the reported forms possess negative thermal expansion (X1) and large positive thermal expansion (X3) which are correlated to thermal behaviour observed.
Introduction
Polymorphism, the ability of a compound to crystallize in more than one crystal structure, is a well-known natural phenomenon common to both inorganic and organic materials. As the crystalline structure has a major impact on the solid-state properties of materials, understanding and controlling crystal polymorphism is a long-standing challenge relevant to many fields and applications such as pharmaceuticals, pigments, organic semiconductors, etc.1–5 In the case of organic semiconductors (OSCs), controlling the polymorphism is fundamental since small changes in the molecular packing can lead to dramatic variations in their optoelectronic and charge-transport properties. Consequently, efforts have been made to control molecular packing for improving charge-transport and photophysical properties of OSCs via chemical functionalization and modifications, via control of the crystallization process, and via post-deposition processing.6–11Among the OSCs, perylene-3,4,9,10-tetracarboxydiimides, also known as perylene diimides (PDIs), are a well-known family of promising n-type materials because of their high electron affinity, low LUMO energies and good charge transport properties. Furthermore, PDIs are characterized by excellent chemical, thermal, photo stability and good air stability together with strong absorption in the visible region and high photoemission. The combination of these properties makes PDIs promising candidates for several applications such as organic field effect transistors (OFETs),12–16 organic solar cells,17,18 laser dye,19,20 pigments,21,22etc. Recently PDIs are also studied for low-temperature thermoelectric generator applications.23,24
Thanks to their planar structure and peripherally rich oxygen atoms, PDIs favor π–π stacking between molecules, which creates a basis of well-defined growth.25,26 Nevertheless, substitution can make significant effect on the solubility, optical and electrochemical properties, crystal packing and structural morphology. Despite the numerous studies and investigation on PDI derivatives, less is known about their polymorphic behaviour, which comprises numerous thermally induced solid-state transitions.27–30
It is well known that thermal treatment such as thermal annealing, can be effective in case of PDIs since can dramatically improve crystallinity and performance in devices. Furthermore, their excellent thermal stability allows thermal treatment to be performed even above 200 °C. The improvement in performance is a consequence of molecular rearrangement induced by temperature, which gives more energy to the molecules to migrate. Nevertheless, considering the high temperature at which annealing can be performed in case of PDIs, in some cases also thermally induced solid-state transition can occur and must be considered.31–36
In search to rationalize what changes take place during such thermally induced polymorphic transition, in this paper we present a combined study on the polymorphism of N,N′-dipentyl-3,4,9,10-perylenediimides (hereafter abbreviated as PDI-C5) with temperature. This material is a widely studied and commercially available PDI, substituted with a linear pentyl alkyl chain at the imide position and without substitution at the perylene core. The crystals of PDI-C5 appears as dark red coloured and its structure, of the commercial form, was previously reported by Hädicke et al. (CSD refcode: DICMUX).37 Thermal analysis on PDI-C5 highlighted the presence of two solid-state transitions,36 however their characteristics were not previously investigated in detail and the different phase names were not assigned, hence, from here on out crystal phase of the starting material will be called form I. We investigated the high temperature polymorphs (form II and III) of PDI-C5via variable temperature X-ray diffraction from synchrotron radiation and Raman spectroscopy; we solved the structure of form II and form III of PDI-C5 from a synergic approach combining synchrotron powder data and Raman spectroscopy. Moreover, by solvothermal crystallization we obtained a p-xylene solvate form, whose structure was solved by single crystal X-ray diffraction (SCXRD). Furthermore, in this paper the thermal expansion of the different crystal forms is investigated and a comparison between the crystal structures is discussed in detail to give insight on what kind of transformation are brought by transitions in the crystals.
Results and discussion
Several crystallization methods from solution (solvent evaporation, triple layer crystallization, solvothermal processes, fast precipitation) were used to obtain different crystal forms of PDI-C5 and good crystals for single crystal X-ray diffraction measurements. Out of these methods, solvothermal crystallization resulted the most effective one to produce single crystals, also because of the poor solubility of PDI-C5 (less than 1 mg mL−1 in the used solvents) which hindered the efficiency of the other methods. Almost all these crystallizations resulted in the formation of form I (Fig. 1a and b), aside for solvothermal crystallization in toluene and in p-xylene which resulted in the formation of solvate forms. Only the crystals obtained in p-xylene were good enough for a full data collection, while for crystals obtained in toluene solvate it was only possible to determine the unit cell parameters which are isomorphous to the p-xylene solvate.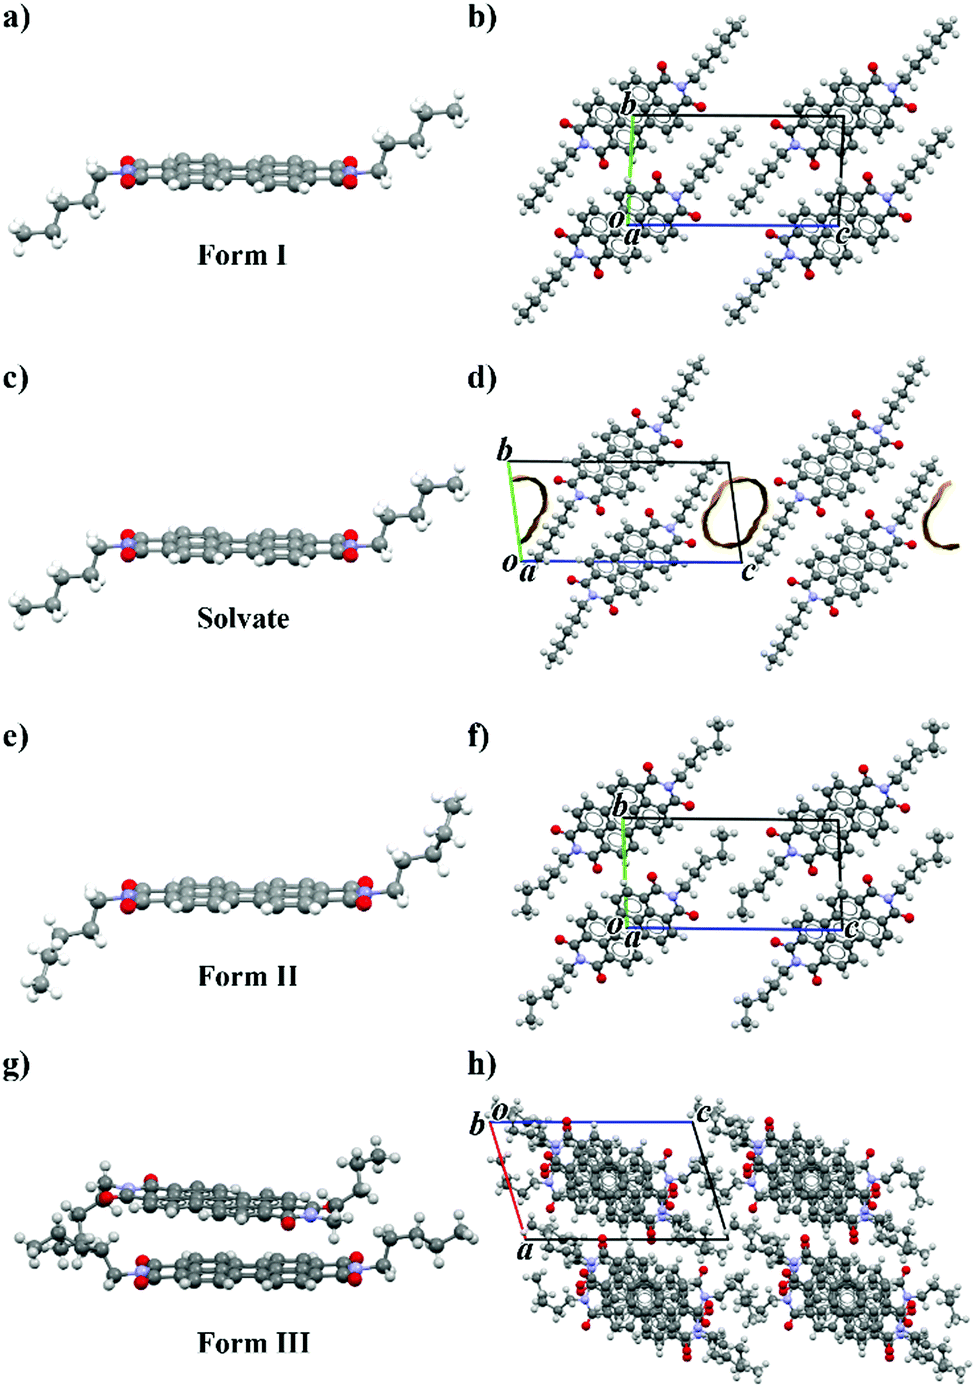 | ||
| Fig. 1 Crystal structure of PDI-C5 (a) form I; (b) form I viewed along a-axis; (c) solvate form; (d) solvate form viewed along a-axis; (e) form II; (f) form II viewed along a-axis; (g) form III; (h) form III viewed along b-axis. | ||
For the sake of clarity, first are presented and compared all the crystal structures in this work and then their behaviour with temperature is discussed.
Crystal structure of PDI-C5-pXy and PDI-C5-tol
The p-xylene solvate crystal structure was solved from SCXRD at 200 K. The crystal structure of pXy-PDI-C5 (Fig. 1c and d) is triclinic, space group P![[1 with combining macron]](https://www.rsc.org/images/entities/char_0031_0304.gif) , with the molecule lying on an inversion centre, and hence half molecule in the asymmetric unit (Z′ = 0.5). The perylene core of the molecule is planar, while the alkyl chains are straightened out almost perpendicular to the perylene plane and are in trans configuration (due to the inversion centre). The PDI molecules are arranged one above the other connected via π–π interactions, forming columns along the unit cell a-axis. Neighbouring columns of PDI molecules are then linked together through π-stacking and weak C–H⋯O interactions. It was not possible to model the position of the solvent molecules, because they are disordered inside channels parallel to the a-axis in the alkyl chain region. The volume of the voids in the structure (106 Å3, corresponding to 14.5% of the unit cell volume, using a 1.2 Å probe radius) is smaller than the expected volume for one toluene molecule in the crystal (160 Å3), indicating a stoichiometry lower than 1
, with the molecule lying on an inversion centre, and hence half molecule in the asymmetric unit (Z′ = 0.5). The perylene core of the molecule is planar, while the alkyl chains are straightened out almost perpendicular to the perylene plane and are in trans configuration (due to the inversion centre). The PDI molecules are arranged one above the other connected via π–π interactions, forming columns along the unit cell a-axis. Neighbouring columns of PDI molecules are then linked together through π-stacking and weak C–H⋯O interactions. It was not possible to model the position of the solvent molecules, because they are disordered inside channels parallel to the a-axis in the alkyl chain region. The volume of the voids in the structure (106 Å3, corresponding to 14.5% of the unit cell volume, using a 1.2 Å probe radius) is smaller than the expected volume for one toluene molecule in the crystal (160 Å3), indicating a stoichiometry lower than 1![[thin space (1/6-em)]](https://www.rsc.org/images/entities/char_2009.gif) :1. 1H-NMR of PDI-C5-pXy and PDI-C5-tol (Fig. S2 and S3, ESI†) confirm the presence and nature of the solvent in the crystals. The solvates tends to convert back to form I when conserved outside of the mother liqueur and this process is slower for p-xylene compared to toluene. The different stability of the PDI-C5-pXy and PDI-C5-tol can be due to their respective entropy penalty for solvate formation (estimated 0.8 kJ mol−1 for p-xylene and 4.5 kJ mol−1 for toluene at 300 K). In case of toluene, a higher enthalpy gain is needed to compensate its large entropy penalty for inclusion in the crystal, increasing the instability of the solvate.38
:1. 1H-NMR of PDI-C5-pXy and PDI-C5-tol (Fig. S2 and S3, ESI†) confirm the presence and nature of the solvent in the crystals. The solvates tends to convert back to form I when conserved outside of the mother liqueur and this process is slower for p-xylene compared to toluene. The different stability of the PDI-C5-pXy and PDI-C5-tol can be due to their respective entropy penalty for solvate formation (estimated 0.8 kJ mol−1 for p-xylene and 4.5 kJ mol−1 for toluene at 300 K). In case of toluene, a higher enthalpy gain is needed to compensate its large entropy penalty for inclusion in the crystal, increasing the instability of the solvate.38
Crystal structure of PDI-C5 form II
The crystal structure of PDI-C5 form II (Fig. 1e and f) was solved from synchrotron powder XRD data at 131 °C and is triclinic, space group P, with half molecule in the asymmetric unit (Z = 1; Z′ = 0.5). The perylene core of the molecule is planar, while the alkyl chains are in trans configuration, almost perpendicular to the perylene plane, with a slightly twisted conformation. The PDI molecules are arranged one above the other connected via π–π interactions, forming columns along the unit cell a-axis. Then, neighbouring columns of PDI molecules are then linked together through π-stacking and weak C–H⋯O interactions. The crystal structure probably possesses some degree of disorder in the alkyl chain region which was not modelled in the structure solution from powder data.
Crystal structure of PDI-C5 form III
As described later, the PDI-C5 form III is obtained at high temperature; however, during VTXRPD form III did not convert back to form I upon cooling and thus it was possible to isolate form III at room temperature and its powder pattern was used for crystal structure determination. The crystal structure of PDI-C5 form III (Fig. 1g and h) was solved from synchrotron powder XRD data at 25 °C and is triclinic, space group P, with one and a half molecule in the asymmetric unit (Z = 3; Z′ = 1.5); one molecule lies in an inversion centre, while the other lies in a general position. The molecule in the inversion centre is characterized by a planar perylene core and by alkyl chains in trans configuration; while the molecule in general position is characterized by a planar perylene core and by alkyl chains in cis configuration. The molecules are stacked one above the other connected via π–π interactions, forming columns along the unit cell b-axis. In the columns, every two molecules with cis alkyl chains are alternated by a molecule with trans alkyl chains, whose perylene core is rotated (about 32°) and slightly tilted respect the other two molecules, resulting in alternation of shifted and criss-crossed π-stacking. The distance between the perylene core plane of two adjacent molecules with cis alkyl chains is dπ–π = 3.35 Å, while a higher distance of dπ–π = 3.54 Å is present between one molecule with cis alkyl chain and one with trans alkyl chain. This particular arrangement in the columns result in a slightly lighter red colour compared to other PDI-C5 crystal forms.
Comparative structure analysis
The PDI-C5 crystal structures were analysed and compared using the software Mercury39 and CrystalExplorer,40,41 which are useful tools to explore and get more insight in the crystal structure and to highlight features, similarities and difference in the crystal packing. The solvate form was however excluded from the comparison with CrystalExplorer because the lack of the solvent in the crystal structure model avoids an accurate calculation of the interactions.The crystal structures of PDI-C5 form I, form II, and solvated forms (Fig. 1) possess several common features. First, all of them were solved in a triclinic space group (P), with half molecule in the asymmetric unit. In addition, these structures display the same packing motif: the molecules are arranged in a mono-dimensional (1D) lamellar packing motif, forming columns along a-axis characterised by strong π–π stacking interactions between the perylene aromatic cores (Fig. 2a). Different columns are linked to the neighbouring columns through π-stacking and weak C–H⋯O interactions. The result is a layered structure in which rigid aromatic core regions alternates with alkyl chain regions (Fig. 2b). All these common features make these three structures extremely similar, and this is reflected in their unit cell parameters (Table 1). The difference between these three structures lies, of course, in the presence of the solvent channels in case of the solvates, and in a slightly twisted conformation of the alkyl chains in case of form II respect to the other forms.
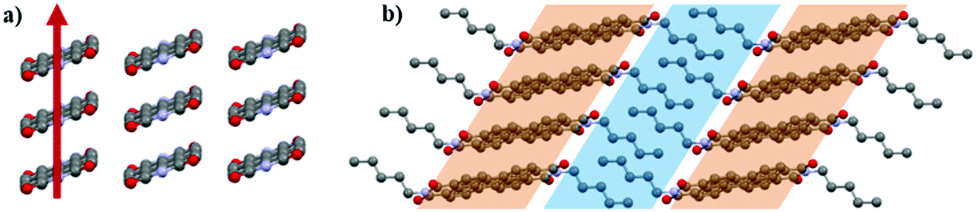 | ||
| Fig. 2 Packing motif in PDI-C5 crystal structures: (a) columnar arrangement of π-stacked molecules with the arrow indicating the direction of π−π stacking interactions (alkyl chains omitted for clarity); (b) lamellar packing formed by alternated layers of alkyl chains and aromatic cores. | ||
| PDI-C5 form I | PDI-C5 form II | PDI-C5 form III | PDI-C5p-xy | |
|---|---|---|---|---|
| CSD code | DICMUX | This work | This work | This work |
| Spacegroup |
P |
P |
P |
P |
| a (Å) | 4.754(2) | 4.846 | 11.624 | 4.7198(6) |
| b (Å) | 8.479(4) | 8.531 | 11.617 | 8.510(1) |
| c (Å) | 16.30(1) | 16.702 | 17.415 | 18.491(4) |
| α (°) | 86.88(5) | 91.59 | 98.21 | 97.82(1) |
| β (°) | 83.50(5) | 82.31 | 71.25 | 90.44(1) |
| γ (°) | 83.68(4) | 81.49 | 116.06 | 96.31(1) |
| V (Å3) | 648.1 | 676 | 200 | 731.2 |
| Z | 1 | 1 | 3 | 1 |
| Z′ | 0.5 | 0.5 | 1.5 | 0.5 |
| T (K) | 298 | 403 | 298 | 200 |
| R | 6.3 | — | — | 7.7 |
| R wp | — | 4.87 | 3.81 | — |
| R p | — | 3.36 | 2.77 | — |
| Description | Single crystal | Powder | Powder | Single crystal |
The similarity between form I and form II crystal structures is maintained in their respective fingerprint plots41 (Fig. 3a and b), in which the overall shape of the plot formed by the totality of contacts is preserved, although a bit deformed by the temperature difference and by the chain conformation; even the contribution of the separate types of contacts is almost unvaried. In fingerprint plots, information related to π–π stacking can be found by considering only C⋯C contacts; in case of form I and II, this plot reflects again the similarities between these two polymorphs, where only the centre of the distribution of contacts (cyano-green coloured region in Fig. 3d and e) slightly shifted at higher distances for form II, most likely due to thermal expansion effect. Some other minor differences derive probably from alkyl chains and peripheric core carbon atoms. Form I and II crystal structures differ mainly in the conformation of the alkyl chains, which means that the first transition with temperature concerns almost only the alkyl chains.
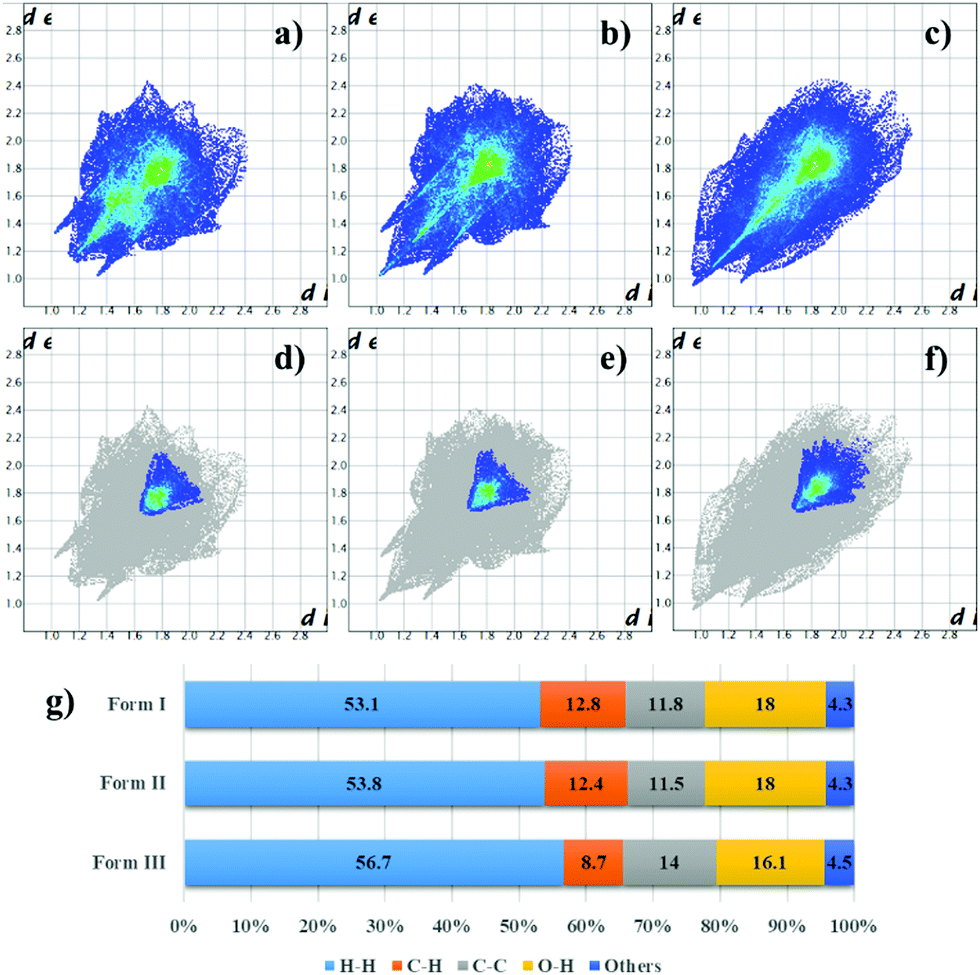 | ||
| Fig. 3 Crystal packing analysis of form I, II and III by CrystalExplorer. (a–c) fingerprint plots of form I, II and III respectively; (d–f) contributions of C⋯C contacts in the fingerprint plots of form I, II and III respectively; (g) percentage of the different contact contribution in the plot for the three PDI-C5 crystal forms. | ||
In contrast, form III is different from the other forms (Fig. 1g and h). Even though a similar 1D lamellar packing motif is maintained (Fig. 4b), the molecules are arranged in a different fashion along the columns: two molecules out of three present in the cell, are packed together with a small shift to maximize π-stack interaction, while the third one is rotated by an angle of about 32° (Fig. 4a) and its perylene core plane is slightly tilted respect the core plane of the other two molecules. This criss-cross arrangement in the π-stacked column is uncommon for PDI substituted only by linear alkyl chain in the imide position, whereas it is quite common for PDIs substituted in the same position with bulky groups or aromatic rings close to the planar core.29,30 In these PDIs, the bulky groups cause a steric hindrance effect that results in the rotation of neighbouring molecule and hence of criss-cross π–π stacking. In case of PDI-C5 form III, criss-cross most likely derives from an increase in the steric hindrance exhibited by the alkyl chains due to the elevated temperature, at which the thermal motion of the alkyl chains becomes more important. Furthermore, two out of three molecules have the alkyl chains in cis configuration, while the third has the alkyl chains in trans configuration, in contrast with the only trans configuration of alkyl chains in the other PDI-C5 crystal forms. Therefore, the second transition (form II to form III) involves the aromatic cores and a dramatic rearrangement of the alkyl chains.
 | ||
| Fig. 4 Crystal structure of PDI-C5 form III: (a) criss-cross arrangement of molecules into the π-stacked columns; (b) lamellar packing motif where is highlighted the alternation of two molecules with a shifted stacking (in red) and one in criss-cross stacking (blue). | ||
Form III features are reflected in its fingerprint plot (Fig. 3c, f and g), where differences to other forms can be observed either in the shape of the plot and in the percentage of the various contact contributions. Nevertheless, in some way the finger print shape of the total contacts can still remind the shape of the of the other two forms since the packing motif is indeed similar. Again, information about π-stacking can be found in the C⋯C contacts plot (Figure f); here the blue coloured part is diffused towards higher de and di values, even the centre of the distribution (cyano-green) is shifted at higher de and di values. These differences derive most likely from a higher interplanar distance between the perylene core planes (dπ–π = 3.35–3.54 Å for form III; dπ–π = 3.36 Å for form I; dπ–π = 3.39 Å for form II).
The results obtained via CrystalExplorer's energy framework tool,42,43 which allows to calculate and visualize the interaction energies existing between molecules in the crystal packing, are consistent with the observation discussed previously. In form I, II and III, the strongest interaction exists along the column of π-stacked molecules, whereas middle-strength energies can be found between molecules of neighbouring columns and low interaction energies between molecules separated by the alkyl chain region (see ESI†). Form I and II mostly differ for the strength of the interactions into plays, smaller for form II, probably due again to thermal expansion effect. At last, the total energy along the columns in form III has lower strength (108–111 kJ mol−1) compared to form I (115 kJ mol−1) despite the temperature of data collection was the same, indicating that in that direction the crystal packing is less efficient.
Thermal analysis
No melting point is reported for PDI-C5 because it degrades before melting; thermogravimetric analysis shows that the material starts to decompose around 400 °C (Fig. S13, ESI†). Differential Scanning Calorimetry (DSC) in the range RT – 280 °C shows an endothermic transition at 112 °C corresponding to transition I–II and a second endothermic transition (II–III) at 221 °C (see Table 2 and Fig. S14, S15, ESI†).| Cycle | Transition | T (°C) | ΔH (kJ mol−1) |
|---|---|---|---|
| 1st heating | I → II | 112 | 2.8 |
| 1st cooling | II → I | 109 | −2.8 |
| 2nd heating | I → II | 112 | 2.1 |
| II → III | 221 | 8.8 | |
| 2nd cooling | III → I + II | 162 | −1.8 |
The transition I–II is fully reversible and indicates that it is not possible to isolate the high temperature form II at room temperature. Upon cooling form III only one exothermic event is observed, whose ΔH is smaller compared to the transitions in heating, which correspond to a partial conversion to form I and II, as confirmed by Raman spectroscopy.
Hot-Stage Microscopy (HSM) was used for real time observation of the phase transition. Upon heating crystals of PDI-C5, the transition I-II expected at around 110 °C was not observed (see Fig. 5b), while the transition to form III is clearly visible at 230 °C (see Fig. 5c).
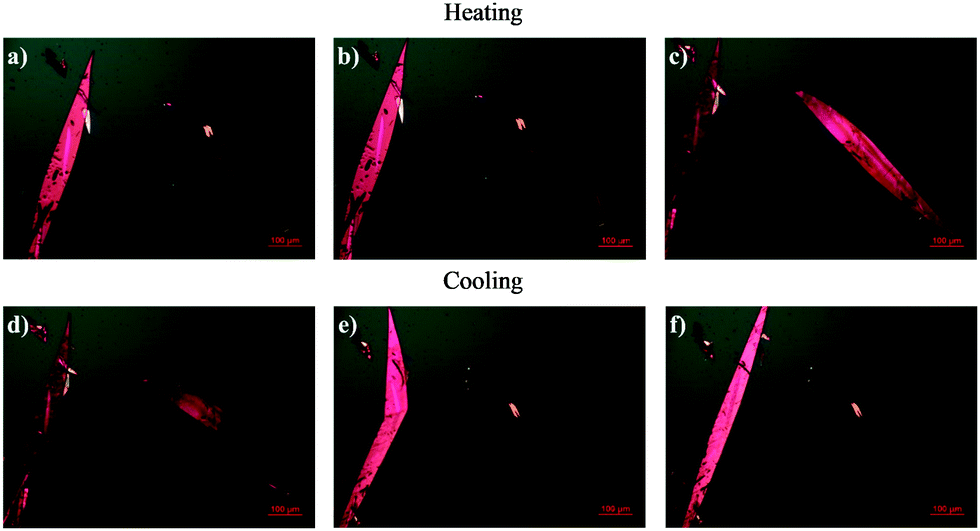 | ||
| Fig. 5 HSM of PDI-C5 crystals: heating stage (a) Crystals of Form I showing the (001) crystal face at 25 °C; (b) 130 °C; (c) 260 °C it's clearly visible that a transition occurred before this temperature. Cooling stage (d) 81 °C the crystal on the right is transitioning; (e) 45 °C the crystal on the left is transitioning; (f) 25 °C end of cooling. The red bar indicating the scale correspond to 100 μm. | ||
Upon cooling, the crystals undergo a rapid solid–solid transition which is characterized by a clearly visible transition front that propagates throughout the crystal coupled with a dramatic shape change that makes the crystals moving on the stage; such behaviour is typically associated to martensitic-like transitions exhibiting thermosalient behaviour.44–47 This transition was attributed to the III → I + II transition as confirmed by Raman spectroscopy.
In order to investigate the structural changes that occurs during transitions, variable temperature X-ray powder diffraction (VTXRPD) experiments were carried out at ALBA Synchrotron.
PDI-C5 VTXRPD. The VTXRPD pattern is shown in Figure. The identification of the transition I → II was not so straightforward from the XRPD because it was hidden by two main factors: first, this material is characterized by a high thermal expansion effect which results in a high shift of the peaks in the XRPD pattern; second, the changes in the X-ray powder pattern due to transition were almost negligible (see Fig. 6). Aware of the transition observed in the DSC, we were able to detect XRPD pattern which clearly presents both forms at 109 °C (see Fig. S16, ESI†) and we solved the structure of Form II at 130 °C, described in the previous section. Sequential Rietveld refinement of form I in the range 25°–130 °C confirmed that the transition indeed occurred. As expected, the unit cell expands by heating and the refinement is stable, and then, when Form II appears the weighted profile R-factor (Rwp, Fig. 7) increases considerably.48 Considering that Rietveld refinement refines both the cell parameter (peaks position) and the degrees of freedom of the molecule in the crystal structure (peaks intensity) to fit the experimental pattern, we were surprised that, even though the refinement was carried out using form I crystal structure parameters, the Rwp value decreased at high temperature where only form II exists. The better fitting is possible because the Rietveld refinement converged form I into form II due to the extreme similarity of the two structures in both cell parameters and crystal packing (discussed earlier). The torsional angles of the alkyl chain of form I are stable until 82 °C when the torsional angle at the end of the chain changes its values although the transition is not occurred yet (see Fig. S19 and S20, ESI†). The transition can be classified as type-I diffuse first-order transition49 and the two structures mainly differs on the conformation of the alkyl chains and a shift of the layers. After the transition into form II, the torsion angles are stable up to 190 °C when the second solid transition occurs (see Fig. S22, ESI†).
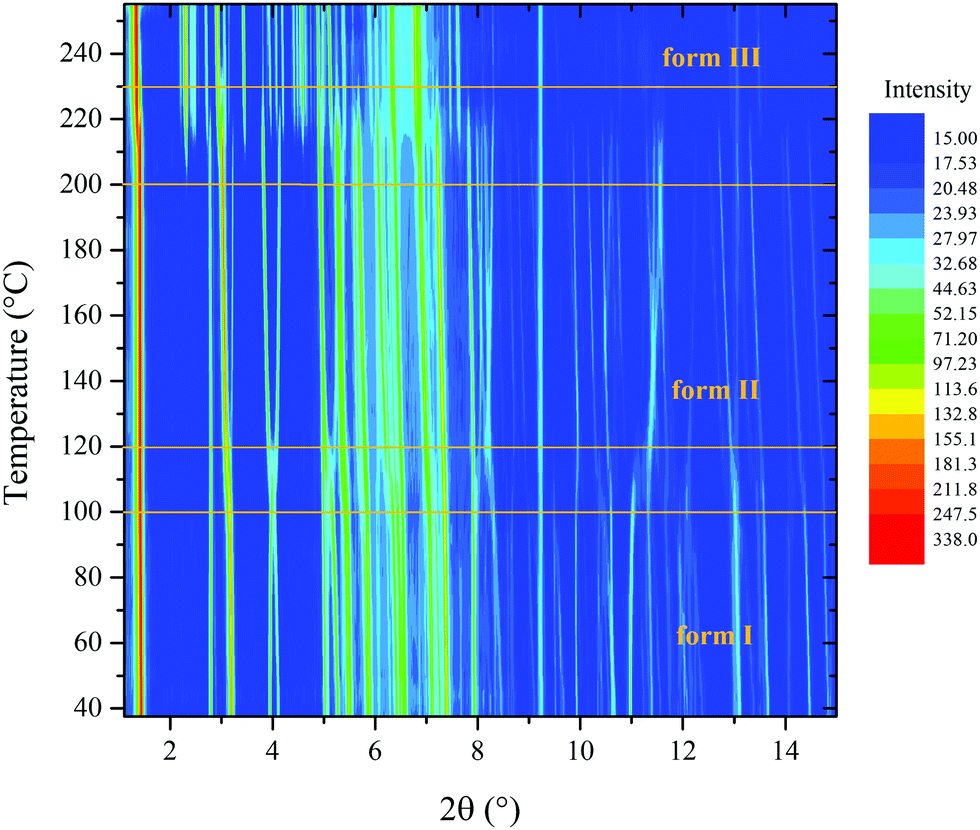 | ||
| Fig. 6 VTXRPD experiment of PDI-C5. Small changes in the pattern can be observed between 100 and 120 °C where the transition from form I to form II lies. Drastic changes in the powder pattern can be seen after 200 °C, where form II converts to form III. Intensity is plotted in square root scale for clearness's sake. | ||
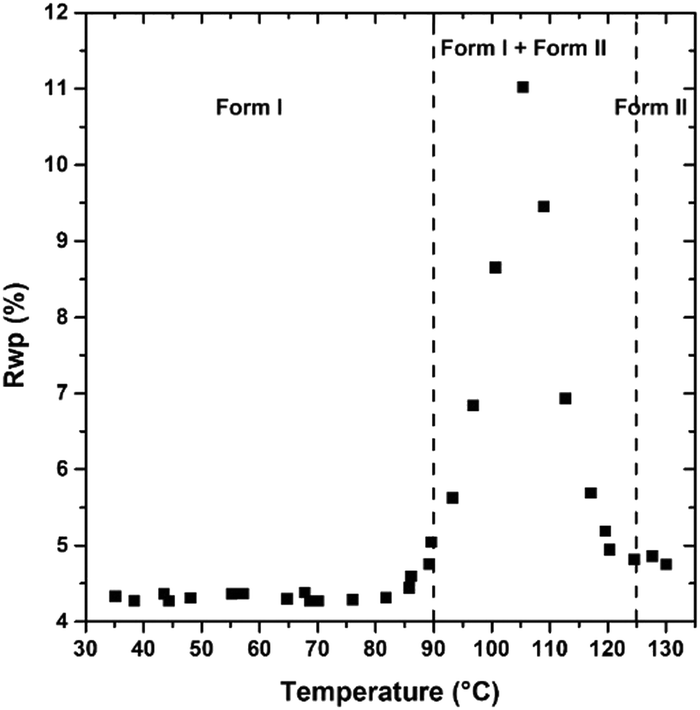 | ||
| Fig. 7 Evolution of Rwp obtained by Rietveld refinement performed at different temperatures. Higher Rwp values indicate higher discrepancies between experimental and calculated pattern. Rwp is higher in the range between 88 °C and 120 °C due to the presence of a mixture of Form I and II, then it goes again below 5% due to the extreme similarity of the two crystal forms. | ||
On the other hand, the transition from form II to form III is clear: starts above 195 °C and is complete at 225 °C. If the sample is heated further, it degrades before melting.
Upon cooling form III to room temperature no visible changes and hence no transition was observed by VTXRPD (see Fig. S17, ESI†), thus the metastable form III was unexpectedly isolated at room temperature. This allowed to solve the crystal structure of form III from powder at room temperature. At RT, form III was stable only for about two days, after which peaks of form I appeared, indicating the formation of a mixture of these two forms.
Thermal expansion
As before mentioned, severe shift of the diffracted peaks due to thermal expansion was observed in VTXRPD. After obtaining the unit cell parameter at variable temperature from Rietveld refinement over PDI-C5 XRD data, the software PASCal (Principal Axis Strain Calculations)50 was used to quantify the observed thermal expansion effect on the different crystal forms.From variable temperature lattice parameter data as input, PASCal calculates in linear approximation and returns as output the principal axis expansivities, the orientation of the principal axes relative to the crystallographic axes and the expansivity indicatrix.
Linear coefficients of thermal expansion and corresponding principal axes determined for PDI-C5 form I are listed in Table 3.
| Axes | α i [10−6 K−1] | σα [10−6 K−1] | a | b | c |
|---|---|---|---|---|---|
| X1 | −106 | 7 | −0.6882 | 0.7088 | 0.1550 |
| X2 | 136 | 3 | 0.9848 | 0.1538 | 0.0807 |
| X3 | 294 | 11 | −0.4253 | −0.6336 | 0.6463 |
| V | 327 | 8 |
The expansivity indicatrix (Fig. 8) is the visual representation of the material's thermal expansivity tensor and is constructed as a smoothly varying surface centered at the unit-cell origin, where the distance between the surface and the origin in a given direction is equal to the magnitude of α (linear thermal expansion coefficient) in that direction.50
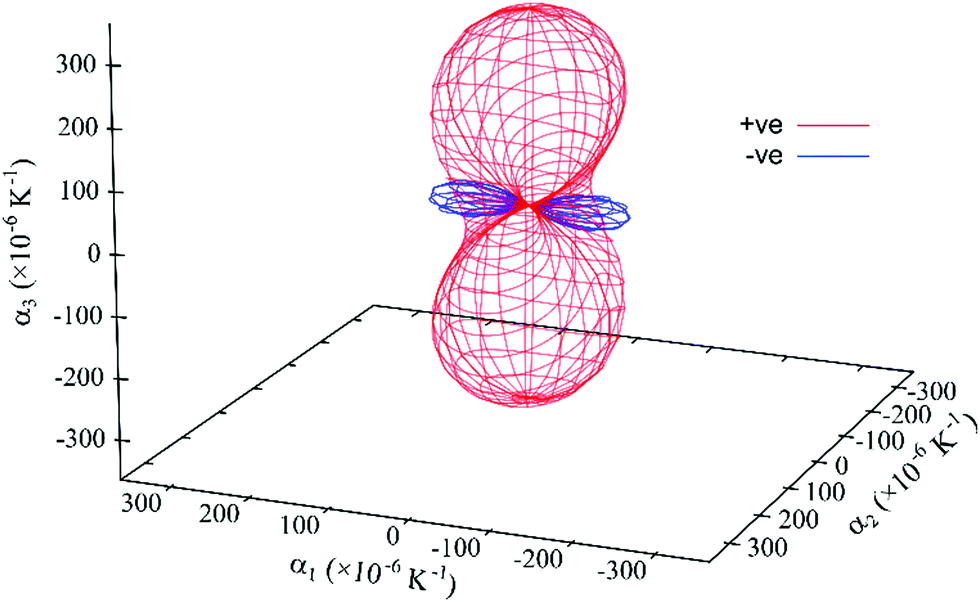 | ||
| Fig. 8 Expansivity indicatrix of PDI-C5 form I determined using the PASCal program, showing the spatial orientation of positive (red) and negative (blue) thermal expansion. | ||
PDI-C5 form I shows a negative thermal expansion (NTE) along the principal axis X1 which is quite common for organic structure. Recently van der Lee et al. has shown that about 34% of organic materials displays this behaviour.31 In PDI-C5 form I, the increase in temperature probably increases thermal parameter mainly in the alkyl chains and the observed NTE most likely arises from steric adjustments that forces the alkyl chains to rotate to minimize the steric hindrance between molecules. Similar behavior has been observed before for organic crystals.51,52
The overall effect is a large thermal expansion αV > 300 M K−1 (the mean value for volumetric thermal expansion of organic compounds was estimated as αV = 168.6 M K−1, with a standard deviation σ of 72.5 M K−1),31 which means that in the range of temperature investigated (35–82 °C) the increase in volume is about 2%. This large thermal expansion effect is reflected in the observed shift of the diffracted peaks with temperature.
Thermal expansion was investigated also for form II (Table 4 and Fig. 9).
| Axes | α i [10−6 K−1] | σα [10−6 K−1] | a | b | c |
|---|---|---|---|---|---|
| X1 | −219 | 5 | 0.8444 | −0.4570 | −0.2795 |
| X2 | 205 | 2 | −0.9212 | −0.3873 | −0.0366 |
| X3 | 277 | 3 | 0.6218 | −0.6727 | 0.4010 |
| V | 257 | 4 |
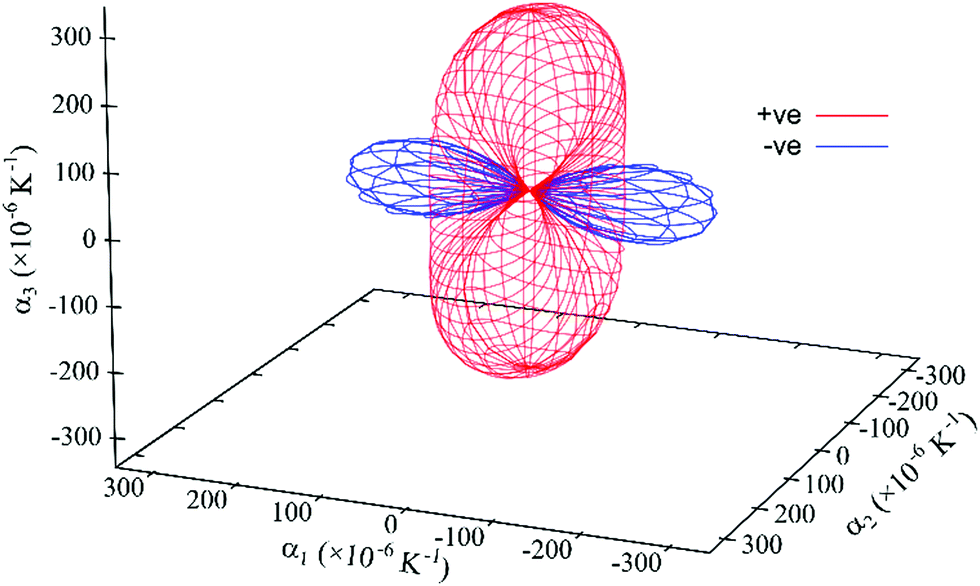 | ||
| Fig. 9 Expansivity indicatrix of PDI-C5 form II determined using the PASCal program, showing the spatial orientation of positive (red) and negative (blue) thermal expansion. | ||
Form II exhibit the largest uniaxial NTE along the principal axis X1: it is almost double the one of form I and four times that of form III. In fact, NTE as large as form II one (of about −200 M K−1) is quite rare between organic materials.31 It is worth noting that the orientation of the principal axis is different from form I despite the crystal structures are so similar (Fig. S25, ESI†).
The overall effect is a large thermal expansion αV > 250 M K−1, which means that in the range of temperature investigated (130–190 °C) the increase in volume is about 1.6%.
Lastly, thermal expansion of form III was investigated (Table 5 and Fig. 10).
| Axes | αi [10-6 K-1] | σα [10-6 K-1] | a | b | c |
|---|---|---|---|---|---|
| X1 | −56.4 | 0.7 | 0.9287 | 0.2936 | 0.2267 |
| X2 | 114 | 2 | 0.0095 | −0.9820 | −0.1888 |
| X3 | 337 | 1 | −0.6804 | −0.3895 | 0.6208 |
| V | 395 | 2 |
 | ||
| Fig. 10 Expansivity indicatrix of PDI-C5 form III determined using the PASCal program, showing the spatial orientation of positive (red) and negative (blue) thermal expansion. | ||
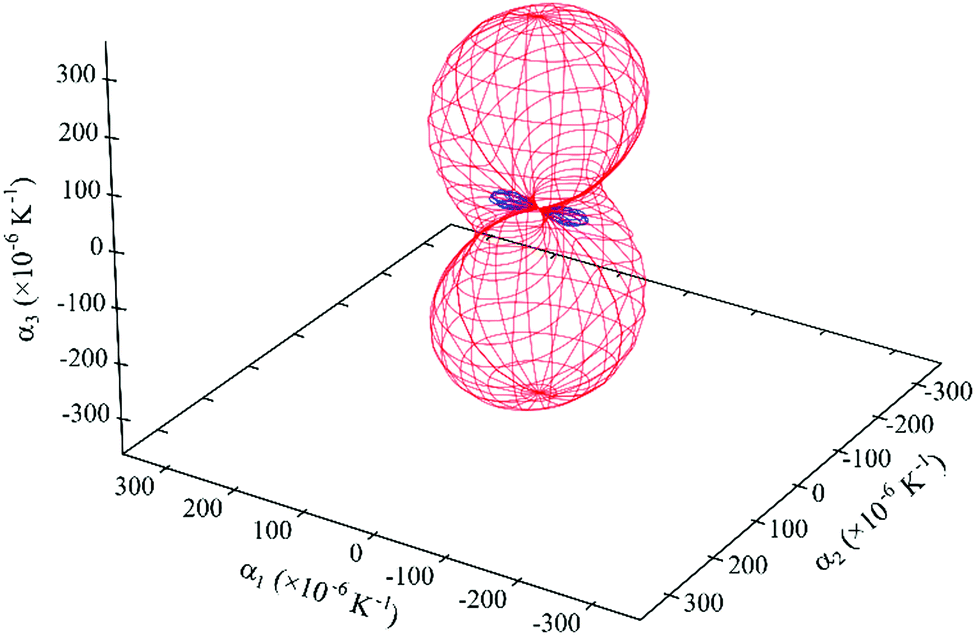
Again, form III displays an anisotropic thermal expansion with a NTE along the principal axis X1. The overall effect is a large thermal expansion αV > 390 M K−1, the largest observed between the three forms, which means that in the range of temperature investigated (40–250 °C) the overall volume increase is about 8.4% of the initial volume.
Raman spectroscopy
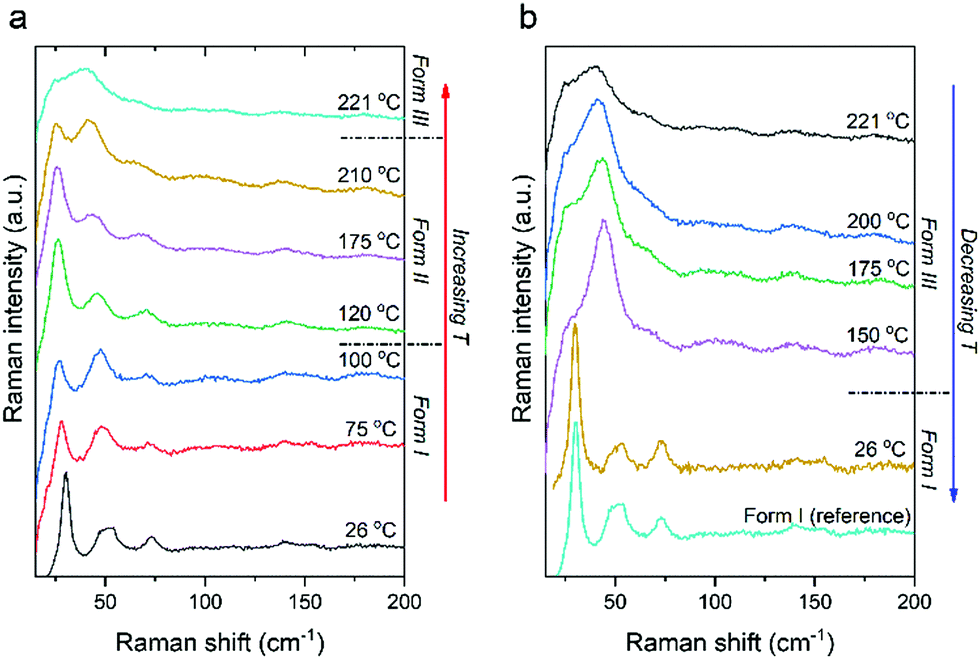
The intramolecular Raman spectrum of PDI-C5 recorded at room temperature reported in Fig. S26 (ESI†) show the typical pattern of the alkyl substituted PDIs. The spectrum shows the peaks in the 1000–1300 cm−1, where the normal modes are dominated by CH in-plane bendings (rockings). The 1300–1650 cm−1 section of the spectrum is dominated by the characteristic vibrational modes of the central PDI aromatic core. These motions are mainly represented by bending/breathing modes characteristic of the PDIs structure as confirmed from reported computed spectrum.53 Lastly, the region between 500 and 600 cm−1 shows an isolated peak belonging to the bending of the lateral alkyl chains which has been reported to be very sensitive to change in phase with temperature54 as we will also demonstrate later.The Raman spectrum in the low frequency range below 150 cm−1 shows the lattice vibrations typical of the crystal packing and for this representing the fingerprint of each specific polymorphic form. PDI-C5 form I crystallizes in a triclinic system with one molecule per unit cell, and for this symmetry analysis anticipate 3 lattice vibration of Ag symmetry in the rigid body approximation.55 The reported low frequency spectrum of PDI-C5 in Fig. S26 (ESI†) show at least four intense peaks at 27, doublet at 50 and 75 cm−1. Moreover, apart these four intense peaks, more low intensity vibrational modes are recognized below 150 cm−1. We observed more vibrational modes in the lattice phonons region than the expected one by symmetry analysis and the reason of these mismatch is most probably due to the presence of low frequency intramolecular modes. Nevertheless, the low frequency range can still represent the fingerprint of each specific polymorphic modification. Indeed, we recorded the variable temperature Raman spectra of PDI-C5 as reported in Fig. 11 from room temperature to 221 °C. It is possible to observe two transitions as confirmed by the DSC (Fig. S15 and Table 2). Increasing the temperature from room temperature the softening of the low frequency spectrum of the form I is observed and after the transition to form II the spectrum without changing the pattern move suddenly to higher wavenumbers. The lattice phonons pattern of form II does not change dramatically from the one of form I as this is a phase transformation that does not involve a big change of the crystal system. Indeed, form I and II share the same triclinic structure with one molecule in the unit cell. The main modification results in the reorganization of the lateral alkyl chain configuration as demonstrated by X-ray crystal structure solution of form II.
 | ||
| Fig. 11 Variable temperature low frequency Raman spectra in heating (a) and in cooling (b) cycles. | ||
As this transformation involve a change in the molecular configuration of the lateral alkyl chain, we monitored the peak at 544 cm−1 which is assigned to the characteristic alkyl bending mode. This peak is in a spectral region free from overlaps and with temperature soften a little bit till 112 °C where we observe an abrupt shift in frequency in correspondence of the form I/form II phase transition (Fig. S27, ESI†). Further increase of the temperature soften and broaden the spectral features.
Similarly to form I, upon heating form II the Raman spectrum in the low frequency range shows a slight softening of the lattice vibrations till the phase transformation at 221 °C where the low frequency spectrum change displaying a broad feature around 40 cm−1. During variable temperature Raman, Form III, obtained above 221 °C, remain stable till 150 °C upon cooling. The Raman spectra collected at 150 °C correspond to form III, which has been solved by X-ray in a triclinic P structure with 3 molecule per unit cell. On the basis of the crystal symmetry and in the rigid body approximation,56 18 lattice modes of symmetry 9Ag + 9Au are predicted by factor group analysis. The 9Ag of gerade symmetry are Raman active while the remaining of ungerade symmetry are IR active (6Au) or optically inactive (3Au) as it belongs to the acoustic modes. We assume then to observe 9 vibrations in the low-frequency spectral range for the PDI-C5 form III of Fig. 11. At 150 °C the bands are too broad and the resolution of the 9 active vibrations can be made only by polarized spectra as reported in Fig. S28 (ESI†) which have been recorded in crossed and parallel configuration. The experimental identification of the 9 vibrational modes expected by symmetry analysis are in agreement with the crystal structure resolved from powder XRD.
Below 150 °C form III transforms into a form which has the low-frequency spectral pattern of form I or II, but the diagnostic band of the intramolecular vibration related to the lateral alkyl chains at 544.3 cm−1 confirm the configuration of the PDI-C5 in form I. The behaviour observed in variable temperature Raman is comparable to HSM. It is worth noting that both Raman and HSM are performed using single crystals of similar size.
The lattice phonons are known to be really sensitive even to slight change in crystal packing,57–59 but in this case we observe very similar patterns for all the polymorphs. This could not be surprising for form I and form II which have the same structure with a small difference in the later alkyl chain configuration, instead it is really unexpected the similarity with form III which has a triclinic structure with 3 molecules per unit cell.
For a clear identification of the different polymorphs by low frequency Raman spectroscopy we checked the Raman intensity periodicity as a function of the incident polarization angle of the excitation light in both parallel and crossed polarized configurations which are reported in Figure. By X-ray we have the confirm that we are measuring the same (001) crystal face for all the polymorphs, thus we can exclude the effect of different crystal face on the periodicity of the Raman intensity. Each polymorph shows a different parallel and crossed polarization map of the Raman intensity confirming different periodicities. As form I and form II share the same crystal system with one molecule per unit cell, the differences are mainly represented by peak intensity periodicity of the peak at 25 cm−1 as highlighted in Fig. 12.
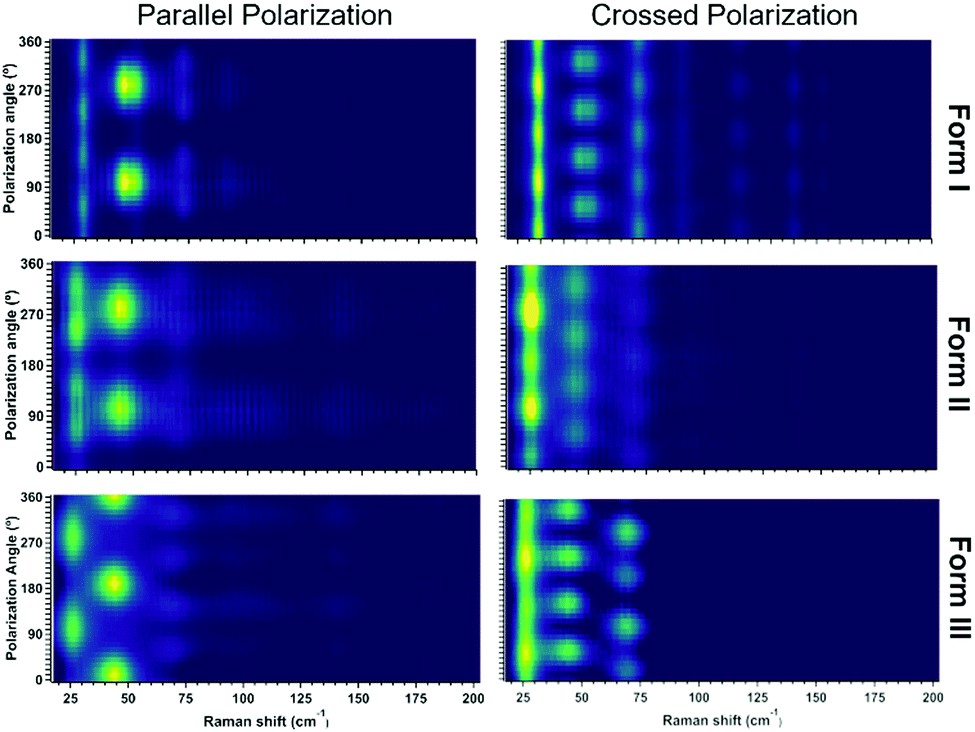 | ||
| Fig. 12 Raman intensity as a function of the incident polarization light in parallel and in crossed configurations for the three PDI-C5 polymorphs. The signal intensity increases from dark to yellow colour. | ||
Conclusions
The fascinating thermal behaviour of PDI-C5 was thoroughly investigated, leading to identification and determination of two different high temperature polymorphs form II and form III. The crystal structures of PDI-C5 high temperature polymorphs form II and form III were determined, together with its p-xylene (and the isomorphous toluene) solvate. Comparison between these crystal forms using Mercury and CrystalExplorer highlighted the extreme similarity existing between PDI-C5 form I, form II and p-xy form, which are characterized by a lamellar mono-dimensional (1D) packing motif dominated by strong π–π interactions between aromatic cores resulting in a layered structure in which rigid aromatic core regions alternates with alkyl chain regions; whereas differences are found in the alkyl chains regions, such as the chain conformation in case of form II and the presence of solvent channels for the solvate. Such investigation pointed out the strong propensity of this PDI to maintain this crystal packing driven by the π–π interactions; in fact, only above 220 °C when transition to form III occurs the π-stacking between molecules changes from shifted to an alternation of shifted and criss-crossed stacking. Although in heating the different thermal analysis agree, in cooling, the thermal behaviour observed with different techniques (DSC, HSM, VTXRPD and Raman spectroscopy) are not fully consistent, and this seems to be dependent from the crystal size used in the different techniques: ground powder for DSC and VTXRPD, and single crystals for HSM and Raman spectroscopy. Thermal analysis highlighted also the strong thermal expansion of this material, studied with PASCal, which is particularly strong and anisotropic in form III. We suppose that the thermal expansion could be responsible of the different thermal behavior observed in the measurements upon cooling form III. In fact, thermal contraction can induce strains and thus energy accumulation in the crystal,45 like loading a spring. This energy accumulated as strain, increases as the temperature is lowered and could act as a trigger for the transition that occurs in single crystals as observed in HSM. Whereas, in the ground powder used for VTXRPD experiments the conversion III → I is not observed, probably the smaller size of the crystals and the presence of defects prevent the accumulation of energy necessary for the conversion. However, we cannot exclude that partial conversion to form I occurs, which was not detectable in XRD, but instead it was observed in DSC and variable temperature Raman spectroscopy.Thermal treatments are common process in fabrication and optimization of devices, as also reported for this system,36 but often the effects in the material are not thoroughly investigated, and the thermal annealing could bring to unexpected and undesired phase transition that depends not only on temperature, but also on size and morphology, and affects the final device performance. A better understanding of the thermal behaviour is fundamental for an efficient design of devices.
Experimental
Crystallization
PDI-C5 purchased from Aldrich and used without further purification. Crystals of PDI-C5 were obtained inside a solvothermal reactor, where a supersaturated solution of the PDI was heated up for one night and then slowly cooled down to room temperature. Toluene, p-xylene, CHCl3 and CH2Cl2 were used as solvents and the solutions were heated up to 180 °C in case of toluene and p-xylene solutions, while CHCl3 and CH2Cl2 were heated up to 100 °C.Single-crystal X-ray diffraction
Single crystal data of PDI-C5-pXy were collected on an Oxford Xcalibur S instrument with MoKα radiation (λ = 0.71073 Å) and graphite monochromator, equipped with a Cryostream800 for temperature control. SHELXT60 was used for structure solution and SHELXL61,62 for the refinement based on F2. The non-hydrogen atoms were refined anisotropically, and the hydrogen atoms were added at calculated positions. It was not possible to describe the disorder positions of the solvent molecule therefore PLATON/SQUEEZE63 was used to remove the electron density of the solvent in the channels. The centre of gravity of the void is located close to the inversion point and 31 electrons were recovered in the void which suggests a 53% occupancy of the solvent. The software Mercury was used to generate the molecular packing representation and for calculation of the diffraction pattern from the crystal structures.X-Ray powder diffraction and structure determination
The synchrotron radiation PXRD measurements of PDI-C5 were performed at the ALBA Synchrotron light facility in Barcelona at Material Science and Powder Diffraction beamline BL04-MSPD equipped with the High-throughput Position Sensitive Detector (PSD) MYTHEN64 and an FMB Oxford hot air blower for variable temperature measurements. End station with a nominal photon energy of 30 keV. Fine Si NIST standard refinement returned a wavelength of 0.41235(1) Å and a residual zero error of 0.008(3) 2θ, step size of 0.004°. The measurements were performed in transmission geometry. The material was loaded inside a glass capillary with a diameter of 0.5 mm, spun during measurement, and exposed to X-rays for 10 s for measurements in continuous heating with 5 °C min−1 heating rate for measurement in continuous during variable temperature experiment.Synchrotron PXRD data for structure solution of form II and form III were collected at isothermal conditions, respectively at 130 °C and at 25 °C, with a 30 s X-rays exposition over the range 0.8°–15° 2θ. The data for Form II indexed to a triclinic P cell (a = 4.846 Å, b = 8.531 Å, c = 16.702 Å, α = 91.57°, β = 82.31°, γ = 81.49° and V = 676 Å3), were Pawley fitted in Topas-Academic V5(TOPAS).65 Consideration of the cell volume, molecular volume, and space group symmetry suggested Z′ = 0.5. The simulated annealing component of TOPAS was used to optimize the orientation and conformation of a half-molecule model of PDI-C5 against the diffraction data, with the molecular center of symmetry anchored on the origin of the unit cell. The validity of the structure was confirmed by a Rietveld refinement against data in the range 0.8°–15° 2θ using TOPAS. The final Rietveld refinement yield an Rwp value of 0.049 (cf. Pawley Rwp of 0.022).
The data for Form III indexed to a triclinic P cell (a = 11.624 Å, b = 11.617 Å, c = 17.415 Å, α = 98.21°, β = 71.25°, γ = 116.06° and V = 2001 Å3), were Pawley fitted in TOPAS. Consideration of the cell volume, molecular volume, and space group symmetry suggested Z′ = 1.5. The simulated annealing component of TOPAS was used to optimize the orientation and conformation of a one and half-molecule model of PDI-C5 against the diffraction data, with one molecule free and the half molecular center of symmetry anchored on the origin of the unit cell. The validity of the structure was confirmed by a Rietveld refinement against data in the range 0.8°–15° 2θ using TOPAS. The final Rietveld refinement, yield an Rwp value of 0.038 (cf. Pawley Rwp of 0.021).
CCDC 2127829–2127831.
Raman spectroscopy
Raman measurements were performed with a custom-built system based on a 1000 mm focal length Horiba FHR-1000 dispersive spectrometer. Ultra-low frequency (ULF) range was reached by using in the optical setup Notch filters from ONDAX allowing the access till the THz region (>10 cm−1). Excitation was provided from a Toptica diode laser tuned at 785 nm with a nominal power of 500 mW and the broad spectrum of spontaneous emission was suppressed by 4 sequential ASE-filters. Neutral optical density filters were used to reduce the impinging power at less than 1 mW to avoid sample damage and to minimize the two photons absorption process and the consequent photoluminescence. The laser was focused on the sample by an optical microscope Zeiss Axio equipped with a 50× objective which allow a nominal spatial resolution of about 2 microns. The combination of the 785 nm excitation line, the use of a holographic grating with 600 g mm−1 coupled with a 1024 × 256 pixels CCD detector gave a maximum spectral resolution of ≈2 cm−1.Variable temperature Raman spectra were collected by THMS600 Linkam stage, controlled by LINK software, between room temperature and 230 °C in atmospheric conditions heating and cooling with a 2 °C min−1 rate.
The Raman polarization dependence of the single crystals at the different temperatures were measured in parallel and perpendicular configurations with steps of 10°. To control the polarization of the incident and scattered light, half-wave plates and a polarizer–analyzer combination was used as described in the ref. 66 and 67.
Thermogravimetric analysis (TGA)
TGA measurements were performed using a PerkinElmer TGA7 in the temperature range 35–550 °C under N2 gas flow and heating was carried out at 20 °C min−1.Differential scanning calorimetry (DSC)
The analyses were performed with an instrument PerkinElmer PyrisDiamond DSC-7 equipped with a PII intracooler, in N2 atmosphere and a scanning speed of 20 °C min−1.Hot-stage microscopy (HSM)
The HSM analyses were performed using an OLYMPUS BX41 microscope equipped with a VISICAM 5.0 and a NIKON DS FI3 camera. A Linkam TMS-94 stage was used for the temperature control. The images were taken under polarized light to highlight modifications in the crystals due to solid state transition, with a 40× magnification.Solubility
Solubility of PDI-C5 in used solvents was estimated from absorption spectra of a saturated solution. Absorption spectra in the 190–1100 nm range were recorded at room temperature in solutions contained in quartz cuvettes (optical pathlength 1 cm, Hellma®) by using a PerkinElmer λ40 spectrophotometer.NMR spectroscopy
NMR spectra were measured with a NMR Varian MR400, using a 400 MHz on the proton channel, equipped with ATB PFG probe. The spectra were collected in deuterated chloroform at 25°.Author contributions
All authors have given approval to the final version of the manuscript. F. Marin performed the investigation, experimental and computational analysis and writing the manuscript, S. Tombolesi experimental and computational analysis, T. Salzillo performed the investigation, experimental and computational analysis of Raman spectroscopy and writing the manuscript, O. Yaffe supervised the work and L. Maini conceptualization and supervision of the work and manuscript review and editing.Conflicts of interest
There are no conflicts to declare.Acknowledgements
The VTXRPD experiments were performed at BL04_MSPD beamline at ALBA Synchrotron (ID proposal 2020094632) with the collaboration of ALBA staff. The authors are grateful to Dr Stefano Grilli of University of Bologna for NMR spectra, Dr Katia Rubini of University of Bologna for TGA and DSC measurements and Roberto Aversa for his contribution during his master thesis. TS thanks the European co-financing project FSE REACT EU - PON R&I 2014-2020.Notes and references
- J. Bernstein, J. Phys. D: Appl. Phys., 1993, 26, B66–B76 CrossRef CAS.
- J. Bernstein, Cryst. Growth Des., 2011, 11, 632–650 CrossRef CAS.
- A. J. Cruz-Cabeza and J. Bernstein, Chem. Rev., 2014, 114, 2170–2191 CrossRef CAS PubMed.
- A. J. Cruz-Cabeza, S. M. Reutzel-Edens and J. Bernstein, Chem. Soc. Rev., 2015, 44, 8619–8635 RSC.
- D. Gentili, M. Gazzano, M. Melucci, D. Jones and M. Cavallini, Chem. Soc. Rev., 2019, 48, 2502 RSC.
- D. Liu, C. Li, S. Niu, Y. Li, M. Hu, Q. Li, W. Zhu, X. Zhang, H. Dong and W. Hu, J. Mater. Chem. C, 2019, 7, 5925–5930 RSC.
- R. M. Pinto, E. M.-S. Maçôas, A. I.-S. Neves, S. Raja, C. Baleizão, I. C. Santos and H. Alves, J. Am. Chem. Soc., 2015, 137, 7104–7110 CrossRef CAS PubMed.
- R. M. Pinto, W. Gouveia, E. M.-S. Maçôas, I. C. Santos, S. Raja, C. Baleizão and H. Alves, ACS Appl. Mater. Interfaces, 2015, 7, 27720–27729 CrossRef CAS PubMed.
- C. Wang, H. Dong, L. Jiang and W. Hu, Chem. Soc. Rev., 2018, 47, 422–500 RSC.
- S. Milita, F. Liscio, L. Cowen, M. Cavallini, B. A. Drain, T. Degousée, S. Luong, O. Fenwick, A. Guagliardi, B. C. Schroeder and N. Masciocchi, J. Mater. Chem. C, 2020, 8, 3097–3112 RSC.
- C. Cappuccino, L. Catalano, F. Marin, G. Dushaq, G. Raj, M. Rasras, R. Rezgui, M. Zambianchi, M. Melucci, P. Naumov and L. Maini, Cryst. Growth Des., 2020, 20, 884–891 CrossRef CAS.
- V. Belova, B. Wagner, B. Reisz, C. Zeiser, G. Duva, J. Rozbořil, J. Novák, A. Gerlach, A. Hinderhofer and F. Schreiber, J. Phys. Chem. C, 2018, 122, 8589–8601 CrossRef CAS.
- A. V. Mumyatov, L. I. Leshanskaya, D. V. Anokhin, N. N. Dremova and P. A. Troshin, Mendeleev Commun., 2014, 24, 306–307 CrossRef CAS.
- A. Facchetti, Mater. Today, 2007, 10, 28–37 CrossRef CAS.
- R. J. Chesterfield, J. C. McKeen, C. R. Newman, P. C. Ewbank, D. A. Da Silva Filho, J. L. Brédas, L. L. Miller, K. R. Mann and C. D. Frisbie, J. Phys. Chem. B, 2004, 108, 19281–19292 CrossRef CAS.
- B. J. Kim, H. Yu, J. H. Oh, M. S. Kang and J. H. Cho, J. Phys. Chem. C, 2013, 117, 10743–10749 CrossRef CAS.
- J. E. Anthony, Chem. Mater., 2011, 23, 583–590 CrossRef CAS.
- C. Li and H. Wonneberger, Adv. Mater., 2012, 24, 613–636 CrossRef CAS PubMed.
- C. Huang, M. M. Sartin, N. Siegel, M. Cozzuol, Y. Zhang, J. M. Hales, S. Barlow, J. W. Perry and S. R. Marder, J. Mater. Chem., 2011, 21, 16119–16128 RSC.
- I. F. A. Mariz, S. Raja, T. Silva, S. Almeida, É. Torres, C. Baleizão and E. Maçôas, Dyes Pigm., 2021, 193, 109470 CrossRef CAS.
- P. M. Kazmaier and R. Hoffmann, J. Am. Chem. Soc., 1994, 116, 9684–9691 CrossRef CAS.
- D. Bialas, E. Kirchner, M. I.-S. Röhr and F. Würthner, J. Am. Chem. Soc., 2021, 143, 4500–4518 CrossRef CAS PubMed.
- L. M. Cowen, J. Atoyo, M. J. Carnie, D. Baran and B. C. Schroeder, ECS J. Solid State Sci. Technol., 2017, 6, N3080–N3088 CrossRef CAS.
- Y. Chen, Y. Zhao and Z. Liang, Energy Environ. Sci., 2015, 8, 401–422 RSC.
- M. E. El-Khouly, A. El-Refaey, S. Y. Shaban and M. El-Kemary, J. Lumin., 2018, 196, 455–461 CrossRef CAS.
- Y. Han, W. Ning, H. Du, J. Yang, N. Wang, L. Cao, F. Li, F. Zhang, F. Xu and M. Tian, Nanoscale, 2015, 7, 17116–17121 RSC.
- H. Langhals, S. Demmig and T. Potrawa, J. Prakt. Chem., 1991, 333, 733–748 CrossRef CAS.
- A. J. McKerrow, E. Buncel and P. M. Kazmaier, Can. J. Chem., 1993, 71, 390–398 CrossRef CAS.
- M. Carmen Ruiz Delgado, E. G. Kim, D. A. Da Silva Filho and J. L. Bredas, J. Am. Chem. Soc., 2010, 132, 3375–3387 CrossRef PubMed.
- Y. Geng, H.-B. Li, S.-X. Wu and Z.-M. Su, J. Mater. Chem., 2012, 22, 20840 RSC.
- A. van der Lee and D. G. Dumitrescu, Chem. Sci., 2021, 12, 8537–8547 RSC.
- H. G. Jeon, J. Hattori, S. Kato, N. Oguma, N. Hirata, Y. Taniguchi and M. Ichikawa, J. Appl. Phys., 2010, 108, 124512 CrossRef.
- J. Jang, S. Nam, D. S. Chung, S. H. Kim, W. M. Yun and C. E. Park, Adv. Funct. Mater., 2010, 20, 2611–2618 CrossRef CAS.
- S. Tatemichi, M. Ichikawa, T. Koyama and Y. Taniguchi, Appl. Phys. Lett., 2006, 89, 112108 CrossRef.
- L. Ma, Y. Guo, Y. Wen, Y. Liu and X. Zhan, Appl. Phys. Lett., 2013, 103, 203303 CrossRef.
- L. I. Kuznetsova, A. A. Piryazev, D. V. Anokhin, A. V. Mumyatov, D. K. Susarova, D. A. Ivanov and P. A. Troshin, Org. Electron., 2018, 58, 257–262 CrossRef CAS.
- E. Hadicke and F. Graser, Acta Crystallogr. Sect. C, 1986, 42, 189–195 CrossRef.
- A. J. Cruz-Cabeza, S. E. Wright and A. Bacchi, Chem. Commun., 2020, 56, 5127–5130 RSC.
- C. F. MacRae, I. Sovago, S. J. Cottrell, P. T.-A. Galek, P. McCabe, E. Pidcock, M. Platings, G. P. Shields, J. S. Stevens, M. Towler and P. A. Wood, J. Appl. Crystallogr., 2020, 53, 226–235 CrossRef CAS PubMed.
- C. F. Mackenzie, P. R. Spackman, D. Jayatilaka and M. A. Spackman, IUCrJ, 2017, 4, 575–587 CrossRef CAS PubMed.
- P. R. Spackman, M. J. Turner, J. J. McKinnon, S. K. Wolff, D. J. Grimwood, D. Jayatilaka and M. A. Spackman, J. Appl. Crystallogr., 2021, 54, 1006–1011 CrossRef CAS PubMed.
- M. J. Turner, S. Grabowsky, D. Jayatilaka and M. A. Spackman, J. Phys. Chem. Lett., 2014, 5, 4249–4255 CrossRef CAS PubMed.
- M. J. Turner, S. P. Thomas, M. W. Shi, D. Jayatilaka and M. A. Spackman, Chem. Commun., 2015, 51, 3735–3738 RSC.
- H. Chung, D. Dudenko, F. Zhang, G. D’Avino, C. Ruzié, A. Richard, G. Schweicher, J. Cornil, D. Beljonne, Y. Geerts, Y. Diao, G. D’Avino, C. Ruzié, A. Richard, G. Schweicher, J. Cornil, D. Beljonne, Y. Geerts and Y. Diao, Nat. Commun., 2018, 9, 278 CrossRef PubMed.
- A. Khalil, D. P. Karothu and P. Naumov, J. Am. Chem. Soc., 2019, 141, 3371–3375 CrossRef CAS PubMed.
- S. K. Park and Y. Diao, Chem. Soc. Rev., 2020, 49, 8287 RSC.
- H. Sun, S. K. Park, Y. Diao, E. P. Kvam and K. Zhao, Chem. Mater., 2021, 33, 1883–1892 CrossRef CAS.
- B. H. Toby, Powder Diffr., 2006, 21, 67–70 CrossRef CAS.
- A. G. Christy, Acta Crystallogr., Sect. B, 1995, 51, 753–757 CrossRef.
- M. J. Cliffe and A. L. Goodwin, J. Appl. Crystallogr., 2012, 45, 1321–1329 CrossRef CAS.
- D. Das and L. J. Barbour, CrystEngComm, 2018, 20, 5123–5126 RSC.
- S. Bhattacharya and B. K. Saha, CrystEngComm, 2014, 16, 2340–2343 RSC.
- M. Angelella, C. Wang and M. J. Tauber, J. Phys. Chem. A, 2013, 117, 9196–9204 CrossRef CAS PubMed.
- A. M. Rich, S. Bhattacharyya, V. R. Aldilla, J. E. Beves, M. Bhadbhade, N. Kumar, E. T. Luis and C. E. Marjo, J. Raman Spectrosc., 2019, 50, 63–73 CrossRef CAS.
- T. Salzillo, A. Giunchi, M. Masino, N. Bedoya-Martĺnez, R. G. Della Valle, A. Brillante, A. Girlando and E. Venuti, Cryst. Growth Des., 2018, 18, 4869–4873 CrossRef CAS.
- T. Salzillo, S. D’Agostino, A. Rivalta, A. Giunchi, A. Brillante, R. G. Della Valle, N. Bedoya-Martínez, E. Zojer, F. Grepioni and E. Venuti, J. Phys. Chem. C, 2018, 122, 18422–18431 CrossRef CAS.
- A. Rivalta, A. Giunchi, L. Pandolfi, T. Salzillo, S. D’agostino, O. Werzer, B. Schrode, N. Demitri, M. Mas-Torrent, A. Brillante, R. G. Della Valle and E. Venuti, Dyes Pigm., 2020, 172, 107847 CrossRef.
- B. Schrode, A. O.-F. Jones, R. Resel, N. Bedoya, R. Schennach, Y. H. Geerts, C. Ruzié, M. Sferrazza, A. Brillante, T. Salzillo and E. Venuti, Chem. Phys. Chem., 2018, 19, 993–1000 CrossRef CAS PubMed.
- C. Cappuccino, P. P. Mazzeo, T. Salzillo, E. Venuti, A. Giunchi, R. G. Della Valle, A. Brillante, C. Bettini, M. Melucci and L. Maini, Phys. Chem. Chem. Phys., 2018, 20, 3630–3636 RSC.
- G. M. Sheldrick, Acta Crystallogr., Sect. A: Found. Crystallogr., 2015, 71, 3–8 CrossRef PubMed.
- G. M. Sheldrick, Acta Crystallogr., Sect. C: Struct. Chem., 2015, 71, 3–8 Search PubMed.
- G. M. Sheldrick, Acta Crystallogr., Sect. A: Found. Crystallogr., 2008, 64, 112–122 CrossRef CAS PubMed.
- A. L. Spek, Acta Crystallogr., Sect. C: Struct. Chem., 2015, 71, 9–18 CrossRef CAS PubMed.
- F. Gozzo, A. Cervellino, M. Leoni, P. Scardi, A. Bergamaschi and B. Schmitt, Z. Kristallogr., 2010, 225, 616–624 CrossRef CAS.
- A. A. Coelho, J. Appl. Crystallogr., 2018, 51, 210–218 CrossRef CAS.
- M. Asher, D. Angerer, R. Korobko, Y. Diskin-Posner, D. A. Egger and O. Yaffe, Adv. Mater., 2020, 32, 1908028 CrossRef CAS PubMed.
- E. Sanders, Y. Soffer, T. Salzillo, M. Rosenberg, O. Bar-Elli, O. Yaffe, E. Joselevich and D. Oron, ACS Nano, 2021, 15, 16130–16138 CrossRef CAS PubMed.
Footnote |
| † Electronic supplementary information (ESI) available. CCDC 2127829–2127831. For ESI and crystallographic data in CIF or other electronic format see DOI: https://doi.org/10.1039/d1tc06132a |
| This journal is © The Royal Society of Chemistry 2022 |