The regioisomeric effect on the excited-state fate leading to room-temperature phosphorescence or thermally activated delayed fluorescence in a dibenzophenazine-cored donor–acceptor–donor system†
Takumi
Hosono
a,
Nicolas Oliveira
Decarli
 b,
Paola Zimmermann
Crocomo
 b,
Tsuyoshi
Goya
c,
Leonardo Evaristo
de Sousa
d,
Norimitsu
Tohnai
a,
Satoshi
Minakata
 a,
Piotr
de Silva
 *d,
Przemyslaw
Data
 *b and
Youhei
Takeda
 *a
*a
aDepartment of Applied Chemistry, Graduate School of Engineering, Osaka University, Yamadaoka 2-1, Suita, Osaka 565-0871, Japan. E-mail: takeda@chem.eng.osaka-u.ac.jp
bFaculty of Chemistry, Silesian University of Technology, M. Strzody 9, 44-100 Gliwice, Poland. E-mail: przemyslaw.data@polsl.pl
cNew Business Commercialization Project, Nippon Shokubai Co. Ltd., 5-8 Nishi Otabi-cho, Suita, Osaka 564-0034, Japan
dDepartment of Energy Conversion and Storage, Technical University of Denmark, Anker Engelunds Vej 301, 2800 Kongens Lyngby, Denmark. E-mail: pdes@dtu.dk
First published on 7th February 2022
Abstract
Exploring the design principle for switching between thermally activated delayed fluorescence (TADF) and room temperature phosphorescence (RTP) is a fundamentally important research to develop triplet-mediated photofunctional organic materials. Herein systematic studies on the regioisomeric and substituent effects in a twisted donor–acceptor–donor (D–A–D) molecular scaffold (A = dibenzo[a,j]phenazine; D = dihydrophenazasiline) on the fate of its excited state have been performed. The study revealed that regioisomerism clearly affects the emission behavior of the D–A–D compounds. Moreover, distinct differences in TADF, dual TADF & RTP, and dual RTP were observed, depending on the host used. Furthermore, organic light-emitting diodes (OLEDs) fabricated with the developed emitters achieved high external quantum efficiencies (EQEs) of up to 7.4% for RTP-based OLEDs.
Introduction
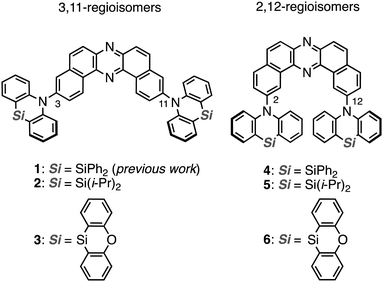
Heavy-atom-free organic compounds that display thermally activated delayed fluorescence (TADF) and/or room-temperature phosphorescence (RTP) have emerged as promising emissive materials for efficient organic light-emitting diodes (OLEDs),1–5 due to the capability of harvesting electrically-generated excitons. Also, they have increasingly attracted much attention in the fields of anti-counterfeiting,6 bio-imaging, theranostics,7 and some others.8 From a mechanistic point of view, TADF and RTP phenomena are connected through a triplet excited state;9–12 TADF arises through a radiative channel from the singlet excited state (S1) by recycling S1 by way of an energetically-close triplet excited state (Tn; the singlet–triplet energy gap ΔEST < ca. 0.3 eV), while RTP arises through a radiative channel from T1 to the ground state (S0). With a moderate ΔEST (ca. 0.3–0.6 eV), reverse intersystem crossing (rISC) to yield the S1 and the radiative pathway going back to the S0 (i.e., RTP) compete with each other, and thereby dual emissions of TADF and RTP are observed.13–15 Dual emissive organic materials can find applications in various fields such as sensors, data encryption, and white-emitting OLEDs (WOLEDs).16 Therefore, the regulation of the fate of the triplet excited state leading to TADF, RTP, or both by molecular design is fundamentally important in materials chemistry.Recently, we have successfully developed a heavy-atom-free organic RTP material 1 (Fig. 1) based on a donor–acceptor–donor (D–A–D) scaffold [D = Si,Si-diphenyl-dihydrophenazasiline (Ph-DHPAS); and A = dibenzo[a,j]phenazine (DBPHZ)].17 The D–A–D compound possesses unexpected dual RTP from T1 (3LE1) and T2 (3CT2) in a host matrix, which would be accelerated through a thermally activated reverse internal conversion (TArIC) process.18 Utilizing the compound as the emissive material for OLEDs, an efficient electrophosphorescence without heavy atoms such as Ir and Pt was achieved. Due to the scarcity of the examples of RTP materials based on the TArIC mechanism, a systematic structure–property relationship study (SPR) is indispensable to cultivate a new materials space of heavy-atom-free RTP materials.
Herein we disclose a SPR study of dual RTP materials using the D–A–D derivatives 2 and 3, which have varied substituents on the silicon center, and their regioisomeric counterparts 4–6 (Fig. 1). Interestingly, regioisomerism mainly plays an important role in switching the emissive channel of the DBPHZ-cored D–A–D compounds between TADF and RTP. Although the alteration of substituents on the Si center less influences the emissive excited-state energy, the thermal stability was significantly affected by the substituent.
Results and discussion
Material design and synthesis
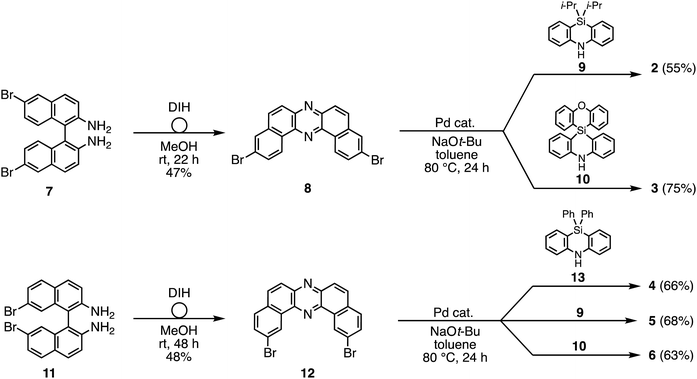
To reveal the effect of substituents on the Si atom and regioisomerism of 1 on its physicochemical properties, a series of D–A–D compounds 2–6 were designed (Fig. 1). The D–A–D compounds were synthesized in a similar manner to that of 1 (Scheme 1, for the detailed procedures, see the ESI†).17 3,11-Dibromo-dibenzophenazine 8, which was prepared through an oxidative skeletal rearrangement of dibromo binaphthalenediamine (BINAM) 7,19 was subjected to Pd-catalyzed Buchwald–Hartwig double amination with dihydrophenazasilines 9 and 10 to afford the corresponding D–A–D compounds 2 and 3 in good yields, respectively (Scheme 1, the upper equations). For the synthesis of 2,12-regioisomers, a new dibromo dibenzophenazine 12 was synthesized in a good yield, by applying dibromo BINAM 11 to our oxidative skeletal rearrangement reaction conditions (Scheme 1).19 The subsequent Pd-catalyzed double amination of 12 with dihydrophenazasilines gave the corresponding 2,12-regioisomeric D–A–D compounds 4–6 in good yields (Scheme 1, the bottom equations).X-Ray crystallographic analysis
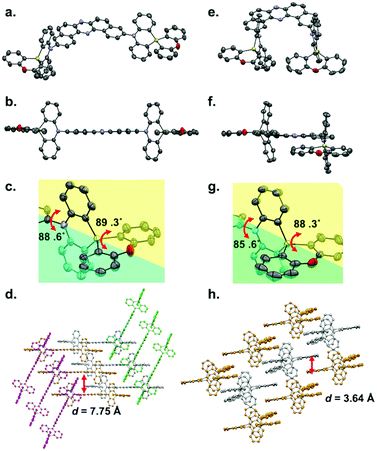
Single crystals of regioisomers 3 and 6 suitable for X-ray crystallographic analysis were successfully obtained by slow evaporation of bilayer solutions of n-hexane/CHCl3 (Fig. 2, for the detailed crystallographic data, see the Tables S1 and S2 in the ESI†). The crystallographic analysis revealed that both D–A–D molecules take equatorial–equatorial (eq–eq) type conformation in which two spiro-dihydrophenazasiline donors are connected with the acceptor in a perpendicular fashion (Fig. 2a, b, e, and f). In our previous work on 3,11-isomer 1, theoretical calculations suggested that an eq–eq conformer is the most thermodynamically stable one over the other possible conformers (i.e., eq–ax and ax–ax).17 Therefore, the eq-preference of the dihydrophenazasiline donor in the 3,11-disubstituted DBPHZ-cored D–A–D scaffold is reinforced experimentally. Due to the cruciform structure of the spiro motif, the planes of DBPHZ, phenazasiline, and phenoxasiline ring in 3 are almost perpendicular to each other (Fig. 2b and c). There is almost no π–π contact between the adjacent molecule in the packing structure (Fig. 2d, interplane distance = 7.75 Å), probably due to the cruciform molecular architecture. In contrast to the C2v molecular geometry of 3 (Fig. 2e), the 2,12-regioisomer 6 takes a less symmetrical conformation, with the DBPHZ core taking a helical structure and the phenazasiline unit taking a slightly bent geometry (Fig. 2f). Despite the sterically-congested environment around the D–A connecting positions, the acceptor occupies the equatorial position on the both nitrogen atoms of the donors, and thereby, the two donors take a slipped cruciform conformation (Fig. 2f and g). In contrast to 3,11-regioisomer 3, 2,12-isomer 6 stacks at the DBPHZ unit in an anti-parallel manner, with the interplane distance of the DBPHZ unit being 3.64 Å (Fig. 2h).UV-vis absorption and steady-state PL spectra of diluted solutions
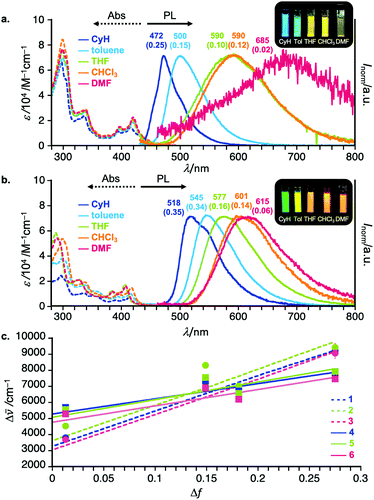
To investigate the effect of Si substituents and regioisomerism on the photophysics of the D–A–D compounds, UV-vis absorption and steady-state photoluminescence (PL) spectra of diluted solutions of 2–6 were measured. Representative spectra are shown in Fig. 3 (for the full detailed spectra, see Fig. S1 in the ESI†). The regioisomeric factor much more affects the photophysics in solution than the substituents on the Si center. Taking 3,11-isomer 1 and 2,12-isomer 4 as examples, the CT absorption band is slightly broader and weaker for 4 than for 1 (Fig. 3a and b). The UV-vis absorption spectra within the same regioisomeric scaffold are almost the same, indicating little effect of the Si-substituent on the nature of electronic transitions (Fig. S1 in the ESI†). Interestingly, solvatochromic behavior of regioisomers was quite different. In a non-polar solvent (cyclohexane), the 2,12-regioisomer 4 showed green emission (λem 518 nm, ΦPL 0.35), which is red-shifted when compared with that of the 3,11-counterpart 1 (λem 472 nm, ΦPL 0.25) (Fig. 3a and b). Both compounds showed significant positive solvatoluminochromism as a function of permittivity of organic solvent, indicating a significant CT nature of both compounds in the excited state (Fig. 3). However, it is noted that in a highly polar solvent such as DMF, the PL spectrum of 4 showed in a bluer region (λem 615 nm, ΦPL 0.06) than that of 1 (λem 685 nm, ΦPL 0.02). Comparison of the Mataga–Lippert plots of 1–6 gave us an interesting insight into the regioisomeric effect on the steady-state photophysics (Fig. 3c). The slopes for the 3,11-regioisomers 1–3 are much steeper than those of 2,12-regioisomers 4–6, indicating the much more change in the dipole moment from the ground state (μg) to the excited state (μe) for 3,11-regioisomers than 2,12-regioisomers. Within the same substitution pattern, there is little effect of Si-substituents on the emission behavior including the PL spectra (Fig. S1 in the ESI†). Another interesting tendency includes the larger intercepts in the plot for the 2,12-isomers than for the 3,11-isomers (Fig. 3c), which would be related to the structural change in the excited states. This was partly supported by the theoretical calculation results that the 2,12-isomers drastically change the most stable conformation (eq–eq) from the ground state to the excited state (eq–ax, see the theoretical part).Time-resolved spectroscopic analysis
To understand the actual recombination processes involved in light generation, more detailed photophysical studies were conducted (Fig. 4; for the full analysis data, see Fig. S2 and S3 in the ESI†). The photofunctional parameters are summarized in Table 1. To compare the influence of regioisomerism on photophysical properties, we compared compounds 2 and 5 as the representative examples (Fig. 4). The analysis revealed the influence caused by not only the molecular structure but also the host material on the observed emission processes. Depending on the combination of the molecular structure and host material, TADF, RTP, dual TADF & RTP, or dual RTP from the T1 and T2 states was observed (Fig. 4). As the analysis of emission change after excitation with laser, the PL emission intensity versus a particular delay time in a non-polar polymeric matrix (Zeonex®) showed emissions associated with dual TADF & RTP processes for both regioisomeric compounds (Fig. 4a and c). The transient intensity curves displayed a classical behavior of TADF and RTP processes for compounds in the Zeonex® matrix, where the delay component in the μs delay region increased as a function of temperature (TADF process), and the component in the ms delay region decreased as a function of temperature (phosphorescence process). It should be noted that the long-delayed component (phosphorescence) was not technically observed for compound 2,12-regioisomer 5, probably due to the overlap with long-lived TADF emission. In the case of compound 2, the RTP contribution is above 1% (Fig. 4b), while it is lower than 1% for compound 5 (Fig. 4d).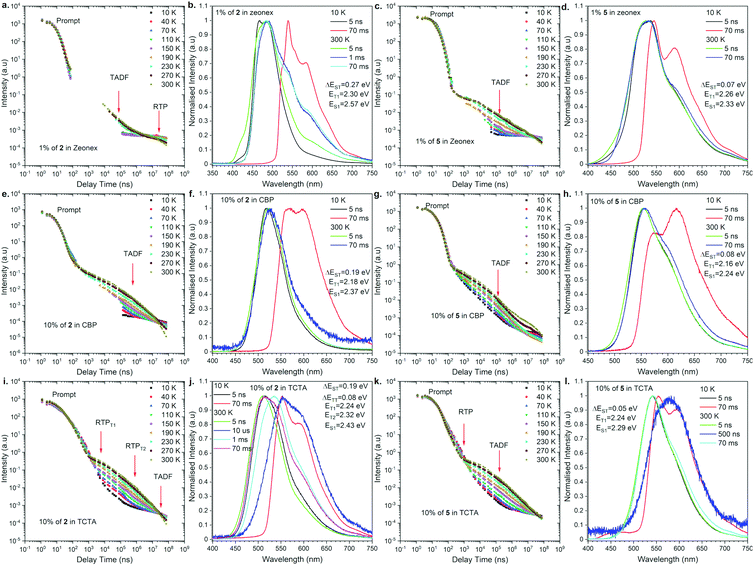 | ||
| Fig. 4 Photophysical properties of compounds 2 and 5 in a different matrix. Intensity vs. delay time and time resolved spectra at different temperatures in various hosts. | ||
| Compd | λ em (nm) | Host | Φ O2/Φdegb | τ PF (ns) | τ DF (μs) | τ PH1 (μs) | τ PH2 (ms) | DF/PFf | E a (eV) | S1h (eV) | T1h (eV) | T2h (eV) | ΔESTi (eV) | ΔETTi (eV) |
|---|---|---|---|---|---|---|---|---|---|---|---|---|---|---|
| a Photoluminescence maximum. b Photoluminescence quantum yield under air-equilibrated and degassed conditions. c Prompt fluorescence lifetime. d Delayed fluorescence lifetime. e Room-temperature phosphorescence lifetime from the T1 or T2 triplet energy level. f Delayed fluorescence (DF) to prompt fluorescence (PF) ratio in MCH as indicated from decay profile. g Activation energy of the triplet to singlet transfer. Error ± 0.01 eV. h Singlet and triplet energy in. Error ± 0.03 eV. i Energy splitting. Error ± 0.05 eV. | ||||||||||||||
| 2 | 483 | Zeonex | 0.065/0.098 | 6.9 ± 0.3 | 7.8 ± 0.3 | — | — | 2.31 | 0.03 | 2.57 | 2.30 | — | 0.27 | — |
| 523 | CBP | 0.186/0.372 | 6.8 ± 0.2 | 1.5 ± 0.1 | — | — | 3.80 | 0.06 | 2.37 | 2.18 | — | 0.19 | — | |
| 527 | TCTA | 0.122/0.337 | 16.3 ± 0.7 | 8777.9 ± 689.3 | 3.8 ± 0.4 | 0.86 ± 0.03 | 3.76 | 0.04 | 2.43 | 2.24 | 2.32 | 0.19 | 0.08 | |
| 3 | 477 | Zeonex | 0.065/0.072 | 6.5 ± 0.2 | 26.4 ± 1.7 | 22![[thin space (1/6-em)]](https://www.rsc.org/images/entities/char_2009.gif) 7107.8 ± 2322.1 7107.8 ± 2322.1 |
— | 1.11 | 0.02 | 2.60 | 2.26 | — | 0.34 | — |
| 505 | CBP | 0.153/0.168 | 5.8 ± 0.2 | 6.0 ± 0.6 | — | — | 0.87 | 0.03 | 2.45 | 2.25 | — | 0.21 | — | |
| 536 | TCTA | 0.094/0.223 | 27.8 ± 1.2 | 13![[thin space (1/6-em)]](https://www.rsc.org/images/entities/char_2009.gif) 724.7 ± 1182.2 724.7 ± 1182.2 |
2.3 ± 0.2 | 1.17 ± 0.07 | 3.11 | 0.03 | 2.44 | 2.23 | 2.30 | 0.20 | 0.06 | |
| 4 | 536 | Zeonex | 0.274/0.307 | 14.4 ± 0.5 | 29.1 ± 1.0 | — | — | 0.75 | 0.03 | 2.31 | 2.26 | — | 0.05 | — |
| 559 | CBP | 0.387/0.439 | 13.7 ± 0.6 | 2.0 ± 0.2 | — | — | 0.54 | 0.04 | 2.22 | 1.98 | — | 0.24 | — | |
| 553 | TCTA | 0.518/0.550 | 15.6 ± 0.7 | 5.4 ± 0.6 | 0.54 ± 0.05 | — | 0.93 | 0.03 | 2.25 | 2.21 | — | 0.03 | — | |
| 5 | 525 | Zeonex | 0.063/0.118 | 13.2 ± 0.6 | 4.0 ± 0.4 | — | — | 1.21 | 0.03 | 2.36 | 2.27 | — | 0.08 | — |
| 554 | CBP | 0.325/0.354 | 12.3 ± 0.6 | 8.6 ± 0.9 | — | — | 1.70 | 0.02 | 2.24 | 2.16 | — | 0.08 | — | |
| 541 | TCTA | 0.222/0.295 | 14.5 ± 0.7 | 18.5 ± 0.9 | 0.48 ± 0.05 | — | 3.18 | 0.04 | 2.29 | 2.24 | — | 0.05 | — | |
| 6 | 533 | Zeonex | 0.093/0.103 | 10.2 ± 0.6 | 33.5 ± 5.9 | 12![[thin space (1/6-em)]](https://www.rsc.org/images/entities/char_2009.gif) 138.6 ± 391.2 138.6 ± 391.2 |
— | 1.27 | 0.04 | 2.33 | 2.27 | — | 0.06 | — |
| 535 | CBP | 0.258/0.278 | 8.3 ± 0.2 | 2.9 ± 0.3 | 1914.3 ± 59.7 | — | 1.55 | 0.03 | 2.31 | 2.24 | — | 0.08 | — | |
| 533 | TCTA | 0.171/0.203 | 14.7 ± 0.7 | 4.3 ± 0.3 | 0.26 ± 0.02 | — | 2.70 | 0.04 | 2.32 | 2.25 | — | 0.07 | — | |
For the purpose of application study, further time-resolved spectroscopic analysis in an OLED host was conducted. Based on our previous study,17 we compared the behavior of the emitters in the CBP [4,4′-bis(N-carbazolyl)-1,1′-biphenyl] and TCTA [4,4′,4′′-tri(9-carbazoyl)triphenylamine] matrix. In the case of behavior in the CBP host, both regioisomers exhibited TADF emission at 300 K (Fig. 4e–h). The emission intensity versus delay time curves changed with temperature in the way that the delay component related with the TADF process increased as a function of temperature, whereas the phosphorescence in the ms delay regime decreased and disappeared above 150 K (Fig. 4e). The emission spectra at 300 K for both regioisomers at a delay time of 70 ms are nicely overlapped with the prompt emission and significantly different from the phosphorescence spectra, indicating the emission in CBP is radiated from the S1 state. In all the cases, the emission spectra are not well-resolved (i.e., Gaussian shape), suggesting that the S1 state is ascribed to the 1CT state (Fig. 4f and h). It is noted that a different type of emission was observed for the 2,12-regioisomeic spiro compound 6. At a very long delay time, a mixed emission of TADF and RTP processes was observed (Fig. S3j, ESI†).
Most importantly, unusual behavior was observed in the TCTA matrix (Fig. 4i–l). The 3,11-regioisomer 2 exhibited dual RTP emissions radiated from the T1 and T2 states, which are quite short-lived (in μs order) as for phosphorescence (Fig. 4i, and Table 1). Also, TADF occurred, but at very long delay times (Fig. 4i, j, and Fig. S2 in the ESI†). In contrast, the 2,12-regioisomer 5 displayed dual TADF & RTP emissions, but again surprisingly, the RTP is much shorter-lived than TADF (Fig. 4k and Table 1). It seems that the RTP occurs below 1 μs, and thus, we observed a decrease of the intensity of phosphorescence with the increase of temperature (Fig. 4k). The shape of the delayed emission spectra corresponds to those acquired at a low temperature at 70 ms delayed phosphorescence (Fig. S5 in the ESI†). The TADF emissions for compound 5 (2,12-regioisomer) started to be visible after a 10 μs delay time and are long-lived, probably due to the extensive ISC/rISC cycling (Fig. 4l).
When we compare the influence of the substituents on the Si center, for TADF molecule (2,12-substituents), the smaller substituent seems to allow for vibration between the donor and acceptor moieties to promote TADF. This would be why we observed the increase of the DP/PF ratio for compound 5 when compared to compound 4 (Table 1). On the other hand, for the RTP process, the molecular motion should be frozen to promote RTP. This would be why the compound with larger substituents on the Si center 1 had stronger RTP than the others. The same trend applies to the PLQY values: the efficiency increases as the substituents become larger in both regioisomeric series (1 and 4).
Thermal stability
To fabricate OLEDs by thermal evaporation technique, the thermal stability of the synthesized compounds was investigated using thermogravimetric analysis (TGA, for detailed data on the TGA profiles, see Fig. S6 and S7 in the ESI†). When compared with the degradation temperature Td (5 wt%) of compound 1 [Td (5 wt% under N2) = 496 °C], the Td (5 wt% under N2) of the 2,12-regioisomer 4 was found to be slightly low (451 °C). There is a tendency that the Td of 2,12-isomer is lower than that of the corresponding 3,11-isomer (see the ESI†), possibly due to the involvement of a thermal reaction between spatially-close donor units. The substituent effect on thermal stability was clearly observed: in the 3,11-regioisomeric scaffold, the steric stiffness allows for increasing Td (5 wt% under N2) [1 (496 °C) ∼ 3 (490 °C) > 2 (440 °C)]. This is the case with the 2,12-regioisomers [6 (483 °C) > 4 (451 °C) > 5 (332 °C)].To investigate the electrochemical stability of the emitters, cyclic voltammetry (CV) of dichloromethane (DCM) solutions of compounds 2–5 was performed (Fig. S8 in the ESI†). All the compounds displayed a (quasi)reversible reduction process at around redEonset –1.79–1.50 eV (vs. Fc/Fc+) and an irreversible oxidation at around oxEonset +0.55–0.89 eV (vs. Fc/Fc+). The estimated ionization potential (IP) and electron affinity (EA) of the compounds were estimated. The IPs follow the order of 6 (5.99 eV) > 3 (5.89 eV) > 1 (5.85 eV)17 ∼ 2 (5.84 eV) > 4 (5.65 eV) ∼ 5 (5.63 eV), while the EAs follow the order of 6 (3.60 eV) > 2 (3.52 eV) ∼ 3 (3.50 eV) ∼ 1 (3.49 eV)17 > 5 (3.36 eV) > 4 (3.31 eV).
Fabrication and evaluation of OLED devices
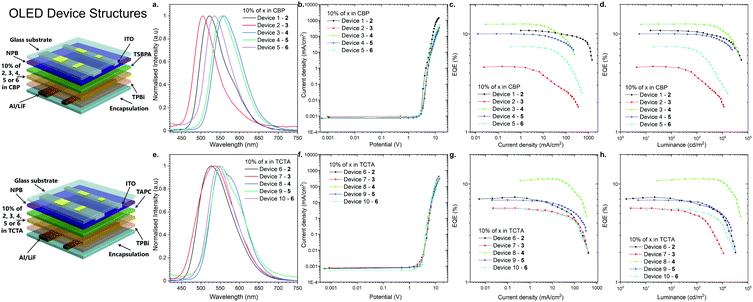
As the final experimental study, OLED devices were fabricated and their performance was investigated (Fig. 5). The behavior of the emitters in two hosts, CBP and TCTA, was characterized in the OLED devices. The structures of the fabricated OLEDs are illustrated in Fig. 5: Devices 1–5-ITO/NPB [N,N′-di(1-naphthyl)-N,N′-diphenyl-(1,1′-biphenyl)-4,4′-diamine] (40 nm)/TSBPA [4,4′-(diphenylsilanediyl)bis(N,N-diphenylaniline)] (10 nm)/10% 2, 3, 4, 5 or 6 in CBP (30 nm)/TPBi [2,2′,2′′-(1,3,5-benzinetriyl)-tris(1-phenyl-1-H-benzimidazole)] (60 nm)/LiF (1 nm)/Al (100 nm); and devices 6–10-ITO/NPB (40 nm)/TAPC [4,4′-cyclohexylidenebis(N,N-bis(4-methylphenyl)benzenamine)] (10 nm)/10% 2, 3, 4, 5 or 6 in TCTA (30 nm)/TPBi [2,2′,2′′-(1,3,5-benzinetriyl)-tris(1-phenyl-1-H-benzimidazole)] (60 nm)/LiF (1 nm)/Al (100 nm) (Fig. 5).All the devices fabricated with the emitters in the CBP host showed TADF. It is noted that even 2,12-regioisomer 6, which showed dual TADF & RTP emissions in the photophysical analysis in blended films (Fig. S2j, ESI†), displayed only TADF in OLED devices (Fig. 5a).
A more interesting phenomenon was observed in the electroluminescence spectra of the OLED devices fabricated with the TCTA host. Devices 6 and 7 with compounds 2 and 3 (3,11-regioisomers) showed efficient RTP emission from the T2 and T1 excited state, probably due to the fact that those excited states were much shorter-lived than TADF (Fig. S2, S3 and Fig. S9b, c, ESI†). As for compound 4 (2,12-regioisomer), device 8 displayed again dual RTP & TADF electroluminescence (Fig. 5e and Fig. S9d, ESI†). Finally, the devices 9 and 10 based on the emitters 5 and 6 (2,12-regioisomers) had electroluminescence emission through the RTP process (Fig. 5e and Fig. S9e, f, ESI†). The TADF process was an unfavorable process, probably because of a longer lifetime than the RTP process (Table 1).
The characteristics of the OLED devices revealed a significant increase of OLED efficiency depending on the host used (Fig. 5c, d, g, and h). The device based on CBP was found be the most efficient in all of the cases except for compound 3 (3,11-regioisomer), where external quantum efficiency (EQE) in TCTA was 50% higher than that in CBP (Fig. 6c and g). The highest EQE was achieved with the OLED fabricated with compound 4 (2,12-regioisomer) in both hosts (12.6% in CBP; 11.2% in TCTA). But, in both cases, the majority of emission comes from the TADF process (Fig. S9d, ESI†). Most importantly, the highest RTP-related OLED was obtained for devices 6 and 9 based on compounds 2 and 5 in TCTA (7.4% and 6.85%), which are higher than that of 1.17 This suggested that the EQEs are less likely dependent on the regioisomeric influence but mostly on the donor substituent. The highest luminance was obtained for the OLED based on compound 2 in CBP, up to 54![[thin space (1/6-em)]](https://www.rsc.org/images/entities/char_2009.gif) 800 cd m−2, whereas in the TCTA host it was for device based on compound 4 (51
800 cd m−2, whereas in the TCTA host it was for device based on compound 4 (51![[thin space (1/6-em)]](https://www.rsc.org/images/entities/char_2009.gif) 100 cd m−2, Fig. 5d and h).
100 cd m−2, Fig. 5d and h).
Theoretical calculations
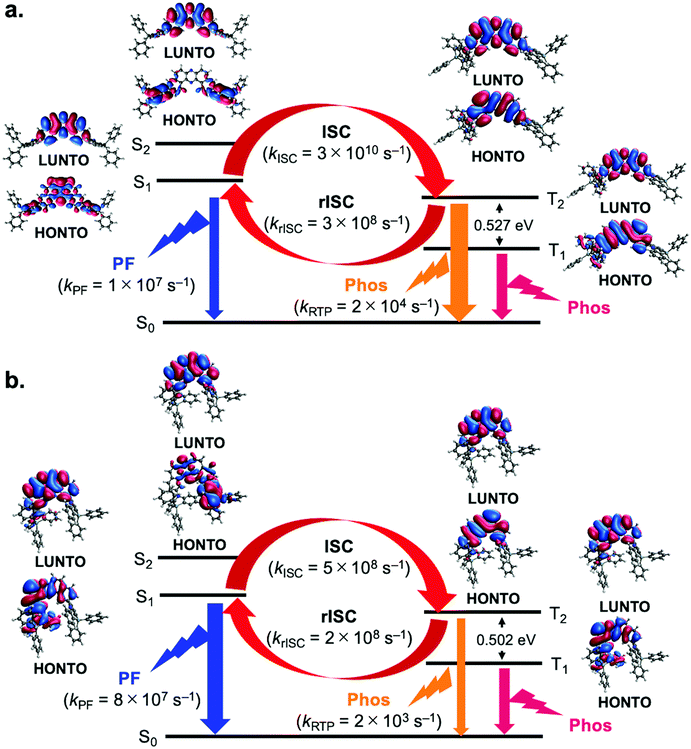
To better understand the mechanism behind the difference in behavior observed for 3,11- and 2,12-isomers, we resorted to electronic structure calculations, details of which can be found in the ESI.† DFT calculations were performed to determine equilibrium geometries and normal mode frequencies for each of the molecules in the eq–eq, eq–ax and ax–ax conformations. These calculations revealed that in the ground state, all molecules display a preference for the eq–eq conformation, in particular compounds 2 and 3 (see Tables S4–S9 in the ESI†). However, when considering the optimized geometries in the S1 state, conformational preference is shifted towards eq–ax conformations in the case of 2,12-isomers, but remains eq–eq for 3,11-isomers. Also, the T1 state molecules are all in eq–ax conformers even with 3,11-isomers (Tables S4–S9 in the ESI†). This constitutes a key difference between both kinds of molecules and is responsible for their different photophysical behavior. In Fig. 6, natural transition orbitals (NTOs) are shown for the S1, S2, T1 and T2 states of two molecules representative of 2,12- and 3,11-regioisomers, namely compounds 1 (Fig. 6a) and 4 (Fig. 6b). It can be seen that for the 3,11-isomer (1) the S1 state corresponds to a mixture of charge transfer (CT) and local excitation (LE), whereas the S2 has a clear CT character (Fig. 6a). Solvent induced stabilization of the S2 state is expected to reduce its energy difference with respect to S1, in particular in more polar solvents. In contrast with compound 1, the 2,12-isomer 4 shows S1 and S2 states with a mixed character between CT and LE (Fig. 6b). As for the triplet states, both T1 and T2 display mostly a LE character regardless of the isomer in question (Fig. 6a and b), although the T1 state of compound 4 is slightly mixed with CT character (Fig. 6b).To investigate conformational influence on the photophysical properties, fluorescence and phosphorescence spectra were simulated and ISC rates were estimated using the nuclear ensemble method as implemented in the NEMO software (Tables S10–S13 in the ESI†).20 As it can be seen in Table S10 in the ESI,† fluorescence from 2,12-isomers would be blue shifted if emitted from eq–eq conformations. These results show that the difference in conformational preference accounts for the red shift of the fluorescence in 2,12-isomers when compared to their 3,11-counterparts. In addition, fluorescence rates from the eq–ax conformers of the 2,12-isomers are consistently higher than those of the eq–eq conformers of 3,11 isomers, sometimes by as much as one order of magnitude, as shown in Tables S10 and S11 in the ESI† and in Fig. 6. This fact explains the higher PLQY observed for compound 4 in comparison to compound 1, as observed in Fig. 3.
When it comes to the role of triplet states, the estimation of the ISC rate shows that for all molecules, regardless of conformation, ISC is not efficient between S1 and T1, primarily due to high energy gaps between these states. Analysis of the rate estimates indicates rather that ISC is expected to take place mostly between S1 and T2 states (Tables S14–S16 in the ESI†). Higher energy triplet states can also take part in ISC, but low energy gaps with respect to lower lying triplets make internal conversion back to T2 a likely result. On the other hand, average gaps between T2 and T1 states are high (>0.4 eV, as seen in Table S17 in the ESI†), which should hinder reverse internal conversion (rIC) and allow continuous interconversion between triplet and singlet excitons by means of the S1–T2 pathway. This is true for all molecules analyzed here, which prompts the question of why the 3,11-isomers display more efficient RTP whereas the 2,12-isomers display mostly TADF. Any emission process, whether it be fluorescence from S1 or phosphorescence from T2, has to compete against the different available ISC processes, some of which are highly efficient. As mentioned above, fluorescence rates from the eq–ax conformation are typically larger than those from their eq–eq counterparts. Since the 2,12-compounds have a conformational preference for eq–ax in the excited state, fluorescence can outcompete ISC, constituting thus a possible pathway for exciton relaxation and explaining the observation of TADF in these molecules. On the other hand, 3,11-isomers, with their lower fluorescence rates, have a higher chance of undergoing radiative emission when in the T2 state, where this process competes against the less efficient up-conversion from T2 to S1. Furthermore, rISC rates from T2 to S1 in the 2,12-isomers are typically higher than in their 3,11-counterparts, which makes TADF more efficient as well. For these reasons, more significant RTP is observed from the 3,11-isomers. It is also worth mentioning that the estimated phosphorescence rates from the T2 states of the molecules in this work are 1–3 orders of magnitude larger than phosphorescence rates from their T1 states, which further emphasizes the role of emission from T2 in the photophysics of these compounds.
Conclusions
In summary, we have developed a new family of DBPHZ-cored D–A–D type organic emitters that show TADF, RTP, and both, depending on the conditions. The developed emitters were applied to OLED devices, which successfully achieved a high EQE of up to 7.4% for RTP-based OLEDs. Using the series of the developed emitters, a systematic structure–property relationship study was conducted to reveal the effect of regioisomerism on the fate of the excited states of the organic molecules. Although the detailed photophysical processes seem complex, a main fate of the excited state of the developed DBPHZ-cored D–A–D compounds is significantly governed by the donor positions. Theoretical calculations revealed a significant difference in the conformational preference between the ground and the excited states, which would also affect the rate of the photophysical process involved. In particular, the implication of the main role of the T2 state in the ISC/rISC recycling process would allow for expanding the horizon of organic emissive materials that utilize excited triplet states in the future.Conflicts of interest
There are no conflicts to declare.Acknowledgements
Y. T. acknowledges a Grant-in-Aid for Scientific Research on Innovative Area “Aquatic Functional Materials: Creation of New Materials Science for Environment-Friendly and Active Functions” (JSPS KAKENHI Grant number JP19H05716) from the MEXT (Ministry of Education, Culture, Science and Technology, Japan), a Grant-in-Aid for Scientific Research (B) (JSPS KAKENHI Grant number JP20H02813), a Grant-in-Aid for Challenging Research (Exploratory) (JSPS KAKENHI Grant number JP21K18960), and the Continuation Grants for Young Researchers from the Asahi Glass Foundation, and the Research Grant in the Natural Science from the Mitsubishi Foundation. Y. T. and S. M. acknowledge NIPPOH CHEMICALS for supplying N,N-diiodo-5,5-dimethylhydantoin (DIH). P. de S. and L. E. de S. acknowledge support by a research Grant (00028053) from VILLUM FONDEN. P.D. and P.Z.C acknowledge the Polish National Science Centre funding, Grant no. 2017/25/B/ST5/02488. P. D. and N. O. D. acknowledge the supporting awards from the Rector of the Silesian University of Technology (32/014/SDU/10-22-14, 04/040/RGJ21/0149). Y. T., N. O. D., P. Z. C., P. de S. and P. D. acknowledge the EU's Horizon 2020 for funding the OCTA project under grant agreement No 778158. Research work was supported from the funds for science in 2018–2022 allocated to the implementation of an international co-financed project by the Polish Ministry of Education and Science. P. D. N. O. D. and P. Z. C. acknowledge the supporting actions from EU's Horizon 2020 ERA-Chair project ExCEED, Grant agreement No 952008. Y. T. acknowledges Professor Hiroshi Miyasaka at Osaka University for fruitful discussion.Notes and references
- H. Uoyama, K. Goushi, K. Shizu, H. Nomura and C. Adachi, Nature, 2012, 492, 234–238 CrossRef CAS PubMed.
- H. Nakanotani, Y. Tsuchiya and C. Adachi, Chem. Lett., 2021, 50, 938–948 CrossRef CAS.
- Y. Liu, C. Li, Z. Ren, S. Yan and M. R. Bryce, Nat. Rev. Mater., 2018, 3, 1–20 CrossRef.
- G. Bergamini, A. Fermi, C. Botta, U. Giovanella, S. Di Motta, F. Negri, R. Peresutti, M. Gingras and P. Ceroni, J. Mater. Chem. C, 2013, 1, 2717–2724 RSC.
- G. Zhan, Z. Liu, Z. Bian and C. C. Huang, Front. Chem., 2019, 7, 305 CrossRef CAS PubMed.
- X. Yu, H. Zhang and J. Yu, Aggregate, 2021, 2, 20–34 CrossRef.
- V.-N. Nguyen, A. Kumar, M. H. Lee and J. Yoon, Coord. Chem. Rev., 2020, 425, 213545 CrossRef CAS.
- P. Data and Y. Takeda, Chem. – Asian J., 2019, 14, 1613–1636 CrossRef CAS PubMed.
- F. B. Dias, T. J. Penfold and A. P. Monkman, Methods Appl. Fluoresc., 2017, 5, 012001 CrossRef PubMed.
- X.-K. Chen, D. Kim and J.-L. Brédas, Acc. Chem. Res., 2018, 51, 2215–2224 CrossRef CAS PubMed.
- H. Ma, A. Lv, L. Fu, S. Wang, Z. An, H. Shi and W. Huang, Ann. Phys., 2019, 531, 1800482 CrossRef.
- D. Sasikumar, A. T. John, J. Sunny and M. Hariharan, Chem. Soc. Rev., 2020, 49, 6122–6140 RSC.
- G. Zhang, J. Chen, S. J. Payne, S. E. Kooi, J. N. Demas and C. L. Fraser, J. Am. Chem. Soc., 2007, 129, 8942–8943 CrossRef CAS PubMed.
- Y. Takeda, T. Kaihara, M. Okazaki, H. Higginbotham, P. Data, N. Tohnai and S. Minakata, Chem. Commun., 2018, 54, 6847–6850 RSC.
- R. Huang, N. A. Kukhta, J. S. Ward, A. Danos, A. S. Batsanov, M. R. Bryce and F. B. Dias, J. Mater. Chem., 2019, 7, 13224–13234 CAS.
- N. A. Kukhta and M. R. Bryce, Mater. Horiz., 2021, 8, 33–55 RSC.
- H. F. Higginbotham, M. Okazaki, P. de Silva, S. Minakata, Y. Takeda and P. Data, ACS Appl. Mater. Interfaces, 2021, 13, 2899–2907 CrossRef CAS PubMed.
- Z. He, W. Zhao, J. W. Y. Y. Lam, Q. Peng, H. Ma, G. Liang, Z. Shuai and B. Z. Tang, Nat. Commun., 2017, 8, 416 CrossRef PubMed.
- Y. Takeda, M. Okazaki and S. Minakata, Chem. Commun., 2014, 50, 10291–10294 RSC.
- L. E. de Sousa and P. de Silva, J. Chem. Theory Comput., 2021, 17, 5816–5824 CrossRef CAS PubMed.
Footnote |
| † Electronic supplementary information (ESI) available: Experimental procedures for the syntheses of materials, spectroscopic data of new compounds, single crystal X-ray crystallographic data, UV-vis absorption and photoluminescence spectra, detailed time-resolved photophysical analysis data, thermogravimetric analysis (TGA) profiles, cyclic voltammograms, theoretical calculation details, and the copies of NMR spectra of new compounds. CCDC 2121902 and 2121903. For ESI and crystallographic data in CIF or other electronic format see DOI: 10.1039/d1tc05730h |
| This journal is © The Royal Society of Chemistry 2022 |

