
 Open Access Article
 This Open Access Article is licensed under a
 Creative Commons Attribution 3.0 Unported Licence
A one-dimensional perovskite with ferroelectric and switchable nonlinear optical properties: [azetidinium]CdCl3†
Magdalena
Rok
 *a,
Bartosz
Zarychta
b,
Joanna
Trojan-Piegza
a,
Andrzej
Bil
a,
Anna
Piecha-Bisiorek
a,
Jan K.
Zaręba
c,
Wojciech
Medycki
d and
Ryszard
Jakubas
a
*a,
Bartosz
Zarychta
b,
Joanna
Trojan-Piegza
a,
Andrzej
Bil
a,
Anna
Piecha-Bisiorek
a,
Jan K.
Zaręba
c,
Wojciech
Medycki
d and
Ryszard
Jakubas
a
aFaculty of Chemistry, University of Wroclaw, 14 F. Joliot – Curie, 50-383 Wroclaw, Poland. E-mail: magdalena.rok@chem.uni.wroc.pl
bFaculty of Chemistry, University of Opole, Oleska 48, 45-052 Opole, Poland
cAdvanced Materials Engineering and Modelling Group, Faculty of Chemistry, Wrocław University of Science and Technology, Wybrzeże Wyspiańskiego 27, 50-370 Wrocław, Poland
dInstitute of Molecular Physics, Polish Academy of Sciences, Smoluchowskiego 17, 60-179 Poznań, Poland
First published on 13th January 2022
Abstract
Organic–inorganic perovskite hybrids (OIPHs) have been a topical area of interest in recent years. This stems from their key features such as facile and inexpensive solution based synthesis, high mechanical flexibility, structural tuneability, and chemical diversity, to name a few. Additionally, the frequently observed emergence of ferroelectric or piezoelectric properties along with optical properties renders them promising for photovoltaic energy conversion or mechanical energy harvesting applications. Herein, we report the synthesis of a novel ABX3-type ferroelectric crystal AZECdCl3 of formula [C3H8N]CdCl3, forming an infinite one-dimensional [{CdCl3}−]n chain along the c direction, with azetidinium (AZE) cations C3H8N+ fitted in-between the inorganic chains. Calorimetric (DSC) measurements revealed that the crystal undergoes a complex sequence of phase transitions, at 495 K (discontinuous I → II), 202 K (continuous II → III) and 167K (discontinuous III → IV). AZECdCl3 is characterised by a strongly enhanced electric permittivity around the paraelectric–ferroelectric transition at 202 K, exhibiting excellent ferroelectric hysteresis loops with a spontaneous polarization (Ps) of 4 μC cm−2 (168 K) and with a relatively small coercive electric field (Ec) of 1.02 kV cm−1. The crystal exhibits also ferroelastic properties over all low temperature phases. The experimental value of Ps agrees with theoretical predictions based on density functional theory-based calculations. The temperature-resolved second-harmonic generation (SHG) measurements attest to the polar order of this phase. First-order phase transition IV ↔ III was demonstrated to feature robust, high contrast SHG-off–SHG-on switching functionality. The broadband luminescence reveals thermal quenching when going from cryogenic temperatures to room temperature. The emission was assigned to the synergistic emissions of excitons due to the structural deformation of the lattice.
1. Introduction
Ferroelectrics based on organic–inorganic hybrids, although have been around for some time, still attract considerable attention as a potential alternative to conventional perovskite oxide materials. Their intrinsic merits are the diversity of tunable structures, mechanical flexibility and a wide range of synthetic conditions that can be employed for synthesis. Some ferroelectric hybrids have recently been employed in applications such as detectors, FeRAMs, photovoltaics, and mechanical energy harvesters, thus tying up with important facets of modern economy.1–8 In this regard, much attention has been paid to hybrids with perovskite-type compositions of the general formula ABX3, where A stands for an organic cation, B for a transition metal atom, and the bridging ligand X is the halogen anion.Among ABX3 compounds, there has been a growing body of reports on the electrical properties of crystals containing Cd(II).9–13 Take, for example, ferroelectric hybrid [(CH3)4P]CdCl3,14 which has a relatively high Curie temperature (Tc = 348 K) and remnant polarization (Pr = 0.43 μC cm−2) compared to its isostructural analogue [(CH3)4N]CdBr3.15 It has also been proven that doping of Sb(III) in crystals generated photoluminescence in the tested hybrid materials. The incorporation of the 3-pyrrolinium16 cation into the A position of the ACdCl3 system increases the polarization value to 5.1 μC cm−2, compared to the pyrrolidinium17 cation for which Ps was 3.6 μC cm−2. Interestingly, the use of a chiral cation in the (R)- and (S)-3-F-(pyrrolidinium)CdCl3 system guarantees a stable ferroelectric with a high transition temperature (Tc), which is essential for the practical utility of ferroelectric devices.18
Additionally, ferroelectric materials based on organic–inorganic hybrids from the halogen–metal family have recently attracted much attention due to the possibility of using them in electricity (nano)generators.19–22 Commonly used inorganic piezoelectric materials based on zinc oxides, barium titanate, lead zirconate titanate and others23–26 are not flexible enough for this purpose. OIPHs appear to be perfect alternatives to inorganic counterparts, given their mechanical flexibility and ease of obtaining thin layers. The first one-dimensional hybrid, for which mechanical energy harvesting was achieved, was that with the general formula [Me3NCH2CH2OH]CdCl3,19 generating a very high polarization of 17.1 μC cm−2. High values of spontaneous polarization are also observed for materials of the A2BX4 stoichiometry. In the case of [BnNMe2R]2CdBr4 (Bn = benzyl; 1: R = Me; 2: R = n-Pr)20 crystals the Ps equals 18.59 and 14.24 μC cm−2, respectively. Due to the attractive electrical properties, such as a high polarization value and electric permittivity, these materials can be used to create polydimethylsiloxane (PDMS) polymer composite samples. These devices were tested for their mechanical energy harvesting functionality, and the results obtained encourage the design and development of new types of ferroelectric hybrids and their use in self-powered electronics.
In addition to the apparent benefits of ferroelectricity, switching of second harmonic generation (SHG) between states of different activities due to the temperature change has become an exciting new branch of materials science. Recently, organic–inorganic hybrids based on halide derivatives of Cd(II) have been employed in the field of nonlinear optical switching. Specifically, for [pyrrolidinium]CdCl317 SHG-off–SHG-on–SHG-off has been demonstrated for the first time owing to a rarely observed sequence of phases in which a non-centrosymmetric phase is “in-between” the two centrosymmetric phases. Understanding the mechanism of phase transition (PT) that results in SHG quenching during the cooling process may be helpful in designing new switchable NLO materials with unusual SHG-off–SHG-on functionality.
Encouraged by the structural tunability of perovskite compounds and their electrical and NLO properties, we synthesized a new organic–inorganic hybrid material crystallizing with ABX3 stoichiometry in which A and B sites are occupied by azetidinium, and cadmium(II) ions, respectively. The compound undergoes three-stage phase transitions, in which only one phase (III) is polar and exhibits ferroelectric properties. The molecular dynamics of the polar cation was investigated using 1H NMR measurements in the solid-state. The crystal under investigation was explored using dielectric spectroscopy, pyroelectric tests, and temperature-resolved second harmonic generation (TR-SHG) measurements, and was tested for polarization switching properties. For instance, metal ions with a d10 configuration, Zn2+, Cd2+ and Hg2+, can act as luminescence centres to achieve a broadband emission. In this context, the reported AZECdCl3 is expected to serve as a right candidate for luminescence predominantly ascribed to the self-trapping exciton27 associated with structural deformations.28 Since the structure and its distortions play an essential role in defect localization and exciton creation, they further help in determining the optical properties of the AZECdCl3 crystal. Thus, the temperature-dependent luminescence of AZECdCl3 was studied and assigned to the combination of free-excitonic emission and self-trapped excitonic emission.
2. Results and discussion
2.1. X-ray crystal structure analysis
The structure of AZECdCl3 was determined at 220.0(1) (phase II, Cmcm), 185.0(1) (phase III, Cmc21) and 100.0(1) K (phase IV, Pbnm). The structure at 100.0(1) K was originally solved in the Pnma space group. However, the final model was refined in a non-standard setting to match cell parameters from high-temperature phases, i.e., Pbnm. Moreover, the asymmetric parts of the unit cells and the labelling of atoms at all temperatures have been chosen to show the structural relationship between the positions of the corresponding atoms in phases (Fig. 1). In all phases, the anionic substructure is composed of distorted [CdCl6]4− octahedra that share all six corners with two other neighbours, forming infinite one-dimensional [{CdCl3}−]n chains arranged in the c direction. The azetidinium cations C3H8N+ are located between the inorganic chains. The crystal data and the structure determination details are listed in Table S1 (ESI†). The bond lengths, valence and torsion angles, and hydrogen bond geometries are presented in Tables S2 and S3 (ESI†). | ||
| Fig. 1 Unit cell packing of AZECdCl3 in phase II (a), III (b) and IV (c) in the [100] direction along with a projection of cell's symmetry elements. Thermal ellipsoids are drawn at 25% probability level. | ||
At 220 K, in the independent part of the unit cell, there is one central cadmium(II) atom surrounded by two crystallographically independent chlorine ligands and one disordered quarter-molecule of the azetidinium cation. Because of the dynamical disorder, the N–C, C–C bond lengths and N(C)–C(N)–C angles were not determined with high precision. The disorder model suggests that the cation dynamics could be described as wobbling motion around a positively charged nitrogen atom and the opposite C3 atom in a perpendicular direction (Fig. 2). The cation is held by relatively weak intermolecular interactions of N–H⋯Cl and C–H⋯Cl types with a shortest N(C)⋯Cl distance of 3.374 (10) Å and 3.57 (2) Å for N and C, respectively.
 | ||
| Fig. 2 Disorder model of AZECdCl3 at 220 K (a) (phase II) and 185 K (b) (phase III). Only symmetrically independent part is labelled; thermal ellipsoids are drawn at 25% probability level. | ||
At 185 K, the structure of AZECdCl3 belongs to the polar space group of Cmc21. The transition triggers significant symmetry transformation i.e., the crystallographic symmetry elements vary from (E, C2,  ,
,  , i, σh, σv, and
  ) at 220 K to (E, C2, σv, and
  ) at 185 K. The lowering of the temperature leads to partial freezing of the cation reorientational motion (Fig. 2b). The cations adopt one of the disordered positions from the structure at 220 K. This change rebuilds the symmetry of the unit cell by deletion of the
  mirror plane. Moreover, the new position of the cation influences the mean direction of the dipole moment, which points now along the [001] direction. Upon temperature lowering, there is no significant change in the amount and strength of the intermolecular interactions, and the difference in D⋯A distances does not exceed 2σ in value.
In the low-temperature phase (IV), the structure of AZECdCl3 is still orthorhombic (space group Pbnm). Here the number of the crystallographic symmetry elements is increased back as the symmetry changes from (E, C2, σv, and  ) at 185 K to (E, C2,
  ,
,  , i, σh, σv, and
  ) at 100 K. This difference is attributed to the changes in both: organic cation dynamics and a deep structural transformation of the inorganic substructure. In phase IV, the molecule motions are firmly frozen. The molecule twists around the a direction and adopts a C2v symmetry at the special position of the unit cell's, generating the
  mirror plane (Fig. 1c). As presented in Fig. 3, during III → IV PT the inorganic and organic substructures are twisted by ca. 12.6° and 37.6°, respectively, around the c direction. By contrast, during II → III PT, no such rotation is observed.
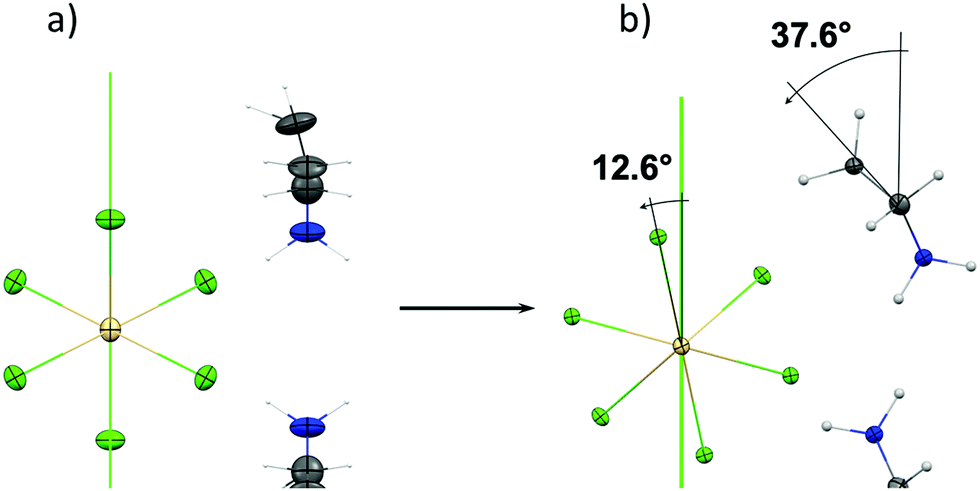 | ||
| Fig. 3 Projection (along the c direction) of the structural changes in inorganic and organic substructures between phases III (a) and IV (b) in AZECdCl3. Thermal ellipsoids are drawn at 25% probability level. | ||
In phase IV, the ordered cation participates in stronger N–H⋯Cl hydrogen bonds as the distance between donor and acceptor decreases from 3.38(1) Å to 3.16(1) and 3.28(1) Å. This corresponds well with the twist of the organic substructure to the direction of the inorganic framework.
In all phases, the octahedral coordination of Cd(II) is distorted, and the distortion changes on lowering the temperature. A measure of the Cd(II) deformation can be estimated by eqn (1) by calculating the distortion parameter Δ if one takes bond lengths into account.
 | (1) |
![[R with combining macron]](https://www.rsc.org/images/entities/i_char_0052_0304.gif) is the average Cd–Cl bond length within the octahedron and Ri is the individual Cd–Cl bond length. For the valence angles, the distortion of the octahedral coordination can be easily estimated with the use of corrected sample standard deviation, in which the expected value amounts to 90° for cis angles (variance of the octahedral angles) (eqn (2)).29
is the average Cd–Cl bond length within the octahedron and Ri is the individual Cd–Cl bond length. For the valence angles, the distortion of the octahedral coordination can be easily estimated with the use of corrected sample standard deviation, in which the expected value amounts to 90° for cis angles (variance of the octahedral angles) (eqn (2)).29 | (2) |
The analysis of the contact surface, upon the azetidinium cation removal, shows a decrease of the volume of the inorganic framework cages with the temperature lowering. In the II → III PT, the surface volume for (C3H8N)CdCl3 decreases only slightly by 0.2% for the unit cell volume. Nevertheless, the III → IV PT causes a dramatic structural change in the value of the contact surface. The volume decreases here by 13.5% from 336.95 Å3 to 288.28 Å3 justifying large-scale changes in the inorganic substructure.
2.2. Thermal analysis
The DSC traces for AZECdCl3 are presented in Fig. 4. The thermal analysis was performed as follows. First, the sample was cooled from room temperature (RT) to 140 K, and then heated to 500 K. The last cycle was performed on cooling from 500 K to RT. DSC measurements revealed that below RT, there are two reversible thermal anomalies assigned to structural PTs, i.e. at 202/202 K (cooling/heating) and 164/167 K. The evident thermal hysteresis and sharp heat anomaly both indicate the first-order feature of the (III → IV) PT. By contrast, the higher temperature weak anomaly is characteristic for the second-order PT, marked as (II → III). Based on the Boltzmann equation ΔS = R![[thin space (1/6-em)]](https://www.rsc.org/images/entities/char_2009.gif) lnN, the ratio of the respective numbers of microstates N below and above PT can be estimated. In the case of the IV → III PT, the parameter N is equal to ca. 4.7 suggests an order–disorder nature of this transition. In turn, the heating of AZECdCl3 above RT disclosed a weak thermal anomaly a few degrees below the decomposition point of the sample, which means that the crystal is stable up to the temperature of 500 K (Fig. S1 in the ESI†). The shape of this hardly reversible thermal anomaly suggests the discontinuous nature of PT (II → I, at 495 K), whereas the estimated value of N ≈ 1.2 suggests a “displacive” mechanism.
lnN, the ratio of the respective numbers of microstates N below and above PT can be estimated. In the case of the IV → III PT, the parameter N is equal to ca. 4.7 suggests an order–disorder nature of this transition. In turn, the heating of AZECdCl3 above RT disclosed a weak thermal anomaly a few degrees below the decomposition point of the sample, which means that the crystal is stable up to the temperature of 500 K (Fig. S1 in the ESI†). The shape of this hardly reversible thermal anomaly suggests the discontinuous nature of PT (II → I, at 495 K), whereas the estimated value of N ≈ 1.2 suggests a “displacive” mechanism.
 | ||
| Fig. 4 DSC traces for AZECdCl3 between 145 and 500 K (scanning rate 5 K min−1 and m = 8.5080 mg). | ||
2.3. Temperature-resolved second harmonic generation (TR-SHG) measurements
Next, we have turned to temperature-resolved second harmonic generation (TR-SHG) measurements to provide spectroscopic evidence for (non)centrosymmetry of observed crystal phases of AZECdCl3. TR-SHG measurements were performed in the 145–220 K range (both heating and cooling runs) by irradiation with 800 nm femtosecond laser pulses. Experimental SHG spectra for heating and cooling runs are provided in Fig. S2 and S3 (ESI†), respectively. Fig. 5a shows that the SHG signal is present for phase III only. More specifically, one sees that upon heating from 140 K upwards, the SHG signal starts increasing at ca. 155 K to reach the maximum at 165 K; after that point the SHG response slowly decreases in a nearly linear fashion to disappear at ca. 202 K, thus completing the plot of ‘sawtooth’ type. The subsequent cooling run shows that the SHG response gradually increases when the temperature decreases from 202 K down to 160 K. Below that temperature point, the SHG signal is absent. From these results it is apparent that transition III → IV is characterized by ∼5 K thermal hysteresis, confirming the first order character of this PT. On the other hand, both the lack of thermal hysteresis as well as slow build up and decay of the SHG response in 160–202 K range attest to the continuous nature of II → III structural transformation. | ||
| Fig. 5 (a) Integral intensities of the SHG signal (400 nm) for AZECdCl3 plotted as a function of temperature. (b) Plot of integral intensities of SHG signals obtained during the switching experiment between 155 K (black squares) and 167 K (red circles). The inset presents the corresponding experimental spectra of the obtained SHG responses. | ||
We have also assessed the relative SHG efficiency of AZECdCl3 by means of the Kurtz–Perry powder test on size-graded samples. Since in the case of AZECdCl3, the strength of second-order NLO activity varies across a broad temperature range, relative SHG efficiency was determined at a temperature at which the maximal nonlinear response was registered (165 K). Accordingly, one sees that upon 800 nm irradiation AZECdCl3 generates second harmonics of radiation equal to 0.12 of that of KDP with the same particle size. The collected results thus show that phase the transition sequence of SHG-off ↔ SHG-on ↔ SHG-off states is present here, which offers prospects for quadratic NLO switching between active and inactive NLO states. It is worth noting that the same pattern of noncentro and centrosymmetric phases was previously observed for the [pyrrolidinium]CdCl317 material, for which switching between one NLO-active state and two NLO-inactive states was demonstrated (switching of the off–on–off type).
In the case of AZECdCl3 we have also explored SHG switching capability, but the selection of suitable phases for this purpose deserves a comment. Namely, the phase transition between phase II and phase III is continuous, and as Fig. 5a shows, the transition from a completely SHG-on to SHG-off state requires the temperature change of at least 45 K. Such a broad temperature window makes the practical utility of the II ↔ III transition for switching purposes rather questionable, since switching requires not only a sharp change in the SHG response, but should be also performed using the smallest possible temperature step. Accordingly, we have explored III ↔ IV phase transition only in terms of SHG signal switching functionality.
In the SHG switching experiment the temperature was varied in a periodic manner between the two temperature points: 155 K and 167 K, which correspond to completely converted SHG-on (IV) and SHG-off (III) states, respectively. The results are shown in Fig. 5b, which displays integral intensities of SHG collected during the switching experiment while corresponding the experimental spectra of the SHG signal are displayed in the inset. One sees that the registered SHG signals for phase IV do not attenuate for at least 11 switching cycles, but rather oscillate within a narrow range. On the other hand, there is no residual SHG signal for phase III, attesting to its complete conversion to centric setting. Accordingly, it is clear that AZECdCl3 displays reversible SHG-off–SHG-on switching functionality in a low temperature range. It can be also seen that this kind of SHG switch features very high contrast as its operates against essentially zero background.
We also note that the SHG-off–SHG-on switching scheme presented here for AZECdCl3 stands out in the context of extant binary NLO switches. Indeed, the literature search shows that the most common is the variant in which the phase below Tc is SHG-active and that above Tc is SHG-inactive, that is, the SHG-on–SHG-off switching scheme is the most widespread across solid-state NLO switches.30–35
2.4. Screening ferroelastic PTs
The thermal evolution of the ferroelastic domain structure, observed under a polarizing microscope, is illustrated in Fig. 6. In phase II, the monodomain samples of AZECdCl3 is in the form of pristine single crystals, without any external strain applied (Fig. 6a). No visible changes were observed on the crystal surface upon cooling from phase II to III. Subsequent lowering of the temperature causes the transition from phase III to IV, leading to substantial structural changes that affect the crystals’ image in polarized light. As shown in Fig. 6b, the strong distortion of the crystal lattice during PT leads to the appearance of ferroelastic domains parallel to the c-axis. PT I → II leads to the paraelastic phase. Most likely, we deal with the orthorhombic ↔ tetragonal transitions. | ||
| Fig. 6 The evolution of the domain structure for AZECdCl3 with the direction perpendicular to the largest face [011] of the relatively thin as-grown plate. (a and b) The first cycle on cooling from phase III to IV. (b and c) Next heating from phase IV for phase II. (c and d) The last cooling from phase II to IV. | ||
Strong distortion of the crystal lattice during each PT usually leads to cracking of the single-crystal sample. After heating to phase III, we still observe domains that persist in phase II (Fig. 6c). As shown in Fig. 6d, re-cooling to phase IV sharpens the ferroelastic domains and causes further crystal destruction. The appearance of ferroelastic domains may indicate that high-temperature phase I is the prototype/paraelastic one, and the transition from phase II to I can be classified as ferroelastic–paraelastic. The consequence of PT from the ferroelastic to the paraelastic phase is a change in the crystallographic system, and additionally, all the elements of the ferroelastic phase symmetry should be included in the paraelectric set. Since the image lacks domains that would intersect at an angle of 60 or 120°, this may suggest that the prototype phase cannot be trigonal or hexagonal and tetragonal is most likely.
2.5. Electric properties
The dielectric response, presented in Fig. 7, was measured for a single-crystal sample along the polar direction (c-axis), while Fig. S4 (ESI†) shows the temperature dependence of the complex dielectric permittivity ε* measured perpendicular to a- and b-axes. By comparing the results obtained for these three directions, the most noticeable changes in the vicinity of PT are seen along the polar c-axis, which also indicates the strong dielectric anisotropy. The ferroelectric nature of the transition is evident from the critical anomaly of the electric permittivity (ε′), being close to the Curie temperature (TC = 202 K). The temperature-dependent real part (ε′) of permittivity at each frequency shows a distinct λ-shape peak through the Tc, with large values for ε′ of 13000–25000 (for the frequency range of 135 Hz–2 MHz), indicating that phase III possesses a ferroelectric nature. Additionally, in the vicinity of Tc, ε′ follows the Curie–Weiss law, i.e. ε′ = Cpara/(T − θ), where (T > Tc) or Cferro/(θ′ − T) where (T < Tc). The Cpara and Cferro are the Curie–Weiss constants of II and III phases, and their values obtained from the fitting are 3767 and 8080 K for paraelectric and ferroelectric phases, respectively. The fitting gives a Cpara/Cferro ratio (2.14), which is close to the theoretical value of 2 expected for the second-order ferroelectric transition. The Curie–Weiss temperatures (θ = 202.3 K, θ′ = 201.9 K) are very close to Tc = 202 K. In the case of the dielectric results presented in a logarithmic scale (y-axis), relaxation processes of disparate nature are much more apparent for paraelectric and ferroelectric phases (Fig. S5, ESI†). It is clearly seen (Fig. 7a and b) that the ferroelectric transition II → III is immediately followed by a relaxation process, which corresponds to the relaxation of the domain/domain boundary formed/reformed as a result of that particular ferroelectric transition. However, it should be added that the dynamic properties within ferroelectric phases are usually complex. If dielectric relaxation appears below Tc (Curie temperature), it may have a different mechanism. Generally, at low temperatures, we have so-called two origins: (i) the “extrinsic” contribution, which is mainly attributed to domain wall motions and (ii) “intrinsic” contributions, which originate from the dielectric (maybe dynamics of dipolar molecules) and piezoelectric responses of single domain samples. Taking into account the dielectric response of AZECdCl3 in the close vicinity of Tc we deal with the “displacive” mechanism of ferroelectric transitions. In the case of the order–disorder mechanism in ferroelectrics in the vicinity of Tc we should observe a critical slowing down of the macroscopic relaxation time,36 which do not appear up to 2 MHz. However, considering the order–disorder mechanism proposed based on crystallographic results, one can expect the ferroelectric relaxation in the gigahertz frequency region (above 1 GHz).
 | ||
| Fig. 7 The temperature dependence of the dielectric permittivity, (a) ε′ and (b) ε′′ obtained on cooling run for single crystals along the c-axis (S = 4 mm2 and d = 1.1 mm). The range of frequency was from 500 Hz to 2 MHz. (c) The dielectric Curie–Weiss law around the ferroelectric transition for a frequency of 2 MHz. | ||
Nevertheless, the displacive mechanism is dominant, whereas the possible order–disorder one plays a negligible role. The question of dielectric relaxation and its possible sources are presented in Fig. S6 (ESI†), showing the frequency dependence of the electric permittivity for selected temperatures obtained in both paraelectric (II) and ferroelectric (III) phases. The determined activation energy is 27.22 kJ mol−1 and is assigned to the domain-wall motion. On the other hand, traces of the relaxation process barely visible near Tc in the paraelectric phase may be related to the dynamics of dipolar molecules with a dispersion maximum in the GHz region. In order to check the ferroelectricity of AZECdCl3, the hysteresis loop (P–E) was measured on a single crystal sample along the polar c-axis. In Fig. 8a, we can observe well-shaped rectangular P–E hysteresis loops for selected temperatures at a frequency of 1 Hz with a relatively large saturation polarization (Ps) of 4 μC cm−2 (168 K), and with a relatively small coercive electric field (Ec) of 1.02 kV cm−1. Similar results were obtained for the closely related compound, [pyrrolidinium]CdCl3,17 where the coercive field was also small (1.5 kV cm−1), and Ps was equal to 3.6 μC cm−2. Fig. 8b depicts a typical IC–E (instantaneous current density–electric field) curve with two opposite peaks due to charge displacement, corresponding to two stable states with opposite polarity. Fig. 8b diagram also shows the decrease of the coercive field when the temperature increases. The frequency dependency of the P–E loop is illustrated in Fig. S7a (ESI†) for the range between 1 and 2000 Hz. According to these data, some slight decrease in both Pr and Ec is observed when the frequency increases. Similar results were obtained for [(CH3)4P]CdCl3.14 The evolution of the loop saturation for 1 Hz is shown in Fig. S7b (ESI†).
 | ||
| Fig. 8 (a) Polarization–electric field (P–E) hysteresis loops measured for the chosen temperatures (max. electric field of 5.21 kV cm−1, f = 1Hz). (b) IC–E (instantaneous current (mA) density–electric field) curve with two opposite peaks (max. field 5.21 kV cm−1, f = 1Hz). (c) Temperature dependence of Ipyro (black line) measured for a sample after the application of the DC electric field (±1.32 kV cm−1) in phase II and then cooling the sample to phase III. The measurements of Ipyro were carried out during heating (III → II). Polarization Ps(T) (pink line) determined by the integration of the pyroelectric current. (d) Ps2versus (Tc − T), fitted Tc equals 201.6 K. | ||
As shown in Fig. 8c, the temperature-dependent polarization was calculated by integrating the pyroelectric current. As can be seen, a sharp peak of pyroelectric current is formed near Tc, which inverts as the direction of the applied field changes, with an intensity of 1.32 kV cm−1. The obtained polarization of about 3.5 μC cm−2 (for 170 K) matched well the value measured from the P–E loop. The linear dependence of P2vs. (Tc − T) presented in Fig. 8d also indicates the continuous nature of the PT with the estimated temperature Tc = 201.6 K.
2.6. Spontaneous polarization – theoretical calculations
Quantum mechanical calculations offer a supplementary approach to studying the electronic structure of crystals. In particular, for a well-defined (ordered) phase, the components of spontaneous polarisation can be calculated. For non-centrosymmetric phase III of AZECdCl3, such calculations can be performed only if the original disordered phase can be properly modelled using ordered structures. To this end, we prepared two sets of coordinates (A and B, see in Fig. S8, ESI† for details) by setting the position of azetidinium cations, whose reorientational motions between two symmetrically equivalent positions are the origin of the disorder of phase III. Within this model, which bases on the crystal structure measured at 185 K, the spontaneous polarization of phase III can be obtained by averaging the polarizations calculated for the ordered structure represented by A and B. Consequently, the only non-vanishing component of the spontaneous polarization is the one directed along ‘c’.The calculated length of the spontaneous polarisation vector falls in a narrow range of 3.0–3.1 μC cm−2 depending on the density functional applied for the calculations, which agrees with the experimental data. Due to a non-periodic character of the position operator, the calculated value of spontaneous polarization is inherently accompanied by a so-called polarization indetermination quantum,37,38 (see further details in Table S5 and S6 in the ESI†). The agreement between the experimental and the theoretical spontaneous polarization indicates that the basic value reported here is physically meaningful. Interestingly, the length of the ‘a’ component of the spontaneous polarization calculated for the ordered model derived from phase III is small, i.e. below 0.2 μC cm−2.
2.7. 1H NMR studies
Temperature dependence of 1H NMR spin–lattice relaxation time T1 is shown in Fig. 9. Going from the lowest temperatures, the relaxation time linearly shortens from about 19.5 s at 85 K to about 6.5 s at 160 K. The value of activation energy calculated from the slope of log plot has been estimated to be 1.5 kJ mol−1. Such a slight slope of the temperature dependence of the longitudinal relaxation T1 may denote the domination of the quadrupole interaction with chlorine nuclei39,40 in the lowest temperatures reached in the present study. Above the sudden drop of relaxation time T1 to about 1 s at the PT, the well symmetric minimum is visible at around 218 K with a T1 minimum of 74 ms. However, it should be noted that there is a slight discontinuity around 202 K despite the general impression that we have one symmetrical minimum of longitudinal relaxation times. In the temperature range covering phase III, it was only possible to determine the activation energy from the slope, which is equal to 22.1 kJ mol−1 (Ea2). Considering the structural results for phase III, this activation energy is assigned to the ring-puckering motion of the pyrrolidinium cations. In turn, the remaining points above the PT at 202 K and an observed single minimum of proton relaxation can be described by the BPP formula:41 | (3) |
exp(Ea/RT), where τ0 is the correlation time at the limit infinite temperature, Ea – the height of the barrier, and R – gas constant. After the fitting procedure, the activation energy Ea and the correlation time τc were estimated as Ea3 = 19.7 kJ mol−1, τc = 6.2 × 10⁻¹⁴ s and relaxation constant C = 1.5 × 10⁹ s−2, respectively. Theoretical curves corresponding to the above fitting are depicted as the red curves in Fig. 9. The Ea3 energy is assigned to the reorientation of the cations about the C3–N1 axis. Worth noting is that similar T1vs. 1/T function behaviour was observed for (azetidinium)2KCo(CN)642 in comparable temperature regions.
 | ||
| Fig. 9 Temperature dependence of the 1H NMR spin–lattice relaxation time T1 of AZECdCl3. | ||
The temperature dependence of the second moment (M2) is presented in Fig. S9 (ESI†). According to these results the drastic reduction of M2 at ca. 167 K is due to the fact that the ring-puckering movement of cations starts abruptly above the (IV → III) PT temperature. The contribution of the pyrrolidinium cations to the molecular mechanism of this transition is in accordance with the structural results.
2.8. Photoluminescence properties
The remarkable properties presented above encouraged us to study the luminescence of AZECdCl3. Since the material revealed only weak blue luminescence upon UV excitation at room temperature, the optical properties of AZECdCl3 were examined for the solid-state powder specimen in the broad 15–300 K temperature range. Fig. 10 presents the photoluminescence emission (PL) spectra recorded at 281 nm (Fig. 10a) and 291 nm (Fig. 10b) excitation (for clarity, in the whole PL/PLE section, measurements for a given temperature are drawn in one color). Independently of the excitation wavelength, the spectra structure is analogous, and two emission areas are evident. Namely, in the range of 330–480 nm there is a narrower emission band and there is a broader one covering the 500–750 nm range. With the increase of temperature, the luminescence disappears so that above 250 K, PL is barely visible, as mentioned before, revealing a significant thermal quenching in AZECdCl3. This process is well known for other cadmium halides crystals43,44 and its hybrid compounds.45,46 | ||
| Fig. 10 Temperature dependence of photoluminescence emission (PL) spectra of AZECdCl3 excited with (a) 281 nm and (b) 291 nm. | ||
The photoluminescence excitation spectra (PLE) of AZECdCl3 in Fig. S10 (ESI†) demonstrate structured bands with peaks at about 280 nm and 290 nm suggesting the origin of bands from different excited states. Furthermore, comparison of non-normalized PL spectra (Fig. 10) and those normalized to the same peak intensity (Fig. S11, ESI†) shows that there are no drastic differences between these two excitation wavelengths. Also, there is another common feature, namely in both cases the decrease in temperature from 200 K to 100 K increases the intensity of low-energy emission at 620 nm. Further cooling to 15 K in turn causes its disappearance with a simultaneous shift of high-energy band from 410 nm to 380 nm and increase of the total emission intensity accompanied by the band narrowing. In more detail, it is shown in Fig. S12 (ESI†). At 15 K, the emission is fitted well by a Gaussian distribution function with one component, as shown in Fig. S13 (ESI†), with a FWHM of 34 nm.
The measured PL decay times of the studied compound range from 2.1 ms to 28.7 ns (370 nm), 4.1 μs to 130 ns (410 nm) and 9.2 μs to 4.4 μs (620 nm) with heating (Table S7 and Fig. S14, ESI†). In the literature, a spread in PL lifetimes of hybrid halides is reportedly ranging from subnanoseconds up to 54.1 ns,47–49 attributed to self-trapped excitonic states (STEs). Also, phosphorescence lifetimes in the microsecond range are reported.50,51 It is worth noting that at 100 K both the low and high energy emission are excited through the same wavelength 281 and 291 nm and have similar lifetime of few μs, indicating fast thermal equilibrium between their excited states.
In hybrid metal halide perovskites, tunable broadband emission has been attributed to structural distortions,47,52,53 particularly to the distortions of the inorganic MX6 octahedra.45,54 According to X-ray analysis, the [CdCl6]4− octahedra distortion changes increased with lowering the temperature, particularly from 200 K to 100 K. For metal–halide systems, PL may originate from the presence of free and bi-excitons,55 free exciton and exciton–phonon interactions,55 or free and bound excitons.55 Taking into account the relatively long PL lifetime of AZECdCl3, the origin of spin-forbidden triplet exciton emission is possible.56 Furthermore, emission might also originate from structural phase transitions often observed in these hybrids57,58 which may apply in AZECdCl3 as structural phase transitions occur in the examined temperature range. The presented studies suggest that the bluish emission in AZECdCl3 likely has contributions from both distorted excited states due to strong electron–phonon coupling in a deformable lattice as well as inhomogeneous broadening resulting from a distribution of trap states.
3. Conclusions
In this contribution we have introduced a novel azetidinium-based organic–inorganic hybrid perovskite of formula [C3H8N]CdCl3 (AZECdCl3), hosting ferroelectric, ferroelastic and SHG-off–SHG-on quadratic switching properties. Indeed, structural, dielectric and SHG measurements show that AZECdCl3 loses the inversion centre at a temperature of 202 K, and in the subsequent transition, it regains it again around a temperature of 167K (Scheme 1). Ferroelectric order is present only in phase III with a temperature window of ∼40 K. Polarization switching was proven by the pyroelectric effect and hysteresis loop measurements with Ps ≈ 4 μC cm−2 (168 K). This high value of bulk polarization is corroborated by theoretical calculations. The relatively small coercive field and the low impact of the field frequency on the value of spontaneous polarization also sets out the title compound from other Cd(II) based ferroelectrics. Polarizing microscope observations show that ferroelastic properties span across three adjacent phases II, III and IV, whereas phase I appears to be the only paraelastic phase. The observed reversible transformation of the first type between the polar (III) and low temperature centrosymmetric phase (IV) allowed us also to demonstrate uncommon type of NLO switching, in which the lower temperature phase is SHG inactive, while the higher temperature phase is SHG active, yielding SHG-off–SHG-on solid-state switching | ||
| Scheme 1 The phase diagram of AZECdCl3. 1st: first-order PT, 2nd: second-order PT. | ||
The dynamics of the polar cations located between 1-D inorganic chains are responsible for thermally induced three-stage PTs (Scheme 1). Analysis of the dielectric response close to Tc suggests that the mechanism of the paraelectric–ferroelectric transition is mixed; the “displacive” contribution is due to the strong distortion of both cationic and anionic substructures and the “order–disorder” contribution is assigned to very fast reorientational motion of dipolar cations. The latter contribution is very small, and the relaxation process related to the dynamics of cations will be shifted to the microwave range. The molecular dynamics of the azetidinium cations were also investigated using 1HNMR measurements in the solid-state. These measurements confirm that the ring-puckering movement of cations starts abruptly above the (IV → III) PT temperature. These measurements confirm that the ring-puckering movement of cations starts abruptly above the (IV → III) PT temperature. It appears that structural deformations of the crystal play a crucial role in the observed temperature-dependent photoluminescence and favour exciton self-trapping. Bluish triplet exciton emission is suggested by the relatively long photoluminescence lifetimes.
4. Experimental
4.1. Synthesis
3 g of CdCO3 was suspended in deionized water, and then concentrated hydrochloric acid was added dropwise to the solution until completely dissolved. Next, azetidine (Sigma-Aldrich, 98%, 1 g) was added in part to the solution placed in an ice bath. If necessary, a few drops of the appropriate acid were added. By slow evaporation at room temperature, white-transparent crystals of AZECdCl3:[C3H8N]CdCl3 in the shape of the block were obtained (see Fig. 11). The composition of the compound was confirmed by elemental analysis to be C: 13.2% (theor. 13.01%), N: 5.01% (theor. 5.06), H 2.96% (theor. 2.91). A powder X-ray diffraction verified the phase purity (see Fig. S15, ESI†). XRD patterns were recorded in the range of 2θ = 5–80° with the step 2θ = 0.024° and 1 s counting time using a D8 Advance X-ray Diffractometer from Bruker. The Ni-filtered Cu Kα1 radiation (λ = 1.540596 Å) from a Cu X-ray tube was applied. | ||
| Fig. 11 Single crystals of AZECdCl3 crystallized from aqueous solutions. | ||
4.3. Crystal structure determination
The single crystals of AZECdCl3 were mounted on a CCD Xcalibur, Sapphire2 diffractometer (graphite monochromatic, Mo Kα radiation, λ = 0.71073 Å). The measurements have been performed at 220.0(1), 185.0(1) and 100.0(1) K. The corrections to the Lorentz, polarisation factors and absorption were applied to the reflection intensities.59 The structures were solved by direct methods applying the SHELX program package.60 The hydrogen atoms were determined from the geometric concepts and refined in a riding model with isotropic temperature factors of 1.2 times the Ueq value of the parent atom. All non-hydrogen atoms were located from the difference Fourier synthesis and refined by the least-squares method in the full-matrix anisotropic approximation. The crystallographic data for the compound and details of the X-ray experiment are collected in Table S1 (ESI†). Crystal structure figures were constructed using Mercury61 software. CCDC 2107086–2107088.†4.4. Electrical measurements
Electrical measurements were performed on the crystallographically oriented crystal. Single crystals were cut perpendicularly to the (a) a-axis (S = 4 mm2, d = 1.1 mm), (b) b-axis (S = 16 mm2, d = 0.82 mm), and (c) c-axis (S = 4 mm2, d = 0.7 mm). The complex dielectric permittivity was measured between 150 and 300 K using an Agilent E4980A Precision LCR Meter in the frequency range of 135 Hz–2 MHz. The temperature was stabilized and controlled using an INSTEC STC200. The electric measurements were carried out in a controlled nitrogen atmosphere. The pyroelectric properties were tested with a Keithley 6517D electrometer/high resistance meter between 180 and 300 K, with a temperature ramp of 2 K min−1. The ferroelectric hysteresis loop single crystals cut in directions perpendicular to the c-axis were obtained by using a Sawyer–Tower circuit Precision Premier II (Radiant Technologies, Inc.). The surfaces of the crystal were coated with silver conductive paint (Electron Microscopy Sciences, 503).4.5. Temperature-resolved second-harmonic generation (TR-SHG) and Kurtz–Perry study
TR-SHG studies and the Kurtz–Perry test were performed using a Coherent Astrella Ti:sapphire regenerative amplifier. This laser delivers 800 nm pulses of ∼75 fs length and operates at a repetition rate of 1 kHz. The single crystals of AZECdCl3 and potassium dihydrogen phosphate (KDP, used as a reference for the Kurtz–Perry test) were crushed with a spatula and sieved through a mini-sieve set (Aldrich), obtaining a microcrystal size fraction of 125–177 μm. Next, size-graded samples were fixed between microscope glass slides (forming tightly packed layers), sealed, and mounted to the sample holder. The laser beam was directed onto a sample at 45° and was unfocused. Signal-collecting optics, mounted to the glass optical fiber, was placed perpendicularly to the plane of the sample (backscattering geometry). Scattered pumping radiation was suppressed with the use of a 700 nm short-pass dielectric filter (FESH0700, Thorlabs). All emission spectra were recorded using an Ocean Optics Flame T spectrograph.The TR-SHG study (145–220 K with 2–3 K step) was conducted using an 800 nm unfocused beam, a mean power of 670 mW and an irradiation area of 0.7 cm2. Temperature switching of SHG was performed by setting the temperature at 155 K and 167 K in an alternate manner, and at these temperature points the AZECdCl3 sample was irradiated using the same beam parameters as were used for the TR-SHG study. Temperature control of the sample was performed using a Linkam LTS420 heating/freezing stage.
4.6. Computational methods
Total-energy calculations were performed using a plane-wave basis set defined by the energy cut-off up to 500 eV coupled with Troullier–Martins type pseudopotentials62 and dense Monkhorst–Pack k-point meshes.63 Density functionals selected for the calculations are PBE (Perdew–Burke–Ernzerhof)64 and LDA,65 as implemented in the Abinit software suite.66,67 The Berry phase method was used to calculate spontaneous polarisation.37,38 A similar approach was successfully adopted to study the spontaneous polarisation in organic–inorganic hybrids (pyrrolidinium)3[Sb2Cl9]68 and (pyrrolidinium)2Cd2I611. For further details see the ESI.†4.7. 1H NMR measurements
The spin–lattice relaxation time T1 was measured using an ELLAB TEL-Atomic PS 15 spectrometer working at 25 MHz from 85 K to 380 K. The T1 relaxation times were determined using a saturation recovery method. Errors of the measured T1 values were estimated to be lower than 5%. The measurements of the proton NMR line second moment were carried out with a wide-line ELLAB TEL-Atomic CW Spectrometer operating at 26.8 MHz from 116 K to 340 K. The second moment values M2 were calculated by numeral integration of the first derivative of an absorption line and corrected for the finite modulation amplitude. The temperature of the sample was automatically controlled using an UNIPAN 660 temperature unit with a Pt-100 sensor. The powdered sample of AZECdCl3 was degassed under a pressure of 10−5 Torr and sealed in glass ampoules.4.8. Photoluminescence
Photoluminescence excitation (PLE) and emission (PL) spectra, as well as millisecond lifetime curves, were recorded with an FLS 980 Spectrofluorimeter from Edinburgh Instruments equipped with a 450 W Xe (continuous excitation) and 60 W pulse Xe lamp. The solid-state sample was mounted with silver glue on the copper holder of a closed-cycle helium cryostat from Lake Shore Cryotronics, Inc. All spectra were recorded in the 15–300 K temperature range with a 50 K step using a Hamamatsu R928P photomultiplier cooled to −20 °C and operating in the range of 200–850 nm. TMS302-X single grating excitation and emission monochromators of 30 cm focal lengths were used. The spectral resolution of all measurements was 0.3 nm. Nanosecond decay kinetic curves were obtained with the use of the EPLED-280 pulse laser (280 nm excitation) and an F-G05 low-noise Hamamatsu H5773-04 photomultiplier.Author contributions
The manuscript was written through contributions from all authors. All authors have given approval to the final version of the manuscript. These authors contributed equally.Conflicts of interest
There are no conflicts to declare.Acknowledgements
This research project is supported by two grants from the “Excellence initiative – Research University” program for years 2020–2026 for University of Wrocław (BPIDUB.4610.24.2021.KP.B and Open Access: BPIDUB.4610.98.2022.KG). A. B. would like to acknowledge Wrocław Center for Networking and Supercomputing (WCSS) for a grant of computer time. J. K. Z. acknowledges Academia Iuvenum, Wroclaw University of Science and Technology for their support.Notes and references
- W. Li, Z. Wang, F. Deschler, S. Gao, R. H. Friend and A. K. Cheetham, Nat. Rev. Mater., 2017, 23(2), 1–18 CAS.
- L. W. Martin and A. M. Rappe, Nat. Rev. Mater., 2016, 22(2), 1–14 Search PubMed.
- A. Piecha-Bisiorek, A. Białońska, R. Jakubas, P. Zieliński, M. Wojciechowska and M. Gałązka, Adv. Mater., 2015, 27, 5023–5027 CrossRef CAS PubMed.
- Y. Zhang, Y. Liu, H. Y. Ye, D.-W. Fu, W. Gao, H. Ma, Z. Liu, Y. Liu, W. Zhang, J. Li, G.-L. Yuan and R. G. Xiong, Angew. Chemie Int. Ed., 2014, 53, 5064–5068 CrossRef CAS PubMed.
- W. Zhang and R. G. Xiong, Chem. Rev., 2011, 112, 1163–1195 CrossRef PubMed.
- N. Leblanc, N. Mercier, L. Zorina, S. Simonov, P. Auban-Senzier and C. Pasquier, J. Am. Chem. Soc., 2011, 133, 14924–14927 CrossRef CAS PubMed.
- G. C. Xu, X. M. Ma, L. Zhang, Z. M. Wang and S. Gao, J. Am. Chem. Soc., 2010, 132, 9588–9590 CrossRef CAS PubMed.
- M. Šimenas, A. Kultaeva, S. Balčiunas, M. Trzebiatowska, D. Klose, G. Jeschke, M. M
![[a with combining cedilla]](https://www.rsc.org/images/entities/char_0061_0327.gif) czka, J. Banys and A. Pöppl, J. Phys. Chem. C, 2017, 121, 16533–16540 CrossRef.
czka, J. Banys and A. Pöppl, J. Phys. Chem. C, 2017, 121, 16533–16540 CrossRef. - Y. Zhang, H. Y. Ye, W. Zhang and R. G. Xiong, Inorg. Chem. Front., 2014, 1, 118–123 RSC.
- Z. X. Wang, Y. Zhang, Y. Y. Tang, P. F. Li and R. G. Xiong, J. Am. Chem. Soc., 2019, 141, 4372–4378 CrossRef CAS PubMed.
- M. Rok, B. Zarychta, A. Bil, J. Trojan-Piegza, W. Medycki, A. Miniewicz, A. Piecha-Bisiorek, A. Ciżman and R. Jakubas, J. Mater. Chem. C, 2021, 9, 7665–7676 RSC.
- M. Rok, P. Starynowicz, A. Ciżman, J. K. Zaręba, A. Piecha-Bisiorek, G. Bator and R. Jakubas, Inorg. Chem., 2020, 59, 11986–11994 CrossRef CAS PubMed.
- P. F. Li, W. Q. Liao, Y. Y. Tang, H. Y. Ye, Y. Zhang and R. G. Xiong, J. Am. Chem. Soc., 2017, 139, 8752–8757 CrossRef CAS PubMed.
- L. Zhou, P. P. Shi, X. M. Liu, J. C. Feng, Q. Ye, Y. F. Yao, D. W. Fu, P. F. Li, Y. M. You, Y. Zhang and R. G. Xiong, NPG Asia Mater., 2019, 11, 15 CrossRef CAS.
- K. Gesi, J. Phys. Soc. Jpn., 1990, 59, 432–434 CrossRef CAS.
- H. Y. Ye, Y. Zhang, D. W. Fu and R. G. Xiong, Angew. Chem., Int. Ed., 2014, 53, 11242–11247 CrossRef CAS PubMed.
- W. J. Xu, C. T. He, C. M. Ji, S. L. Chen, R. K. Huang, R. B. Lin, W. Xue, J. H. Luo, W. X. Zhang and X. M. Chen, Adv. Mater., 2016, 28, 5886–5890 CrossRef CAS PubMed.
- Y. Y. Tang, Y. Ai, W. Q. Liao, P. F. Li, Z. X. Wang and R. G. Xiong, Adv. Mater., 2019, 31, 1–6 Search PubMed.
- S. Deswal, S. K. Singh, R. Pandey, P. Nasa, D. Kabra, B. Praveenkumar, S. Ogale and R. Boomishankar, Chem. Mater., 2020, 32, 8333–8341 CrossRef CAS.
- S. Deswal, S. K. Singh, P. Rambabu, P. Kulkarni, G. Vaitheeswaran, B. Praveenkumar, S. Ogale and R. Boomishankar, Chem. Mater., 2019, 31, 4545–4552 CrossRef CAS.
- V. Jella, S. Ippili, J. H. Eom, S. V. N. Pammi, J. S. Jung, V. D. Tran, V. H. Nguyen, A. Kirakosyan, S. Yun, D. Kim, M. R. Sihn, J. Choi, Y. J. Kim, H. J. Kim and S. G. Yoon, Nano Energy, 2019, 57, 74–93 CrossRef CAS.
- Y. Hu, L. You, B. Xu, T. Li, S. A. Morris, Y. Li, Y. Zhang, X. Wang, P. S. Lee, H. J. Fan and J. Wang, Nat. Mater., 2021, 20, 612–617 CrossRef CAS PubMed.
- R. Guo, Y. Guo, H. Duan, H. Li and H. Liu, ACS Appl. Mater. Interfaces, 2017, 9, 8271–8279 CrossRef CAS PubMed.
- H. Van Ngoc and D. Joon Kang, Nanoscale, 2016, 8, 5059–5066 RSC.
- S.-H. Shin, Y.-H. Kim, M. H. Lee, J.-Y. Jung and J. Nah, ACS Nano, 2014, 8, 2766–2773 CrossRef CAS PubMed.
- K.-I. Park, J. Hwan Son, G.-T. Hwang, C. Kyu Jeong, J. Ryu, M. Koo, I. Choi, S. Hyun Lee, M. Byun, Z. Lin Wang, K. Jae Lee, K. Park, J. H. Son, G. Hwang, C. K. Jeong, M. Koo, I. Choi, S. H. Lee, M. Byun, K. J. Lee, J. Ryu and Z. L. Wang, Adv. Mater., 2014, 26, 2514–2520 CrossRef CAS PubMed.
- R. T. Williams and K. S. Song, J. Phys. Chem. Solids, 1990, 51, 679–716 CrossRef CAS.
- D. Cortecchia, J. Yin, A. Petrozza and C. Soci, J. Mater. Chem. C, 2019, 7, 4956–4969 RSC.
- K. Robinson, G. V. Gibbs and P. H. Ribbe, Science, 1971, 172, 567–570 CrossRef CAS PubMed.
- M. Rok, A. Ciżman, B. Zarychta, J. K. Zaręba, M. Trzebiatowska, M. Mączka, A. Stroppa, S. Yuan, A. E. Phillips and G. Bator, J. Mater. Chem. C, 2020, 8, 17491–17501 RSC.
- J.-X. Gao, X.-N. Hua, X.-G. Chen and W.-Q. Liao, J. Mater. Chem. C, 2019, 5348, 5348 RSC.
- X. Liu, C. Ji, Z. Wu, L. Li, S. Han, Y. Wang, Z. Sun and J. Luo, Chem. – Eur. J., 2019, 25, 2610–2615 CrossRef CAS PubMed.
- J. Zhang, S. Han, X. Liu, Z. Wu, C. Ji, Z. Sun and J. Luo, Chem. Commun., 2018, 54, 5614–5617 RSC.
- Z. Wu, X. Liu, C. Ji, L. Li, S. Wang, Z. Sun, W. Zhang, Y. Peng and J. Luo, J. Mater. Chem. C, 2018, 6, 9532–9536 RSC.
- L. Xu, J. X. Gao, X. G. Chen, X. N. Hua and W. Q. Liao, Dalton Trans., 2018, 47, 16995–17003 RSC.
- K. Yoshimitsu and T. Matsubara, Prog. Theor. Phys. Suppl., 1968, E68, 109–136 CrossRef.
- D. Vanderbilt and R. D. King-Smith, Phys. Rev. B, 1993, 48, 4442–4455 CrossRef CAS PubMed.
- R. D. King-Smith and D. Vanderbilt, Phys. Rev. B, 1993, 47, 1651–1654 CrossRef CAS PubMed.
- P. Szklarz, J. Zaleski, R. Jakubas, G. Bator, W. Medycki and K. Falińska, J. Phys.: Condens. Matter, 2005, 17, 2509 CrossRef CAS.
- A. Piecha, R. Jakubas, A. Pietraszko, J. Baran, W. Medycki and D. Kruk, J. Solid State Chem., 2009, 182, 2949–2960 CrossRef CAS.
- N. Bloembergen, E. M. Purcell and R. V. Pound, Phys. Rev., 1948, 73, 679–712 CrossRef CAS.
- T. Asaji, Bull. Chem. Soc. Jpn., 2021, 94, 1659–1663 CrossRef CAS.
- S. Kawabata, M. Kitaura and H. Nakagawa, Phys. Status Solidi C Conf., 2005, 2, 53–56 CrossRef CAS.
- H. Matsumoto and H. Nakagawa, J. Lumin., 1979, 18/19, 19–22 CrossRef.
- A. Yangui, S. Pillet, E. E. Bendeif, A. Lusson, S. Triki, Y. Abid and K. Boukheddaden, ACS Photonics, 2018, 5, 1599–1611 CrossRef CAS.
- Z. Qi, Y. Chen, Y. Guo, X. Yang, F. Q. Zhang, G. Zhou and X. M. Zhang, J. Mater. Chem. C, 2021, 9, 88–94 RSC.
- L. Mao, Y. Wu, C. C. Stoumpos, B. Traore, C. Katan, J. Even, M. R. Wasielewski and M. G. Kanatzidis, J. Am. Chem. Soc., 2017, 139, 11956–11963 CrossRef CAS PubMed.
- G. E. Wang, G. Xu, M. S. Wang, L. Z. Cai, W. H. Li and G. C. Guo, Chem. Sci., 2015, 6, 7222–7226 RSC.
- M. D. Smith and H. I. Karunadasa, Acc. Chem. Res., 2018, 51, 619–627 CrossRef CAS PubMed.
- C. Zhou, H. Lin, H. Shi, Y. Tian, C. Pak, M. Shatruk, Y. Zhou, P. Djurovich, M. H. Du and B. Ma, Angew. Chem., Int. Ed., 2018, 57, 1021–1024 CrossRef CAS PubMed.
- H. Nakagawa, K. Hayashi and H. Matsumoto, J. Phys. Soc. Jpn., 1977, 43, 1655–1663 CrossRef CAS.
- E. R. Dohner, A. Jaffe, L. R. Bradshaw and H. I. Karunadasa, J. Am. Chem. Soc., 2014, 136, 13154–13157 CrossRef CAS PubMed.
- L. Mao, Y. Wu, C. C. Stoumpos, M. R. Wasielewski and M. G. Kanatzidis, J. Am. Chem. Soc., 2017, 139, 5210–5215 CrossRef CAS PubMed.
- A. Yangui, D. Garrot, J. S. Lauret, A. Lusson, G. Bouchez, E. Deleporte, S. Pillet, E. E. Bendeif, M. Castro, S. Triki, Y. Abid and K. Boukheddaden, J. Phys. Chem. C, 2015, 119, 23638–23647 CrossRef CAS.
- J. I. Fujisawa and T. Ishihara, Phys. Rev. B: Condens. Matter Mater. Phys., 2004, 70, 1–6 Search PubMed.
- S. Liu, X. Fang, B. Lu and D. Yan, Nat. Commun., 2020, 11, 1–9 Search PubMed.
- A. Yangui, S. Pillet, A. Mlayah, A. Lusson, G. Bouchez, S. Triki, Y. Abid and K. Boukheddaden, J. Chem. Phys., 2015, 143, 224201 CrossRef CAS PubMed.
- A. Yangui, S. Pillet, D. Garrot, S. Triki, Y. Abid and K. Boukheddaden, J. Appl. Phys., 2015, 117, 115503 CrossRef.
- CrysAlis RED, CrysAlis CCD,Oxford Diffraction, Oxford Diffraction Ltd, Abingdon, England, 2008.
- G. M. Sheldrick, Acta Crystallogr., Sect. C: Struct., Chem., 2015, 71, 3–8 Search PubMed.
- C. F. MacRae, I. Sovago, S. J. Cottrell, P. T. A. Galek, P. McCabe, E. Pidcock, M. Platings, G. P. Shields, J. S. Stevens, M. Towler and P. A. Wood, J. Appl. Crystallogr., 2020, 53, 226–235 CrossRef CAS PubMed.
- N. Troullier and J. L. Martins, Phys. Rev. B, 1991, 43, 8861–8869 CrossRef PubMed.
- H. J. Monkhorst and J. D. Pack, Phys. Rev. B, 1976, 13, 5188–5192 CrossRef.
- J. Perdew, K. Burke and M. Ernzerhof, Phys. Rev. Lett., 1996, 77, 3865–3868 CrossRef CAS PubMed.
- D. M. Ceperley and B. J. Alder, Phys. Rev. Lett., 1980, 45, 566–569 CrossRef CAS.
- X. Gonze, J. M. Beuken, R. Caracas, F. Detraux, M. Fuchs, G. M. Rignanese, L. Sindic, M. Verstraete, G. Zerah, F. Jollet, M. Torrent, A. Roy, M. Mikami, P. Ghosez, J. Y. Raty and D. C. Allan, Comput. Mater. Sci., 2002, 25, 478–492 CrossRef.
- X. Gonze, F. Jollet, F. Abreu Araujo, D. Adams, B. Amadon, T. Applencourt, C. Audouze, J. M. Beuken, J. Bieder, A. Bokhanchuk, E. Bousquet, F. Bruneval, D. Caliste, M. Cote, F. Dahm, F. Da Pieve, M. Delaveau, M. Di Gennaro, B. Dorado, C. Espejo, G. Geneste, L. Genovese, A. Gerossier, M. Giantomassi, Y. Gillet, D. R. Hamann, L. He, G. Jomard, J. Laflamme Janssen, S. Le Roux, A. Levitt, A. Lherbier, F. Liu, I. Lukačević, A. Martin, C. Martins, M. J. T. Oliveira, S. Ponce, Y. Pouillon, T. Rangel, G. M. Rignanese, A. H. Romero, B. Rousseau, O. Rubel, A. A. Shukri, M. Stankovski, M. Torrent, M. J. Van Setten, B. Van Troeye, M. J. Verstraete, D. Waroquiers, J. Wiktor, B. Xu, A. Zhou and J. W. Zwanziger, Comput. Phys. Commun., 2016, 205, 106–131 CrossRef CAS.
- M. Wojciechowska, A. Gagor, A. Piecha-Bisiorek, R. Jakubas, A. Cizman, J. K. Zaręba, M. Nyk, P. Zieliński, W. Medycki and A. Bil, Chem. Mater., 2018, 30, 4597–4608 CrossRef CAS.
Footnote |
| † Electronic supplementary information (ESI) available: TGA-DTA results, crystallographic data, hydrogen bonding interaction data, computational data and results from dielectric measurements. CCDC 2107086–2107088. For ESI and crystallographic data in CIF or other electronic format see DOI: 10.1039/d1tc05355h |
| This journal is © The Royal Society of Chemistry 2022 |