Harnessing near-infrared light via S0 to T1 sensitizer excitation in a molecular photon upconversion solar cell†
Drake
Beery‡
 ,
Ashley
Arcidiacono‡
,
Jonathan P.
Wheeler
,
Ashley
Arcidiacono‡
,
Jonathan P.
Wheeler
 ,
Jiaqi
Chen
and
Kenneth
Hanson
 *
*
Department of Chemistry & Biochemistry, Florida State University, Tallahassee, Florida 32306, USA. E-mail: hanson@chem.fsu.edu
First published on 28th February 2022
Abstract
Integrating molecular photon upconversion via triplet–triplet annihilation (TTA-UC) directly into a solar cell offers a means of harnessing sub-bandgap, near infrared (NIR) photons and surpassing the Shockley–Queisser limit. However, all integrated TTA-UC solar cells to date only harness visible light. Here, we incorporate an osmium polypyridal complex (Os) as the triplet sensitizer in a metal ion linked multilayer photoanode that is capable of harnessing NIR light via S0 to T1* excitation, triple energy transfer to a phosphonated bis(9,10-diphenylethynyl)anthracene annihilator (A), TTA-UC, and electron injection into TiO2 from the upcoverted state. The TiO2-A-Zn-Os devices have five-fold higher photocurrent (∼3.5 μA cm−2) than the sum of their parts. IPCE data and excitation intensity dependent measurements indicate that the NIR photons are harvested through a TTA-UC mechanism. Transient absorption spectroscopy is used to show that the low photocurrent, as compared to visible light harnessing TTA-UC solar cells, can be atributed to: (1) slow sensitizer to annihilator triplet energy transfer, (2) a low injection yield for the annihilator, and (3) fast back energy transfer from the upconverted state to the sensitizer. Regardless, these results serve as a proof-of-concept that NIR photons can be harnessed via an S0 to T1* sensitizer excited, integrated TTA-UC solar cell and that further improvements can readily be made by remedying the performance limiting processes noted above.
Introduction
Solar energy conversion is a critical approach for meeting ever growing energy demands and mitigating the effects of anthropomorphic climate change. Consequently, there is a continuing push to reduce costs and increase solar cell efficiencies. Accounting for the optimum balance between thermalization, transmission, and other losses, the maximum theoretical efficiency for a single-junction solar cell is ∼33% (a.k.a., the Shockley–Queisser limit).1 A promising strategy to surpass this limit is to harness the transmitted, low energy photons using photon upconversion via triplet–triplet annihilation (TTA-UC).2 TTA-UC combines two, low energy photons to generate one higher energy excited state and can be achieved even under low intensity, non-coherent irradiation.3 Theoretical analyses indicate that if harnessed in a solar cell TTA-UC could increase the maximum efficiency limit to >43%.4TTA-UC can be harnessed in a solar cell using either optically5–9 or electronically coupled schemes.10–17 The latter relies on incorporating sensitizer and annihilator molecules directly into the solar cell and has achieved photocurrent enhancements up to 0.315 mA cm−2.18 While a promising proof of concept, all electronically coupled TTA-UC solar cells to date absorb visible light (i.e., <700 nm). To maximize the utility of TTA-UC, it is necessary to upconvert and harness near infrared (NIR) photons (i.e., >700 nm).4 It has been estimated that upconverting photons from 800–1000 nm and harnessing them at a 20% photon to current efficiency could increase the short circuit current (Jsc) and power conversion efficiencies (PCE) of record solar cells by ∼2.5 mA and ∼2 percentage points, respectively.19
Near infrared to visible TTA-UC requires the appropriate annihilator and sensitizer pair with the latter absorbing at >700 nm.20–22 Molecules that exhibit direct S0 to T1* excitation are particularly intriguing as sensitizers because they not only exhibit low energy absorption but also circumvent energy losses associated with intersystem crossing from S1* to T1*.20 Although a spin forbidden process, S0 to T1* absorption is common in osmium(II) containing polypyridyl complexes which has been applied as a sensitizer in both dye-sensitized solar cells (DSSCs),23,24 and TTA-UC.25–27 One fundamental limitation with these sensitizers is that the same heavy atom effect that enables the S0 to T1* transition also results in a relatively short triplet excited state lifetime, typically <10 ns, that hinders diffusion limited triplet energy transfer necessary for TTA-UC.
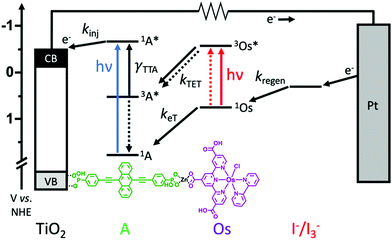
Here we incorporate NIR absorbing Os(II) complexes into metal oxide bound, metal ion linked molecular multilayers28–30 with the goal of overcoming diffusion limited triplet energy transfer dynamics and generating an integrated TTA-UC solar cell. The device architecture and energetics are depicted in Fig. 1. The photoanode is composed of mesoporous TiO2, a phosphonated annihilator molecule (A), a zinc linking ion, and carboxylated osimum(II) polypyridyl sensitizers (Os). As shown in Fig. 1, the proposed mechanism is S0 to T1* absorption by Os, 3Os* to A triplet energy transfer (kTET), TTA, and electron injection from 1A* (kinj). Herein we show that device measurements support a TTA-UC photocurrent generation mechanism, but the performance (∼3.5 μA cm−2) is lower than previous integrated TTA-UC solar cells. Using time-resolved spectroscopy we demonstrate that the low performance can be attributed to a combination of slow TET and low electron injection yield due to competitive back energy transfer from 1A* to Os.
Experimental section
Materials and methods
Zinc acetate dihydrate (Alfa Aesar), 1-butyl-3-methylimidazolium (Sigma-Aldrich), iodine (Sigma-Aldrich), 4-tert-butylpyridine (Sigma-Aldrich), H2PtCl6 (Alfa Aesar), and polyethylene glycol bisphenol A epichlorohydrin copolymer (Sigma-Aldrich) were purchased from their respective suppliers, in parenthesis, and used as received. ((anthracene-9,10-diylbis(ethyne-2,1-diyl))bis(4,1-phenylene))bis(phosphonic acid) (A), [Os(H3tcterpy)(bpy)Cl]PF6 (Os),23 triphenyl-4,4′-diphosphonic acid (B),31 and TiO2/ZrO2 sol-gels32 were synthesized according to previous procedures with any modifications described in the ESI.† All other reagents and solvents (analytical reagent grade) were purchased and used without further purification from Sigma-Aldrich. Fluorine-doped tin oxide (FTO) coated glass (sheet resistance 15 Ω □−1) was purchased from Hartford Glass Co. Meltonix film (1170-25) and Vac’n Fill Syringe (65209) were purchased from Solaronix. Micro glass cover slides (18 × 18 mm) were obtained from VWR.Device assembly
TiO2 films were cast using the doctor blade method (3 M ScotchTM tape) onto a FTO-glass substrate then sintered in an oven at 500 °C for 15 min.10 The resulting films were then immersed into a 1 mM or 200 μM solution of A or B, respectively in DMSO for 48 hours then rinsed with methanol and dried under a stream of air. Next, the films were immersed into a 0.5 μM solution of Zn(CH3COO)2 in MeOH for 3 hours then rinsed with MeOH and dried. Following this, the films were immersed in a 1 mM solution of Os in a 1![[thin space (1/6-em)]](https://www.rsc.org/images/entities/char_2009.gif) :
:![[thin space (1/6-em)]](https://www.rsc.org/images/entities/char_2009.gif) 1 mixture of tert-butanol and MeCN for 24 hours23 then rinsed with MeOH and dried. The resulting films were etched to a 1 × 1 cm active area and used as the anode. The Pt cathode was prepared by drop-casting H2PtCl6 solution in ethanol (50 μL, 5 mM) that was heat-dried at 400 °C for 20 min. The films were then sealed together using Melatonix thermoplastic at 150 °C using a home built pressure and heating apparatus.33 The sandwiched cells were then transferred to a glovebox where dry and oxygen free MeCN containing 0.1 M BMII/0.01 M I2/0.1 M TBP was injected using a Vac’n Fill Syringe (Solaronix) and solvent injection hole was sealed using thermoplastic and a small glass cover slip heated with a soldering iron.
1 mixture of tert-butanol and MeCN for 24 hours23 then rinsed with MeOH and dried. The resulting films were etched to a 1 × 1 cm active area and used as the anode. The Pt cathode was prepared by drop-casting H2PtCl6 solution in ethanol (50 μL, 5 mM) that was heat-dried at 400 °C for 20 min. The films were then sealed together using Melatonix thermoplastic at 150 °C using a home built pressure and heating apparatus.33 The sandwiched cells were then transferred to a glovebox where dry and oxygen free MeCN containing 0.1 M BMII/0.01 M I2/0.1 M TBP was injected using a Vac’n Fill Syringe (Solaronix) and solvent injection hole was sealed using thermoplastic and a small glass cover slip heated with a soldering iron.
Characterization
Results & discussion
Multilayer assembly
The photoanode in these devices is composed of nanocrystalline TiO2, ((anthracene-9,10-diylbis(ethyne-2,1-diyl))bis(4,1-phenylene))bis(phosphonic acid) (A), Zn2+ linking ions, and [Os(H3tcterpy)(bpy)Cl]PF6 (Os) as depicted in Fig. 1. A was chosen as the annihilator molecule because the parent 9,10-bis(phenylethynyl)anthracene,10,36 is known to facilitate TTA and also has sufficient potential for electron injection into the conduction band of TiO2 (−0.5 V vs. NHE)37 from the singlet (1A*/A+ = −0.64 V) but not triplet (3A*/A+ = −0.15 V) excited state.10 Phosphonate binding groups were chosen for A because they exhibit greater surface stability than COOH,38 and will prevent competitive desorption during subsequent loading steps. A was synthesized in five steps using slight variations of known procedures38–41 with details provided in the ESI.†Os was selected as the sensitizer because it is a known NIR absorbing dye, it has COOH binding groups, and has been used as the triplet sensitizer for TTA-UC.23,25 Additionally, the triplet excited state energy of Os (∼1.3 eV) is sufficient for favourable triplet energy transfer to A (1.2 eV).36
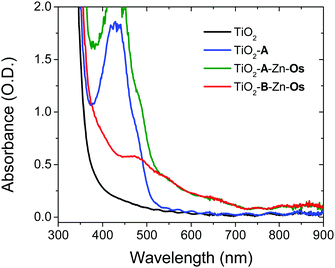
The films were prepared by a stepwise soaking procedure and monitored with UV-Vis (Fig. 2) and ATR-IR (Fig. S4, ESI†) spectroscopy. First, the ∼4 μm thick nanocrystalline TiO2 film was submerged in a 1 mM solution of A in DMSO for 48 h, followed by a 0.5 μM solution of Zn(OAc)2 in MeOH for 3 h, and finally a 1 mM solution of Os in a 1![[thin space (1/6-em)]](https://www.rsc.org/images/entities/char_2009.gif) :
:![[thin space (1/6-em)]](https://www.rsc.org/images/entities/char_2009.gif) 1 mixture of tert-butanol and acetonitrile. As can be seen in Fig. 2, the absorption spectrum of the bilayer film is the summed contribution of each chromophore. From spectral deconvolution, surface coverages of 175 nmol cm−2 and 25 nmol cm−2 were determined for A and Os, respectively, giving an ∼7
1 mixture of tert-butanol and acetonitrile. As can be seen in Fig. 2, the absorption spectrum of the bilayer film is the summed contribution of each chromophore. From spectral deconvolution, surface coverages of 175 nmol cm−2 and 25 nmol cm−2 were determined for A and Os, respectively, giving an ∼7![[thin space (1/6-em)]](https://www.rsc.org/images/entities/char_2009.gif) :
:![[thin space (1/6-em)]](https://www.rsc.org/images/entities/char_2009.gif) 1 annihilator to sensitizer ratio (see the ESI† for details). In the absence of Zn2+ treatment, no Os loading was observed on TiO2-A (Fig. S6, ESI†) indicating that the above procedure results in a multilayer structure (TiO2-A-Zn-Os) and not simply a co-deposited film.
1 annihilator to sensitizer ratio (see the ESI† for details). In the absence of Zn2+ treatment, no Os loading was observed on TiO2-A (Fig. S6, ESI†) indicating that the above procedure results in a multilayer structure (TiO2-A-Zn-Os) and not simply a co-deposited film.
The films were incorporated into a standard sandwich DSSC architecture with TiO2-dye as the photoanode, Pt coated FTO glass as the cathode, and I−/I3− as the redox mediator (0.1 M BMII/0.01 M I2/0.1 M TBP in acetonitrile). For comparative purposes, a series of devices were prepared with photoanodes composed of anthracene only (TiO2-A), the A-Zn-Os bilayer (TiO2-A-Zn-Os) and a sensitizer only bilayer (TiO2-B-Zn-Os). For the latter device, the photophysical and electrochemically inert triphenyl-4,4′-diphosphonic acid bridging molecule (B) was used as a means of mimicking the spatial separation between Os and TiO2 in the bilayer but without concerns of light absorption or energy/electron transfer to B.34
Photovoltaic characterization
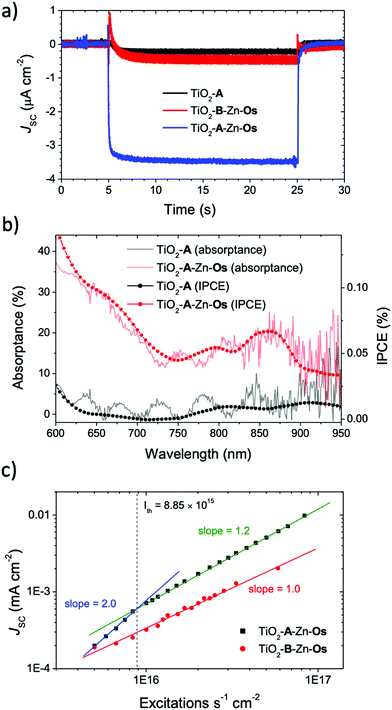
The short circuit photocurrent density (Jsc) was measured under solar irradiance (AM1.5) and the results are shown in Fig. 3a. A 570 nm long pass filter was used to selectively excite the Os sensitizer and avoid direct excitation and electron injection from A. Under these conditions, less than 0.5 μA cm−2 photocurrent was observed from TiO2-A and TiO2-B-Zn-Os. In contrast, the TiO2-A-Zn-Os device generated a ∼3.5 μA cm−2 photocurrent which is an ∼5 fold increase in photocurrent compared to the sum of the individual components.The incident photon-to-current efficiency spectra (IPCE) of TiO2-A-Zn-Os (Fig. 3b) resembles its absorptance spectra with a broad low energy peak at ∼850 nm and photocurrent contribution out to at least 950 nm (i.e., the limit of our broad band light source). In contrast, nominal current was observed from TiO2-A and TiO2-B-Zn-Os further indicating that direct excitation and electron injection from Os is not a major contributor to the photocurrent. Consequently, IPCE measurements indicate that TiO2-A-Zn-Os enables the harnessing of NIR light via a cooperative photon to current generation process.
Further insights into the photocurrent generation mechanism by TiO2-B-Zn-Os and TiO2-A-Zn-Os were obtained with excitation intensity versus photocurrent density measurements. As can be seen in Fig. 3c, the sensitizer only control device (TiO2-B-Zn-Os) exhibited a linear response (slope = 1.0) throughout the entire intensity range which is consistent with direct excitation and electron injection from Os* into TiO2. In contrast, the TiO2-A-Zn-Os device exhibits a quadratic (slope = 2.0) to linear (slope ≈ 1.0) dependence when transitioning from low to high intensity excitation. This quadratic-to-linear behavior is consistent with a TTA-UC photocurrent generation mechanism.42,43
The intensity threshold between the quadratic and linear regimes, or Ith value, is the minimum excitation intensity necessary for TTA-UC to reach its maximum efficiency.43,44 For the TiO2-A-Zn-Os device under 635 nm excitation, the Ith value is 8.7 mW cm−2 (Fig. S11, ESI†) or in terms of excitations per second (i.e., photons s−1 cm−2 × absorptance) 8.85 × 10¹⁵ s−1 cm−2. To provide context, the integrated AM1.5 solar intensity from 570–1000 nm is 44.8 mW cm−2 or ∼10 mW cm−2 assuming an absorptance of 20%.
Collectively the above results indicate that in addition to the visible spectrum, the TiO2-A-Zn-Os device is harnessing nearIR light out to 900 nm and doing so through a TTA-UC photocurrent generation mechanism. However, the ∼3.5 μA cm−2 photocurrent is at least an order of magnitude lower than that obtained in the visible region.18 It is worth acknowledging that there is an approximately 50% decrease in solar intensity from 500 to 1000 nm but that alone cannot account for the decrease in performance.
Energy and electron transfer dynamics
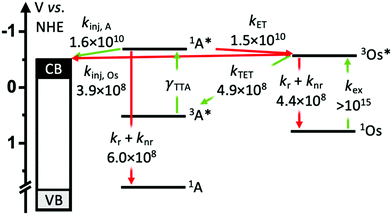
To gain insights into the rate and efficiency limiting processes in the TiO2-A-Zn-Os device we monitored event dynamics using transient absorption spectroscopy (TA). The results are shown in Fig. 5–7 with additional spectra provided in the ESI.† Due to experimental limitations, the excitation intensities for TA measurements (7 mJ cm−2 at 475 nm and 15 mJ cm−2 at 650 nm) are much higher than solar flux and thus are conducted in the linear TTA-UC regime. However, it has been previously shown that interlayer energy transfer and electron injection dynamics quantified below are largely independent of the number of excitation events.34 Biexcitonic processes like TTA are fluence dependent but were not monitored here.The productive and non-productive events of interest are depicted in Fig. 4 in green and red, respectively, and the species involved in each process are summarized in eqn (1)–(6).
| knr+r(Os): 3Os* → 1Os | (1) |
| kTET: 3Os* + 1A → 1Os + 3A* | (2) |
| kinj(Os): TiO2-B-Zn-3Os*→ TiO2(e−)-B-Zn-Os+ | (3) |
| knr+r(A): 1A* → 1A | (4) |
| kinj(A): TiO2-1A*→ TiO2(e−)-A+ | (5) |
| kET: 1A* + 1Os → 1A + 3Os* | (6) |
Following excitation, we presume that 3Os* can decay via three primary mechanisms. The first is via intrinsic radiative and non-radiative decay (knr+r(Os); eqn (1)). The transient absorption decay kinetics for Os in DMSO solution (i.e., in the absence of any quenching species) could be fit to a single exponential equation giving 1/τ = knr+r(Os) = 4.4 × 10⁸ s−1 (Fig. 5).
In the TiO2-A-Zn-Os bilayer film 3Os* can also decay via TET (eqn (2)) and electron injection into TiO2 (eqn (3)). To probe 3Os* to A triplet energy transfer we monitored the excited state decay of 3Os* at 500 nm in ZrO2-A-Zn-Os when only Os is excited (λex = 650 nm) and the results are shown in Fig. 5. ZrO2 was selected as the substrate for these measurements because in contrast to TiO2, its relatively high conduction band (>2.0 V vs. NHE)45 hinders excited state electron transfer to the metal oxide substrate so photophysical events can be quantified in the absence of electron injection (Fig. S12, ESI†). Thus, assuming that the only additional decay channel present in ZrO2-A-Zn-Os is TET,34 then kTET can be calculated using eqn (7):
 | (7) |
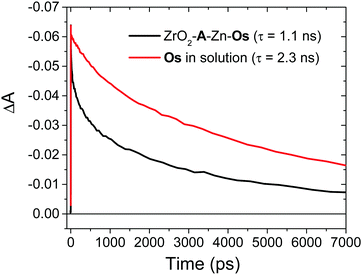 | ||
| Fig. 5 Transient absorption decay traces at 500 nm for Os in DMSO (red) and ZrO2-A-Zn-Os in MeCN (black). (λex = 650 nm). | ||
Excited state Osmium(II) polypyridyl complexes are also known to inject electrons into TiO2,23 albeit in the presence of Li+ which is known to lower the conduction band of TiO2 (Li+ is not present here).46 To probe electron injection dynamics (kinj(Os); eqn (3)) we monitored the decay of 3Os* in TiO2-B-Zn-Os (τOs(TiO2)) and the results are shown in Fig. S15 (ESI†). Assuming the only additional quenching pathway for 3Os* in TiO2-B-Zn-Os is electron injection, a kinj(Os) of 3.9 × 10⁸ s−1 was calculated using eqn (8):
 | (8) |
This electron injection rate is slower than kTET and knr+r(Os) giving an estimated injection yield of <25%.31 Additionally, the intensity dependent results in Fig. 3 suggests direct electron injection from 3Os* is not the preferred deactivation pathway. If it was significant, we would observe a slope of <2 in the low intensity regime for TiO2-A-Zn-Os and a higher photocurrent for TiO2-B-Zn-Os.
In the absence of electron injection, the 3Os* to A triplet energy transfer efficiency (ΦTET) can be calculated using eqn (9).
 | (9) |
A ΦTET of ∼50% suggests that at least half of the absorbed photon energy is being lost via emission (kr) and/or heat dissipation (knr) by 3Os*. Increasing the ΦTET would not only increase the Jsc contribution from TTA-UC but also lower the Ith value and the maximum efficiency onset.
3 Os* to A TET and then bimolecular TTA between two 3A* results in the formation of the upconverted 1A* state. In the absence of a quencher (i.e., for A in solution) 1A* decays via radiative and non-radiative pathways (knr+r(A); eqn (4)) with a lifetime of 1.6 ns and rate constant of 6.0 × 10⁸ s−1 (Fig. S16, ESI†). The spectra and kinetics for A in solution, as opposed to on ZrO2, were selected for the following analyses because although the time-resolved emission decays for both samples are similar (Fig. S2 and S17, ESI†) the former had a much better signal-to-noise ratio in the TA measurements.
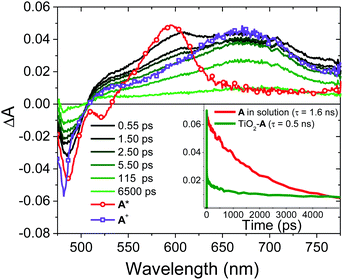
On TiO2, A has sufficient excited state potential for electron injection into the metal oxide substrate (kinj(A); eqn (5)).10 We probed the electron transfer dynamics for TiO2-A and the results are shown in Fig. 6. TiO2-A, as opposed to TiO2-A-Zn-Os, was selected for these measurements to allow for selective excitation and monitoring of A without simultaneous excitation of Os (Fig. 2). But previous results have shown that metal ion coordination and bilayer formation has minimal impact of the intrinsic photophysical properties of the first layer chromophore.47
In the early time slices we see a distinct peak at ∼600 nm that is consistent with the excited state absorption from 1A* in solution (red spectrum in Fig. 6). That feature rapidly decreases and a broad peak at ∼675 nm remains present beyond our ∼7 ns acquisition window which we attribute to the formation of the TiO2(e−)-A+ charge separated species. kinj(A) can then be calculated using eqn (10):
 | (10) |
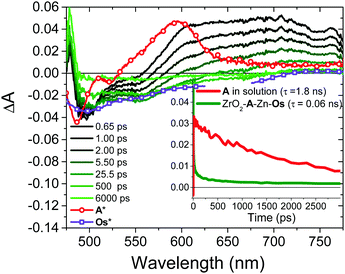
Back energy transfer from the upconverted singlet state of the annihilator to sensitizer (kET; eqn (6)) is a well-known, non-productive process in TTA-UC.19 To probe kET, we measured the excited state dynamics of ZrO2-A-Zn-Os following 475 nm excitation and the results are shown in Fig. 7.
Due to the broad absorption of Os (Fig. 2), it was not possible to selectively excite A so even at the earliest time slices we see a mixed contribution from both 3Os* and 1A* where the ground state bleach of the former below 600 nm offsets the excited state absorption of the latter in the same region. However, at 750 nm there is minimal contribution of 3Os* and thus 1A* can be preferentially monitored. A kET of 1.5 × 10¹⁰ s−1 was calculated using eqn (10):
 | (11) |
With the rate constants above, an electron injection yield for 1A* into TiO2 (Φinj(A)) can be calculated using eqn (12).
 | (12) |
The ∼50% injection yield can be directly attributed to back energy transfer being highly competitive with the electron injection rate. Consequently, at least half of the upconverted states transfer their energy back to Os prior to injection. While not an absolute loss pathway since it results in regeneration of 3Os*, one excited state was consumed during upconversion and the TTA-UC cycle must be re-initiated via TET.
Despite favorable driving force (Fig. 4), we saw no evidence of Os to A+ electron transfer occurring in the TiO2-A-Zn-Os film. While interlayer electron transfer has been observed,50 the increased distance and geometric constraint imparted by the metal ion linkage can also hinder electron transfer.48 Consequently, the post injection cation resides on A and is likely the site of regeneration where access by the mediator is still possible due to the lower surface coverage of Os relative to A (∼7![[thin space (1/6-em)]](https://www.rsc.org/images/entities/char_2009.gif) :
:![[thin space (1/6-em)]](https://www.rsc.org/images/entities/char_2009.gif) 1).15
1).15
Conclusions
In this study, we have incorporated an Osmium polypyridyl complex as the senstitizer in a metal ion linked multilayer on TiO2 for application as the photoanode in an integrated TTA-UC solar cell. Photocurrent, IPCE, and intensity dependent measurements indicate that direct S0 to T1* excitation of the osmium complex can be used to harness NIR light and generate photocurrent via TTA-UC. Although, the ∼3.5 μA cm−2 photocurrent contribution from TTA-UC is at least an order of magnitude lower than those typically obtained in the visible region. Based on transient absorption measurements the low performance can be attributed to: (1) slow sensitizer to annihilator triplet energy transfer, (2) a low injection yield for the annihilator, and (3) fast back energy transfer from the upconverted state to the sensitizer. Nonetheless, this work demonstrates that NIR, S0 to T1* excitation can be harnessed in an integrated TTA-UC solar cell (Jsc ≈ 3.5 μA cm−2) with a five-fold increase in photocurrent compared to the sum of its parts, but this is still well below device relevant photocurrent contributions (>100 μA cm−2).2 Further improvements can be readily achieved using (1) sensitizers with increased triplet excited state lifetimes, (2) an annihilator with increased driving force and decreased spatial separation between the chromophoric unit and the TiO2 surface for increased electron injection yields, and (3) a balance of driving force and distance between the sensitizer and annihilator molecule for maximized triplet energy transfer and minimized back, singlet energy transfer.Conflicts of interest
There are no conflicts to declare.Acknowledgements
This work was supported by the National Science Foundation under Grant No. DMR-1752782. Ultrafast transient absorption measurements were performed on a spectrometer supported by the National Science Foundation under Grant No. CHE-1919633. A portion of these measurements were conducted in the FSU Department of Chemistry & Biochemistry's Mass Spec (FSU075000-MASS), NMR (FSU075000NMR), and Materials Characterization (FSU075000MAC) Laboratories.Notes and references
- W. Shockley and H. J. Queisser, J. Appl. Phys., 1961, 32(3), 510–519 CrossRef CAS.
- D. Beery, T. W. Schmidt and K. Hanson, ACS Appl. Mater. Interfaces, 2021, 13(28), 32601–32605 CrossRef CAS PubMed.
- T. N. C. Singh-Rachford and N. Felix, Coord. Chem. Rev., 2010, 254(21–22), 2560–2573 CrossRef CAS.
- N. J. Ekins-Daukes and T. W. Schmidt, Appl. Phys. Lett., 2008, 93(6), 063507 CrossRef.
- Y. Y. Cheng, B. Fückel, R. W. MacQueen, T. Khoury, R. G. C. R. Clady, T. F. Schulze, N. J. Ekins-Daukes, M. J. Crossley, B. Stannowski, K. Lips and T. W. Schmidt, Energy Environ. Sci., 2012, 5(5), 6953–6959 RSC.
- T. F. Schulze, Y. Y. Cheng, B. Fückel, R. W. MacQueen, A. Danos, N. J. L. K. Davis, M. J. Y. Tayebjee, T. Khoury, R. G. C. R. Clady, N. J. Ekins-Daukes, M. J. Crossley, B. Stannowski, K. Lips and T. W. Schmidt, Aust. J. Chem., 2012, 65(5), 480–485 CrossRef CAS.
- T. F. Schulze, J. Czolk, Y.-Y. Cheng, B. Fückel, R. W. MacQueen, T. Khoury, M. J. Crossley, B. Stannowski, K. Lips, U. Lemmer, A. Colsmann and T. W. Schmidt, J. Phys. Chem. C, 2012, 116(43), 22794–22801 CrossRef CAS.
- Y. Y. Cheng, A. Nattestad, T. F. Schulze, R. W. MacQueen, B. Fückel, K. Lips, G. G. Wallace, T. Khoury, M. J. Crossley and T. W. Schmidt, Chem. Sci., 2016, 7(1), 559–568 RSC.
- A. Monguzzi, S. M. Borisov, J. Pedrini, I. Klimant, M. Salvalaggio, P. Biagini, F. Melchiorre, C. Lelii and F. Meinardi, Adv. Funct. Mater., 2015, 25(35), 5617–5624 CrossRef CAS.
- C. Simpson, T. M. Clarke, R. W. MacQueen, Y. Y. Cheng, A. J. Trevitt, A. J. Mozer, P. Wagner, T. W. Schmidt and A. Nattestad, Phys. Chem. Chem. Phys., 2015, 17(38), 24826–24830 RSC.
- T. Morifuji, Y. Takekuma and M. Nagata, ACS Omega, 2019, 4(6), 11271–11275 CrossRef CAS PubMed.
- S. Ahmad, J. Liu, C. Gong, J. Zhao and L. Sun, ACS Appl. Energy Mater., 2018, 1(2), 249–253 CrossRef CAS.
- S. P. Hill, T. Dilbeck, E. Baduell and K. Hanson, ACS Energy Lett., 2016, 1(1), 3–8 CrossRef CAS.
- T. Dilbeck, S. P. Hill and K. Hanson, J. Mater. Chem. A, 2017, 5(23), 11652–11660 RSC.
- S. P. Hill and K. Hanson, J. Am. Chem. Soc., 2017, 139(32), 10988–10991 CrossRef CAS PubMed.
- D. Beery, J. P. Wheeler, A. Arcidiacono and K. Hanson, ACS Appl. Energy Mater., 2020, 3(1), 29–37 CrossRef CAS.
- Y. L. Lin, M. Koch, A. N. Brigeman, D. M. E. Freeman, L. Zhao, H. Bronstein, N. C. Giebink, G. D. Scholes and B. P. Rand, Energy Environ. Sci., 2017, 10(6), 1465–1475 RSC.
- Y. Zhou, C. Ruchlin, A. J. Robb and K. Hanson, ACS Energy Lett., 2019, 4(6), 1458–1463 CrossRef CAS.
- T. Dilbeck and K. Hanson, J. Phys. Chem. Lett., 2018, 9(19), 5810–5821 CrossRef CAS PubMed.
- P. Bharmoria, H. Bildirir and K. Moth-Poulsen, Chem. Soc. Rev., 2020, 49(18), 6529–6554 RSC.
- L. Nienhaus, M. Wu, N. Geva, J. J. Shepherd, M. W. B. Wilson, V. Bulovi, T. Van Voorhis, M. A. Baldo and M. G. Bawendi, ACS Nano, 2017, 11(8), 7848–7857 CrossRef CAS PubMed.
- E. M. Gholizadeh, S. K. K. Prasad, Z. L. Teh, T. Ishwara, S. Norman, A. J. Petty, J. H. Cole, S. Cheong, R. D. Tilley, J. E. Anthony, S. Huang and T. W. Schmidt, Nat. Photonics, 2020, 14(9), 585–590 CrossRef CAS.
- S. Altobello, R. Argazzi, S. Caramori, C. Contado, S. Da Fré, P. Rubino, C. Choné, G. Larramona and C. A. Bignozzi, J. Am. Chem. Soc., 2005, 127(44), 15342–15343 CrossRef CAS PubMed.
- T. Swetha, K. R. Reddy and S. P. Singh, Chem. Rec., 2015, 15(2), 457–474 CrossRef CAS PubMed.
- S. Amemori, Y. Sasaki, N. Yanai and N. Kimizuka, J. Am. Chem. Soc., 2016, 138(28), 8702–8705 CrossRef CAS PubMed.
- R. Haruki, Y. Sasaki, K. Masutani, N. Yanai and N. Kimizuka, Chem. Commun., 2020, 56(51), 7017–7020 RSC.
- Y. Sasaki, M. Oshikawa, P. Bharmoria, H. Kouno, A. Hayashi-Takagi, M. Sato, I. Ajioka, N. Yanai and N. Kimizuka, Angew. Chem., Int. Ed., 2019, 58(49), 17827–17833 CrossRef CAS PubMed.
- A. J. Robb, E. S. Knorr, N. Watson and K. Hanson, J. Photochem. Photobiol., A, 2020, 390, 112291 CrossRef CAS.
- J. C. Wang, S. P. Hill, T. Dilbeck, O. O. Ogunsolu, T. Banerjee and K. Hanson, Chem. Soc. Rev., 2018, 47(1), 104–148 RSC.
- K. Hanson, D. A. Torelli, A. K. Vannucci, M. K. Brennaman, H. Luo, L. Alibabaei, W. Song, D. L. Ashford, M. R. Norris, C. R. K. Glasson, J. J. Concepcion and T. J. Meyer, Angew. Chem., Int. Ed., 2012, 51(51), 12782–12785 CrossRef CAS PubMed.
- J. C. Wang, I. A. Murphy and K. Hanson, J. Phys. Chem. C, 2015, 119(7), 3502–3508 CrossRef CAS.
- S.-H. A. Lee, N. M. Abrams, P. G. Hoertz, G. D. Barber, L. I. Halaoui and T. E. Mallouk, J. Phys. Chem. B, 2008, 112(46), 14415–14421 CrossRef CAS PubMed.
- O. O. Ogunsolu, J. C. Wang and K. Hanson, ACS Appl. Mater. Interfaces, 2015, 7(50), 27730–27734 CrossRef CAS PubMed.
- T. Dilbeck, J. C. Wang, Y. Zhou, A. Olsson, M. Sykora and K. Hanson, J. Phys. Chem. C, 2017, 121(36), 19690–19698 CrossRef CAS.
- L. A. Gallagher, S. A. Serron, X. Wen, B. J. Hornstein, D. M. Dattelbaum, J. R. Schoonover and T. J. Meyer, Inorg. Chem., 2005, 44(6), 2089–2097 CrossRef CAS PubMed.
- Y. J. Bae, G. Kang, C. D. Malliakas, J. N. Nelson, J. Zhou, R. M. Young, Y.-L. Wu, R. P. Van Duyne, G. C. Schatz and M. R. Wasielewski, J. Am. Chem. Soc., 2018, 140(45), 15140–15144 CrossRef CAS PubMed.
- A. J. Robb, D. Miles, S. R. Salpage, N. Watson, Q. He, Q. Wu and K. Hanson, ACS Appl. Mater. Interfaces, 2020, 12(34), 38003–38011 CrossRef CAS PubMed.
- K. Hanson, M. K. Brennaman, H. Luo, C. R. K. Glasson, J. J. Concepcion, W. Song and T. J. Meyer, ACS Appl. Mater. Interfaces, 2012, 4(3), 1462–1469 CrossRef CAS PubMed.
- H. Onouchi, K. Maeda and E. Yashima, J. Am. Chem. Soc., 2001, 123(30), 7441–7442 CrossRef CAS PubMed.
- F. Yu, Y.-M. Zhang, Y.-H. Guo, A.-H. Li, G.-X. Yu and B. Li, CrystEngComm, 2013, 15(41), 8273–8279 RSC.
- S. P. Hill, T. Banerjee, T. Dilbeck and K. Hanson, J. Phys. Chem. Lett., 2015, 6(22), 4510–4517 CrossRef CAS PubMed.
- A. Haefele, J. Blumhoff, R. S. Khnayzer and F. N. Castellano, J. Phys. Chem. Lett., 2012, 3(3), 299–303 CrossRef CAS.
- A. Monguzzi, J. Mezyk, F. Scotognella, R. Tubino and F. Meinardi, Phys. Rev. B: Condens. Matter Mater. Phys., 2008, 78(19), 195112 CrossRef.
- Y. Murakami and K. Kamada, Phys. Chem. Chem. Phys., 2021, 23(34), 18268–18282 RSC.
- R. Katoh, A. Furube, T. Yoshihara, K. Hara, G. Fujihashi, S. Takano, S. Murata, H. Arakawa and M. Tachiya, J. Phys. Chem. B, 2004, 108(15), 4818–4822 CrossRef CAS.
- C. A. Kelly, F. Farzad, D. W. Thompson, J. M. Stipkala and G. J. Meyer, Langmuir, 1999, 15(20), 7047–7054 CrossRef CAS.
- A. Arcidiacono, Y. Zhou, W. Zhang, J. O. Ellison, S. Ayad, E. S. Knorr, A. N. Peters, L. Zheng, W. Yang, S. S. Saavedra and K. Hanson, J. Phys. Chem. C, 2020, 124(43), 23597–23610 CrossRef CAS PubMed.
- A. Arcidiacono, A. Robb, R. Masitas, S. Salpage, G. M. McLeod, O. Ogunsolu, J. Chen, M. G. Roper and K. Hanson, Photochem. Photobiol., 2022, 9, 100088 CrossRef.
- V. Gray, K. Moth-Poulsen, B. Albinsson and M. Abrahamsson, Coord. Chem. Rev., 2018, 362, 54–71 CrossRef CAS.
- O. O. Ogunsolu, I. A. Murphy, J. C. Wang, A. Das and K. Hanson, ACS Appl. Mater. Interfaces, 2016, 8(42), 28633–28640 CrossRef CAS PubMed.
Footnotes |
| † Electronic supplementary information (ESI) available. See DOI: 10.1039/d1tc05270e |
| ‡ These authors contributed equally to the work. |
| This journal is © The Royal Society of Chemistry 2022 |

