Near-infrared-to-visible upconversion from 980 nm excitation band by binary solid of PbS quantum dot with directly attached emitter

Neeti Tripathi *a, Masanori Ando b, Tomoko Akai a and Kenji Kamada *a
aNanomaterials Research Institute, National Institute of Advanced Industrial Science and Technology (AIST), Ikeda, Osaka 563-8577, Japan. E-mail: n-tripathi@aist.go.jp; k.kamada@aist.go.jp
bBiomedical Research Institute, National Institute of Advanced Industrial Science and Technology (AIST), Ikeda, Osaka 563-8577, Japan

Received 20th October 2021 , Accepted 2nd January 2022

First published on 4th January 2022


Abstract

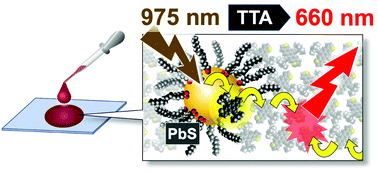
Long-wavelength NIR photon upconversion (UC) by triplet–triplet annihilation in cast solid is reported. NIR excitation at 975 nm of the binary solid of PbS quantum dot (QD) and an anthradithiophene derivative, which can attach to the QD directly, gave a UC quantum yield of 0.2% (vs. 50% full-scale) and threshold intensity of 2.5 W cm−2. Triplet energy transfer from QD was found to be accelerated by the direct attachment, based on the UC emission dynamics.

As it has potential to overcome the existing performance limit of solar energy devices,1 upconversion (UC) of near-infrared (NIR) photons to visible photons is a topic of great importance.2–8 Recent progress in triplet–triplet annihilation upconversion (TTA-UC) has shown a way to use solar energy in the extended solar spectrum. TTA-UC is based on mixing/pairing of the sensitizer and emitter (or annihilator) together, where the excitation energy is harvested by the sensitizer and energy is transferred to the emitter via triplet–triplet energy transfer (TET), which gives emission at a higher energy level than the excitation.9–17 TTA-UC is attractive because of its low excitation intensity, as low as sunlight level (around 1 mW cm−2 for 10 nm spectral width), and its high upconversion quantum yield (UC-QY or ΦUC).18 Extremely low threshold excitation intensity (Ith) below 1 mW cm−219 and high UC-QY close to 40%20 have been reported for visible-to-visible upconversion.

Compared to this, NIR-to-visible upconversion21–40 still requires higher Ith and shows lower UC-QY despite various strategies. Reports are very limited for the conversion from 800 nm or longer, which is an interesting region for photovoltaic devices, such as perovskite solar cells. These solar cells can be categorized based on sensitizer: metallonaphthalocyanines,32 Os-complex,33 Yb-complex,34 and semiconductor quantum dots (QDs) with PbS and PbSe.35–40 Most of these systems are solution systems, although rigid and solvent-free solid materials are preferable for combining with solar energy devices. Few reports on solid systems have been reported, among them, the Os-complex/rubrene nanoparticles excited at 938 nm by Amemori et al. (no UC-QY reported for this wavelength)33 and the PbS/rubrene(annihilator):DBT(emitter) films fabricated by spin-coating and vacuum deposition by Baldo's group (UC-QY of 0.6% excited at 808 nm,37 0.8% excited at 980 nm38 with a reflector, and 3.5% at 808 nm by replacing with the shorter ligand39).

For TTA-UC from 800 nm or longer, PbS QD is an attractive sensitizer because of its wavelength tunability by size in the NIR region. QD has an inherent problem: the ligands passivating the QD core inhibit TET and then suppress UC. To overcome this problem, the introduction of a transmitter molecule as the third component is a common strategy in solution systems.36 However, the transmitter strategy has not been applied in solid systems.

Here, we demonstrate solid-state TTA-UC from a long-wavelength (975 nm) NIR by using the directly attached emitter 5,11-bis(triethylsilylethynyl)anthradithiophene (TES-ADT, Fig. 1) so as to allow TET from QD. TES-ADT can associate with the Pb atom of the PbS QD by the S atom of the condensed thiophene moieties. TTA-UC from 1100 nm has been reported using TES-ADT as the directly attached emitter in a solution system.40 Solid film of PbS QD:TES-ADT was fabricated by the rapid-drying solution-casting technique. This method can provide better mixing between the sensitizer and emitter, accelerating the TET between them.28,41 To the best of our knowledge, this is the first report of a completely solution-processed solid TTA-UC system that can convert excitation light in the 980 nm band into visible emission of 660 nm, by using the directly attached emitter. We successfully obtained a high average UC-QY of (0.21 ± 0.05)% and threshold excitation intensity of 2.5 W cm−2, lower than or comparable to the previous benchmarks with more complex system and procedures.37,38 We also discuss the effect of the concentration of the mother solution for the casting process on upconversion properties.


image file: d1tc05058c-f1.tif
Fig. 1 Energy level diagram of the PbS QD:TES-ADT upconversion system. The chemical structure is that of TES-ADT.

Fig. 1 illustrates the energy level diagram of the PbS QD:TES-ADT system. The low triplet energy level of TES-ADT (1.08 eV) allows for one to choose a sensitizer capturing NIR photons, such as PbS QD. Here, we used PbS QD, with an excitonic peak at 1.42 eV (875 nm; size 2.6 nm). The wavelengths of the available laser were 785 nm and 975 nm. 785 nm was mainly used to excite the reference material for UC-QY measurement (Sec. B, ESI). Both wavelengths can excite the QD at the high- and low-energy sides of the excitonic peak (see the absorption spectrum in Fig. S1a, ESI). The energy levels of the emission peak of the QD (1000 nm, 1.24 eV) and triplet TES-ADT are closely located to each other. This satisfies the energetic requirement for TET. The energy levels of TES-ADT may be lower in solid form by intermolecular interaction compared to that in solution (Fig. S1b, ESI), but the lowering does not worsen TET much. Thus, UC emission can be expected even in the solid form.

Previously, TES-ADT was demonstrated as a directly attached emitter in solution system.40,42 Two mechanisms are proposed to explain how energy is transferred from the bound TES-ADT on the QD surface to another TES-ADT diffusing in solution (free TES-ADT) after the bound one receives the energy from the QD. One is the transmitter mechanism, where transfer occurs when a free TES-ADT collides with the bound TES-ADT on the QD surface. The other is a detaching-and-diffusion mechanism, where the bound TES-ADT detaches from the QD surface, diffuses in solution, and causes TTA with another TES-ADT. Clearly, the latter does not occur in solid, so the former is the probable mechanism if TTA-UC occurs in the binary solid.

The binary solid of PbS QD and TES-ADT was fabricated by solution casting, as shown in Fig. 2. Firstly, the mother solutions of PbS QD and TES-ADT were prepared by dissolving various amounts of TES-ADT powder in the dispersion solution of QD, giving different concentrations of TES-ADT from [TES-ADT] = 20 mM to 200 mM, while the concentration of PbS QD was 50 μM for all. Secondly, the mother solutions were drop-cast onto glass slides to form PbS QD:TES-ADT films. Detailed procedures can be found in ESI. All procedures were performed in a glove box with O2 fraction in the order of 1 ppm.


image file: d1tc05058c-f2.tif
Fig. 2 Schematic illustration of the sample fabrication procedure.

The drop-cast film was obtained in circular form, with a thick rim and thinner center part (Fig. 2, thickness profile can be found in Fig. S4, ESI). Depending on the TES-ADT concentration, the average thickness of the rim varies from 25 μm to 200 μm, as shown in Fig. S5 (ESI).

Optical properties of the fabricated samples were studied by using a homemade microspectroscopic setup (see Sec. B, ESI, for details). Fig. 3a is a transmission image of the cast sample of the binary solid of PbS QD:TES-ADT at the rim of the dropped region. Polarized images showed the film mostly consists of many small crystalline domains (Fig. S6, ESI). By irradiating continuous wave (cw) light at 975 nm, red emission was clearly observed at the same region (Fig. 3b). Apart from a small fraction of amorphous region, most of the rim area was crystalline. UC emission could be easily monitored anywhere in the sample (more examples in Fig. S7, ESI). The emission spectrum was centered at 660 nm, which is shorter than the excitation wavelength (Fig. 3c) and is the same as the fluorescence spectrum of TES-ADT in solid form (Fig. S1c, ESI). Neither pristine PbS QD nor TES-ADT exhibits visible emission under the same excitation condition. These facts suggest the observed red emission from the binary solid is upconverted emission by TTA-UC. The spectral shape and peak wavelength were unchanged regardless of monitoring point in the sample. However, the emission intensity varied slightly from point to point, probably due to aggregation state and/or crystallinity and slight variations in the thickness as well.


image file: d1tc05058c-f3.tif
Fig. 3 Microscopic (a) transmission image of cast binary solid of PbS QD:TES-ADT and (b) the upconverted emission image excited at 975 nm (40 W cm−2). (c) Observed emission spectrum at 975 nm excitation. A 700 nm short-pass filter was used to cut the scattering of the excitation. (d) Upconversion quantum yield (at 40 W cm−2) as a function of the TES-ADT concentration in the mother solution.

By using the same setup, we determined the UC-QY of the binary solid (see ESI for details of the procedures). The measurements were repeatedly performed at different monitoring positions (diameter 5 μm) on the sample. The average UC-QY was obtained at 10 or more monitoring positions and is shown in Fig. 3d against the [TES-ADT] of the mother solution. Interestingly, we found that the UC-QY tends to increase with the concentration at low concentration and then reaches a maximum value (ΦUC = (0.21 ± 0.05)%) at [TES-ADT] = 100 mM; after that, it seems to remain constant (Fig. 3d). The best value we obtained from a single point was 0.34%. These UC-QY measurements were performed at the excitation intensity of 40 W cm−2. We also performed 785 nm excitation for some samples, and the obtained UC-QY values are similar to or slightly lower than those from 975 nm excitation (Table S1, ESI).

Excitation intensity dependence is necessary to understand the kinetic information of the TTA-UC system. Fig. 4 shows the excitation intensity dependence of UC-QY of the cast solid PbS QD:TES-ADT prepared at [TES-ADT] = 100 mM. The UC-QY was fitted by the theoretical equation,43

 
image file: d1tc05058c-t1.tif(1)
where ΦUC is the upconversion yield for the strong excitation limit and Ith is the threshold excitation intensity. The obtained values are ΦUC = (0.29 ± 0.02)% and Ith = 2.5 ± 0.6 W cm−2. The data for excitation intensity dependence and the obtained parameters of the samples with other concentrations are shown in Figs. S8 and S9 and Table S2 (ESI), respectively. The data for ΦUC (Fig. S9, ESI), which show the potential maximum values of the systems, followed a similar trend to Fig. 2d because Ith was almost the same for all concentrations. The Ith values found here were 2–6 W cm−2 and one order of magnitude lower than the solution system of PbS QD/TES-ADT.42 The low Ith value in solid compared to the solution shows the solid has potential for operation under weaker light and is preferable for application. Ith is formulated as11,12,43
 
Ith ∝ (αΦISCΦTET)−1 (k23A/k2),(2)
where α is the absorption coefficient of the sensitizer and ΦISC and ΦTET are quantum yield of the intersystem crossing (ISC) of the sensitizer (can be taken as unity for PbS QD) and TET, respectively. k3A and k2 are the first-order rate constant for unimolecular deactivation and second-order rate constant for the bimolecular annihilation process of the triplet emitter, respectively. Here, α and k2 may increase with the density of QD and emitter, and ΦTET increases as TET becomes faster. The low Ith in solid can be due to the high concentration of sensitizer and emitter in solid and also suggests fast TET and high ΦTET.


image file: d1tc05058c-f4.tif
Fig. 4 Excitation intensity (Iex) dependence of the upconversion quantum yield (UC-QY) of PbS QD:TES-ADT binary solid fabricated from the solution with [TES-ADT] = 100 mM (red circle), with theoretical fitting using eqn (1) (black solid curve).

To understand TET dynamics in the PbS QD:TES-ADT binary system, we performed time-resolved UC emission measurements. The observed UC emission for the sample prepared with [TES-ADT] = 100 mM showed a rise and decay dynamics in the submicroseconds to microseconds time region (Fig. 5), which can be fitted with,43

 
IUC(t) = A[1 − exp(−t/τR)]2 exp(−2t/τD),(3)
where τR and τD are the rise and decay time constants, corresponding to the TET time constant and triplet decay time constant of TES-ADT, respectively, and A is the amplitude factor. The curve fitting gave τR = 180 ± 1 ns and τD = 6.7 ± 0.1 μs. The samples from other concentrations had similar values (Table S3, ESI). The TET time constant (τ) is faster than 200 ns for all PbS QD:TES-ADT samples, which is one order of magnitude faster than the natural (i.e., not quenched) decay time constant of PbS QD (τ0 ∼3 μs).42 The TET quantum yield is estimated from the convention ΦTET = 1 − τ/τ0 ∼93%. The result shows that efficient TET is possible by the transmitter mechanism, where the TES-ADT is attached to the QD surface and acts as transmitter of triplet energy.


image file: d1tc05058c-f5.tif
Fig. 5 Time profile of the upconversion emission of PbS QD:TES-ADT binary solid fabricated from solution with [TES-ADT] = 100 mM (red circle), with curve fitting using eqn (3) (black curve).

Moreover, it is also noted here that the triplet decay time constant (τD) of TES-ADT in the cast solid is in the range 2–5 μs, which is also much faster than the reported values in solution system (10–20 μs),42 probably due to the stronger intermolecular interaction in the solid.

With the above data we obtained, here we discuss the bottleneck process of the cast solid. In general, UC-QY is represented by the product of,

 
image file: d1tc05058c-t2.tif(4)

If we assume ΦISC = 100% and take ΦTET = 93%, the remaining factors determine ΦUC. The ΦFL value of TES-ADT in solid with PbS QD measured separately was (2.1 ± 0.2)%, so ΦTTA (φS in ref. 43) = 30% for ΦUC = 0.29%. Therefore, the bottleneck must be ΦFL because the product of the other factors is at least 15%.

This study clarified that the UC-QY of the fabricated solid depends on the concentration of the emitter (as the host matrix) in the mother solution. The observed trend can be explained in terms of mixing the components through crystal formation and segregation. At high concentrations (especially >75 mM), the size of the formed crystals tended to be smaller than those from the lower concentration solutions. Large crystals were seldom found. Small crystals may contain more impurity, i.e., QDs, than large crystals formed with longer time, resulting in better mixing of two components. This is supported by the fact that TET time constant becomes faster with increased concentration (τR in Table S3, ESI). Thus, we concluded that the concept of rapid-drying casting41 can also be applied for this system. That is, a high concentration of TES-ADT in the mother solution causes rapid crystallization on casting and inhibits segregation between PbS QD and TES-ADT.

Conclusions

By using a directly attached emitter approach, we successfully demonstrated long-wavelength (975 nm) NIR TTA-UC from the binary solid PbS QD:TES-ADT fabricated by solution casting. Fast energy transfer with the time constant of 200 ns or less was observed, which causes efficient TET by the TES-ADT attached on the QD surface acting as transmitter. The emitter concentration in the mother solution was found to impact UC-QY, probably due to the different distributions of QD in the emitter matrix. The best value of UC-QY was observed to be ΦUC = 0.34% at 975 nm, which is one of the best values reported if no use of reflector and the long excitation wavelength are taken into account (Table 1). The excitation intensity study of UC-QY gave a threshold excitation intensity as low as 2.5 W cm−2 and the theoretical limit of UC-QY for the system ΦUC = 0.29%. The threshold intensity is similar to38 or lower than37 that of the solid system of the same excitation wavelength range, where rubrene and DBP were used as separate annihilator and emitter. Analysis on the quantum yield clarified that the low fluorescence quantum yield of the emitter is the key to the further improvement.
Table 1 Summary of the reports on TTA-UC in solid with the excitation wavelength longer than 800 nm and this work
System λ ex (nm) ΦUC (%)a Ref.
a Converted to the 50% definition if necessary. b Best value. c Interferometrically enhanced with reflector. d Exchanged with shorter ligand than oleic acid.
PbS:TES-ADT 975 0.21 (0.34b) This Work
PbS/rubrene + DBP 980 0.8c 38
Os-complex:rubrene 938 N.A. 33
PbS/rubrene + DBP 808 0.6–0.105 37
PbSd/rubrene + DBP 808 3.5c 39


Conflicts of interest

There are no conflicts to declare.

Acknowledgements

This work is based on results obtained from a project, JPN P14004, commissioned by the New Energy and Industrial Technology Development Organization (NEDO).

Notes and references

  1. W. Shockley and H. J. Queisser, J. Appl. Phys., 1961, 32, 510–519 CrossRef CAS.
  2. M. Schoenauer Sebag, Z. Hu, K. D. O. Lima, H. Xiang, P. Gredin, M. Mortier, L. Billot, L. Aigouy and Z. Chen, ACS Appl. Energy Mater., 2018, 1(8), 3537–3543 CrossRef CAS.
  3. S. Baluschev, T. Miteva, V. Yakutkin, G. Nelles, A. Yasuda and G. Wegner, Phys. Rev. Lett., 2006, 97, 143903-1–143903-3 CrossRef PubMed.
  4. N. J. Ekins-Daukes and T. W. Schmidt, Appl. Phys. Lett., 2008, 93, 063507-1–063507-3 CrossRef.
  5. M. J. Y. Tayebjee, L. C. Hirst, N. J. Ekins-Daukes and T. W. Schmidt, J. Appl. Phys., 2010, 108, 124506 CrossRef.
  6. V. Gray, D. Dzebo, M. Abrahamsson, B. Albinsson and K. Moth-Poulsen, Phys. Chem. Chem. Phys., 2014, 16, 10345–10352 RSC.
  7. A. Monguzzi, D. Braga, M. Gandini, V. C. Holmberg, D. K. Kim, A. Sahu, D. J. Norris and F. Meinardi, Nano Lett., 2014, 14, 6644–6650 CrossRef CAS PubMed.
  8. P. Bharmoria, H. Bildirir and K. Moth-Poulsen, Chem. Soc. Rev., 2020, 49, 6529–6554 RSC.
  9. R. R. Islangulov, D. V. Kozlov and F. N. Castellano, Chem. Commun., 2005, 3776–3778 RSC.
  10. T. N. Singh-Rachford and F. N. Castellano, Coord. Chem. Rev., 2010, 254, 2560–2573 CrossRef CAS.
  11. A. Monguzzi, J. Mezyk, F. Scotognella, R. Tubino and F. Meinardi, Phys. Rev. B: Condens. Matter Mater. Phys., 2008, 78, 195112-1–195112-5 CrossRef.
  12. A. Monguzzi, R. Tubino, S. Hoseinkhani, M. Campione and F. Meinardi, Phys. Chem. Chem. Phys., 2012, 14, 4322–4332 RSC.
  13. P. E. Keivanidis, S. Baluschev, T. Miteva, G. Nelles, U. Scherf, A. Yasuda and G. Wegner, Adv. Mater., 2003, 15, 2095–2098 CrossRef CAS.
  14. S. Ji, W. Wu, W. Wu, H. Guo and J. Zhao, Angew. Chem., Int. Ed., 2011, 50, 1626–1629 CrossRef CAS PubMed.
  15. P. Duan, N. Yanai and N. Kimizuka, J. Am. Chem. Soc., 2013, 135, 19056–19059 CrossRef CAS PubMed.
  16. M. A. Filatov, S. Baluschev and K. Landfester, Chem. Soc. Rev., 2016, 45, 4668–4689 RSC.
  17. N. Yanai and N. Kimizuka, Acc. Chem. Res., 2017, 50, 2487–2495 CrossRef CAS PubMed.
  18. Throughout this paper, we use the 50%-for-full conversion definition for upconversion quantum yield rather than upconversion quantum efficiency, according to the definition in Y. Zhou, F. N. Castellano, T. W. Schmidt and K. Hanson, ACS Energy Lett., 2020, 5, 2322–2326 CrossRef CAS.
  19. M. Yang, S. Sheykhi, Y. Zhang, C. Milsmann and F. N. Castellano, Chem. Sci., 2021, 12, 9069–9077 RSC.
  20. S. Hoseinkhani, R. Tubino, F. Meinardi and A. Monguzzi, Phys. Chem. Chem. Phys., 2015, 17, 4020–4024 RSC.
  21. L. Nienhaus, M. Wu, V. Bulović, M. A. Baldo and M. G. Bawendi, Dalton Trans., 2018, 47, 8509–8516 RSC.
  22. Y. Y. Cheng, B. Fückel, T. Khoury, R. L. G. C. R. Clady, M. J. Y. Tayebjee, N. J. Ekins-Daukes, M. J. Crossley and T. W. Schmidt, J. Phys. Chem. Lett., 2010, 1, 1795–1799 Search PubMed.
  23. S. Baluschev, V. Yakutkin, T. Miteva, G. Wegner, T. Roberts, G. Nelles, A. Yasuda, S. Chernov, S. Aleshchenkov and A. Cheprakov, New J. Phys., 2008, 10, 013007-1–013007-12 CrossRef.
  24. T. N. Singh-Rachford and F. N. Castellano, J. Phys. Chem. A, 2008, 112, 3550–3556 CrossRef CAS PubMed.
  25. F. Deng, J. R. Sommer, M. Myahkostupov, K. S. Schanze and F. N. Castellano, Chem. Commun., 2013, 49, 7406–7408 RSC.
  26. S. Baluschev, V. Yakutkin, T. Miteva, Y. Avlasevich, S. Chernov, S. Aleshchenkov, G. Nelles, A. Cheprakov, A. Yasuda, K. Müllen and G. Wegner, Angew. Chem., Int. Ed., 2007, 46, 7693–7696 CrossRef CAS PubMed.
  27. V. Yakutkin, S. Aleshchenkov, S. Chernov, T. Miteva, G. Nelles, A. Cheprakov and S. Baluschev, Chem. – Eur. J., 2008, 14, 9846–9850 CrossRef CAS PubMed.
  28. A. Abulikemu, Y. Sakagami, C. Heck, K. Kamada, H. Sotome, H. Miyasaka, D. Kuzuhara and H. Yamada, ACS Appl. Mater. Interfaces, 2019, 11, 20812–20819 CrossRef CAS PubMed.
  29. E. Radiunas, M. Dapkevicius, S. Raisys, S. Jursenas, A. Jozeliunaite, T. Javorskis, U. Sinkeviciute, E. Orentas and K. Kazlauskas, Phys. Chem. Chem. Phys., 2020, 22, 7392–7403 RSC.
  30. E. Radiunas, S. Raišys, S. Juršėnas, A. Jozeliūnaitė, T. Javorskis, U. Šinkevičiūtė, E. Orentas and K. Kazlauskas, J. Mater. Chem. C, 2020, 8, 5525–5534 RSC.
  31. E. Radiunas, M. Dapkevičius, L. Naimovičius, P. Baronas, S. Raišys, S. Juršėnas, A. Jozeliūnaitė, T. Javorskis, U. Šinkevičiūtė, E. Orentas and K. Kazlauskas, J. Mater. Chem. C, 2021, 9, 4359–4366 RSC.
  32. S. Amemori, N. Yanai and N. Kimizuka, Phys. Chem. Chem. Phys., 2015, 17, 22557–22560 RSC.
  33. (a) S. Amemori, Y. Sasaki, N. Yanai and N. Kimizuka, J. Am. Chem. Soc., 2016, 138, 8702–8705 CrossRef CAS PubMed; (b) ibid., 2020, 142, 8057–8058 (correction).
  34. N. Kiseleva, P. Nazari, C. Dee, D. Busko, B. S. Richards, M. Seitz, I. A. Howard and A. Turshatov, J. Phys. Chem. Lett., 2020, 11, 2477–2481 CrossRef CAS PubMed.
  35. Z. Huang, X. Li, M. Mahboub, K. M. Hanson, V. M. Nichols, H. Le, M. L. Tang and C. J. Bardeen, Nano Lett., 2015, 15, 5552–5557 CrossRef CAS PubMed.
  36. Z. Huang, D. E. Simpson, M. Mahboub, X. Lia and M. L. Tang, Chem. Sci., 2016, 7, 4101–4104 RSC.
  37. M. Wu, D. N. Congreve, M. W. B. Wilson, J. Jean, N. Geva, M. Welborn, T. V. Voorhis, V. Bulović, M. G. Bawendi and M. A. Baldo, Nat. Photonics, 2016, 10, 31–34 CrossRef CAS.
  38. M. Wu, J. Jean, V. Bulović and M. A. Baldo, Appl. Phys. Lett., 2017, 110, 211101-1–211101-4 Search PubMed.
  39. L. Nienhaus, M. Wu, N. Geva, J. J. Shepherd, M. W. B. Wilson, V. Bulović, T. V. Voorhis, M. A. Baldo and M. G. Bawendi, ACS Nano, 2017, 11, 7848–7857 CrossRef CAS PubMed.
  40. N. Nishimura, J. R. Allardice, J. Xiao, Q. Gu, V. Gray and A. Rao, Chem. Sci., 2019, 10, 4750–4760 RSC.
  41. (a) K. Kamada, Y. Sakagami, T. Mizokuro, Y. Fujiwara, K. Kobayashi, K. Narushima, S. Hirata and M. Vacha, Mater. Horiz., 2017, 4, 83–87 RSC; (b) ibid., 2018, 5, 1219 (correction).
  42. N. Tripathi, M. Ando, T. Akai and K. Kamada, ACS Appl. Nano Mater., 2021, 4, 9680–9688 CrossRef CAS.
  43. Y. Murakami and K. Kamada, Phys. Chem. Chem. Phys., 2021, 23, 18268–18282 RSC.

Footnotes

Electronic supplementary information (ESI) available: Experimental details, thickness data, microscopic images, etc. See DOI: 10.1039/d1tc05058c
The value after conversion to the 50% definition.

This journal is © The Royal Society of Chemistry 2022