
 Open Access Article
 This Open Access Article is licensed under a
 Creative Commons Attribution 3.0 Unported Licence
The role of absorbed water in ionic liquid cellulosic electrolytes for ionic thermoelectrics†
D.
Zhao
 *ab,
A.
Sultana
ab,
J.
Edberg
c,
M.
Shiran Chaharsoughi
a,
M.
Elmahmoudy
a,
U.
Ail
a,
K.
Tybrandt
ab and
X.
Crispin
*ab
*ab,
A.
Sultana
ab,
J.
Edberg
c,
M.
Shiran Chaharsoughi
a,
M.
Elmahmoudy
a,
U.
Ail
a,
K.
Tybrandt
ab and
X.
Crispin
*ab
aLaboratory of Organic Electronics, Department of Science and Technology, Linköping University, SE-60174, Norrköping, Sweden. E-mail: dan.zhao@liu.se; xavier.crispin@liu.se
bWallenberg Wood Science Center, Linköping University, SE-60174, Norrköping, Sweden
cRISE Research Institutes of Sweden, Bio- and Organic Electronics, Bredgatan 33, 60221, Norrköping, Sweden
First published on 3rd November 2021
Abstract
The advantages of large output thermovoltage and sustainable constituent materials have generated a rapid growth in research about ionic thermoelectrics. Recently, giant values of ionic Seebeck coefficients up to 10–26 mV K−1 have been reported. However, the fundamental understanding of the ionic thermoelectric effect is still rudimentary and there is a lack of a well-established measurement standard. In this work, we systematically studied the ionic thermoelectric properties of gel electrolytes made of hydroxyethyl cellulose and an ionic liquid. We discovered that the absorbed water from the atmosphere into the cellulose/ionic liquid gel dramatically increases the apparent ionic Seebeck coefficient from 3 to 12.5 mV K−1. We identified the contribution of a hydrovoltaic voltage generated from water concentration difference as the main reason for the enhanced apparent ionic Seebeck coefficient, which depends on the kinetics of water absorption and desorption on the cold and hot side of the device. Finally, we demonstrated that it is possible to harvest electricity and charge a supercapacitor with intermittent temperature gradients by using this combination of ionic Seebeck voltage and hydrovoltaic voltage.
1. Introduction
Thermoelectric effects in electronic conductors and semiconductors1 have attracted intensive research interest and enabled practical applications such as power generation in space exploration2 and recovery of waste heat in automobiles.3 The thermoelectric effects induced by ionic charge carriers in electrolytes are less widely known, but the possibility to charge energy storage devices, such as supercapacitors4 or batteries,5 is motivating scientists to systematically investigate the ionic thermoelectric properties of electrolytes. The most important metric of the thermoelectric effect is the Seebeck coefficient Si, which is defined as the ratio between the generated open circuit voltage across the electrolyte (ΔV) and the applied temperature difference (ΔT). The efficiency of charging a supercapacitor of capacitance C with energy of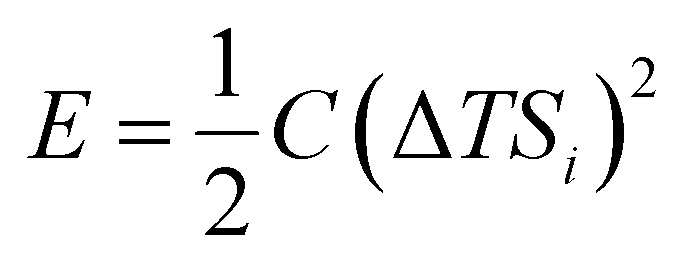 is governed by the ionic thermoelectric figure of merit:
 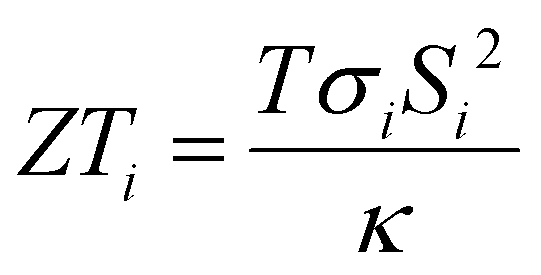 ; where σi is the ionic conductivity, T the temperature and κ the thermal conductivity of the electrolyte.4a The efficiency of electronic and ionic thermoelectric materials can be related by comparing ionic thermoelectric supercapacitors (ITESCs) with electronic thermoelectric generators (TEGs) coupled in series with supercapacitors (SCs) of the same capacitance.4c One major advantage of ionic thermoelectric materials is that their Seebeck coefficients can be a few hundred times higher than the Seebeck coefficients of electronic (semi)conductors. Thus, for the same ΔT, the amount of stored energy is much higher for the ITSEC than the TEG-SC. A single leg of an ITSEC can generate a charging voltage of hundred millivolt with only a few degrees of temperature difference,6,7 and the generated charge can be stored within the device also in the absence of temperature difference.
A wide range of ionic polymeric thermoelectric materials have been reported, including aqueous-based polyelectrolytes,4b,c,8 highly ionic-doped conjugated polymers,6c,d,9 ionic liquid polymer gels6a,e,7 and hybrid polyelectrolytes.6b,10 Aqueous polymer electrolytes can have large Seebeck coefficients but are challenging for long term operation under temperature gradient due to water evaporation, which causes deteriorating performance.4b,c,10 To resolve the stability issues, non-volatile ionic liquid electrolytes have been investigated for ionic thermoelectrics, which has resulted in both energy harvesting6a,e and heat sensing applications.7
The thermoelectric effect in an electrolyte originates from the difference in thermodiffusion of cations and anions along the temperature gradient.11 The diffusion coefficients of the cations and anions in a pure ionic liquid are usually of the same order of magnitude,12 which results in only a small ionic Seebeck coefficient.7b,13 Polymers6e,7b and inorganic cross-linkers6a have, in addition to improving the mechanical strength of the material, been successfully used to differentiate the thermodiffusion of the cations and anions. However, the mechanism of the specific interactions of the polymer matrix with the cations and anions of the ionic liquid is not well understood, although it appears to largely determine the thermoelectric properties of polymer electrolytes. The ionic mobility and polymer-ion interactions could be affected by a small amount of absorbed water, which can affect both the solvation of some ions and the structure of the polymer.14,15 To date, there is no comprehensive study of how absorbed water in ionic liquid–polymer electrolytes affect the ionic thermoelectric effect. This aspect, however, is crucial to better understand the role of water in these systems, especially when considering manufacturing methods such as printing technologies7a which are often performed in ambient atmosphere. In doing so, appropriate routines for atmospheric control, such as humidity level, during printing and encapsulations steps can be developed. Detailed understanding of the role of absorbed water is also of uttermost importance to enable comparison of results within the field, and thereby enabling rational material design.
In this work, we systematically studied the thermoelectric performance of ionic liquid–cellulose polymeric electrolytes, the impact of absorbed water and the role of the vapor–liquid equilibrium. The apparent Seebeck coefficient of the studied electrolytes could be enhanced from 3 to 12.5 mV K−1 by promoting water concentration differences along the temperature gradient when the material is exposed to the atmosphere. We discovered that the spontaneously formed water concentration difference by evaporation and condensation from the atmosphere was highly dependent on the small amount of added cellulose to the electrolyte and the substitution level of the cellulose. While the amount of polymeric cellulose greatly increased the viscosity of the electrolytes, it did not affect the conductivity and apparent Seebeck coefficient, which is beneficial for large scale fabrication. Finally, to explore the potential of the technology, we demonstrate alternating current harvesting from an intermittent heat source by constructing ionic thermoelectric supercapacitors with Au nanowires or carbon electrodes.
2. Results
2.1. Apparent ionic Seebeck coefficient αi
The electrolytes used in this study are composed of the ionic liquid (IL) 1-ethyl-3-methylimidazolium ethyl sulfate (EMIM-ES) and a certain percentage of hydroxyethyl cellulose (HEC) (Fig. 1a). The combination of the ionic liquid and HEC forms a gel-like electrolyte which provides good stability upon heating and enables processing via printing technologies.16 The electrolytes were prepared without any active addition of water, and they were preheated at 110 °C for 30 min to remove residual water prior to electrode coating. However, due to the polar character and slight hygroscopicity of the ionic liquid,17 and the ability of HEC to retain water through hydrogen bonding,18 a certain amount of water will be absorbed in the electrolyte layer when in equilibrium with the atmosphere. The latter is characterized by the relative humidity and the temperature.19 We chose four types of HEC of different molecular weight (Mw) and degree of substitution (DS) (as shown in Fig. 1b) to prepare electrolytes of fixed HEC weight percentage, and measured the open circuit voltage induced by the temperature difference to access the ionic Seebeck coefficients. DS equals the number of hydroxyl groups replaced by the substituent in every anhydroglucose unit in the chain. A high DS is expected to lower the hygroscopicity of the HEC, while a low DS would increase its hygroscopicity.20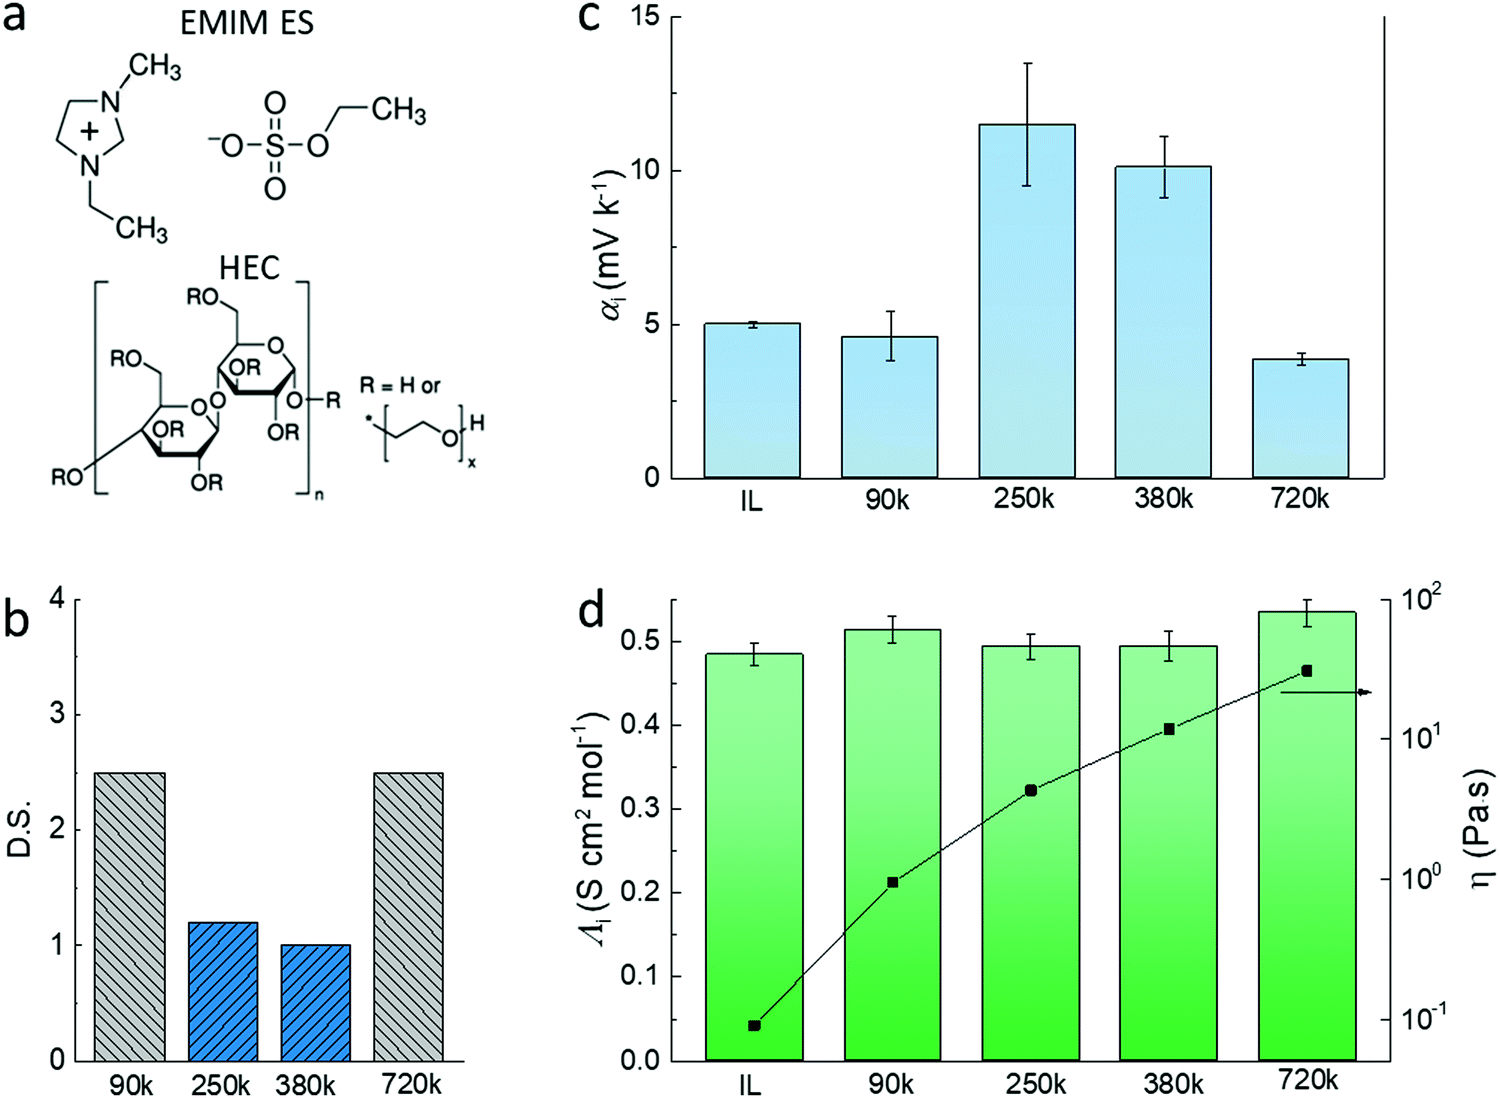 | ||
| Fig. 1 The illustration of the cellulose polymeric electrolytes and their thermoelectric properties. (a) The chemical structure of the ionic liquid and HEC electrolytes. (b) The substitution level and molecule weight of the different HECs used in this study. (c) The apparent Seebeck coefficient (αi) and (d) the molar conductivity and viscosity of EMIM ES containing 2 wt% of different types of HEC. | ||
The apparent Seebeck coefficient αi of electrolytes that contain 2 wt% HECs of different Mw can be divided into two groups (Fig. 1c). For the electrolytes with highly substituted HECs (DS = 2.5 and Mw = 90k and 720k), αi is relatively low (4–5 mV K−1) and close to the pure ionic liquid. The electrolytes with two low substituted HECs (DS = ∼1, Mw = 250k and 380k) show high apparent Seebeck coefficient (αi = 10–12 mV K−1). Interestingly, the molar conductivities of the HEC electrolytes are almost unchanged compared to pure IL (Fig. 1d, the molar conductivity of the electrolytes is shown in Fig. S1, ESI†). From the Stokes–Einstein relation, the molar conductivity of the ion is inversely proportional to the viscosity of the electrolyte.21 However, the viscosity of the electrolytes increases dramatically with the Mw of HEC, from 0.1 to 30 Pa s, i.e. by more than 300 times. The results of the ionic conductivity and viscosity can be explained by the free volume and obstruction theory, in which the microscopic viscosity dominates the mass transport of the ions.22 In this transport model, ions do not encounter and interact with the polymers during their transport because there is a high load of ionic liquid in those gels.23
2.2. Humidity dependence of apparent Seebeck coefficient αi
The puzzling results suggested that the apparent ionic Seebeck coefficient αi could vary significantly only due to the hygroscopicity of HEC, since it has a one-to-one correlation with the DS. This pushed us to revisit our protocol for measuring the ionic Seebeck coefficient. We measured on a thin film of the electrolyte exposed to air in a lateral geometry (Fig. 2a) and compared to measurements on the same thin film after encapsulation with a polyimide tape (Fig. 2b). For the film exposed to air, we could thus expect an atmospheric effect from the thermodynamic equilibrium between the absorbed water in the electrolyte and the water in vapor phase, as there is a large interfacial area between the atmosphere and the electrolyte. The conductivity of the ionic liquid cellulosic electrolytes increases linearly with relative humidity (RH) from ∼1.5 mS cm−1 at 10% RH to ∼6 mS cm−1 at 100% RH (Fig. 2c). This indicates that water molecules from the humid atmosphere are absorbed into the IL-HEC films. The increase of ionic conductivity is likely due to the enhancement of the diffusion coefficients of the ions and/or the dissociation of neutral ions pairs facilitated by the absorbed water.14,15 In comparison to the pure ionic liquid, the composites with HEC displays an even larger rate of increase of conductivity vs. %RH, which is surprising since there is only 2 wt% of HEC in the cellulosic electrolytes. This could be due to the preferred interaction (through H-bonds) between water and HEC compared to that of water with the ionic liquid.24 The apparent Seebeck coefficient of IL-HEC(250k) increased with RH and reached a maximum value of 13 mV K−1 at around RH = 40%, after which it decreases for higher humidity levels (Fig. 2d). In contrast, αi of the other gel electrolyte IL-HEC(90k) displays a monotonic raise from below 1 mV K−1 at 10% RH to 12 mV K−1 at 70% RH.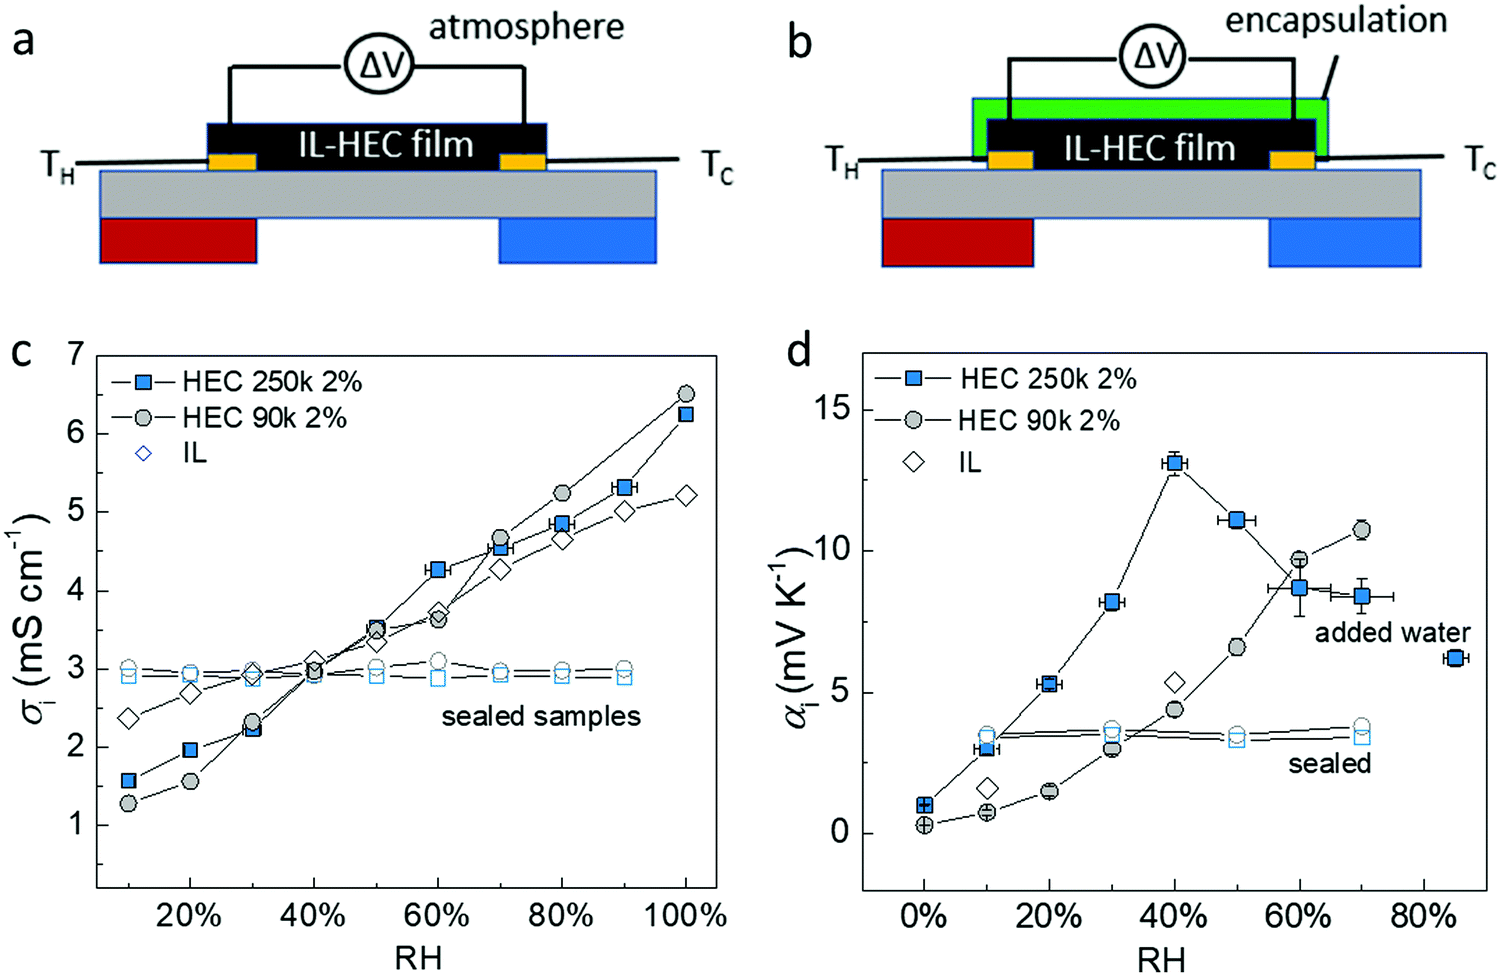 | ||
| Fig. 2 Architecture of the measurement setup (a) without encapsulation layer, and (b) with encapsulation layer. The effect of humidity (water) for (c) the conductivity and (d) apparent Seebeck coefficient of sealed and open electrolytes with HEC 250k, HEC 90k and only IL. | ||
The role of water absorption from the atmosphere to the IL-HEC gel film was also investigated by the addition of an encapsulation layer on samples in equilibrium at room humidity (40% RH). As shown in Fig. 2c (open label), the conductivity of the sealed IL-HEC(250k) and IL-HEC(90k) are similar regardless of the environmental humidity, which shows that sealing successfully prevented water exchange between the electrolyte and the atmosphere. The sealed thin films of IL-HEC(250k) and IL-HEC(90k) have similar Seebeck coefficients around 3 to 4 mV K−1 regardless of the RH (Fig. 2d). This corresponds to the true ionic Seebeck coefficient of the IL-HEC gels with a certain amount of absorbed water obtained at 40% RH atmosphere. Importantly, we observed the same conductivity value of 3 mS cm−1 for IL-HEC films that are exposed to the 40% RH atmosphere and encapsulated (at 40% RH), which indicates that the water concentration and distribution in the films with and without encapsulation is the same. On the contrary, the encapsulated (at 40%) IL-HEC(250k) and IL-HEC(90k) films both possess an ionic Seebeck coefficient of 3.5 mV K−1; while the apparent Seebeck coefficient of the non-encapsulated samples measured at 40% RH are significantly different: 13.2 mV K−1 for IL-HEC(250k), 4.7 mV K−1 for IL-HEC(90k) and 5.2 mV K−1 for the pure IL. These striking differences demonstrate that other phenomena are interfering with the measurement of the ionic Seebeck coefficient. When the gel electrolyte film is subjected to a temperature difference, water might evaporate at the hot electrode and condense at the cold side, which would lead to a water concentration difference. This could affect the Seebeck coefficient as several studies reported on electric potential difference from water concentration gradient in ionically charged systems25 and ion concentration difference across ion selective membranes, so called hydrovoltaics.26 In sealed samples, water cannot evaporate or be absorbed along the temperature gradient, and the measured thermovoltage is caused by the thermodiffusion of ions and water molecules, which is similar for the two gel electrolytes IL-HEC(250k) and IL-HEC(90k). Hence, the observed difference in the apparent Seebeck coefficient comes from another phenomenon than the thermoelectric effect. Thus, for the films open to the atmosphere, we cannot use the term “ionic Seebeck coefficient”, which is only valid for the encapsulated electrolytes. This is the reason we used the name “apparent Seebeck coefficient αi” for the quantity measured as the thermo-induced voltage coefficient ΔV/ΔT for the open films, which in the first approximation can be seen as the sum of the ionic Seebeck coefficient Si (of the sealed samples) and an hydrovoltaic voltage ΔVhydro contribution:
 | (1) |
2.3. Water absorption and evaporation
Our hypothesis is that the extra voltage obtained for samples in equilibrium with the humid atmosphere is related to the difference in rate of absorption and desorption at the cold and hot sides. This would lead to a water concentration gradient along the temperature gradient, which impacts the ionic distribution and triggers an extra voltage response. To further understand this effect, we measured the amount of water loss in three different electrolytes (IL-HEC(250k) gel and IL-HEC(90k) gel and pure IL) upon heating at different temperatures (Fig. 3a). In 40% RH atmosphere, the three electrolytes experience similar water losses between 27 to 42 °C (weight measured at steady state). A total free water content of 11% was estimated by heating the electrolytes at 110 °C. Note that water trapped and bonded to molecules might remain even at elevated temperatures. Fig. 3b shows the ionic conductivities for both electrolyte films with and without encapsulation at 40% RH atmosphere and temperatures between 22 to 42 °C (15 min temperature steps to reach steady state). The encapsulated samples (open symbols) exhibited a rise in conductivity with temperature due to the thermally activated transport of the ions, while the films in equilibrium with the atmosphere (solid symbols) showed decreasing conductivity because of water evaporation. This result shows that the hygroscopicity of the two different types of HEC 250k and 90k with different DS had no impact on the steady state equilibrium. However the dynamics of evaporation/absorption is different as indicated in Fig. 3c, where the time resolved conductivity responses of the IL-HEC(250k) and the IL-HEC(90k) gels without encapsulation upon a heating/cooling cycle are shown. The conductivity of both electrolytes increased immediately after the temperature rise due to the thermally activated ionic transport. After a while, the conductivity of the electrolytes decreased due to the evaporation of water which diminished the mobility of the ions or trigger the reformation of ion-pairs. IL-HEC(90k) with high DS seems to undergo a slower kinetics of evaporation/absorption of water compared to IL-HEC(250k) with low DS. This suggests that the interaction of water with the HEC has an effect on the kinetics of equilibrium of water desorption/absorption in the IL-HEC gels (water adsorbed on HEC vs water in the IL medium).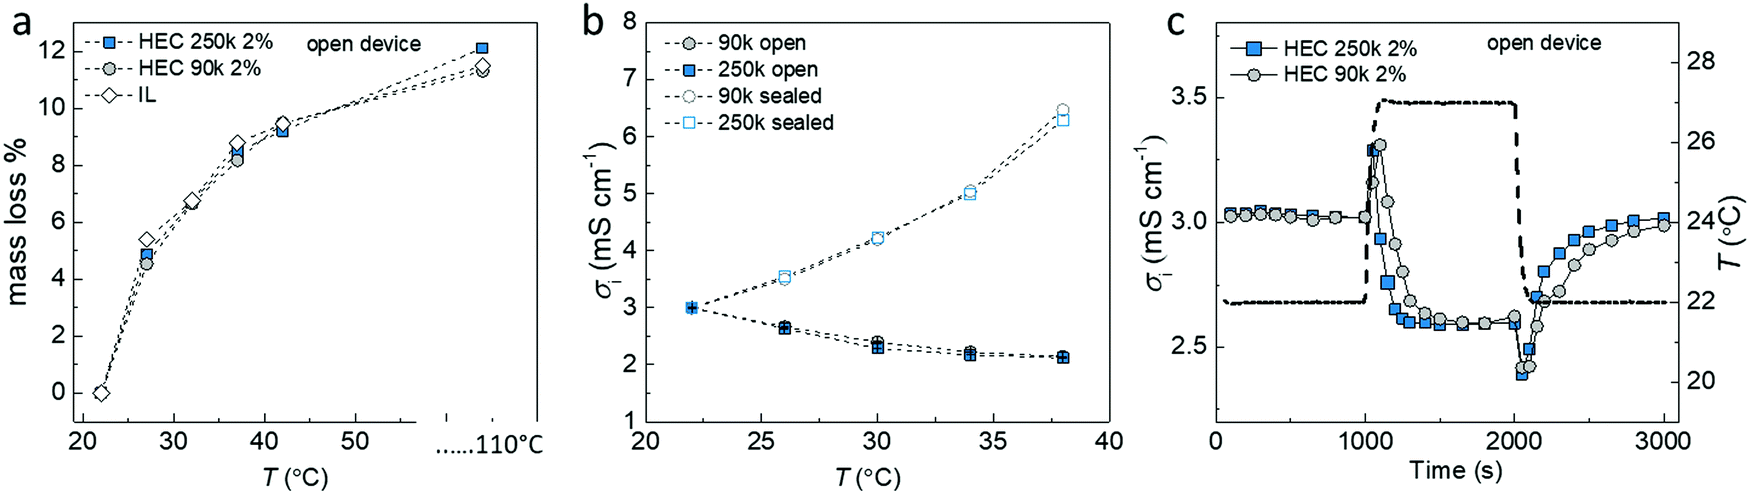 | ||
| Fig. 3 Temperature dependence of electrolyte properties. (a) Relative mass loss at elevated temperatures due to water evaporation from electrolytes of different compositions (HEC 250k 2 wt%, HEC 90k 2 wt% and without HEC). (b) The saturated conductivity of IL-HEC (250k) and IL-HEC (90k) at different temperatures. (c) The conductivity of electrolytes with HEC 250k and HEC 90k changes with time when temperature increased and decreased. | ||
2.4. Water concentration gradient
As the rate of water absorption/evaporation varies with the DS of the HEC in the ionic liquid cellulosic gels, we expect differences in the water concentration profiles of the IL-HEC(90k) with DS = 2.5 and the IL-HEC(250k) with DS = 1.2 gels under a temperature gradient when exposed to the atmosphere. To probe this, we designed devices with an array of parallel electrodes perpendicular to the temperature gradient with 1 mm separation. This allows for conductivity measurements along the temperature gradient (Fig. 4), which can serve as a probe indicative of the local concentration of water in the film (as found in Fig. 3b and c). First, we performed reference measurements without a temperature gradient for both sealed and open structures. Fig. 4a and b display the conductivity of the two gel electrolytes measured between the arrays of electrodes. The conductivity across the whole array is similar for the encapsulated and open structures (at 40% RH) since the temperature is uniform (22 °C) and the water content is uniform. Next, we heated one side of the electrode array to 34 °C while the other side was kept at 22 °C to induce a linear temperature gradient. The conductivity profiles of the encapsulated IL-HEC(90k) and IL-HEC(250k) gels (Fig. 4c) show enhanced conductivity at the hot side, revealing the thermally activated ion transport (seen in Fig. 3c). The same measurement was carried out for the electrolytes exposed to atmosphere (40% RH) (Fig. 4d). This measurement is different from that in Fig. 3, where the systems reach equilibrium state. The continuous evaporation at the hot side and condensation at the cold side could introduce different impact to the conductivity of the electrolytes. As shown in Fig. 4d, the conductivity of IL-HEC(90k) barely changed from the hot to cold side. This indicates that the water evaporation induced at the hot side, which should reduce the ionic mobility, compensates the effect of thermal activation of the ionic transport (seen in the sealed samples). Meanwhile, the impact of water evaporation is amplified in IL-HEC(250k) since the conductivity decreases to 2 mS cm−1 at the hot side compared to 3 mS cm−1 at 22 °C uniform temperature. Also, the cold side, although fixed at 22 °C, displays a conductivity increases to 4 mS cm−1. This could be associated with a condensation that enriches the cold part of the film with absorbed water, thus resulting in a raise in ionic mobility and conductivity. Note that the local surface temperature on the film was likely underestimated, since it was measured on the substrate instead of the electrolyte. The local temperature on the surface of the electrolyte could be affected by the endothermic interfacial evaporation or exothermic condensation at the hot and cold sides, respectively. The results in Fig. 4d indicate that a larger water concentration gradient can be formed in IL-HEC(250k) film than in IL-HEC(90k) when exposed to a temperature gradient with open surface. It is only possible if the rate of water evaporation/absorption of IL-HEC(250k) is larger than that of IL-HEC(90k), which is consistent with the finding in Fig. 3b. | ||
| Fig. 4 The conductivity of different electrolytes along temperature gradients. The conductivity of electrolytes (a) at uniform temperature and (c) along temperature gradient across the sealed device. The conductivity of electrolytes (b) at uniform temperature and (d) along a temperature gradient across the open device. | ||
2.5. Discussion of water interaction in the gel electrolytes
The faster kinetics of the vapor–liquid equilibrium in IL-HEC(250k) compared to IL-HEC(90k) is surprising, since the gels are mostly composed of ionic liquid (98 wt%). It suggests that the water absorption kinetics between the vapor and liquid phases is rapid, and that the slowest mechanism relates to the dynamics of water interaction (adsorption/desorption) with HEC in the ionic liquid medium. Hence, the state of water as unbound (free liquid water molecules) or as water molecules trapped/bond to HEC appears to be important, not only for the thermodynamic equilibrium, but also for the kinetics of the equilibrium. To reveal the amount of water and its state in the IL-HEC electrolytes, we turned to FTIR spectroscopy of electrolytes with increasing amount of HEC 90k and 250k. The stretching absorption of OH between 3600 cm−1 and 3400 cm−1 are from both HEC and water in the electrolytes, however, the bending absorption at 1650 cm−1 can be typically used as characteristic peak for water. As shown in Fig. 5a, the intensity of the OH bending peak in IL-2 wt% of HEC(250k) is higher compared to that of IL-HEC(90k), which is almost the same as for the IL without HEC. This proves that HEC with low DS has a larger impact on water absorption due to the higher hygroscopicity.20 The extra water content in IL-HEC(250k) is most likely bonded with HEC, since it does not contribute to the total water loss during heating as shown in Fig. 3. Moreover, the water content in the electrolytes increases with the increasing amount of HECs, as shown in Fig. S2 (ESI†). This agrees with the increasing intensity of the OH stretching peak in Fig. 5b and c. However, we observed that the OH groups experienced different interaction with increasing amount of HEC 90 k and 250 k. The peak position of the OH stretching absorption is sensitive to the formed hydrogen bonds, which usually shift to lower frequency for strong H-bonds and towards higher frequency for weak H-bonds.7 As shown in Fig. 5b and c, when no HEC was added into the IL, the OH stretching peak is from the absorbed water in IL that mainly forms weak H-bonds with the ions or other water molecules. After addition of HEC with additional hydroxyl groups from both the main chain and the side glycol chains of HEC, the H-bonds becomes complicated. Fig. 5b shows that the strong H-bonds starts to increase monotonically and becomes the dominant peak by adding HEC 90k. For electrolytes containing HEC 250k (Fig. 5c), weak H-bonds still dominates for smaller percentage of HEC (below 2 wt%) and the strong H-bonds takes over after 4% of HEC. Since the HEC 250k has a stronger capability to bond with water than HEC 90k, the observed strong H-bonds in IL-HEC(90k) are mostly likely from the interaction between the OH groups of the HEC. This is reasonable when a large amount of the OH from the anhydtroglucose has been substituted by long and flexible glycols that easier form inter-molecular H-bonds. For IL-HEC(250k), the weak H-bonds are mainly from the interaction with water, since they have less amount of glycol substitutions. Only when the amount of HEC 250k exceeds 4%, the OH from the HEC starts to bond with each other instead of water, which leads to the increase of low frequency absorption in Fig. 5c. This can be confirmed by the increasing shoulder above 3600 cm−1, which is assigned to unbonded water desorbed by the intermolecular HEC-HEC interchain interactions releasing free water molecules. The observations in the FTIR spectroscopy of different electrolytes are in agreement with the water loss results in Fig. 3. Although there is clearly more water content in the IL-HEC(250k) than in the IL-HEC(90k) and the pure IL, the amount of water loss is still similar upon heating. This is because the extra water in IL-HEC(250k) interacts with HEC and does not easily evaporate away at elevated temperature. However, due to the larger amount of water content in IL-HEC(250k), the water evaporation/absorption rate could be promoted as shown in Fig. 3b.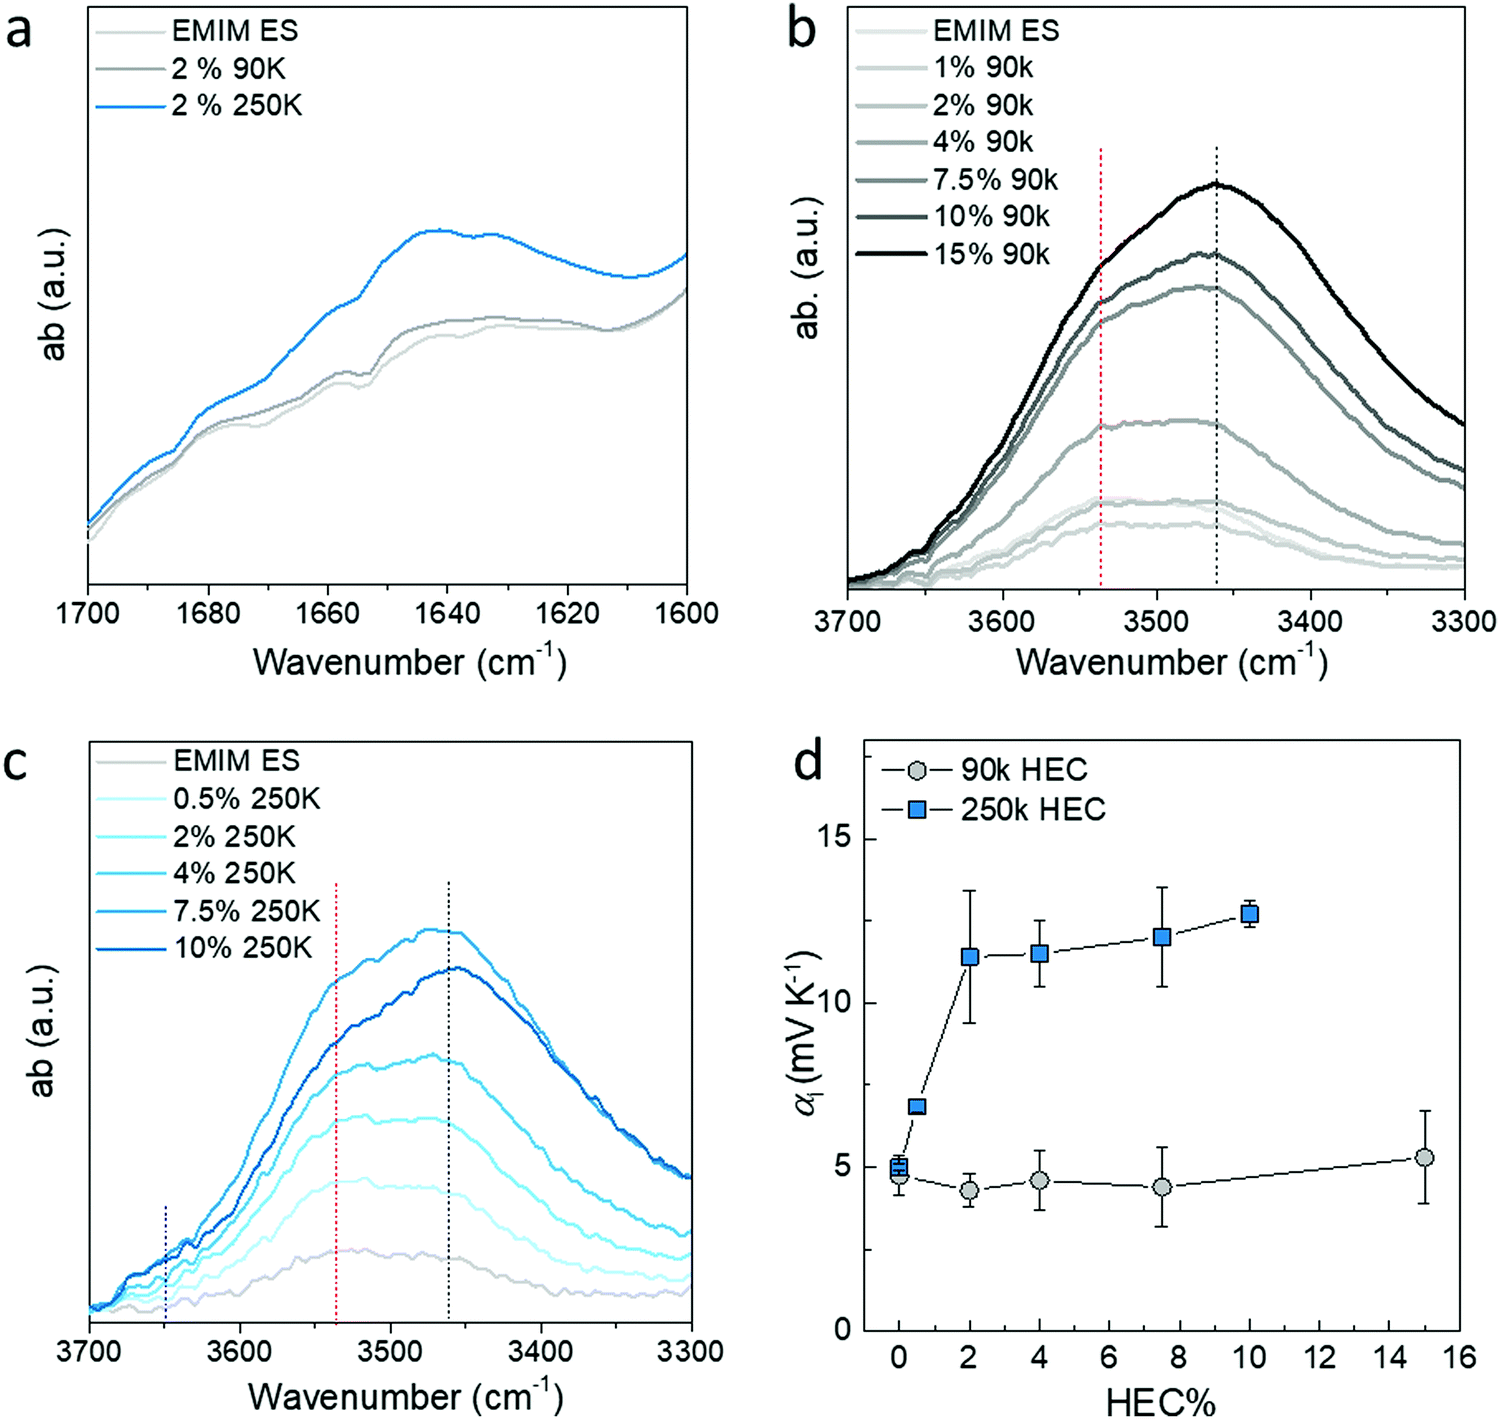 | ||
| Fig. 5 Characteristic adsorption from water and HEC in EMIM ES/HEC electrolytes. (a) The comparison of the OH bending from water in 2% of HEC 90k and 250k electrolytes. (b) The OH stretching peak for different amounts of HEC 90k and (c) HEC250k. (d) The Seebeck coefficient of electrolytes with increasing amount of HEC 90k and 250k at room humidity (RH = 40%). | ||
We have previously studied the thermo-induced voltage with respect to water content as a consequence of humidity (Fig. 2); now we further investigate the correlation between the water interaction with HEC and the apparent Seebeck coefficient by adding more HEC. HEC 250k with DS = 1.2 carries more bound water molecules than HEC 90k with DS = 2.5. When a small amount of HEC 250k was added into the ionic liquid at 40% RH, the Seebeck coefficient increased fast, and saturated already at 2 wt% of HEC in the ionic liquid (Fig. 5c). For the less hydrophilic HEC 90k with little bound water, the apparent Seebeck coefficient at 40% RH remains constant and close to the pure IL (∼5 mV K−1), which is expected since HEC 90k does not bring much water into the electrolyte. This also explains why the evolution of the apparent Seebeck coefficient is similar for the IL-HEC(90k) compared to the pure IL when the humidity level increases, as the absorbed water does not interact with HEC 90k, but stays within the ionic liquid. The case of HEC 250k is different, since it brings bounded water into the electrolytes, which could likely accelerate the total water evaporation and adsorption during heating and cooling. The hydrovoltaic voltage upon measuring the apparent Seebeck coefficient is thus enhanced for the HEC 250k in comparison to that of the HEC 90k. The apparent Seebeck coefficient for IL-HEC(250k) increases rapidly with small amounts of HEC and stabilizes after 2% of HEC due to the saturation of the HEC–water interaction.
We summarize the discovery with a hypothesis of the Gibbs energy for the transfer of water from the ionic liquid to the adsorbed or bounded state in HEC (Fig. 6). As illustrated in Fig. 6a, the first step (i) is the absorption of water from the atmosphere into the electrolytes, which is dominated by the ionic liquid (98 wt%). Since the electrolytes are mostly composed of IL, this step can be considered similar for IL-HEC(90k) and IL-HEC(250k). The second step (ii) is the adsorption of water from the ionic liquid medium onto the HEC chains via H-bonds. Here, the DS of HEC 90k and 250k plays an important role since it is related to the possibility for forming H-bonds, as the substitution of OH with glycol reduced the ability to form H-bonds with water.20 This last step is tentatively described by a Gibbs energy diagram (Fig. 6b) with reaction coordinates corresponding to the absorption of water on the HEC chains. The energy level of water absorbed on HEC 250k is lower than on HEC 90k to translate the availability of more hydroxyl groups to bound water by H-bonds. To explain the fastest kinetic of evaporation and absorption found in IL-HEC(250k), we plot a smaller activation energy of the absorption and desorption with HEC 250k compared to HEC 90k.
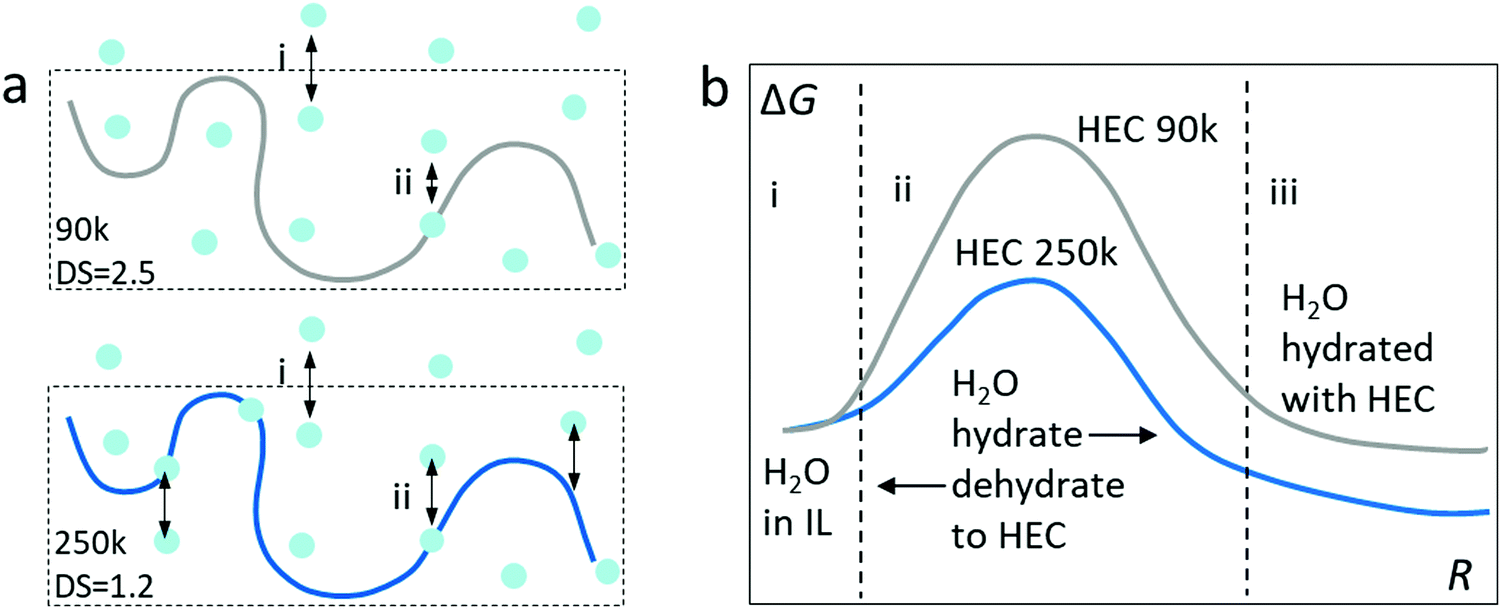 | ||
| Fig. 6 Illustration of the possible mechanism for hydration and dehydration in electrolytes with different HECs. (a) The two steps of water absorption into the electrolytes containing HEC 90k (top) and HEC 250k (bottom). (b) The Gibbs energy of hydration/dehydration in IL with HEC 90k and 250k. | ||
2.6. Ionic thermoelectric supercapacitors
After investigating the apparent Seebeck coefficient in the ionic liquid electrolytes with different HECs, we explored the heat to electricity conversion using the ionic thermoelectric supercapacitors4a by combining the IL-HEC electrolytes with two types of electrodes. Large capacitance electrodes are required to enable storage of enough charges when the supercapacitor is charged by the voltage induced by the electrolyte. Activated carbon nanoparticles and Au nanowires (AuNWs) were chosen as large surface area electrodes (morphology of the electrodes is shown in Fig. S3, ESI†). The ionic liquid cellulosic gel is applied as a layer on the two electrodes in a configuration that exposes the electrolyte film to the atmosphere as depicted in Fig. 2a. The device is thus going to use the full open circuit voltage including the ionic Seebeck effect and the hydrovoltaic effect. From the thermovoltage versus temperature difference results shown in Fig. S4a and b (ESI†), the apparent Seebeck coefficient of devices with AuNWs is 2.2 mV K−1 for electrolytes contains HEC 90k and 2.6 mV K−1 for the one with HEC 250k. The reduced Seebeck coefficient is due to the additional temperature dependent interface effect27 on the non-neutral surface of AuNWs. This interfacial potential effect in the temperature gradient is even more pronounced with carbon electrodes, for which the Seebeck coefficient shows a negative sign (−0.51 mV K−1 for HEC 90k and −0.32 mV K−1 for HEC 250k, Fig. S4c and S4d, ESI†). This strong interfacial effect is associated to negatively charged carboxylic groups on the activated carbon surface, which induces a Donnan potential at the electrode/electrolyte interface, leading to a negative Seebeck coefficient under a temperature gradient.27 Although the thermodiffusion of the ions is not affect by the electrode materials, the overall thermovoltage of the device can be dominated by the electrode's potential. Hence, the temperature dependent coefficient (αD) in the energy harvesting device includes several mechanisms, which in first approximation can be presented as: | (2) |
The stored energy E is given by:
 | (3) |
Importantly, as the water concentration gradient enhanced thermovoltage is higher in electrolytes containing HEC 250k than for HEC 90k, the value of the thermovoltage is larger for HEC 250k when the sign is positive (AuNWs), and larger for HEC 90k when the sign is negative (carbon).
Fig. 7a and b display the generated thermal induced electrical current of the optimized devices with different electrodes over a load resistance (currents from all four combinations are shown in Fig. S5, ESI†). Since the load resistance is connected in the circuit all the time, the magnitude of the measured current depends on the thermal-induced potential between the two electrode and the capacitance of the electrodes. Although the thermovoltage for the supercapacitors is higher with AuNWs than with carbon, the capacitance is much larger for the carbon electrodes. As shown in Fig. S6a (ESI†), the area capacitance for the carbon electrode is around 80 mF cm−2, while the value for AuNW electrode is only 0.2 mF cm−2. Hence, the transferred charge during the charge and discharge processes (the integration of measured current) is obviously much large for carbon devices compare to Au NWs devices (Fig. S7b, ESI†). The stored energy can be calculated by multiplying the transferred charge and the open circuit thermovoltage. As shown in Fig. 6c, the stored energy in all devices increases quadratically with ΔT, in accordance with eqn (3). The highest energy is for the device composed of carbon electrodes and HEC 90k because of the large capacitance and relatively high Seebeck coefficient. It is important to notice that devices with carbon electrodes have negligible leaking current, presented by the similar amount of charge transfer from the charge and discharge processes (Fig. S6b, ESI†). Despite the small thermal voltage in this demonstration device, the symmetric output current upon intermittent heating could be used to charge large capacitor as an AC power supplier (as demonstrated in Fig. S7, ESI†). The output voltage of the device can be enhanced by changing the parallel connected capacitors to series connection configuration.
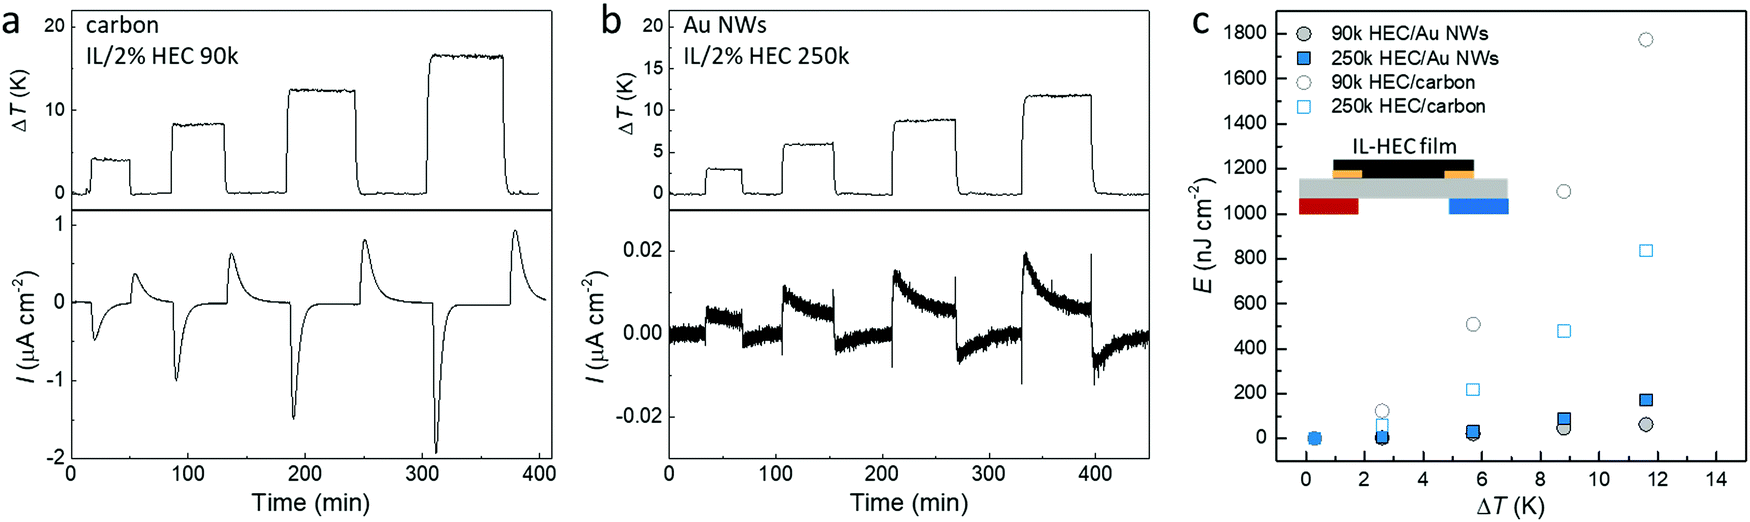 | ||
| Fig. 7 The demonstration of thermal energy conversion using IL-HEC composite electrolytes. (a) The generated current through a load resistance of 1000 Ω during temperature cycling from an ionic thermoelectric devices composed of IL-HEC(90k) electrolyte and carbon electrodes. (b) The generated current through a load resistance of 1000 Ω during temperature cycling from an ionic thermoelectric devices composed of IL-HEC(250k) and AuNW electrodes. (c) The stored energy density from the devices during the charge and discharge processes at different temperature differences (Rload = 1000 Ω). | ||
3. Conclusions
The Seebeck coefficient of polymeric electrolytes based on ionic liquid and hydroxyl cellulose was systematically investigated in this work. We found out that small amounts of adsorbed water from ambient atmosphere plays an important role for the thermoelectric performance of even non-aqueous electrolytes. We found out that the water vapor–liquid equilibrium is crucial when measuring the ionic Seebeck coefficient and that encapsulation is required. Without encapsulation, an extra hydrovoltaic voltage is generated and it can be considered as a new strategy to store more electricity in the ionic thermoelectric supercapacitors. Our work proposes a reasonable mechanism for the extraordinary ionic thermoelectric effect in complex polymeric electrolyte films, underlining that other effects than the ionic Seebeck effect can come into play during the measurements. For practical application of ionic thermoelectric devices, manufacturing is of great importance. Our strategy of making gels of very different viscosity with various HECs enables the adaptation of inks for the use in various printing technologies for the fabrication of ionic thermopiles or ionic thermoelectric supercapacitors.4. Experimental section
4.1. Device fabrication
All the chemicals (hydroxyl cellulose and 1-ethyl-3-methylimidazolium ethyl sulfate) were purchased from Sigma Aldrich. Glass wafers were ultrasonicated in soap water followed by deionized (DI) water for 5 min each. They were rinsed with DI water, acetone and isopropanol and dried by blowing N2 stream, then baked at 130 °C in oven for 30 min. Plastic shadow masks were used to evaporated 5 nm Cr and 30 nm Au electrodes on the clean glass. Active carbon layer were applied onto the prepared Au electrodes via a brush, and dried in oven at 60 °C for 30 minutes. The thickness of the active carbon layer is around 80 μm.To prepare the polymeric electrolytes, 1-ethyl-3-methylimidazolium ethyl sulfate ([EMIM][ES]) was mixed with certain amounts of hydroxyethyl cellulose, the mixtures were heated to 110 °C on a hotplate until becoming uniform. The electrolyte with a thickness of about 200 μm was applied onto the electrodes via a brush on the electrodes.
4.2. Characterization
The impedance measurements were carried out using an impedance spectrometer (Alpha high-resolution dielectric analyzer, Novocontrol Technologies GmbH, Hundsangen, Germany). An AC voltage of 10 mV was applied while sweeping the frequency.The thermoelectric measurements were performed in a home-built setup. The temperature was controlled by two Peltier elements via a Labview program, and the temperature difference between two electrodes was monitored using a thermocouple simultaneously. The open-circuit voltage generated by the devices was measured using a Keithley 2182A nanovoltmeter set to auto-range. The temperature cycles were applied through a Labview program. Open-circuit voltage measurements throughout this work were done under cleanroom humidity of 38% to 40% unless otherwise stated. To study the effect of humidity on the response of the devices, the humidity inside a chamber was controlled to by purging of N2 and water vapor.
Conflicts of interest
There are no conflicts to declare.Acknowledgements
The authors thank the Knut and Alice Wallenberg Foundation (proof of concept “Hi-VAE”), Swedish Research Council VR 2016-05990 and 2018-04037, Wallenberg Wood Science Center, Advanced Functional Materials Center at Linköping University (2009-00971), Vinnova for the Digital Cellulose Competence Center (DCC), Diary number 2016-05193. Swedish Foundation for Strategic Research (“0-3 D”), Treesearch, Jakob Nilsson and Ligna Energy AB for the support in the activated carbon formulation.References
- (a) G. J. Snyder and E. S. Toberer, Nat. Mater., 2008, 7, 105 CrossRef CAS PubMed; (b) F. Zhang, Y. Zang, D. Huang, C. Di and D. Zhu, Nat. Commun., 2015, 6, 8356 CrossRef CAS; (c) O. Bubnova, Z. U. Khan, A. Malti, S. Braun, M. Fahlman, M. Berggren and X. Crispin, Nat. Mater., 2011, 10, 429 CrossRef CAS; (d) S. R. Forrest and M. E. Thompson, Chem. Rev., 2007, 107, 923 CrossRef CAS; (e) Y. Xuan, X. Liu, S. Desbief, P. Leclère, M. Fahlman, R. Lazzaroni, M. Berggren, J. Cornil, D. Emin and X. Crispin, Phys. Rev. B: Condens. Matter Mater. Phys., 2010, 82, 115454 CrossRef; (f) G.-H. Kim, L. Shao, K. Zhang and K. P. Pipe, Nat. Mater., 2013, 12, 719 CrossRef CAS.
- L. I. Schwartz and H. J. Shure, Presented at the Fifty-Eight National Meeting of the American Institute of Chemical Engineers Philadelphia, Survey of electric power plants for space applications Pennsylvania, December, 1965.
- (a) D. Champier, Energy Convers. Manage., 2017, 140, 167 CrossRef; (b) O. H. Ando, A. L. O. Maran and N. C. Henao, Renewable Sustainable Energy Rev., 2018, 91, 376 CrossRef.
- (a) D. Zhao, H. Wang, Z. U. Khan, C. Chen, R. Gabrielsson, M. P. Jonsson, M. Berggren and X. Crispin, Energy Environ. Sci., 2016, 9, 1450 RSC; (b) S. L. Kim, H. T. Lin and C. Yu, Adv. Energy Mater., 2016, 6, 1600546 CrossRef; (c) H. Wang, D. Zhao, Z. U. Khan, S. Puzinas, M. P. Jonsson, M. Berggren and X. Crispin, Adv. Electron. Mater., 2017, 3, 1700013 CrossRef.
- (a) N. S. Hudak and G. G. Amatucci, J. Electrochem. Soc., 2001, 158, 572–579 CrossRef; (b) W. Kobayashi, A. Kinoshita and Y. Moritomo, Appl. Phys. Lett., 2015, 107, 073906 CrossRef.
- (a) X. He, H. Cheng, S. Yue and J. Ouyang, J. Mater. Chem. A, 2020, 8, 10813 RSC; (b) T. Li, X. Zhang, S. D. Lacey, R. Mi, X. Zhao, F. Jiang, J. Song, Z. Liu, G. Chen, J. Dai, Y. Yao, S. Das, R. Yang, R. M. Briber and L. Hu, Nat. Mater., 2019, 18, 608 CrossRef CAS PubMed; (c) B. Kim, J. U. Hwang and E. Kim, Energy Environ. Sci., 2020, 13, 859 RSC; (d) B. Kim, J. Na, H. Lim, Y. Kim, J. Kim and E. Kim, Adv. Funct. Mater., 2018, 1807549 Search PubMed; (e) H. Cheng, X. He, Z. Fan and J. Ouyang, Adv. Energy Mater., 2019, 9, 1901085 CrossRef.
- (a) D. Zhao, S. Fabiano, M. Berggren and X. Crispin, Nat. Commun., 2017, 8, 14214 CrossRef CAS; (b) D. Zhao, A. Martinelli, A. Willfahrt, T. Fischer, D. Bernin, Z. U. Khan, M. Shahi, J. Brill, M. P. Jonsson, S. Fabiano and X. Crispin, Nat. Commun., 2019, 10, 1093 CrossRef.
- S. L. Kim, J.-H. Hsu and C. Yu, Org. Electron., 2018, 54, 23 Search PubMed.
- D. A. Walker, B. Kowalczyk, M. O. de la Cruz and B. A. Grzybowski, Nanoscale, 2011, 3, 1316 RSC.
- F. Jiao, A. Naderi, D. Zhao, J. Schlueter, M. Shahi, J. Sundstrom, H. Granberg, J. Edberg, U. Ail, J. Brill, T. Lindstrom, M. Berggren and X. Crispin, J. Mater. Chem. A, 2017, 5 Search PubMed.
- E. D. Eastman, J. Am. Chem. Soc., 1928, 50, 283 CrossRef CAS.
- A. Noda, K. Hayamizu and M. Watanabe, J. Phys. Chem. B, 2001, 105(20), 4603 CrossRef CAS.
- H. Jia, X. Tao and Y. Wang, Adv. Electron. Mater., 2016, 2, 160013 Search PubMed.
- E. Rilo, J. Vila, S. García-Garabal, L. M. Varela and O. Cabeza, J. Phys. Chem. B, 2013, 117, 1411 CrossRef CAS PubMed.
- F. Zhao, Y. Guo and X. Zhou, Nat. Rev. Mater., 2020, 5, 388 CrossRef.
- (a) M. Girayhan Say, R. Brooke, J. Edberg, A. Grimoldi, D. Belaineh, I. Engquist and M. Berggren, npj Flexible Electron., 2020, 4, 14 CrossRef; (b) R. Brooke, J. Edberg, M. Girayhan Say, A. Sawatdee, A. Grimoldi, J. Åhlin1, G. Gustafsson, M. Berggren and I. Engquist, Flexible Printed Electron., 2019, 4, 015006 CrossRef CAS.
- Y. S. Ye, J. Rick and B. J. Hwang, J. Mater. Chem. A, 2013, 1, 2719 RSC.
- E. D. Klug, J. Polym. Sci., Part C: Polym. Symp., 1971, 36, 491 CrossRef.
- J. A. Widegren, E. M. Saurer, K. N. Marsh and J. W. Magee, J. Chem. Thermodyn., 2005, 37, 569 CrossRef CAS.
- E. D. Klug, J. Polym. Sci., Part C: Polym. Lett., 1971, 36, 491 CrossRef.
- S. Pu, Y. Liao, K. Chen, J. Fu, S. Zhang, L. Ge, G. Conta, S. Bouzarif, T. Cheng, X. Hu, K. Liu and J. Chen, Nano Lett., 2020, 20, 3791 CrossRef CAS PubMed.
- A. Voronel, E. Veliyulin, V. S. Machavariani, A. Kisliuk and D. Quitmann, Phys. Rev. Lett., 1998, 80, 2630 CrossRef CAS.
- M. S. Mendolia and G. C. Farrington, Chem. Mater., 1993, 5, 174 CrossRef CAS.
- T. Steiner, Angew. Chem., Int. Ed., 2002, 41, 48 CrossRef CAS.
- X. M. Liu, H. Y. Gao, J. E. Ward, X. R. Liu, B. Yin, Ti. D. Fu, J. H. Chen, D. R. Lovley and J. Yao, Nature, 2020, 578, 551 Search PubMed.
- Y. D. Wu, W. W. Xin, X. Y. Kong, J. J. Chen, Y. C. Qian, Y. Sun, X. L. Zhao, W. P. Chen, L. Jiang and L. P. Wen, Mater. Horiz., 2020, 7, 2702 RSC.
- S. Mardi, D. Zhao, N. Kim, I. Petsagkourakis, K. Tybrandt, A. Reale and X. Crispin, Adv. Electron. Mater., 2021, 210056 Search PubMed.
Footnote |
| † Electronic supplementary information (ESI) available. See DOI: 10.1039/d1tc04466d |
| This journal is © The Royal Society of Chemistry 2022 |