
 Open Access Article
 This Open Access Article is licensed under a
 Creative Commons Attribution 3.0 Unported Licence
Enhanced mechanical performance and wettability of PHBV fiber blends with evening primrose oil for skin patches improving hydration and comfort†
Łukasz
Kaniuk
 a,
Agnieszka
Podborska
b and
Urszula
Stachewicz
*a
a,
Agnieszka
Podborska
b and
Urszula
Stachewicz
*a
aFaculty of Metals Engineering and Industrial Computer Science, AGH University of Science and Technology, Cracow, Poland. E-mail: ustachew@agh.edu.pl
bAcademic Centre for Materials and Nanotechnology, AGH University of Science and Technology, Cracow, Poland
First published on 7th March 2022
Abstract
The growing problem of skin diseases due to allergies often causing atopic dermatitis, which is characterized by itching, burning, and redness, constantly motivates researchers to look for solutions to soothe these effects by moisturizing skin properly. For this purpose, we combined poly(3-hydroxybutyrate-co-3-hydroxyvalerate) (PHBV) electrospun fibers with evening primrose oil (EPO) into a system of patches to ensure skin hydration. Moreover, the dressing or patch application requires appropriate stretchability and wettability of the electrospun material. Thus, we examined the mechanical properties of the PHBV blend with EPO, as well as changes in wettability of the fiber surface depending on the share of EPO additive in the blend. The effectiveness of the patches has been characterized using the water vapor transmission rate as well as by the skin moisturizing index. The thermal insulation effect of the patches on human skin has been verified as well. The patches made by combining the polymer with natural oil showed enhanced mechanical properties and increased skin hydration, indicating the potential applicability of PHBV-based patches. The presented discovery of PHBV patches with EPO is a prospective and alternative treatment for patients for whom current state-of-the-art methods do not bring satisfactory results.
Introduction
The skin is the largest organ in humans, and its three layers collectively and individually work to protect all internal tissues and vital organs against daily environmental challenges. The skin also plays an important role in controlling water loss and regulating body temperature. Atopic dermatitis is associated with deficiencies in macro- and micronutrients.1 Evening primrose oil (EPO) is approved in many countries as a supportive treatment of atopic dermatitis.2 It has been reported to restore defective epidermal barriers, reduce excessive trans-epidermal water loss, and improve skin smoothness.3 EPO is a rich source of gamma-linolenic acid (γ-GLA), a substance that can be of great importance in the treatment of eczema. A deficiency of essential fatty acids in the skin is one of the factors of eczema.4,5 EPO is extremely high in linoleic acid (LA) (70–74%) and γ-linolenic acid (GLA) (8–10%), which can contribute to the proper functioning of human tissue because they are precursors of anti-inflammatory eicosanoids.6 Moreover, GLA has antibacterial properties, especially with respect to Staphylococcus aureus, which is a very common problem in patients with atopic dermatitis.2 Essential fatty acids (EFAs) are necessary for the proper functioning of the body. Linoleic acid belongs to the group of essential fatty acids. EFAs cannot be produced endogenously, and should therefore be obtained exogenously from food sources. Evening primrose oil is a good source of omega-6 fatty acids, which are EFAs.6,7For skin diseases, it is extremely important to relieve patients' pain caused by dry skin and itching. Wet dressings are commonly used to provide relief and protect against transepidermal water loss.8–10 In general, multifunctional skin patches should be soft, flexible, stress-resistant, and durable but easy to remove from the skin.11 There are many reports in the literature on the use of electrospun fibers for skin dressings.11–19 The high surface area of electrospun fibers affords enormous possibility for not only drug delivery but also as multifunctional bandages.20–22 Direct blending biocompatible polymers with natural oils to enhance the oil delivery for skin moisturization effects helps in maintaining the problematic skin, for example with eczema.23,24 Poly(3-hydroxybutyrate-co-3-hydroxyvalerate) is widely used as a biomaterial due to its high biocompatibility, biodegradability, but also high stability over time.25–29 As mentioned earlier, the dressings used on the skin should have adequate stretchability so as not to cause discomfort and be adequately durable. Unfortunately, PHBV-based materials have weaker mechanical properties compared to other biodegradable materials, e.g. PLA.30,31 Therefore, it is extremely important to improve the mechanical properties of PHBV, in particular, to increase flexibility and extensibility, which are crucial features for dressings. Fibrous PHBV membranes are also hydrophobic,28,32,33 so improving their wettability extends the application of PHBV as bandages.
Within this study, we want to achieve the effect of increasing the hydration of dry skin, that suffers from atopic dermatitis by delivering oil to the skin for 6 hours using electrospun PHBV patches with the desired mechanical properties. By moisturizing the skin, we want to provide comfort and reduce the risk of breaking down the skin barrier by germs or allergens for the patient, bringing relief for instance calming itching or reducing flare-ups that often occur in patients’ eczema. We developed a blend based on PHBV polymer and EPO to obtain electrospun membranes. We characterized the morphology, chemical composition, thermal and mechanical properties of these materials. Moreover, we investigated the wettability of modified fibers, water vapor and heat permeability, and skin hydration change in volunteers using the designed blend and PHBV patches. Previous studies indicated that the addition of oil in blend electrospinning reduces the wetting contact angle of the electrospun membrane.34 Importantly, our research has shown that by mixing natural oil with a biodegradable polymer, we are able to produce electrospun fibers for skin dressing or patch applications. In addition, when oil is added, the mechanical properties are significantly improved, and soaking of the PHBV-based membranes with additional oil for skin delivery is enhanced. The mechanical properties of blends are often correlated with the structural changes of electrospun materials, therefore we also perform the calorimetric studies for our electrospun membranes. We clearly demonstrate the advantages of blending PHBV with EPO for dressing applications increasing skin moisture and hydration.
Experimental
Electrospinning
PHBV fibers were prepared by electrospinning PHBV (8 wt%) solution in chloroform and N,N-dimethylformamide (DMF) (volume ratio 9![[thin space (1/6-em)]](https://www.rsc.org/images/entities/char_2009.gif) :1, Sigma Aldrich, UK) mixed within 4 h. Evening primrose oil (Oenothera biennis, OlVita, Poland) was mixed with the polymer solution (in proportions of 0.5 g and 1.0 g EPO) for 30 min just before electrospinning of PHBV, which was carried out at a temperature of T = 20 °C and humidity of RH = 40%. The positive voltage polarity (+17 kV) was applied to the stainless needle with an outer diameter of 0.8 mm and inner diameter of 0.5 mm, which was kept at a distance of 20 cm from the grounded collector. The polymer solution flow rate was 0.1 ml min−1 and the distance was maintained at 20 cm between the nozzle and the grounded collector.
:1, Sigma Aldrich, UK) mixed within 4 h. Evening primrose oil (Oenothera biennis, OlVita, Poland) was mixed with the polymer solution (in proportions of 0.5 g and 1.0 g EPO) for 30 min just before electrospinning of PHBV, which was carried out at a temperature of T = 20 °C and humidity of RH = 40%. The positive voltage polarity (+17 kV) was applied to the stainless needle with an outer diameter of 0.8 mm and inner diameter of 0.5 mm, which was kept at a distance of 20 cm from the grounded collector. The polymer solution flow rate was 0.1 ml min−1 and the distance was maintained at 20 cm between the nozzle and the grounded collector.
Scanning electron microscopy
The morphology of the PHBV fibers was evaluated using scanning electron microscopy (SEM, Merlin Gemini II, Zeiss, Germany) at the accelerated voltage of U = 1–3 kV and a working distance of 7–10 mm. All samples were coated with a 15 nm gold layer using the rotary pump sputter coater (Q150RS, Quorum Technologies, UK) before imaging. Fiber diameters (Df) were measured from SEM micrographs using ImageJ (v. 1.53c, USA) to correlate 100 measurements into histograms with the standard deviations.Attenuated total reflectance - Fourier transform infrared spectroscopy (ATR-FTIR)
All spectra were recorded using a TENSOR II Bruker spectrophotometer by ATR technique using the diamond crystal. During measurements, 64 spectra were repeated over the wavenumber range 350–4000 cm−1, with resolution 1 cm−1. Reference samples were PHBV fibers and oil, used separately.Differential scanning calorimetry (DSC)
Thermal characterization was carried out using a differential scanning calorimeter (DSC, Mettler Toledo, Columbus, OH, USA) at a heating rate of 10 °C min−1 in the −25 to 200 °C temperature range. Measurements were carried out in a dynamic nitrogen atmosphere for the sample placed in aluminum pans. The enthalpy of melting is the integrated area under the melting peak, the degree of crystallinity was calculated from the formula: where ΔHm100 is the enthalpy of 100% crystalline PHBV (146.6 J g−1).35–38
Mechanical testing
The mechanical properties of PHBV fibrous membranes were measured using a tensile module with a 20 N load cell (Kammrath Weiss GmbH, Dortmund, Germany). Fibrous membranes were cut into rectangles (10 × 15 mm) and placed in the clamps. Each type of sample was tested five times. Mechanical tests were performed uniaxially with an extension speed of 15 μm s−1. Maximum stress and strain were calculated from stress–strain curves. The thickness of the samples was measured from SEM images using ImageJ.Water contact angle
The wettability of the PHBV-based membranes was determined by measuring the static contact angle. We used 3 μl drops of deionized water (DI water, HLP 5UV purification system – Hydrolab, Straszyn, Poland) at T = 22 °C and H = 35%. The images of 5 droplets were taken within 15 s from the deposition, with the 1 s interval using Canon EOS 700D camera with EF-S 60 mm f/2.8 Macro USM zoom lens. The contact angles were measured using ImageJ, the average values were calculated from 10 measurements with standard deviations.Zeta potential
The zeta potential measurement allowed us to determine changes in surface charges across the entire volume of fibrous membranes. The zeta potential (streaming potential) of the PHBV fibrous samples was measured using an electrokinetic analyzer SurPASS 3 (Anton Paar, Austria) with a cylindrical cell. Titration curves were obtained using zeta potential measurements as a function of pH in 0.01 M KCl electrolyte solution. The pH variation from 2.5 to 9.0 was obtained with progressive addition of 0.05 M HCl or 0.05 M NaOH to the solution for the acid and basic ranges, respectively. PHBV samples were cut out, crushed and put into the measuring cell. Each point is the value of the zeta potential averaged from 4 measurements, error bars correspond to the standard deviations in both the potential change and the pH change.Oil spreading test
Evening primrose oil (10 μl) was pipetted on a 5 × 5 cm sized electrospun membrane. After the oil deposition, 7 pictures of the oil-spread areas were taken with 30 min intervals using a Canon EOS 700D camera with EF-S 18–55 mm (f/3.5–5.6) zoom lens from the top and a Canon EOS 250D camera with EF-S 60 mm f/2.8 Macro USM zoom lens from the bottom of the samples. The surface area of the oil spread on fibers was measured using ImageJ. The mean values and standard deviations were calculated from four replicates per sample.Water vapor and heat transmission rate
To perform water vapor transmission tests, glass beakers with 5 ml distilled water were covered and wrapped with fibrous samples PHBV, PHBV + 5% EPO and PHBV + 10% EPO. We used gauze as a control sample in this WVTR experiment. Then, the beakers were weighed and placed in water heated at 37 °C, RH = 40–45%. After 24 h, the beakers were weighed again and the WVTR coefficient was calculated from the following equation: where m0 is the initial mass [g], m1 is the mass after 24 h [g] and S is the evaporation area [m2]. As a control sample in WVTR, we used gauze. Additionally, gauze and fibrous membranes were wetted by pipetting 30 μl of EPO, the oil was allowed to drain for 5 min. The beakers were weighed before and after 24 h. A series of 3 replicates were performed for each type of sample.
The heat transport was tested using a FLIR T560 thermal imaging camera with FLIR lens f = 17 mm (FLIR Systems, USA). PHBV and blend fibers were applied to the skin of the forearms on both hands. Fibers with an additional 30 μl of EPO were placed on one hand and dry fibers on the other hand. Thermal photos were taken immediately after the oil was dropped and after 3 h of patch application.
Skin test
The testing of the patches on human skin was performed on volunteers following ethical considerations regarding human testing of cosmetic products guidelines by EU according to the Council Directive (76/768/EEC) and World Medical Association Declaration Helsinki (1964-1975-1983-1989-1996). A skin moisture test was performed using rectangular fiber samples (2.5 × 2.5 cm). The patches with 25 μl of evening primrose oil were applied to the skin. The moisture of the skin was measured using Corneometer® (Hydro Pen H10, EPRUS) before patch application and after 6 h at the same place. Three types of samples without oil deposition were used as control samples. Skin hydration tests were carried out on 5 volunteers using dry patches PHBV and blends with EPO as a control, and patches additionally soaked with oil.Results and discussions
Morphology and sizes of fibers
The addition of EPO causes changes in the morphology of PHBV fibers, which was observed using SEM. The microstructure of the obtained fibers is different due to the content of the oil in the electrospinning blend. PHBV fibers (Fig. 1) have a homogeneous structure, free from pores and distortions, similar to previous results.28,32 Electrospun fibers with 5% EPO have very small pores (Fig. 1B), but still, they have a regular, smooth surface. However, fibers with 10% EPO (Fig. 1C) content have a rough surface caused by solvent evaporation. In Fig. 1D, the fiber diameters are presented as a box chart showing the mean fiber diameter, the interquartile interval and standard deviations. The fiber diameter increases with the added % of oil in the PHBV polymer solution. The addition of oil caused an increase in the viscosity of polymer solutions, which slows down the evaporation of solvents during electrospinning. The average diameter of PHBV fibers was 2.46 ± 0.31 μm for PHBV, with 5% EPO, it was 3.80 ± 0.42 μm, whereas, for fibers with 10% EPO, it was 5.92 ± 0.76 μm. The formation of fibers from a polymer blend with oil influenced morphological changes in them. In the case of polymer fibers, each change of electrospinning parameters or modification of the input material changes the structure of the obtained fibers, e.g. blends with polyethylene oxide,39,40 gelatin,41 chitosan,42 polylactic acid,43,44 and even with tea or oil extracts.45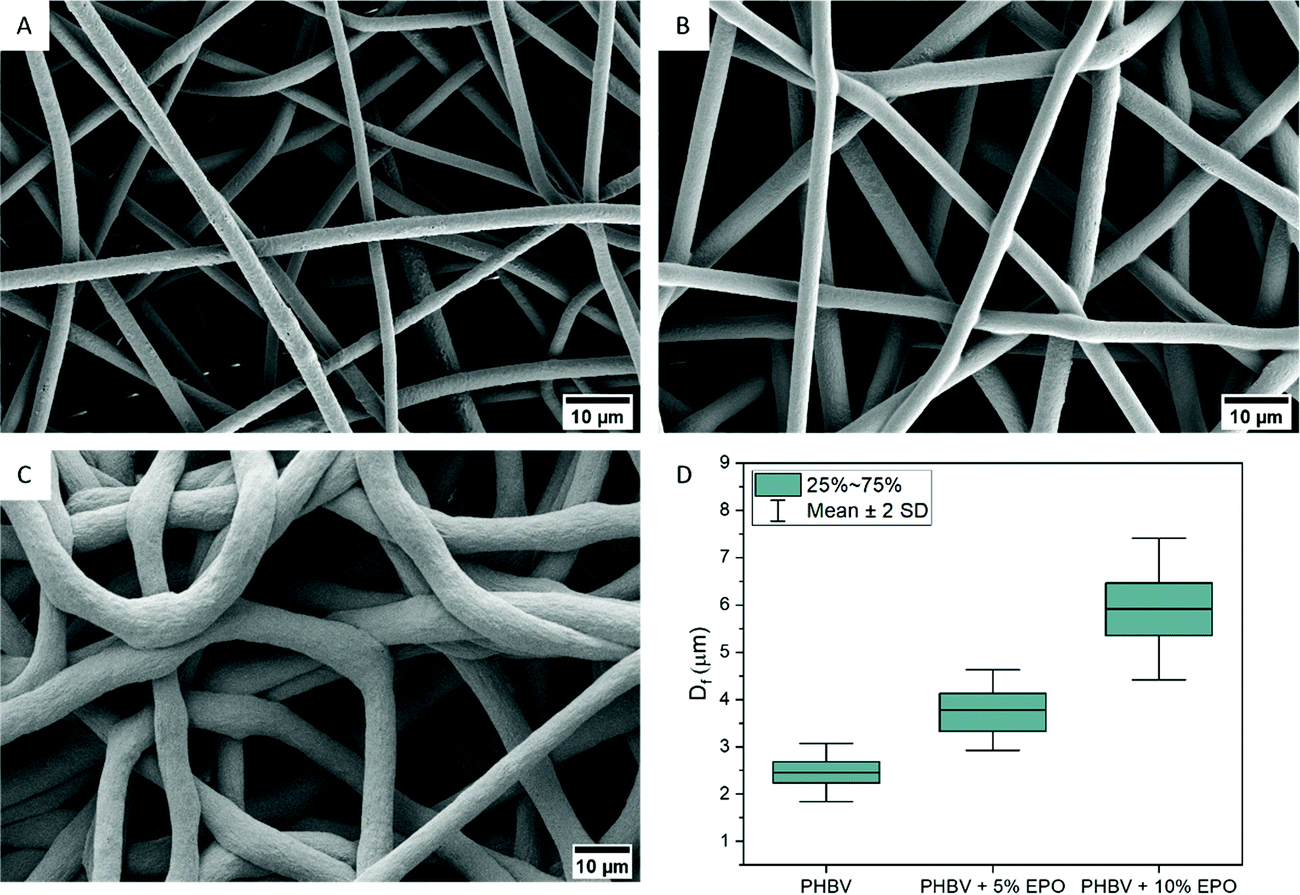 | ||
| Fig. 1 (A) SEM micrographs of the PHBV fibers and (B) blend PHBV fibers with 5% EPO and (C) 10% EPO. (D) Box chart with the mean diameter values (Df) of the fibers and the interquartile interval in the PHBV electrospun scaffold and blends with 5% and 10% EPO. | ||
Chemistry analysis of electrospun patches
Chemical analysis of electrospun patches was performed to confirm the presence of both components and the relation between them. IR spectroscopy analysis of evening primrose oil, PHBV fibers, and PHBV fibers and oil blends showed that these compounds contain characteristic bonds for the structure of fatty acid glycerides, see Fig. 2. The analysis for EPO indicates that the stretching vibration band of C![[double bond, length as m-dash]](https://www.rsc.org/images/entities/char_e001.gif) O groups was observed at 1740 cm−1, and for the C–H bond from the olefin group appeared at 3012 cm−1.46 The C–H bonds of the –CH2– groups were detected at 2853 cm−1 (stretching) and at 1461 cm−1 (deformational). Moreover, the C–H bonds of the –CH3 groups were observed at 2921 cm−1 (stretching) and 1378 cm−1 (deformational). The C–O stretching bands of the ester groups were detected at 1098, 1164, and 1236 cm−1. The absorption peak at 721 cm−1 is associated with pendulum vibrations of the –CH2– groups.46
O groups was observed at 1740 cm−1, and for the C–H bond from the olefin group appeared at 3012 cm−1.46 The C–H bonds of the –CH2– groups were detected at 2853 cm−1 (stretching) and at 1461 cm−1 (deformational). Moreover, the C–H bonds of the –CH3 groups were observed at 2921 cm−1 (stretching) and 1378 cm−1 (deformational). The C–O stretching bands of the ester groups were detected at 1098, 1164, and 1236 cm−1. The absorption peak at 721 cm−1 is associated with pendulum vibrations of the –CH2– groups.46
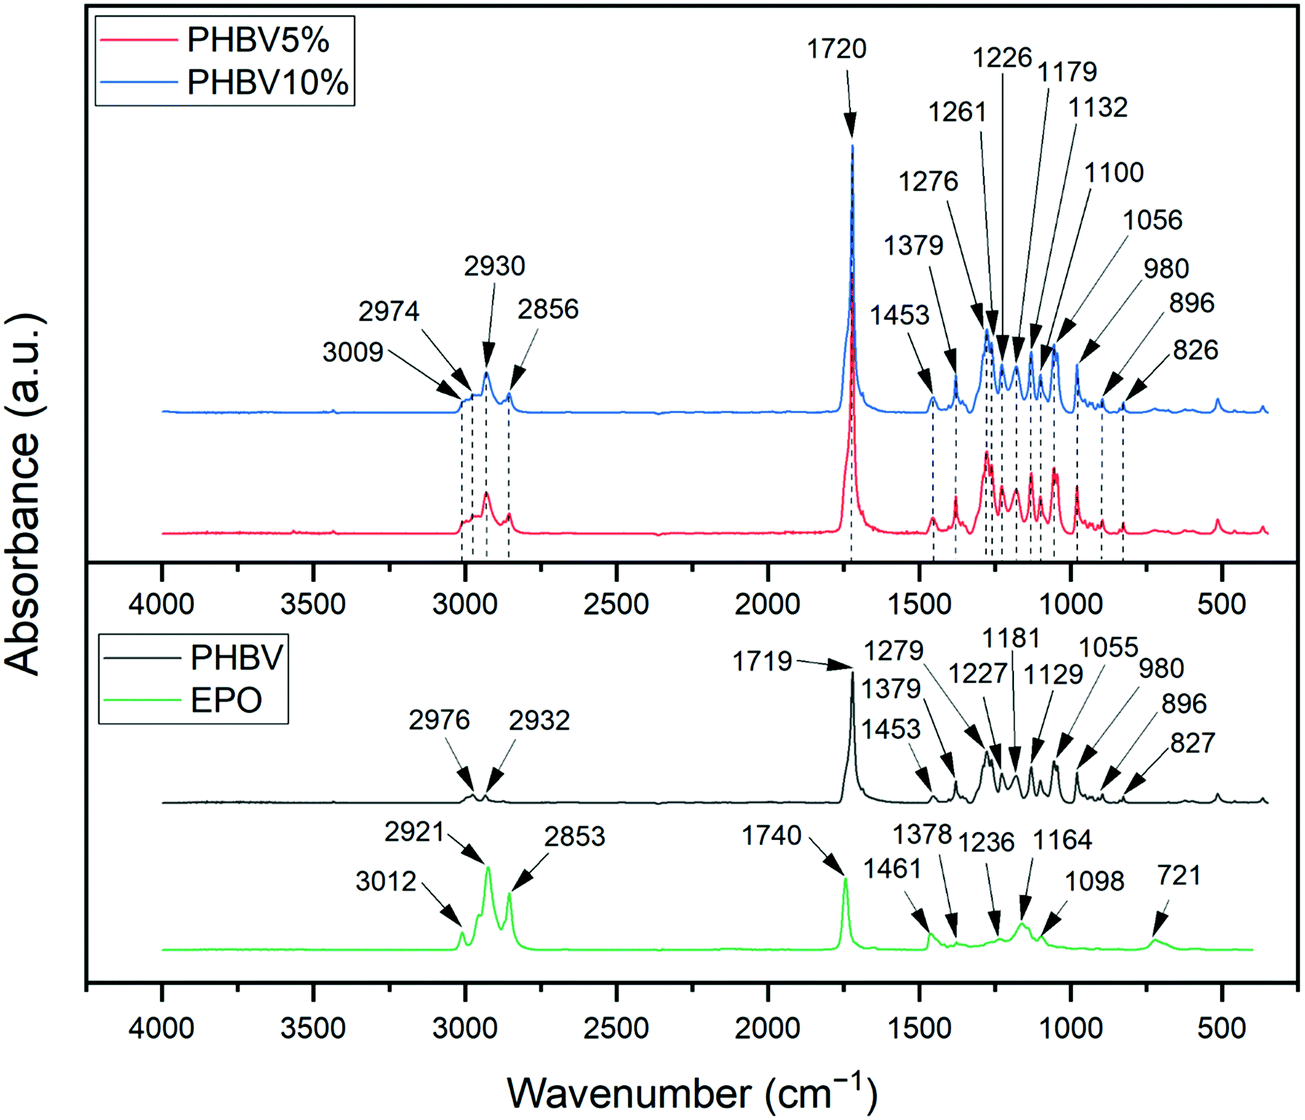 | ||
| Fig. 2 The ATR–FTIR spectra of EPO, PHBV fibers and blends of PHBV fibers with 5% and 10% EPO. | ||
In the case of PHBV, there are peaks in the spectrum that suggest whether we are dealing with a crystalline or amorphous structure. The most intense absorption peak for PHBV fibers at around 1719 cm−1 is associated with the CO stretching vibration and it is characteristic of the crystalline form of PHBV. In this spectrum, we also see a broadening peak at around 1740 cm−1 suggesting a small amount of amorphous PHBV.40,47 The C–O stretching bands were detected at 1055, 1129, and 1181 cm−1. The presence of the –CH2– group was indicated by the peak at 2932 cm−1. The absorption bands at range 827–980 cm−1 are related to C–H stretching. Furthermore, the C–H stretching bands were also observed at around 1227, 1279, and 2976 cm−1 and the C–H bending vibrations were detected at 1379 and 1453 cm−1.40,44,47–49
Most bands for EPO and for PHBV fibers in the range of 1100–1453 cm−1 are similar, so interpretation of the results of the effect of oil content in fibers is challenging. In both, 5% and 10% blend of EPO, we can observe the characteristic PHBV bands in the range 826–980 cm−1, 1056 cm−1, or 1179 cm−1. The increase in the absorbance intensity of the bands detected at the wavelength 1100 cm−1, 1379 cm−1 or 1453 cm−1 results from overlapping and amplification of the peaks coming from both PHBV and EPO. However, as a result of the assembly of the bands at 1740 cm−1 for EPO and 1719 cm−1 for PHBV fibers, an increase in the intensity of peaks and wider bands on the EPO side of the peaks were observed, for both types of blends. In the case of blends with EPO, the peak at 1720 cm−1 has a higher intensity, which may suggest changes in the crystalline structure in the presence of EPO.47 It is similar to the peaks at 1275, 1261 and 1226 cm−1 – characteristic for the crystal structure, they have a greater intensity on the spectra of blends than that for pure PHBV. It could suggest that the addition of EPO improves the crystallinity of PHBV.40,47 Additionally, for fibers with 5% as well as 10% oil, the band of the C–H bond from olefin groups was detected at 3009 cm−1, stretching vibrations of C–H bonds of the –CH2– groups at 2856 cm−1 and of the –CH3 groups at 2930 cm−1.40,44,46,47
Thermal analysis of electrospun fibers
DSC curves for cooling and the second heating cycle for PHBV fibers and polymer oil blends are shown in Fig. 3A and B, respectively. For pure PHBV fibers, crystallization peaks at 60 °C were found, resulting from the rapid crystallization of PHBV.30 Compared to the pure PHBV fibers, the crystallization temperature of the oil blends was decreased, which indicates a reduced crystallization in PHBV and EPO mixed fibers (Fig. 3A). Each sample shows an intense endothermic peak between 135 to 155 °C, which characterizes the PHBV melting peak (Fig. 3B). The values of melting point (Tm), melting enthalpy (ΔHm) obtained from the second heating scan, and the degree of crystallinity (Xc) for individual PHBV samples and oil blends are presented in Table 1. The melting points for individual samples do not differ significantly from each other, while the values of the melting enthalpy increase with increasing oil content in the blend. For pure PHBV fibers, a broad melting peak with one maximum can be observed, while for the polymer–oil mixture, two melting peaks are visible. Generally, a double melting peak is seen in thermal analyses of multi-component materials.30,31,40,47,50 The first melting peak relates to the melting of the crystals formed during fiber manufacturing, while the second peak relates to the combination of the crystals formed during heating.47,51 Clearly, the addition of EPO to PHBV affects the crystallization process of the tested fibers.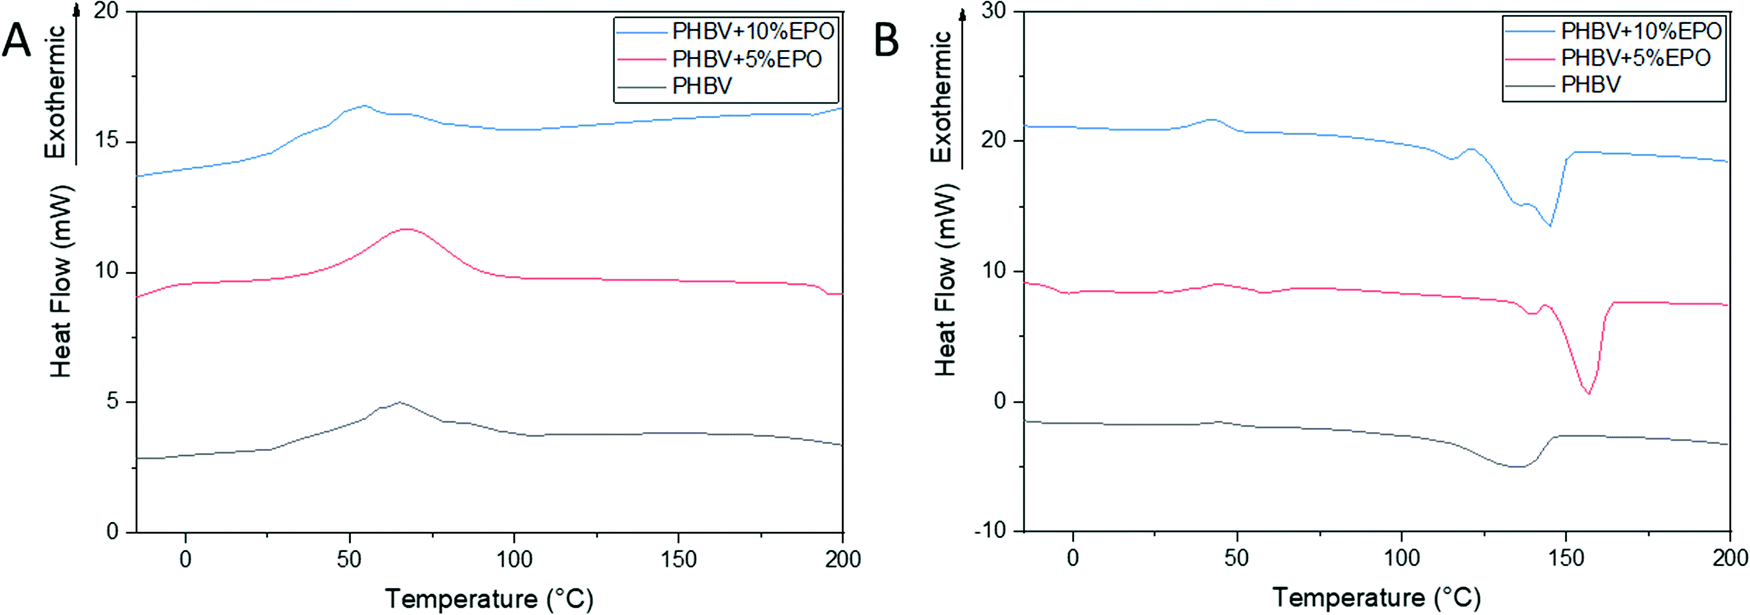 | ||
| Fig. 3 DSC thermograms, cooling scan (A) and the second heating scan (B) of pure PHBV fibers and PHBV fibers with 5% and 10% EPO. | ||
| Properties | Characteristics | Samples | ||
|---|---|---|---|---|
| PHBV | PHBV + 5%EPO | PHBV + 10%EPO | ||
| Mechanical | σ max [MPa] | 0.16 ± 0.03 | 0.51 ± 0.09 | 1.07 ± 0.15 |
| ε max [%] | 3.05 ± 1.07 | 15.03 ± 2.62 | 22.68 ± 4.59 | |
| ε f [%] | 27.29 ± 2.84 | 27.66 ± 3.52 | 31.79 ± 3.39 | |
| U T [MJ m−3] | 0.016 ± 0.008 | 0.100 ± 0.031 | 0.288 ± 0.083 | |
| Thermal | T cc (°C) | 44.5 | 42.9 | 42.7 |
| ΔHcc (J g−1) | 2.9 | 2.6 | 2.4 | |
| T m1 (°C) | 135.5 | 139.3 | 136.0 | |
| T m2 (°C) | — | 156.9 | 144.8 | |
| ΔHm (J g−1) | 58.0 | 45.4 | 28.5 | |
| X c (%) | 39.6 | 30.9 | 19.4 | |
The pure PHBV fibers show the highest degree of crystallinity (50%). Moreover, the analysis of the degree of crystallinity of all the samples shows a decrease in the degree of crystallinity with an increase in the oil content in the blend, respectively, 45% and 40% for PHBV + 5% EPO and 10% EPO. The differences in the crystallinity of the samples are also related to the fiber manufacturing process and morphology of the samples.38 The additional proportion of the amorphous phase, which is oil to the polymer solution, reduces the crystallinity of the materials produced. In the case of polymer–oil blends, the solvent evaporation process can be slower and disturbed, which may affect the dynamics of crystallization, and thus the degree of crystallinity of the materials obtained.37 Faster evaporation is freezing the polymer chain alignment, but larger polymer chains can be slower or need more time to relax, thus the crystallization can be lower.37,52 Moreover, in the electrohydrodynamic processes the increase of the viscous drag can decrease the stretching of polymer solution if the electric field or flow rate is not increased.53–55
The differences between the samples for the thermal characteristic peaks and the bands of chemical bonds indicate that the oil is built into the polymer structure. This is confirmed by both the increase in the intensity of the characteristic bonds tested with FTIR and the decrease in the crystallization temperature for the tested materials. However, the fiber morphology shows no oil permeability that would be seen in SEM micrographs. The structure and size of the fibers changed, as shown in Fig. 1.
Mechanical testing
Mechanical tests results showed an increase in the maximum tensile strength of PHBV fibers with the increased content of EPO, see Fig. 4. For PHBV fibers, it was 0.16 ± 0.03 MPa and the maximum strength increased to 0.51 ± 0.09 MPa for PHBV + 5% EPO, and to 1.07 ± 0.15 MPa for PHBV + 10% EPO. As the maximum stress increases, the toughness of the membranes also increases from 0.016 MJ m−3 for pure fibers, up to 0.288 MJ m−3 for PHBV with 10% oil. Moreover, oil blends show significantly higher strain values at maximum stress, 3%, 15% and 25% for PHBV, 5% EPO and 10% EPO, respectively. Moreover, the toughness of the material also improved with increasing EPO addition in the blend. The strain at failure, for PHBV fibers and 5% EPO fibers is similar, however, the shape of the characteristic stress–strain curves is completely different. Pure PHBV fibers quickly reach the maximum stress value, and further stretching of the sample causes slow elongation. In the case of samples with oil, in the first stage of stretching, we get the value of 90% of the maximum stress, then the uniaxially stretched fibers are elongated to the maximum, and then the samples break very quickly. Fig. 4 shows examples of the stress–strain function curves for samples, the average mechanical properties are presented in Table 1. The tensile curves of all tested samples are presented in ESI,† in Fig. S2.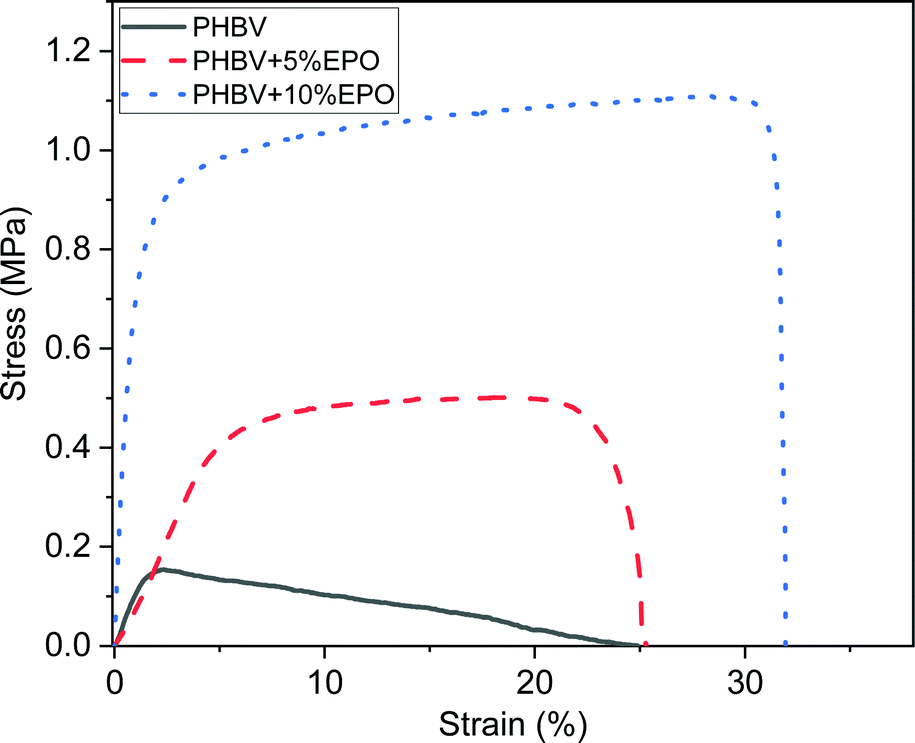 | ||
| Fig. 4 The representative stress–strain curves from the tensile testing of pure PHBV fibers and PHBV fibers with 5% and 10% EPO. | ||
The different shapes of the curves as a result of the uniaxial stretching of electrospun fibers can be caused by the chemical composition of the polymer solution as well as the physical strengthening of the fibers.24,40,56,57 Overall, PHB is a brittle material with low toughness. The increased flexibility was achieved by copolymerizing the PHB homopolymer with the HV monomer.58 The HV monomer is more complex than HB, it has a longer side chain, and the mechanical properties of polymers depend on the polydispersity of the materials.56 In addition, an important aspect of blends is the strength and type of interfacial bonding in the polymer.30,59 The binding of the oil to the polymer solution, especially in the case of stretching vibrations of C–H bonds (2800–3000 cm−1), can increase the polydispersity of the material, and thus improve the mechanical and thermal properties,60 including toughness. On the other hand, as a result of the addition of oil to PHBV solution, the crystallinity of the tested materials decreases, but the diameter of the fibers increases, see Fig. 1. The properties of electrospun polymer membranes are determined by the packing density of the fibers in the mesh, the interactions between fibers and the mechanical strength of the individual fibers.40,57,61,62 As a result of uniaxial stretching, the polymer fibers are oriented in the direction of the applied force, which indicates an increase in stress in the sample.63 Higher density of fiber packing density, the higher mechanical strength is required to orient the fibers in the membrane.57 Also, the increase in the diameter of the fibers with the addition of oil contributed to the improvement of their mechanical properties.64,65
Considering the effect of interactions between fibers in meshes during the tensile testing the addition of oil increased the contact points between fibers, as the diameter of fibers with EPO is larger, see Fig. 1. This demonstrates the improved adhesion between the PHBV + EPO load-bearing fibers.66,67 The interactions between fibers such as sliding enhance the toughness of electrospun fibers68 which is clearly presented in stress–strain characteristics in Fig. 4. Characteristic bonds, especially bands from 1720 cm−1, confirm the presence of oil in the polymer blend. Moreover, the addition of oil influenced the crystallization process and the melting enthalpy of the modified materials. Chemical and morphological changes in the structure of polymer fibers are reflected in the mechanical properties, resulting in an improvement in these properties, compared to those of pure PHBV fibers.
Wettability – water contact angle
The wettability of PHBV nonwovens with the addition of EPO and pure PHBV fibers was measured from the contact of water angles (Fig. 5A–D). In the case of PHBV fibers, no significant changes in the contact angle were noticed within 15 s of the measurement. The mean value for the PHBV fibers was around 126.1 ± 1.9°. The measured water contact angles for pure PHBV fibers were close to the values of the contact angles measured in the previous work.28,32 Moreover, the water contact angles for pure PHBV fibers remained the same for at least 30 min, so we can conclude that the hydrophobic stability is maintained for a long time. An interesting phenomenon was noticed when testing the contact angle on fibers made of PHBV and EPO blends. The contact angle decreases slightly in the first 5 s for PHBV + 5% EPO from 124.3 ± 1.2° to 117.7 ± 1.1°. Then, a drastic decrease in contact angle brings the value to 40.5 ± 1.3° in 12 seconds. However, in the case of PHBV fibers with 10% EPO addition, we can observe a progressive decrease in the contact angle from 114.4 ± 0.9° in the 1st second to 63.4 ± 1.1° in the 12th second of the measurement. It can be seen that modifying the material with oil changed the hydrophobic properties of the material to hydrophilic, which is often observed with multi-component materials.44,48,62,69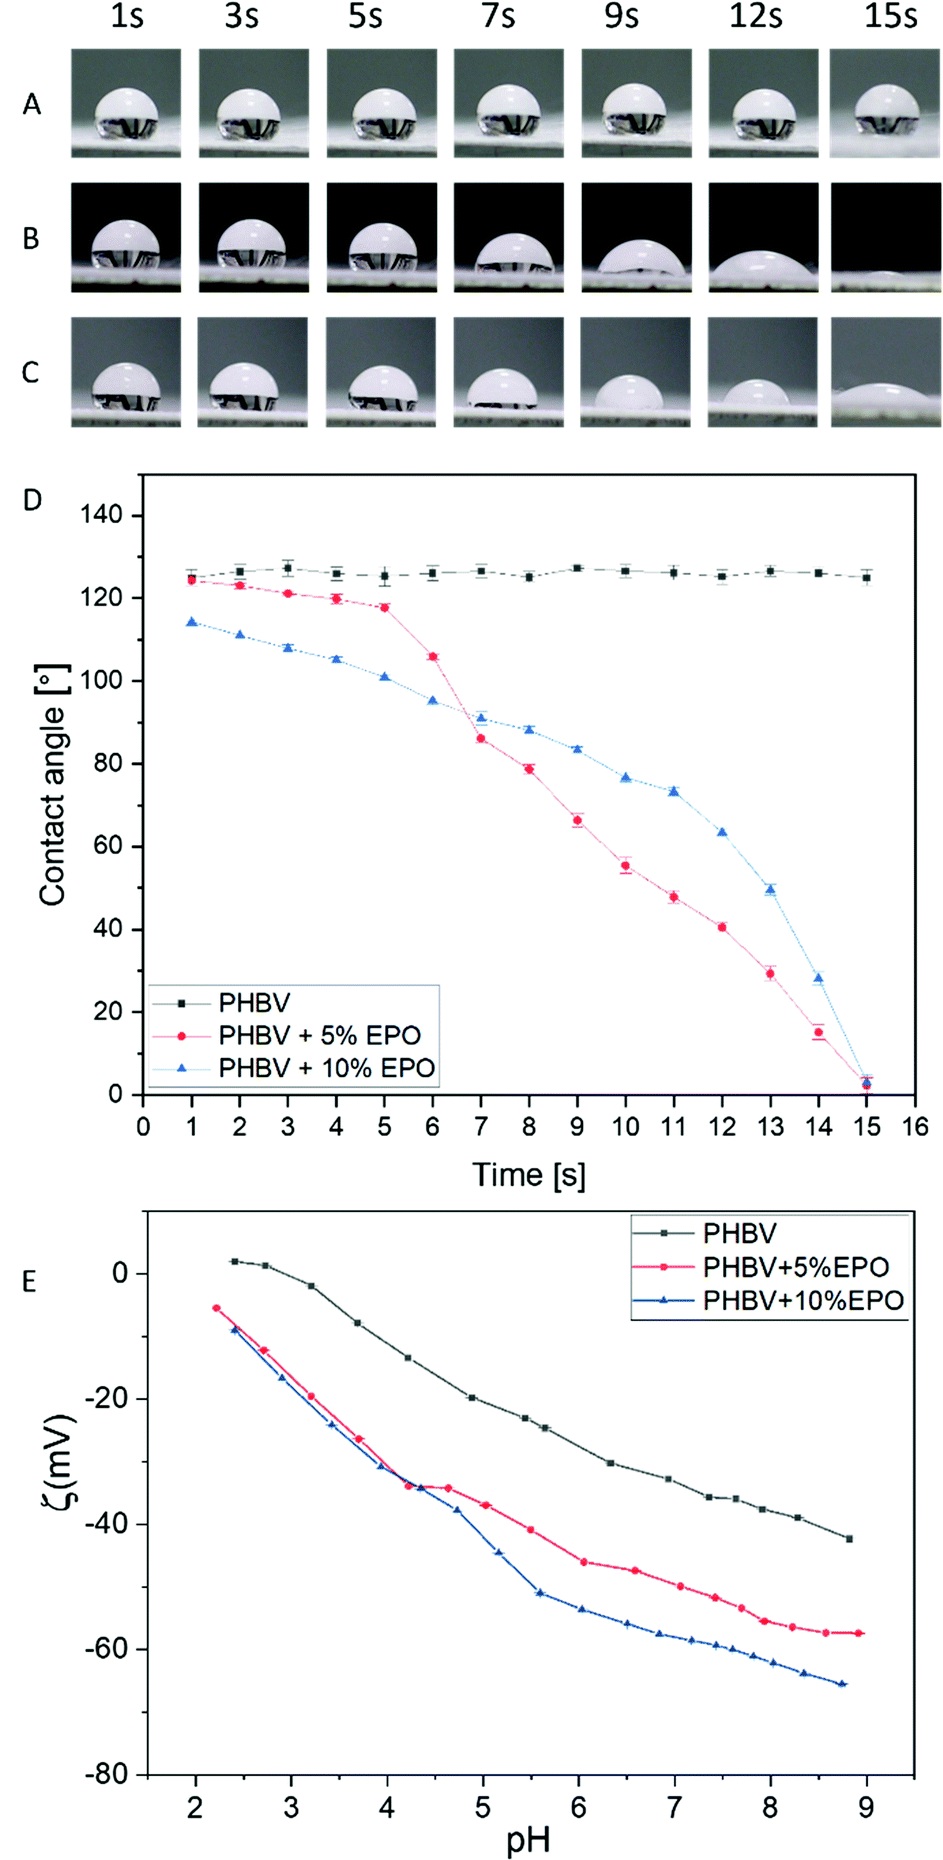 | ||
| Fig. 5 The representative images of water drops on (A) PHBV fibers and (B) blend PHBV fibers with 5% EPO and (C) 10% EPO. (D) The change in water contact angle on the PHBV fibers and blends of PHBV fibers with 5% and 10% EPO within 15 seconds. (E) Zeta potential (ζ) results showing titration curves for the PHBV fibers and blends of PHBV fibers with 5% and 10% EPO measured in KCl solution. | ||
Zeta potential
The values of the surface potential as a function of the solution pH change are shown in Fig. 5E. PHBV fibers show a higher potential over the entire measuring range compared to oil-modified nonwovens. In the case of pure PHBV fibers, the isoelectric point was determined at pH = 2.95. The titration curves for EPO polymer blends in the acidic range (from pH 2.5 to 4.5) show identical values, which may prove that oil modification did not affect the surface potential of the sample in a strongly acidic environment. However, as the pH increases (above 4.5), the potential changes between PHBV + 5% EPO and PHBV + 10% EPO fiber blends are apparent, where increasing the modifying additive reduces the potential of the fibrous membrane.The charge accumulated at the boundary of two phases – water and polymer fibers is driven by two mechanisms. The first one affects the surface charge and is associated with the protonation of functional groups and the deprotonation of acid groups. On the other hand, the second mechanism (formation of interfacial charge) is based on the adsorption of ions from the electrolyte in the basic range.28,70–72 In the case of the dominance of interfacial charge formation, the titration curves in the alkaline range are rather linear. We also observe a linear relationship in the acid range. The roughness of the surface influences the contact angle, however, the changes in wettability of the fibers with the addition of oil are similar, in both cases, water drops are absorbed, as a result of which the titration curves almost overlap in the acid range, and the surface roughness can be neglected in comparison with oil samples.73,74 Oil has a lower surface tension than water and it also affects wetting.75 The oil spreading is important as it indicates the transport properties of the membranes that are used as a patch to deliver oil in a controlled way to the skin. The addition of oil to the PHBV blend is reducing the surface-free energy of electrospun fibers. The wettability of electrospun membranes is affected by both the surface properties of individual fibers and the morphology of the whole mesh.76 Importantly, the changes in zeta potentials allow us to recognize chemical changes on modified surfaces due to different behaviour of surfaces in the liquid surrounding.77 Zeta potential depends on the wettability of the materials and can be also used to calculate the surface free energy by using Fowke's hypothesis.78 The average skin pH in adults is 4.9, while the skin of newborns and the elderly have an increased pH.79 Dry skin and increased pH values may be associated with a decrease in the filaggrin content.79–82 In the case of newborns and infants, the use of acidic creams and low-pH emollients are commonly used to help prevent and alleviate the symptoms of atopic dermatitis.83–85
Oil spreading test
The spreading area of evening primrose oil (EPO) is shown in Fig. 6A. The graph shows the size of the spreading area from the top of the sample and from the bottom. It can be seen that the oil spreading area does not change with time for each sample. The PHBV sample has the largest area of EPO spreading and the difference between the top and bottom area is slightly more than 10 mm2. The oil spreading area on both the PHBV sample with 5% and 10% EPO addition is much smaller than that for pure PHBV fibers, it is in the range of 30–45 mm2. The difference in the area between the top and the bottom decreases as the amount of EPO added to the PHBV blend increases. It is worth noting that for the blends the area of spreading on the sample surface from the top is smaller than for the bottom. The smaller changes between the top and the bottom of the fibers indicate more oil delivery through the electrospun PHBV + EPO membranes to the bottom. These results indicate that the electrospun membranes PHBV + EPO loaded with additional oil between fibers can be very effective as patches for delivering moisturizing ingredients for skin. Another aspect is the higher wettability of PHBV + EPO membranes. On the other hand, the morphology of PHBV fibers with EPO changed affecting the porosity of the patches. One type of oil was used in the study, but other studies reported that the type of oil, its viscosity, did not affect the spreading of the oil on the electrospun fibers.23,75 However, the size of the fibers in the mat is an important factor.23,24,75 Electrospun PHBV fibers and polymer blend fibers with oil are characterized by an increase in the fiber diameter along with the amount of added oil. Therefore, the largest area of diffusion can be observed for pure PHBV fibers and a smaller area for oily fibers.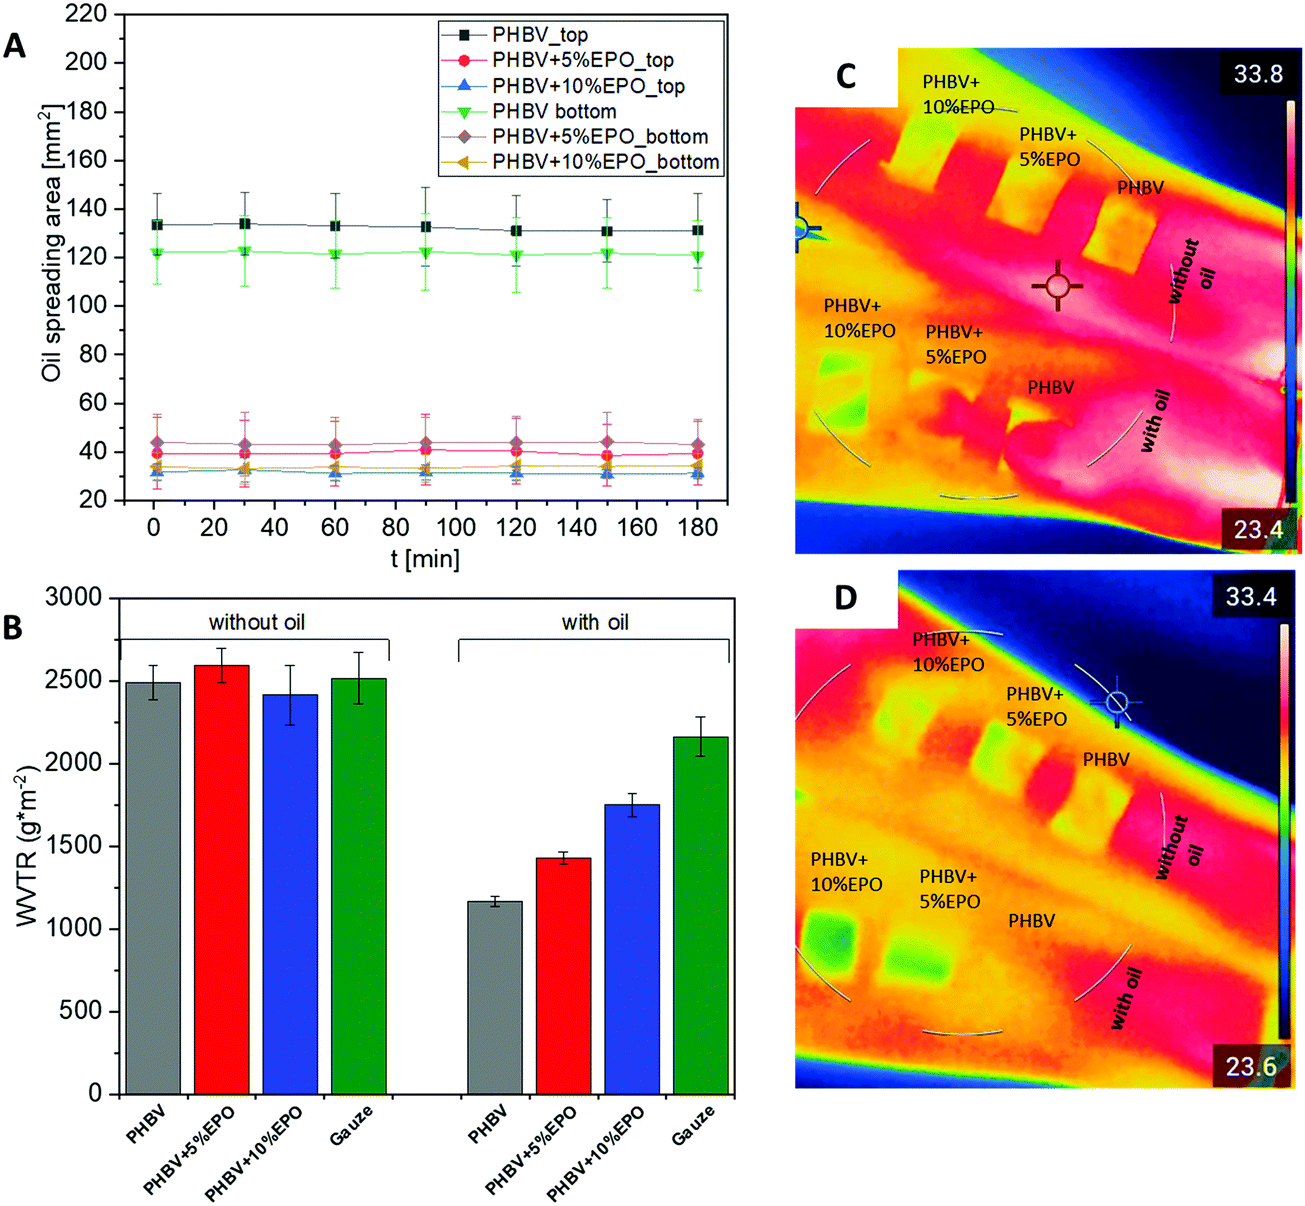 | ||
| Fig. 6 Oil spreading area (A) on the PHBV electrospun fibers and blends with EPO over 3 h. (B) Water vapor and (C and D) heat transmission rates through the PHBV, PHBV + 5%EPO, and PHBV + 10%EPO electrospun fibers and samples with an additional 30 μl EPO. | ||
Water vapor and heat transmission rate
The results from the WVTR are shown in Fig. 6B. The materials without indirect oil application to the sample surface showed similar measurement values. In the case of the reference material and gases, we can observe a slight decrease in WVTR when comparing the materials with and without oil. Subsequently, a decrease of about 30% and 40% was observed for PHBV fibers with the addition of oil for 10% and 5% EPO, respectively. The lowest value of the index, a decrease of 50%, was observed for pure PHBV fibers. Additionally, thermal imaging presented in Fig. 6C and D shows that the fibers are a barrier to heat transfer. Immediately after the oil is dropped on PHBV patches, the temperature of the wet fibers on the skin become similar, however, after 3 hours of wearing, the area at the place of the fibers with oil sprinkled on them is lower than that of the dry fibers with pipetted oil droplets. Additionally, Fig. S4 in the ESI,† included a thermal image of the forearms before applying and after removing the patches.Electrospun membranes have very high porosity, therefore the permeability through them is high.86,87 It is especially observed for the PHBV samples without oil on the surface, thus dry patches. On the other hand, the WVTR values for samples with oil on the surface show lower values, so less water vapor is able to diffuse through the membrane. Therefore, these materials may be suitable for the retention of moisture for atopic skin. It is extremely important to ensure adequate permeability and humidity for the dressing material.87,88 PHBV fibers, as well as its blends, are suitable for such applications, as the WVTR for a conventional wound dressing is about 2500–3000 g m−2.89,90 In the case of atopic dermatitis, the dryness of the skin increases, so the patches should reduce water loss from the skin layer. This is ensured by samples with additionally applied oil on the surface. Moreover, the lowest WVTR was achieved for PHBV fibers with oil applied to the surface. This result can be related to the oil spreading test in electrospun membranes. For PHBV samples the oil spreading area was the highest (Fig. 6A), therefore the highest spreading on PHBV fibers resulted in the lowest water loss.
Skin test of electrospun patches
In Fig. 7, we present all the results of skin hydration before and after 6 h of applying the patch. The images of the tested patches on the skin of volunteers are also presented in ESI,† in Fig. S5. The application of the electrospun membranes on the skin was easy in all cases. Generally, the oil-applied patches have significantly higher skin hydration than those with control samples. In the case of control patches, skin hydration increased by a maximum of 5%. On the other hand, hydration increases by 15–20% for fibrous patches with additional EPO applied. Although the results from all samples impregnated with oil are similar, the highest moisture increase was demonstrated by PHBV + 5% EPO fibers.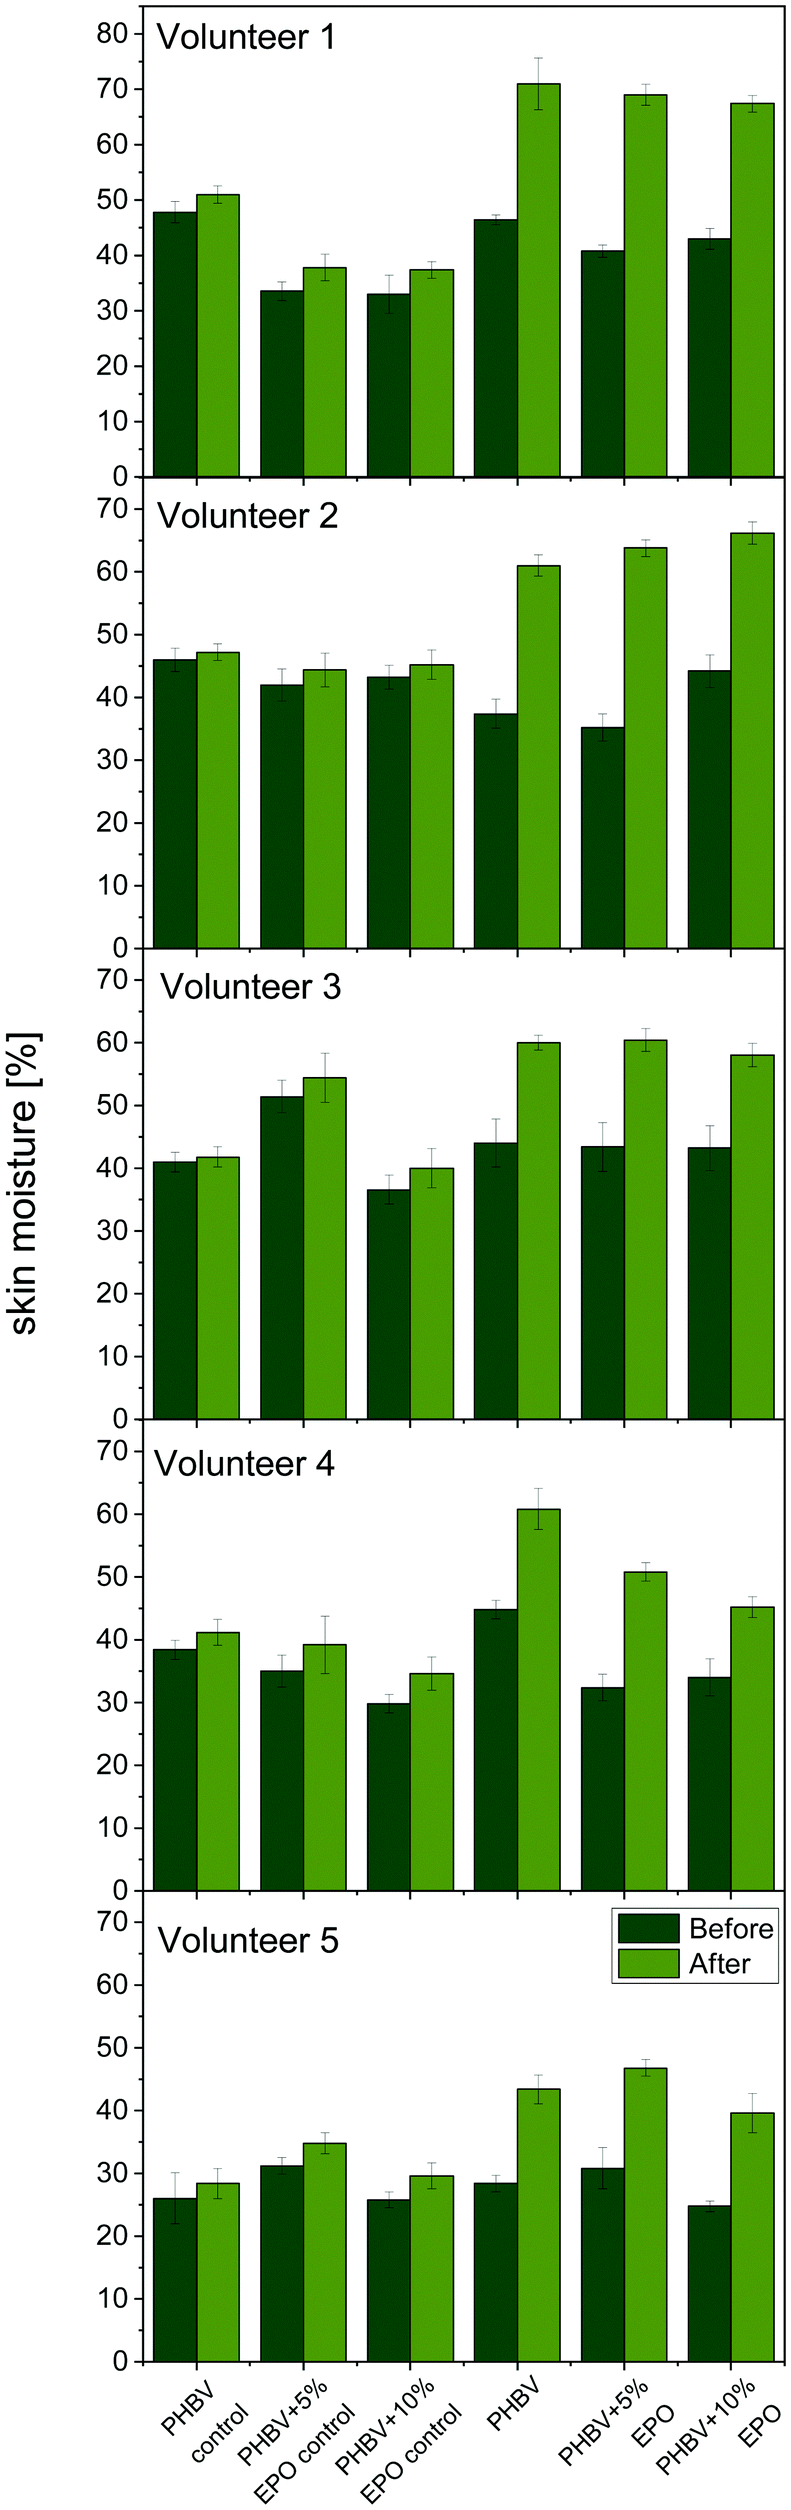 | ||
| Fig. 7 Skin moisture tests on five volunteers. Skin moisture before and after the patch applications. The control samples are the PHBV and PHBV + 5% and 10% EPO patches without oil. | ||
Applying the oil to the patches, both from pure PHBV fibers and EPO blends, clearly indicates that these materials increase skin hydration. Previous studies carried out with the use of electrospun fibers PCL,24 PVB,23,75 and PI91 confirm the effectiveness of the use of patches with oil to moisturize the skin. This type of dressing can be crucial in preventing dry skin, which is one of the problems faced by people suffering from atopic dermatitis.92 What is more, the patches used to moisturize can prevent skin scratching and external infections in the broken layer of the epidermis. Maintaining proper skin hydration is extremely important in supporting the regeneration of damaged skin as well as preventing itching and treating inflammation.92,93
Conclusions
These research studies confirm that as a result of mixing a biodegradable polymer with evening primrose oil, we are able to produce electrospun fibers with a smooth and uniform structure. The chemical characteristics of the tested materials confirm the presence of oil in the electrospun fibers. The increasing size of the fibers with the addition of EPO increased the number of adhesion points in the electrospun membrane, as a result, the mechanical properties were significantly improved, especially the extension and toughness of the overall dressing. Moreover, the addition of oil influenced the crystallization and the enthalpy of melting of the modified materials too enhancing the mechanical performance of PHBV + EPO membranes as well. Apart from the application and handling advantages of blending PHBV with EPO, we observed a significant improvement in skin hydration once the patches were soaked in evening primrose oil and applied on volunteers in the in vivo tests. The oil transport through the membrane was faster for the PHBV + EPO samples as their hydrophilicity was improved. Importantly, the water vapor transmission rate flow rate for PHBV patches with oil was reduced as the addition of pipetted oil blocked the pores in the membrane, thus contributing to the retention of skin moisture. The PHBV patches with blended oil are desired for thermally insulating dressing decreeing the water lost from the skin. We have proven the great potential of applying blend electrospinning patches of PHBV with oils for increasing need in skin protecting and comforting, which is enhanced by growing skin diseases worldwide in relation to the current climate changes and environmental pollution.Conflicts of interest
There are no conflicts to declare.Acknowledgements
This research was part of the “Nanofiber-based sponges for atopic skin treatment” project carried out within the First TEAM program of the Foundation for Polish Science co-financed by the European Union under the European Regional Development Fund, project No POIR.04.04.00-00-4571/17-00.Notes and references
- A. Pappas, A. Liakou and C. C. Zouboulis, Rev. Endocr. Metab. Disord., 2016, 17, 443–448 CrossRef PubMed.
- B. Y. Chung, J. H. Kim, S. I. Cho, I. S. Ahn, H. O. Kim, C. W. Park and C. H. Lee, Ann. Dermatol., 2013, 25, 285–291 CrossRef CAS PubMed.
- R. Muggli, Int. J. Cosmet. Sci., 2005, 27, 243–249 CrossRef CAS PubMed.
- M. Schlichte, A. Vandersall and R. Katta, Dermatology Practical Conceptual, 2016, 6, 23–29 Search PubMed.
- D. F. Horrobin, Am. J. Clin. Nutr., 2000, 71, 367–372 CrossRef PubMed.
- M. Timoszuk, K. Bielawska and E. Skrzydlewska, Antioxidants, 2018, 7, 1–11 CrossRef PubMed.
- D. Stonemetz, Holistic Nursing Practice, 2008, 22, 171–174 CrossRef PubMed.
- P. A. Lio, Curr. Allergy Asthma Rep., 2013, 13, 528–538 CrossRef CAS PubMed.
- G. González-López, R. M. Ceballos-Rodríguez, J. J. González-López, M. Feito Rodríguez and P. Herranz-Pinto, Br. J. Dermatol., 2017, 177, 688–695 CrossRef PubMed.
- A. P. Oranje, A. C. A. Devillers, B. Kunz, S. L. Jones, L. Deraeve, D. Van Gysel, F. B. de Waard-van der Spek, R. Grimalt, A. Torrelo, J. Stevens and J. Harper, J. Eur. Acad. Dermatol. Venereol., 2006, 20, 1277–1286 CrossRef CAS PubMed.
- J. S. Boateng, K. H. Matthews, H. N. E. Stevens and G. M. Eccleston, J. Pharm. Sci., 2008, 97, 2892–2923 CrossRef CAS PubMed.
- J. Ding, J. Zhang, J. Li, D. Li, C. Xiao, H. Xiao, H. Yang, X. Zhuang and X. Chen, Prog. Polym. Sci., 2019, 90, 1–34 CrossRef CAS.
- M. Rahmani, S. Arbabi Bidgoli and S. M. Rezayat, Nanomed. J., 2017, 4, 61–70 CAS.
- S. Agarwal, J. H. Wendorff and A. Greiner, Polymer, 2008, 49, 5603–5621 CrossRef CAS.
- H. Cheng, X. Yang, X. Che, M. Yang and G. Zhai, Mater. Sci. Eng., C, 2018, 90, 750–763 CrossRef CAS PubMed.
- S. P. Miguel, D. R. Figueira, D. Simões, M. P. Ribeiro, P. Coutinho, P. Ferreira and I. J. Correia, Colloids Surf., B, 2018, 169, 60–71 CrossRef CAS PubMed.
- M. Liu, X. P. Duan, Y. M. Li, D. P. Yang and Y. Z. Long, Mater. Sci. Eng., C, 2017, 76, 1413–1423 CrossRef CAS PubMed.
- S. Homaeigohar and A. R. Boccaccini, Acta Biomater., 2020, 107, 25–49 CrossRef CAS PubMed.
- R. S. Ambekar and B. Kandasubramanian, Eur. Polym. J., 2019, 117, 304–336 CrossRef CAS.
- S. Wang, Y. Li, R. Zhao, T. Jin, L. Zhang and X. Li, Int. J. Biol. Macromol., 2017, 104, 708–715 CrossRef CAS PubMed.
- I. Unalan, S. J. Endlein, B. Slavik, A. Buettner, W. H. Goldmann, R. Detsch and A. R. Boccaccini, Pharmaceutics, 2019, 11(11), 570 CrossRef CAS PubMed.
- J. P. Chen, G. Y. Chang and J. K. Chen, Colloids Surf., A, 2008, 313–314, 183–188 CrossRef.
- Z. J. Krysiak, J. Knapczyk-Korczak, G. Maniak and U. Stachewicz, Colloids Surf., B, 2021, 199, 111554 CrossRef CAS PubMed.
- S. Metwally, D. P. Ura, Z. J. Krysiak, Ł. Kaniuk, P. K. Szewczyk and U. Stachewicz, Membranes, 2020, 11, 26 CrossRef PubMed.
- B. H. A. Rehm, Biochem. J., 2003, 376, 15–33 CrossRef CAS PubMed.
- M. L. Tebaldi, A. L. C. Maia, F. Poletto, F. V. de Andrade and D. C. F. Soares, J. Drug Delivery Sci. Technol., 2019, 51, 115–126 CrossRef CAS.
- J. Zhang, E. I. Shishatskaya, T. G. Volova, L. F. da Silva and G. Q. Chen, Mater. Sci. Eng., C, 2018, 86, 144–150 CrossRef CAS PubMed.
- Ł. Kaniuk, S. Ferraris, S. Spriano, T. Luxbacher, Z. Krysiak, K. Berniak, A. Zaszczynska, M. M. Marzec, A. Bernasik, P. Sajkiewicz and U. Stachewicz, Appl. Surf. Sci., 2021, 545, 148983 CrossRef.
- J. E. Karbowniczek, Ł. Kaniuk, K. Berniak, A. Gruszczyński and U. Stachewicz, Front. Bioeng. Biotechnol., 2021, 9, 1–13 Search PubMed.
- M. M. Hedrick, F. Wu, A. K. Mohanty and M. Misra, RSC Adv., 2020, 10, 44624–44632 RSC.
- H. Zhao, Z. Cui, X. Sun, L. S. Turng and X. Peng, Ind. Eng. Chem. Res., 2013, 52, 2569–2581 CrossRef CAS.
- Ł. Kaniuk, Z. J. Krysiak, S. Metwally and U. Stachewicz, Mater. Sci. Eng., C, 2020, 110, 110668 CrossRef PubMed.
- P. Zou, H. Liu, Y. Li, J. Huang and Y. Dai, Mater. Lett., 2016, 179, 109–113 CrossRef CAS.
- P. Sinsup, V. Teeranachaideekul, A. Makarasen, L. Chuenchom, P. Prajongtat, S. Techasakul, P. Yingyuad and D. Dechtrirat, Membranes, 2021, 11(9), 648 CrossRef CAS PubMed.
- G. F. Shan, X. Gong, W. P. Chen, L. Chen and M. F. Zhu, Colloid Polym. Sci., 2011, 289, 1005–1014 CrossRef CAS.
- H. Yu, Z. Qin and Z. Zhou, Prog. Nat. Sci.: Mater. Int., 2011, 21, 478–484 CrossRef.
- L. Amaro, D. M. Correia, P. M. Martins, G. Botelho, S. A. C. Carabineiro, C. Ribeiro and S. Lanceros-Mendez, Polymers, 2020, 12, 953 CrossRef CAS PubMed.
- L. Amaro, D. M. Correia, T. Marques-Almeida, P. M. Martins, L. Pérez, J. L. Vilas, G. Botelho, S. Lanceros-Mendez and C. Ribeiro, Int. J. Mol. Sci., 2018, 19(8), 2149 CrossRef PubMed.
- Y. Xu, L. Zou, H. Lu and T. Kang, RSC Adv., 2017, 7, 4000–4010 RSC.
- A. Bianco, M. Calderone and I. Cacciotti, Mater. Sci. Eng., C, 2013, 33, 1067–1077 CrossRef CAS PubMed.
- W. Meng, Z. C. Xing, K. H. Jung, S. Y. Kim, J. Yuan, I. K. Kang, S. C. Yoon and H. I. Shin, J. Mater. Sci.: Mater. Med., 2008, 19, 2799–2807 CrossRef CAS PubMed.
- B. Veleirinho, D. S. Coelho, P. F. Dias, M. Maraschin, R. M. Ribeiro-do-Valle and J. A. Lopes-da-Silva, Int. J. Biol. Macromol., 2012, 51, 343–350 CrossRef CAS PubMed.
- H. C. Chang and N. Sultana, Cogent Eng., 2017, 4, 1–11 Search PubMed.
- H. C. Chang, T. Sun, N. Sultana, M. M. Lim, T. H. Khan and A. F. Ismail, Mater. Sci. Eng., C, 2016, 61, 396–410 CrossRef CAS PubMed.
- K. J. Figueroa-Lopez, A. A. Vicente, M. A. M. Reis, S. Torres-Giner and J. M. Lagaron, Nanomaterials, 2019, 9, 1–21 CrossRef PubMed.
- J. Paciorek-Sadowska, M. Borowicz, B. Czupryński and M. Isbrandt, Polymers, 2018, 10(12), 1334 CrossRef PubMed.
- A. Buzarovska and A. Grozdanov, J. Mater. Sci., 2009, 44, 1844–1850 CrossRef CAS.
- M. Kouhi, M. Fathi, M. P. Prabhakaran, M. Shamanian and S. Ramakrishna, Appl. Surf. Sci., 2018, 457, 616–625 CrossRef CAS.
- S. N. Gorodzha, A. R. Muslimov, D. S. Syromotina, A. S. Timin, N. Y. Tcvetkov, K. V. Lepik, A. V. Petrova, M. A. Surmeneva, D. A. Gorin, G. B. Sukhorukov and R. A. Surmenev, Colloids Surf., B, 2017, 160, 48–59 CrossRef CAS PubMed.
- V. Chiono, G. Ciardelli, G. Vozzi, M. G. Sotgiu, B. Vinci, C. Domenici and P. Giusti, J. Biomed. Mater. Res., Part A, 2008, 85, 938–953 CrossRef PubMed.
- S. J. Organ and P. J. Barham, J. Mater. Sci., 1991, 26, 1368–1374 CrossRef CAS.
- U. Stachewicz, R. J. Bailey, W. Wang and A. H. Barber, Polymer, 2012, 53, 5132–5137 CrossRef CAS.
- D. H. Reneker and A. L. Yarin, Polymer, 2008, 49, 2387–2425 CrossRef CAS.
- J. F. Dijksman and U. Stachewicz, in International Conference on Digital Printing Technologies, Society for Imaging Science and Technology, 2021, vol. 2021 October, pp. 5–27 Search PubMed.
- M. M. Hohman, M. Shin, G. Rutledge and M. P. Brenner, Phys. Fluids, 2001, 13, 2201–2220 CrossRef CAS.
- I. Engelberg and J. Kohn, Biomaterials, 1991, 12, 292–304 CrossRef CAS PubMed.
- W. J. Li, J. A. Cooper, R. L. Mauck and R. S. Tuan, Acta Biomater., 2006, 2, 377–385 CrossRef PubMed.
- Ł. Kaniuk and U. Stachewicz, ACS Biomater. Sci. Eng., 2021, 7(12), 5339–5362 CrossRef PubMed.
- Y. Lin, K. Y. Zhang, Z. M. Dong, L. S. Dong and Y. S. Li, Macromolecules, 2007, 40, 6257–6267 CrossRef CAS.
- P. Pan and Y. Inoue, Prog. Polym. Sci., 2009, 34, 605–640 CrossRef CAS.
- H. W. Tong, M. Wang and W. W. Lu, J. Biomater. Sci., Polym. Ed., 2011, 22, 2475–2497 CrossRef CAS PubMed.
- H. W. Tong, M. Wang and W. W. Lu, J. Biomater. Sci., Polym. Ed., 2012, 23, 779–806 CrossRef CAS PubMed.
- S. Metwally, D. P. Ura, Z. J. Krysiak, Ł. Kaniuk, P. K. Szewczyk and U. Stachewicz, Membranes, 2021, 11, 1–13 Search PubMed.
- S. C. Wong, A. Baji and S. Leng, Polymer, 2008, 49, 4713–4722 CrossRef CAS.
- H.-W. Tong and M. Wang, Anasthesiologie und Intensivmedizin, 2016, 57, 147–151 Search PubMed.
- U. Stachewicz, F. Hang and A. H. Barber, Langmuir, 2014, 30, 6819–6825 CrossRef CAS PubMed.
- X. Wang, J. F. Najem, S. C. Wong and K. T. Wan, J. Appl. Phys., 2012, 111, 024315 CrossRef.
- U. Stachewicz, I. Peker, W. Tu and A. H. Barber, ACS Appl. Mater. Interfaces, 2011, 3, 1991–1996 CrossRef CAS PubMed.
- J. X. Liu, W. H. Dong, X. J. Mou, G. S. Liu, X. W. Huang, X. Yan, C. F. Zhou, S. Jiang and Y. Z. Long, ACS Appl. Bio Mater., 2020, 3, 302–307 CrossRef CAS PubMed.
- R. Zimmermann, U. Freudenberg, R. Schweiß, D. Küttner and C. Werner, Curr. Opin. Colloid Interface Sci., 2010, 15, 196–202 CrossRef CAS.
- D. Cho, S. Lee and M. W. Frey, J. Colloid Interface Sci., 2012, 372, 252–260 CrossRef CAS PubMed.
- A. M. Gallardo-Moreno, V. Vadillo-Rodríguez, J. Perera-Núñez, J. M. Bruque and M. L. González-Martín, Phys. Chem. Chem. Phys., 2012, 14, 9758–9767 RSC.
- A. Yaroshchuk and T. Luxbacher, Langmuir, 2010, 26, 10882–10889 CrossRef CAS PubMed.
- A. Yaroshchuk and V. Ribitsch, Langmuir, 2002, 18, 2036–2038 CrossRef CAS.
- Z. J. Krysiak, Ł. Kaniuk, S. Metwally, P. K. Szewczyk, E. A. Sroczyk, P. Peer, P. Lisiecka-Graca, R. J. Bailey, E. Bilotti and U. Stachewicz, ACS Appl. Bio Mater., 2020, 3(11), 7666–7676 CrossRef CAS PubMed.
- P. K. Szewczyk, D. P. Ura, S. Metwally, J. Knapczyk-Korczak, M. Gajek, M. M. Marzec, A. Bernasik and U. Stachewicz, Polymers, 2019, 11(1), 34 CrossRef PubMed.
- S. Kamble, S. Agrawal, S. Cherumukkil, V. Sharma, R. V. Jasra and P. Munshi, Materials Science inc. Nanomaterials & Polymers.
- E. Chibowski and A. Waksmundzki, A Relationship between the Zeta Potential and Surface Free Energy Changes of the Sulfur/n-Heptane-Water System, 1978, vol. 66 Search PubMed.
- E. Proksch, J. Dermatology, 2018, 45, 1044–1052 CrossRef CAS PubMed.
- D. J. Panther and S. E. Jacob, J. Clin. Med., 2015, 4, 970–978 CrossRef CAS PubMed.
- Y. Hatano, M. Man, Y. Uchida, D. Crumrine, C. Tiffany, E. G. Kim, T. M. Mauro, K. R. Feingold, M. Peter and W. M. Holleran, J. Invest. Dermatol., 2009, 129, 1824–1835 CrossRef CAS PubMed.
- H. J. Lee, N. R. Lee, B. K. Kim, M. Jung, D. H. Kim, C. S. Moniaga, K. Kabashima and E. H. Choi, Exp. Dermatol., 2017, 26, 66–72 CrossRef CAS PubMed.
- M. Glatz, J. Jo, E. A. Kennedy, E. C. Polley, J. A. Segre, E. L. Simpson and H. H. Kong, J. Invest. Dermatol., 2015, 135, S28–S48 Search PubMed.
- T. Czarnowicki, J. G. Krueger and E. Guttman-Yassky, J. Allergy Clin. Immunol., 2017, 139, 1723–1734 CrossRef CAS PubMed.
- S. Xu, S. Immaneni, G. B. Hazen, J. I. Silverberg, A. S. Paller and P. A. Lio, JAMA Pediatrics, 2017, 171, 5–8 CrossRef PubMed.
- P. K. Szewczyk, D. P. Ura, S. Metwally, J. Knapczyk-Korczak, M. Gajek, M. M. Marzec, A. Bernasik and U. Stachewicz, Polymers, 2019, 11(1), 34 CrossRef PubMed.
- A. Haider, S. Haider and I. K. Kang, Arabian J. Chem., 2018, 11(8), 1165–1188 CrossRef CAS.
- X. Liu, T. Lin, Y. Gao, Z. Xu, C. Huang, G. Yao, L. Jiang, Y. Tang and X. Wang, J. Biomed. Mater. Res., Part B, 2012, 100 B, 1556–1565 CrossRef PubMed.
- B. Balakrishnan, M. Mohanty, P. R. Umashankar and A. Jayakrishnan, Biomaterials, 2005, 26, 6335–6342 CrossRef CAS PubMed.
- M. Thirugnanaselvam, N. Gobi and S. Arun Karthick, Fibers Polym., 2013, 14, 965–969 CrossRef CAS.
- E. A. Sroczyk, K. Berniak, M. Jaszczur and U. Stachewicz, Chem. Eng. J., 2021, 429, 132256 CrossRef.
- K. Maliyar, C. Sibbald, E. Pope and R. G. Sibbald, Adv. Skin Wound Care, 2018, 31, 538–550 CrossRef PubMed.
- S. Purnamawati, N. Indrastuti, R. Danarti and T. Saefudin, Clin. Med. Res., 2017, 15, 75–87 CrossRef PubMed.
Footnote |
| † Electronic supplementary information (ESI) available. See DOI: 10.1039/d1tb02805g |
| This journal is © The Royal Society of Chemistry 2022 |