 Open Access Article
Phosphonate coating of commercial iron oxide nanoparticles for nanowarming cryopreserved samples†
Jacqueline L.
Pasek-Allen
 a,
Randall K.
Wilharm
 b,
Zhe
Gao
 c,
Valerie C.
Pierre
 *b and
John C.
Bischof
 *ac
*ac
aDepartment of Biomedical Engineering, University of Minnesota, 312 Church St. SE, Minneapolis, MN 55455, USA. E-mail: pasek019@umn.edu; Bischof@umn.edu
bDepartment of Chemistry, University of Minnesota, 207 Pleasant St SE, Minneapolis, MN 55455, USA. E-mail: wilha013@umn.edu; pierre@umn.edu
cMechanical Engineering, University of Minnesota, 111 Church Street Se, Minneapolis, MN 55455, USA. E-mail: gaozhemm@gmail.com
First published on 25th April 2022
Abstract
New preservation technologies may allow for organ banking similar to blood and biomaterial banking approaches. Using cryoprotective agents (CPAs), aqueous solutions with organic components such as DMSO, propylene glycol, and added salts and sugars, organs can be used to vitrify and store organs at −140 °C. When needed, these organs can be rewarmed in a rapid and uniform manner if CPAs are supplemented with iron oxide nanoparticles (IONPs) in an applied radiofrequency field. Speed and uniformity of warming are both IONP concentration and CPA suspension dependent. Here we present a coating method of small molecule phosphonate linker (PLink) and biocompatible polymer (i.e. polyethylene glycol PEG) that tunes stability and increases the maximum allowable concentration of IONPs in CPA suspension. PLink contains a phosphonate 'anchor' for high irreversible binding to iron oxide and a carboxylic acid 'handle' for ligand attachment. PLink-PEG removes and replaces the initial coating layer of commercially available IONPs (EMG1200 (hydrophobic) and EMG308 (hydrophilic) Ferrotec, Inc., increasing colloidal stability and decreasing aggregation in both water and CPAs, (verified with dynamic light scattering) from minutes (uncoated) to up to 6 days. Heating properties of EMG1200, specific absorption rate (SAR), measured using an applied field of 360 kHz and 20 kA m−1, increased from 20 to 180 W per g Fe with increasing PLink-PEG5000. PEG replacing the initially hydrophobic coating decreased aggregation in water and CPA, consistent with earlier studies on heating performance. Furthermore, although the size is minimized at 0.20 mol PEG per g Fe, heating is not maximized until concentrations above 0.43 mol PEG per g Fe on EMG1200. SAR on hydrophilic EMG308 was preserved at 400 W per g Fe regardless of the amount of PLink added to the core. Herein concentrations of IONP in VS55 (common CPA) significantly above our previous capabilities, sIONP at 10 mg Fe per mL, was reached, 25 mg Fe per mL of 308-PEG5000 and 60 mg Fe per mL of 1200-PEG5000, approaching stock EMG308 in water, 60 mg Fe per mL. Furthermore, at these concentrations cryopreserved Human dermal fibroblast cells were successfully nanowarmed (at applied fields described above), with higher viability as compared to convective rewarming in a water bath and heating rate close to 200 °C min−1, 2.5 times faster than our current system. Using PLink as the coating method allowed for higher concentrations of IONPs to be successfully suspended in CPA without affecting the heating ability. Additionally, the model ligand, PEG, allowed for increased stability over time in nanowarming experiments.
Introduction
The inability to preserve donated organs for more than a few hours contributes to organ shortages, poor organ matching (i.e. harsh immune suppression and graft rejection), and limitations to the length and quality of life for organ transplant recipients.1–3 Each year approximately 30![[thin space (1/6-em)]](https://www.rsc.org/images/entities/char_2009.gif) 000 patients are added to the kidney transplant list, but only about 17
000 patients are added to the kidney transplant list, but only about 17![[thin space (1/6-em)]](https://www.rsc.org/images/entities/char_2009.gif) 000 kidney transplants take place each year.4 In 2015 of the almost 100
000 kidney transplants take place each year.4 In 2015 of the almost 100![[thin space (1/6-em)]](https://www.rsc.org/images/entities/char_2009.gif) 000 patients on the kidney transplant waiting list, close to 5 000 people died and an additional 4 154 were removed as they were too sick for transplant.4 Yet every year, thousands of potentially transplantable kidneys are discarded when their preservation limits are exceeded.1,4 Using carefully optimized cryoprotective agents (CPAs) and perfusion protocols, researchers have successfully cryopreserved multiple tissues and animal organs including kidneys in an ice-free vitrified, glassy or amorphous state, allowing for indefinite storage.5–10 However, these advances require fast and uniform warming to avoid ice crystallization and cracking that reduce the viability of tissues or organs on warming. Diminishing ice crystal formation on rewarming can be achieved with an increased rate of warming or by increasing the concentration of CPAs which retard ice formation but can increase toxicity. A solution to this problem is to use “nanowarming”, a new technology, based on radiofrequency excited iron oxide nanoparticles (IONPs) deployed within CPAs to rewarm vitrified biosamples.11 Using this approach, the higher the concentration of IONPs the faster the rates of heating, and therefore a lower concentration of CPA is needed to avoid ice damage.
000 patients on the kidney transplant waiting list, close to 5 000 people died and an additional 4 154 were removed as they were too sick for transplant.4 Yet every year, thousands of potentially transplantable kidneys are discarded when their preservation limits are exceeded.1,4 Using carefully optimized cryoprotective agents (CPAs) and perfusion protocols, researchers have successfully cryopreserved multiple tissues and animal organs including kidneys in an ice-free vitrified, glassy or amorphous state, allowing for indefinite storage.5–10 However, these advances require fast and uniform warming to avoid ice crystallization and cracking that reduce the viability of tissues or organs on warming. Diminishing ice crystal formation on rewarming can be achieved with an increased rate of warming or by increasing the concentration of CPAs which retard ice formation but can increase toxicity. A solution to this problem is to use “nanowarming”, a new technology, based on radiofrequency excited iron oxide nanoparticles (IONPs) deployed within CPAs to rewarm vitrified biosamples.11 Using this approach, the higher the concentration of IONPs the faster the rates of heating, and therefore a lower concentration of CPA is needed to avoid ice damage.
Successful translation of nanowarming technology requires IONPs with scalable synthesis (>1 g per batch), that are biocompatible, produce high heating, and disperse evenly throughout a CPA.11,12 Bare IONPs can be toxic to cells and tend to aggregate in CPAs, and coatings are required for biocompatibility and even dispersion.13–16 CPAs are aqueous solutions with components of salts, sugars and organic solvents. The organic components of CPAs decrease the van der Waals forces of adsorbed ligands, causing loss of coating and IONPs to aggregate or sediment in solution.17,18 Salt solutions, with a high ionic strength reduce the impact of electrostatic forces separating nanoparticles, resulting in aggregation.19 While multiple methods to coat IONPs have been reported (silica, starch, dextran and adsorbed PEG), a simple, scalable, cost-effective coating method that maintains the high heating and imaging capacity of IONPs in CPAs is still needed. We have shown that silica coated IONPs, using a small PEG layer, sIONPs, can be used for nanowarming in small animal models and in vitro testing, but at more than $2 per mg Fe, they are expensive and labour intensive for clinical applications.11,20 To advance nanowarming applications the cost of IONP formulation must be accessible for large scale organs. For instance, when planning on perfusing IONP into a human scale organ, grams of coated colloidally stable IONPs are needed on a daily basis. Human scale (porcine, primate) kidneys require 2.2 g Fe of fresh IONPs at 10 mg Fe per mL for perfusion and the surrounding solution.21 Hundreds of human scale organs will be needed to be tested for method preparations, uniformity of perfusion, cryopreservation and nanowarming, and toxicity.
The drawback with the silica coating of the sIONP is the thickness of the silica shell, 18 nm, which increases the volume per nanoparticle thereby decreases the maximum concentration of IONP cores, and therefore heating capabilities in CPA.
Based on our prior studies with iron oxide nanoparticles contrast agents for magnetic resonance imaging, we hypothesize that a phosphonate-based linker will allow for large scale anchoring of ligands directly onto iron oxide cores, without a thick silica shell to make a large quantity of cheap IONPs for biomedical applications.17,18,22–24 Developing this coating method would lead the way to an affordable IONP for organ nanowarming and other applications that require high concentrations of IONPs in CPA for faster heating.
We have synthesized and characterized a phosphonate linker, called PLink, to functionalize two commercially available iron oxide nanoparticle (IONP) cores. IONPs were coated with PEG as a model compound, to determine Plink's effect on core heating and NP stability in water and CPA. Three different molecular weights (MW) of PEG were investigated, 500, 2000 and 5000 Da, based on our current sIONP coating method, and commonly used PEG MW to prevent cellular uptake.12,13 Ligand exchange was determined by thermal gravimetric analysis (TGA) and high resolution magic angle spin (HRMAS) nuclear magnetic resonance (NMR) to show removal of the initial ligand and replacement with PEG. We studied the surface coverage of IONPs through stability in water, and CPA. The effect of linkage on heating was tested to determine the feasibility of phosphonate coating. Finally, we tested the cell viability of nanowarmed cells using our best coating method on both IONPs.
Experimental
Materials and methods
Unless otherwise noted, starting materials were obtained from commercial suppliers and used without further purification. IONPs, EMG308 and EMG1200, were purchased from Ferrotec inc. Pd-10 column G25 sephadex media were purchased from Global Life Sciences solutions USA LLC. Neodymium magnetic blocks 2′′ × 1′′ × 1/2′′ N52 and 4′′ × 1′′ × 1/2′′ bar magnets, purchased from CMS Magnetics.General characterization
1H, 13C, and 31P NMR spectra were recorded on a Bruker Avance III HD nanobay AX-400 at 400, 101 or 162 MHz respectively; with chemical shifts referenced to appropriate internal standards. Data for 1H, 13C, and 31P NMR are recorded as follows: chemical shift (d, ppm), multiplicity (s, singlet; d, doublet; t, triplet; m, multiplet) integration, and coupling constant. High resolution (HR) electrospray ionization time-of-flight mass spectrometry (ESI/TOF-MS) was carried out on a Bruker BoTOF I at the LeClaire-DOW instrumentation facility of the Department of Chemistry of the University of Minnesota. FTIR spectra were recorded on a ThermoFisher Scientific Nicolet iS FT-IR spectrometer. TEM images were collected on a FEI Tecnai T12 at 120 kV. Nanoparticle size was determined by dynamic light scattering (DLS) measurements on a Brookhaven Zeta PALS instrument (Brookhaven Instruments Corporation) with a 635 nm diode laser at 15 mW of power. The stability of the colloidal suspension was determined by DLS time points at the same concentration, taken several times in the first 24 hours and then on daily or weekly intervals up to 4 weeks. Measurements were stopped when visual precipitation occurred. The stability was tested in water, and CPA VS55 with Euro Collins carrier solution, Table S1 (ESI†).25 A thermogravimetric analyser (TGA, Model 951, TA Instruments, New Castle, DE) was connected to a thermal analysis operating system (Thermal Analyst 2000, TA Instruments). Approximately 5–10 mg of the sample, in an open aluminium pan, was heated in the TGA from room temperature to 300 °C at 10 °C min−1 under nitrogen purge. Data was collected from lyophilized IONPs with the following method; remove residual water: temperature increase to 100 °C at 20 °C min−1, hold for 10 minutes, increase temperature to 800 °C at 10 °C min−1.Elemental analysis via inductively coupled plasma optical emission spectroscopy (ICP-OES) on a PerkinElmer Optima 3000V was performed by the Soil Testing and Research Analytical Laboratory of the University of Minnesota, Twin-Cities. Prior to the analysis by ICP, IONPs were digested using 0.2 mL of stock IONP solution, and 0.4 mL concentrated nitric acid in a flame sealed glass ampule at 100 °C overnight. Relaxometry (magnetic relaxometer, MQ60 TD-NMR ANALYZER VT (Bruker Biospin Corporation, MA) was used for further iron quantification following our previously published method.22 A linear regression of 1/T1vs. ICP Fe of digested IONPs was determined from a range of concentrations (0.1, 0.6, 1, 3, 6, 12 mg Fe per mL).
Synthesis of the phosphonate linker of PEG to IONP
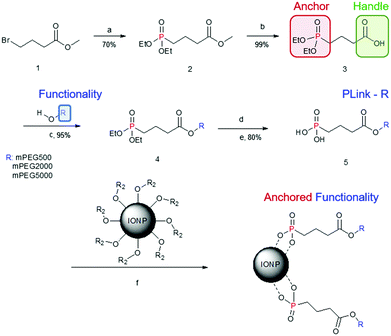
The following compounds were synthesized based on the scheme in Fig. 1, based on a similar phosphonate linkage method from previous co-workers research.26PEG2000: 1H NMR (400 MHz, CDCl3) δ 4.25 (t, 2H), 4.19–4.04 (m, 4H), 3.75–3.62 (m, 180H), 3.57 (t, 2H), 3.40 (s, 3H), 2.48 (t, J = 7.2 Hz, 2H), 2.00–1.88 (m, 1H), 1.88–1.75 (m, 1H), 1.34 (t, J = 7.1 Hz, 6H). 13C NMR (101 MHz, CDCl3) δ 173.20 (s, 1C), 71.94 (s, 1C), 70.57 (s, 1C), 69.11 (s, 1C), 63.59 (s, 1C), 61.53 (d, J = 6.4 Hz, 2C), 59.04 (s, 1C), 34.17 (d, J = 15.9 Hz, 1C), 24.93 (d, J = 141.8 Hz, 1C), 18.12 (d, J = 4.8 Hz, 1C), 16.46 (d, J = 6.1 Hz, 2C). 31P NMR (162 MHz, CDCl3) δ 31.15 (s, 1P). IR νmax/cm−1: 3459, 2944, 2882, 2804, 2694, 1732, 1646, 1467, 1418, 1360, 1327, 1280, 1233, 1147, 1114, 1061, 947, 842.
PEG5000: 1H NMR (400 MHz, CDCl3) δ 4.25 (t, 2H), 4.19–4.04 (m, 4H), 3.75–3.62 (m, 453H), 3.57 (t, 2H), 3.40 (s, 3H), 2.48 (t, J = 7.2 Hz, 2H), 2.00–1.88 (m, 1H), 1.88–1.75 (m, 1H), 1.34 (t, J = 7.1 Hz, 6H). 13C NMR (101 MHz, CDCl3) δ 173.20 (s, 1C), 71.94 (s, 1C), 70.57 (s, 1C), 69.11 (s, 1C), 63.59 (s, 1C), 61.53 (d, J = 6.4 Hz, 2C), 59.04 (s, 1C), 34.17 (d, J = 15.9 Hz, 1C), 24.93 (d, J = 141.8 Hz, 1C), 18.12 (d, J = 4.8 Hz, 1C), 16.46 (d, J = 6.1 Hz, 2C). 31P NMR (162 MHz, CDCl3) δ 31.15 (s, 1P). IR νmax/cm−1: 3466, 2945, 2883, 2804, 2694, 1733, 1649, 1467, 1413, 1360, 1344, 1280, 1234, 1148, 1115, 1061, 947, 842.
PEG2000: 1H NMR (400 MHz, CDCl3) δ 4.27 (t, 2H), 3.66 (m, 180H), 3.57 (t, 2H), 3.40 (s, 2H), 2.51 (t, J = 7.1 Hz, 2H), 2.07–1.92 (m, 2H), 1.90–1.76 (m, 2H). 13C NMR (101 MHz, CDCl3) δ 173.20 (s, 1C), 71.94 (s, 1C), 70.57 (s, 1C), 69.11 (s, 1C), 63.59 (s, 1C), 59.04 (s, 1C), 34.17 (d, J = 15.9 Hz, 1C), 24.93 (d, J = 141.8 Hz, 1C), 18.12 (d, J = 4.8 Hz, 1C). 31P NMR (162 MHz, CDCl3) δ 31.15 (s, 1P). IR νmax/cm−1: 3526, 2882, 2694, 1733, 1653, 1467, 1413, 1360, 1340, 1280, 1234, 1145, 1114, 1061, 946, 842.
PEG5000: 1H NMR (400 MHz, CDCl3) δ 4.27 (t, 2H), 3.66 (m, 443H), 3.57 (t, 2H), 3.40 (s, 2H), 2.51 (t, J = 7.1 Hz, 2H), 2.07–1.92 (m, 2H), 1.90–1.76 (m, 2H). 13C NMR (101 MHz, CDCl3) δ 173.20 (s, 1C), 71.94 (s, 1C), 70.57 (s, 1C), 69.11 (s, 1C), 63.59 (s, 1C), 59.04 (s, 1C), 34.17 (d, J = 15.9 Hz, 1C), 24.93 (d, J = 141.8 Hz, 1C), 18.12 (d, J = 4.8 Hz, 1C). 31P NMR (162 MHz, CDCl3) δ 31.15 (s, 1P). IR νmax/cm−1: 3418, 2945, 2883, 2805, 1467, 1360, 1340, 1280, 1234, 1148, 1114, 1060, 946, 842.
High resolution magic angle spin (HRMAS) NMR
Lyophilized IONPs were added to 99.96% D2O and bath sonicated for 10 minutes. Approximately 10 μL of 0.5–1 mg Fe per mL solution was loaded onto the HRMAS NMR tube insert and approximately 20 μL pure solvent was added to dilute the solution to result in a pale brown color, Fig. S10 (ESI†). The insert was sealed with the insert pressure cap and secondary screw cap, HR-MAS disposable insert kit. The sealed insert is then inserted into the zirconium tube and pressure caped with a rotor, 4 mm MAS Rotor Kit, Bruker. The samples were then loaded on the NMR, Bruker 700 MHz Avance 4 mm High Resolution Magic-Angle Spinning inverse-detect probe and spun at 6000 Hz, 25 °C, after locking to D2O, the probe was tuned for 1H acquisition. Shims were manually adjusted, using a single scan refreshing every 0.5 second. The peak shape and width at half max of D2O was optimized by increasing or decreasing shims: Z, Y, X, ZY, ZY2, Z2, Z4, and Z5. Manual shimming the D2O allowed for significantly increased resolution of peaks, where highest grade D2O gave the best results. Adjusting the phase of the spectra in the instrument during shimming, increased the resolution and allowed for easier data processing.Specific absorption rate (SAR)

| (1) |
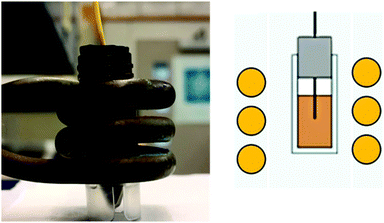
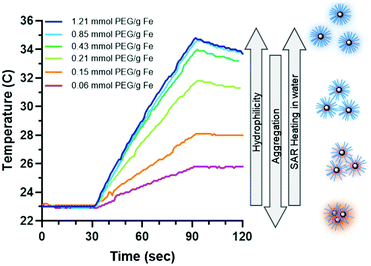
The heating rate was determine as previously described using a 1 kW Hotshot inductive heating system with 2.75-turn, water-cooled copper coil (Ameritherm Inc., Scottsville, NY), 360 kHz and 20 kA m−1.20,27,28 Briefly, 1 mL (approximately 6 mg Fe per mL) of stock solution was added to a cryotube, Fig. 3. The cryotube was capped with a rubber stopper, with a fibreoptic thermocouple through the center. The temperature was recorded in 1 second intervals for 120 seconds, the initial 30 seconds for temp stabilization, 60 seconds while the coil is on and 30 seconds after the coil is off. Water and VS55 are used as the reference of coil heating. SAR is calculated using eqn (1), and the first 30 seconds of temperature.
Cell studies
IONP toxicity was studied based on our previously published protocol for sIONP using HDF cells.12 Briefly, cells were incubated with 0.3 mLs of PLink-PEG5000 0.8 mmol PEG per g Fe coated EMG308 or EMG1200 respectively in biological media for 24 hours at concentrations of 0.1, 0.5, 1, 5, and 10 mg Fe per mL.CPA loading with IONP toxicity was tested using our CPA step loading method at 4 °C to mimic organ perfusion.11 HDF cells were subjected to CPA for 25 minutes in 3 minute steps, each with increasing concentrations of VS55, with IONPs at 1, 5, and 10 mg Fe per mL added in the final 3 minutes.12,29 CPAs at high concentration at room temperature and above can lead to toxicity, thus the time interval and temperature (≤4 °C) were designed to limit any injury.20,29
Cellular viability after cryopreservation with or without IONPs in HDF cells was tested in three experimental groups all step loaded with CPA VS55 with the following procedure: (1) HDF cells vitrified with IONPs at concentrations ranging within 8–60 mg Fe per mL and nanowarmed using an RF coil, (2) HDF cells vitrified without IONPs and warmed convectively in a water bath at 37 °C, at 80 °C min−1 warming, and (3) HDF cells without IONPs slow warmed at 6 °C min−1 warming, data not shown.12 Hoechst-PI stains was used to determine viability.
Results and discussion
Synthesis of PLink and IONP coating
The synthesis is versatile yet inexpensive and scalable for attaching PEG or other ligands onto IONP cores through the linker, “PLink”. This linker (Fig. 1) consists of a phosphonate “anchor” and a carboxyl “handle.” The anchor has a high affinity toward iron oxide, and the handle enables functional molecules to attach to the IONP without affecting phosphonate binding to iron oxide. Other researchers have tested using phosphonates as linkers to IONPs.22,30,31 Davis, et al. also used a 5 step synthesis, but it required centrifugation to purify the final step. This is less desirable for scale up as the time for centrifugation increases with volume. Additionally their synthesis uses an amide vs a carboxyl handle which can be more reactive or charged in salt solutions. Goff et al. also used a 5 step synthesis, but it used sulfur, silica, and charged nitrogen. This synthesis is more complicated and requires polymerization of PEG rather than a coupling attachment. The charged nitrogen will likely create stability issues in a salt solution or in an organ perfusion.PLink-PEG is inexpensive to make, and the time for synthesis and purification estimated for large scale synthesis is low as shown in Table S2 (ESI†). Furthermore, the purification of PLink is very scalable, as reaction ‘a’ is a distillation, reaction ‘b’ is a phase separation, and reactions ‘c’ and ‘e’ are filtrations. The most expensive material and time consuming purification is the addition of the Plink-PEG to the IONPs. EMG308 is 102$ per g Fe and EMG1200 is 26$ per g Fe. We expect future large scale purification will be done using tangential flow filtration (TFF), a continuous circulation of IONPs over a molecular weight cut off filter, which is expected to take 5 hours per 25 g of Fe. Our sIONP synthesis currently takes approximately 1 week for 1.4 g Fe.12
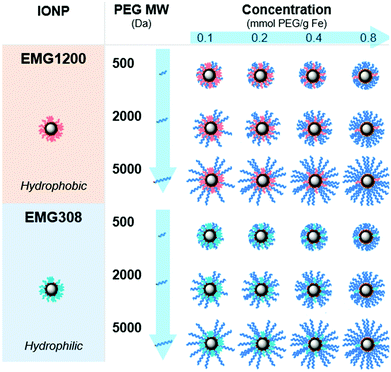
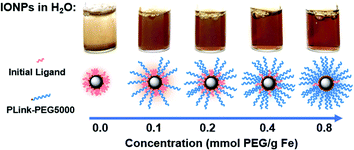
Plink is very small, 6 atoms long, allowing for attachment of CPA stable ligands to IONPs without adding significant thickness. PEG was chosen as a model ligand and the co-dissolution method for exchange is sufficient to coat the IONPs in Plink-PEG. CPA vitrification solution was comprised of 55% organic components which is termed VS55.25 This model CPA has been used for viability and previous work in our lab. A range of PEG MW (500, 2000, and 5000 Da) and increasing concentrations in the reaction as shown in Fig. 2 were used to determine the amount of PEG needed to achieve colloidal stability of IONPs in CPA. This PEG MW range corresponds to the size of sIONPs (500 Da) and the MW of PEG has been shown in the literature to stabilize gold NPs (5000 Da).14 IONPs with initially hydrophobic or hydrophilic initial coatings were used to confirm the feasibility of the PLink coating method on the majority of IONPs. Two IONPs were used, EMG1200, hydrophobic, and EMG308, initially hydrophilic. EMG308 has high heating capabilities and is inexpensive (SAR of 400 W per g Fe, approximately 100$ per g Fe). In our previous studies we coated EMG308 with silica and PEG to achieve long term colloidal stability in VS55.12 EMG1200 has the same core as EMG308 but is coated with a hydrophobic fatty acid. Successful ligand exchange of the hydrophobic fatty acid with PEG will allow this IONP to become dispersible in aqueous solutions, an easy visual test as shown in Fig. 4. The EMG1200 became stable in water with 0.2 mmol PEG5000 per g Fe IONPs, Fig. S9 (ESI†). The colloidal stability in water also affects IONP heating and imaging properties. Testing the ligand exchange of hydrophilic model polymer PEG, on hydrophilic EMG308 allowed determination if the Linker affected the heating and imaging properties of a IONP while not affecting the solubility in water.
Size characterization
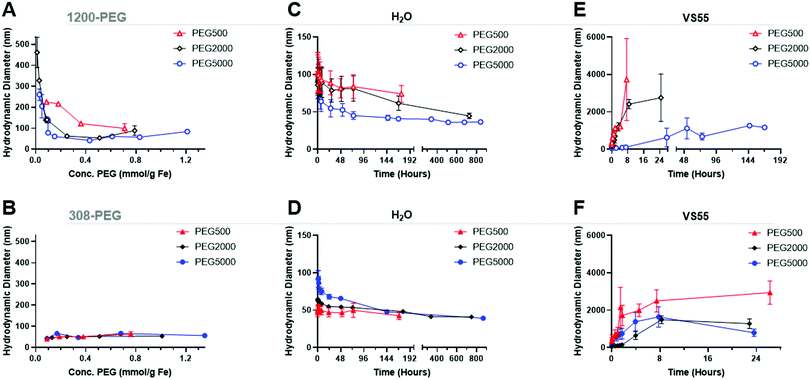
Dynamic light scattering (DLS) was used to measure the hydrodynamic size of coated IONPs, Fig. 5A and B. The size of PEG coated EMG1200 decreased with increasing amount of PEG added to the reaction. With 0.8 mmol PEG per g Fe of 500, 2000, or 5000 MW PEG the IONP size was below 100 nm and close to the size of EMG308, 40 nm. Increasing the MW of PEG allowed a decrease in size at lower concentrations. 1200-PEG5000, EMG1200 coated with PEG, at 0.02 mmol is 240 nm, but at 0.15 it is 61 nm. Whereas, 1200-PEG500 is 225 at 0.09 mmol PEG per g Fe but at 0.2 mmol PEG per g Fe it is significantly larger at 216 nm. The increased hydrophilicity of longer PEGs overcomes the hydrophobicity of FA at lower concentrations. The size is initially high due to aggregation from the hydrophobicity of FA. The size decreases with increasing PEG (MW and concentration) as FA is replaced with PEG, resulting in decreased aggregation and increased stability.14The EMG308 has little change in size due to the addition of PEG, Fig. 5B, as both PEG and the initial hydrophilic surfactant are soluble in water. At 0.2 mmol PEG per g Fe of any MW all coated EMG308 were ∼40 nm in size, corresponding to the smallest size of PEG5000 coated EMG1200. There is a slight increase in size with the addition of PEG at ∼0.4 mmol PEG per g Fe: where 308-PEG500, 2000 and 5000 are respectively, 51 nm, 53 nm, and 48 nms, which can be attributed to steric interactions between PEG and the initial hydrophilic surfactant. TEM was used to verify this result, Fig. S8 (ESI†), and virtually no difference can be discerned between uncoated EMG1200, EMG308 and 0.8 mmol PEG per g Fe of PEG5000 on each.
Importantly the size of the IONPs is close to the size before coating, meaning the addition of the coating does not significantly affect the size of the core and will allow for high concentrations of IONPs in solution.
Stability characterization
Colloidal stability was quantified as a consistent hydrodynamic size distribution over 7 days. Chiu et al. tested PEG coated IONPs with stability in CPA VS55.32 Their initial IONPs were not stable in CPA, but with additional re-coating, they succeeded in stability in VS55. Their major issue was likely “unreacted amines resulting from remaining in PEG silane” on coated IONPs. To resolve this issue they backfilled additional PEG onto free amines on the surface. Importantly they are coating lab synthesized IONPs, not commercially available, previously coated IONPs.The increasing size over that time was indicative of aggregation and instability. The concentration of PEG was tested on EMG1200 using PEG 5000, at 0.1, 0.2, 0.4, and 0.8 mmol PEG per g Fe, Fig. S9 (ESI†). 0.8 mmol PEG 5000 per g Fe resulted in the best stability and was used for the test of MW. 0.1 mmol PEG per g Fe allowed for aggregation slowly over five weeks. 0.8 mmol PEG per g Fe coated on EMG1200 had the smallest size most consistently over five weeks. Therefore, IONPs of various MW were coated with 0.8 mmol of PEG in the reaction. PEG5000 showed the best stability in water when compared to PEG 2000 and PEG500, consistently under 50 nm from 24 to 840 hours (35 days), Fig. 5D. In water EMG1200 coated in both MW of 2000 and 5000 at 0.8 mmol PEG per g Fe IONPs were stable, but not PEG500 coated EMG1200. PEG500 is likely too short to provide stability for EMG1200 in water. All EMG308 coated samples were stable in water for 14–28 days regardless of PEG MW, Fig. 5D. This was expected as uncoated EMG308 is stable in water.
The same set of IONPs were tested in VS55. Tests were halted when aggregation was above 1000 nm or after 24 hours, whichever was longer. The size of a capillary of normal human glomeruli at physiological hydrostatic pressures are 10![[thin space (1/6-em)]](https://www.rsc.org/images/entities/char_2009.gif) 000–21
000–21![[thin space (1/6-em)]](https://www.rsc.org/images/entities/char_2009.gif) 000 nm (10–21 μm) and in rats are 7000–9500 nm (7–9.5 μm).33 We chose 1000 nm as the maximum aggregated size threshold based on sedimentation of IONPs at 6000 nm, seen visually (data not shown).
000 nm (10–21 μm) and in rats are 7000–9500 nm (7–9.5 μm).33 We chose 1000 nm as the maximum aggregated size threshold based on sedimentation of IONPs at 6000 nm, seen visually (data not shown).
Uncoated EMG1200 is hydrophobic and therefore not dispersible in VS55. Increasing the concentration of coating of PEG5000 on either IONP, from 0.1 to 0.8 mmol PEG per g Fe consistently increased the stability of the IONPs in VS55, Fig. S9B and D (ESI†).
The MW of the PEG coating increased the colloidal stability of both IONPs, where longer PEG increased the stability and the effect was greater on the initially hydrophobic EMG1200 over EMG308 (see Fig. 5E and F). PEG500 coated EMG1200 was the fastest to crash, reaching 1000 nm in two hours and full aggregation in 24 hours. PEG2000 was similar, reaching 1000 nm in 4 hours and fully crashed out by 24 hours. PEG5000 coated EMG1200 did not reach 1000 nm for 144 hours or ∼6 days and did not fully precipitate until the 7th day. Aggregation of PEG5000 coated EMG1200 developed much slower than the other PEG coated EMG1200 and remained suspended in VS55 for 6 days.
EMG308 is dispersible in H2O but precipitates out of VS55 within 10 minutes (not shown). PEG coating significantly increased the EMG308 colloidal stability in VS55 regardless of MW. Increasing the MW of PEG slowed aggregation of IONPs, where mPEG500 took 2 hours, mPEG2000 over 4 hours and mPEG5000 took over 8 hours to precipitate out.
Chiu et al. had success with coating lab made IONP, which was likely due to the lack of previous coating on the core. EMG308 is first coated with fatty acid, before coating with hydrophilic surfactant. Stabilizing EMG308 in CPA with PLink requires replacing two different ligands. The major difference in stability times in VS55 of 8 hours with 308-PEG5000, initially hydrophilic, and 6 days 1200-PEG5000, initially hydrophobic, may be attributed to the left over hydrophobic layer of EMG1200 preventing cores from getting as close. Alternatively, the reaction conditions of EMG1200 using CH2Cl2 and EMG308 using H2O may account for the difference. There is some optimization to be done on the reaction conditions of the ligand exchange to increase the amount of PEG coated onto the IONPs. Importantly, in both cases the IONPs are stable in VS55 for long enough to load, cryopreserve, nanowarm and unload IONPs from biological samples modelled using HDF cells (Fig. 9). Colloidal stability was compared with and without cryopreservation and nanowarming of 1200-PEG5000 and 308-PEG5000 Fig. S9E and F (ESI†) respectively. Thermocycling of IONPs in CPA did not affect the aggregation timing, and cooling may slightly delay aggregation. The 308-PEG5000 coated aggregate was slow after cryopreservation and nanowarming as compared to the control, Fig. S9F (ESI†). Chiu et al. also saw similar results, where cryopreservation and nanowarming did not affect stability. IONPs in CPA can be stored indefinitely using cryopreservation and nanowarming on demand to use when needed without the need for sonication or redistribution.
HRMAS NMR coating analysis
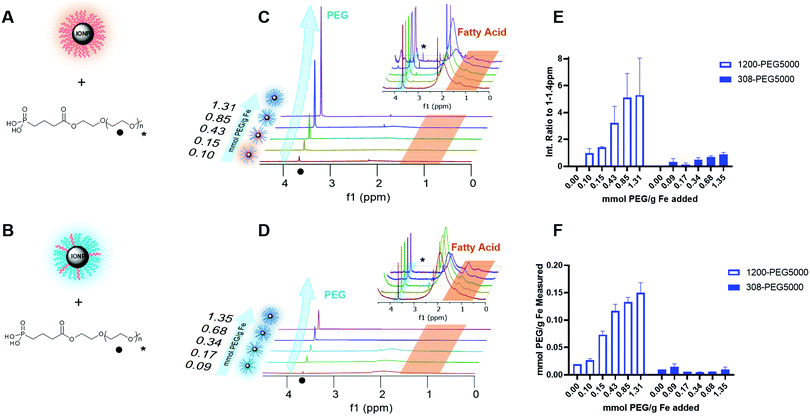
Surface coating of the IONPs is important to quantify to understand both if coating is taking place and to what extent. High colloidal stability in solution will likely be correlated with high coating HRMAS NMR characterization was used to determine PEG addition to the core to give more detailed understanding of ligand exchange.34 Sample preparation for HRMAS is dependent on the signal, where a high concentration of IONPs will broaden the line shape of the spectra, but too low a concentration makes visualizing ligands impossible. A low concentration with 1000 scans was chosen to increase better resolved peaks. Each sample was individually shimmed using the shimming program to increase the solvent peak height and decrease the peak width at 10% and 50% 0.1 peak height. In D2O the solvent peak width at half max ranged from 1–15 ppm depending on the sample composition and the purity of the solvent used.Each spectra had phase and baseline correction adjusted individually as slight concentration changes of IONP changed the spectra patterns. After processing the data, the spectra were integrated across three regions of interest: 0.5–1.32 ppm, 1.32–2.18, and 3.47–3.8, and all MW and concentrations of PEG shown in Fig. S11 (ESI†). The region of 0.5–1.4 ppm is the fatty acid coating, it is on both 1200-PEG5000, Fig. 6E and 308-PEG5000, Fig. 6F. This region was clipped to 1.32 ppm as there was significant interference from a broad alcohol/acid peak from 1.32–2.18 ppm. Using a clipped region allowed for consistent integration across all spectra regardless of PEG or resolution.
There is a lack of consistent resolution in peaks so the integration was normalized by the spectra, where the integration of fatty acid peaks 0.5–1.4 ppm was set to 1. The resulting integration of PEG therefore shows the relative amount of PEG to the amount of fatty acid. A second comparison of fatty acid to PEG of all MW and concentrations of IONPs using normalization of the integration from 0–4 ppm shows similar results, Fig. S12 (ESI†). This ppm range includes the relevant groups and allows for normalization to individual spectra resolution, as well as the decrease of fatty acid in comparison to an increase in PEG.
The chemical composition of EMG1200 is described as a hydrophobic fatty acid, determined likely to be oleic acid from the HRMAS NMR fatty acid peaks of 0.5–1.4 ppm comparison. EMG308 is described as EMG1200 coated with a hydrophilic surfactant which was determined to still have oleic acid on it, fatty acid peaks 0.5–1.4 ppm, but also have a catechol like component, 7.5–7.9 ppm (data not shown). The catechol is very likely the attachment to the core based on dopamine IONP attachments.
The amount of PEG was increased with higher PEG concentration in either 1200-PEG5000, Fig. 6C or 308-PEG5000 Fig. 6D. 1200-PEG5000 IONPs had significantly more PEG then 308-PEG coated IONPs. This information matched with the TGA data as well as the stability study results.
TGA coating analysis
TGA was used to determine and verify HRMAS data for PEG surface coverage on the IONP, 1200-PEG5000, Fig. 6A, and 308-PEG5000, Fig. 6B. The amount of coating was determined by TGA Fig. S13 (ESI†). We tested IONPs coated with PEG5000 since this group of IONPs showed the best results. The amount of PEG increased with the addition of PEG concentration on both EMG1200 and EMG308. It plateaued in between 0.5–1 mmol PEG per g Fe which follows with the results of size, stability and heating. Furthermore, there was clearly more PEG attached on the EMG1200 samples then on EMG308. The reaction conditions of the ligand exchange using CH2Cl2, a less polar organic solvent, with methanol, a polar solvent, may aid the exchange of the fatty acid for PEG. The reaction conditions of EMG308 use DI water, a very polar solvent, with methanol. In our HRMAS work we learned EMG308 has fatty acid surrounding it as well, Fig. 6D. Suggesting that using two highly polar solvents for the ligand exchange may not be optimal for exchanging both the hydrophilic surfactant and left over hydrophobic fatty acid. The low interaction of the fatty acid with solvent may have sterically hindered the overall addition of PLink-PEG to the core. TGA verified PEG is attached to the core and there is an opportunity to better coat our hydrophilic core to increase the concentration of stable IONPs in VS55.Heating characterization
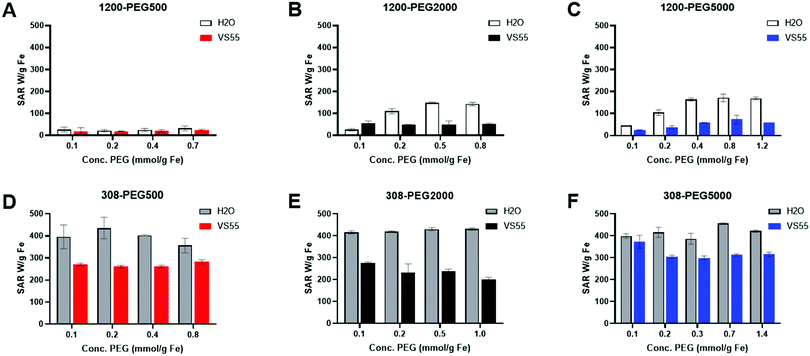
Heating capability is important for nanowarming, where high heating cores result in a lower need for IONPs. The PLink should not affect the capability of the core to heat to be a feasible coating method. Hydrophobic EMG1200 uncoated is not stable in water and does not heat. Adding PLink-PEG5000 to EMG1200 decreases aggregation in water, Fig. 5A, which also increases SAR, Fig. 7. Interestingly, the stability in water did not correspond to maximum heating in water. Although the size is minimized at 0.20 mol PEG per g Fe, Fig. 5A, heating is not maximized until concentrations above 0.43 mol PEG per g Fe on EMG1200, Fig. 7. EMG1200 has a SAR in chloroform, following eqn (1) replacing chloroform for water values, of 200 W per g Fe (data not shown), a solvent it is stable in. 1200-PEG5000 coated with 0.06 or 0.15 mmol PEG per g Fe are not stable in water and have low SAR, 25 W per g Fe and 79 W per g Fe. 0.2 mmol PEG per g Fe afforded stability in water (Fig. S8, ESI†), but did not maximize SAR, 135 W per g Fe. 1200-PEG5000 coated with 0.4, 0.8, and 1.2 mmol PEG per g Fe were also stable in water for 35 days, and SAR was maximized, ranging within 177–184 W per g Fe, approximated to 180 W per g Fe due to Fe quantification of ±10% error. Therefore stability alone cannot be used to determine optimal amounts.PLink PEG coated IONPs were tested in water and VS55 to determine (1) If PLink PEG coating on hydrophobic EMG1200 increasing stability in water also resulted in maximizing SAR in water, (2) If PLink preserved SAR of already stabilized hydrophilic EMG308 in water, and (3) SAR preservation of both IONPs in VS55. SAR was optimized in water for both EMG1200, initially hydrophobic, and EMG308, initially hydrophilic using our 1 kW coil as previously described.12,20,27,28 Heating rates were tested at 6 mg Fe per mL in 1 mL total volume in water. This concentration of iron was chosen to be above the noise of poorly heating IONPs. 1 mg Fe per mL of IONPs was not statically above the background heating of water reference for 1200-PEG IONPs with low concentrations of PEG (data not shown). In our previous work we showed SAR measured from 1–15 mg Fe per mL are statistically the same, further Fe quantification to ±10% is expected.12 Therefore we tested samples with 4–8 mg Fe per mL the expected range of IONP concentration in an organ.12 The SAR of EMG1200 uncoated was determined using chloroform as the solvent which it is stable in, 200 W per g Fe (data not shown). The SAR of EMG308 uncoated, using water as a solvent, is stable in 400 W per g Fe, from our previous work.12 PLink-PEG of MW 500, 2000 and 5000 Da were coated onto EMG1200 and EMG308 in the concentration ranging 0.06–1.35 mmol PEG per g Fe IONP. As shown in Fig. 5A, increasing the PEG MW and concentration increased the stability of EMG1200 in water and preserved EMG308 stability. The effect on SAR was similar; increasing the PEG MW and concentration on EMG1200 Fig. 7 and 8 increased SAR and preserved SAR on EMG308, Fig. 8.
The MW and concentration affected EMG1200 SAR in water. PEG 500, Fig. 8A, resulted in the lowest heating effects where the SAR was 20–35 W per g Fe regardless of the concentration of PEG. PEG2000, Fig. 8B, was able to maximize SAR in water with concentrations of 0.5 mmol per g Fe and above. PEG5000, Fig. 8C, was also able to maximize SAR with concentrations of 0.4 mmol PEG per g Fe and above. In cases of EMG1200 coated with PEG2000 and PEG5000, 0.5 and 0.4 mmol PEG per g Fe, respectively, is sufficient to achieve maximum SAR by ordinary one-way Anova, Fig. S14A (ESI†).
PLink PEG coating on EMG308 did not decrease the SAR with increase concentration or varying the MW. Using PLink as a ligand anchor does not damage the IONP core structure or core heating capabilities. EMG308 has a SAR of 400 W per g Fe in water before coating, by adding increasing concentrations of PEG500, 2000 and 5000, Fig. 8D–F, and no statistical difference was observed after coating, Fig. S14 (ESI†).
SAR in VS55 was lower in water for PLink-PEG 1200 and 308, as previously observed with silica coating as well.12 The MW and concentration of PLink PEG coating effect on SAR of EMG1200 and EMG308 followed a similar trend in VS55 to water. EMG308 had a minimal effect on SAR from increasing the MW or concentration, Fig. 8D–F. PEG500, Fig. 8A on EMG1200 in any concentration was low, 17–25 W per g Fe. PEG2000, Fig. 8B, increased the SAR to 51 W per g Fe at maximum coating. PEG5000, Fig. 8C, at 0.8 mmol PEG per g showed the best effect on EMG1200, SAR in VS55 of 73 W per g Fe.
The PLink coating method did not show any negative effects on heating capability, proving it is a good candidate for a small molecule coating method for nanowarming. The MW of PEG had a minimal effect on the SAR of EMG308 in VS55. PEG 5000 coated IONPs had a better SAR in VS55, Fig. 8C and F. PEG5000 coated IONPs showed superior stability and heating capabilities for nanowarming applications and were chosen for cell studies.
Cell toxicity and nanowarming studies
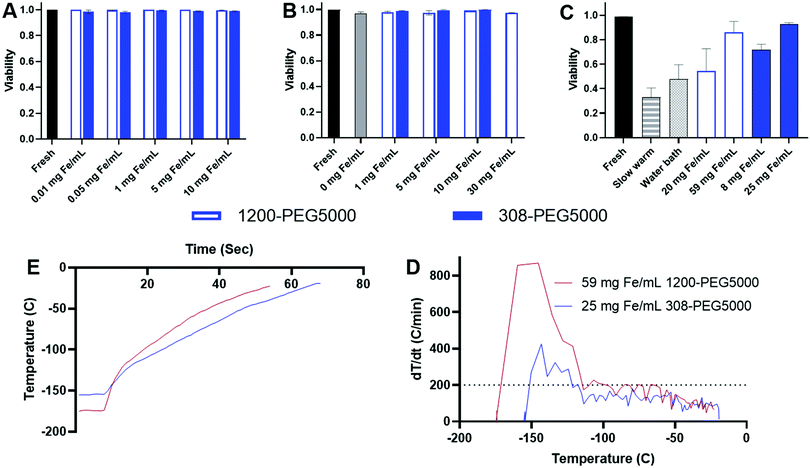
IONPs and the nanowarming effect were tested on HDF cell viability as we have shown in our previous studies.11,12,29 Initially, the toxicity of IONPs 1200-PEG5000 and 308-PEG5000 in cell media was compared to fresh cells, Fig. 9.20 The toxicity of HDF cells was determined by exposure to IONPs in media. HDF cell viability was not affected by either 308-PEG5000 or 1200-PEG5000 at any concentration of Fe. The viability of HDF cells, however, decreases with increasing concentration of EMG308 from our previous studies.12The toxicity of step loading and unloading IONPs within VS55 and additional stress of IONPs was tested using our previously described procedure, Fig. 9B.12 1–10 mg Fe per mL of 308-PEG5000 was used to compare with our previous studies. To account for the lower SAR of 1200-PEG5000, Fig. 8C, a higher range of concentrations 1–30 mg Fe per mL was tested. All tests resulted in viability above 97%. There was no statistical difference in viability between fresh cells and those treated with VS55 and IONP loading and unloading procedure, determined by one way Anova.
Cryopreservation and rewarming of HDF cells were tested using both 308-PEG5000 and 1200-PEG5000 and compared to slow warming and a water bath, Fig. 9C.11,12 HDF cells vitrified and rewarmed slowly with VS55 had 33% viability. After convective warming in the 37 °C water bath the viability was increased to 48%. Cells which were loaded with CPAs and either 1200-PEG5000 or 308-PEG5000 and nanowarmed had higher viability than either slow-warmed or water bath warmed cells. 1200-PEG5000 required a significantly higher concentration of IONPs to achieve the same heating rates as 308-PEG5000 IONPs due to the lowered SAR and decreased SAR in VS55. Initially 20 mg Fe per mL of 1200-PEG5000 was used for rewarming the HDF cells, which resulted in 54% viability, slightly above that when using a water bath. Tripling this concentrating to 60 mg mL−1 increased the heating rates to over 200 °C min−1, Fig. 9D, and the viability increased to 87%, Fig. 9C. 308-PEG5000 showed similar results, at 8 mg Fe per mL the viability is 73%, but after increasing the concentration of IONPs to 25 mg Fe per mL viability is increased to 93%, as shown by the statistical analysis in Fig. S15 (ESI†). Fig. 9D shows the warming profile of both 1200-PEG5000 and 308-PEG5000; both reach −20 °C in under 50 s. The derivative, Fig. 9E, shows a heating rate above or close to 200 °C min−1, well above any other heating method. Herein, we show that heating rate, and therefore viability can be tuned using increasing concentrations of IONPs of various SAR. Using higher concentrations of IONPs with lower SARW per g Fe similar viability is achieved as when using lower concentrations of high SAR W per g Fe IONPs.
Conclusions
The use of a phosphonate small molecule linker (Plink) to attach PEG directly to IONP cores showed that the linker did not affect the heating capabilities of the core. The model ligand of PEG was attached to the core through PLink and of the three MW tested, PEG5000 allowed for the best effect on stability. A minimum concentration of 0.4 mmol PEG per g Fe is sufficient to maximize the stability and heating. The coating amount plateaus with 0.8 and 1.2 mmol PEG per g Fe as observed by TGA and HRMAS. At the highest concentration PEG may interfere sterically and slightly decrease the amount of PEG coated onto the IONPs. The best coated IONPs were determined from highest heating, and longest colloidally stability in VS55: 0.8 mmol PEG5000 per g Fe on EMG1200 and EMG308. These two IONPs were used for testing the cell toxicity and cryopreservation and nanowarming viability. Neither IONP resulted in toxicity during overnight incubation or following the loading and unloading procedure of CPA without cryopreservation. The viability of cryopreserved HDF cells was tuned by increasing the concentrations of IONPs, resulting in the survival of 87% with 60 mg mL−1 of 1200-PEG5000 and 93% with 25 mg Fe per mL of 308-PEG5000. Both PLink-PEG5000 coated IONPs are capable of heating rates at or above 200 °C min−1. Furthermore, the heating rate can be tuned to increase the viability in cryopreserved samples, such as HDF cells, by choosing an IONP and adjusting the concentration. Our future studies include exploring maximizing concentrations of IONPs in CPA to maximize the heating rates and viability of the biological samples. Coating efficiency will be optimized by the reaction conditions, such as aprotic solvents, increasing temperature and scaling up.Conflicts of interest
There are no conflicts to declare.Acknowledgements
The authors thank Dr Qi Shao for help with the HDF cell culture, Todd Rappe, Dr Gopinath Tata at the Minnesota NMR Center for help with HRMAS NMR, Dr Raj Suryanarayanan for use of the TGA and Dr Jon Rainier and Dr Rameshu Rallabandi for useful discussions and training. They also thank UMN's Department of Earth Science, and Institute for Rock Magnetism for providing instruments and assistance in characterization. This work was funded by 5 F31 DK124968-02, NSF EEC 1941543, R01 HL135046, and R01 DK117425. Research reported in this publication was supported by the Office of the Vice President of Research, College of Science and Engineering, and the Department of Chemistry at the University of Minnesota.Notes and references
- S. Giwa, J. K. Lewis, L. Alvarez, R. Langer, A. E. Roth, G. M. Church, J. F. Markmann, D. H. Sachs, A. Chandraker, J. A. Wertheim, M. Rothblatt, E. S. Boyden, E. Eidbo, W. P. A. Lee, B. Pomahac, G. Brandacher, D. M. Weinstock, G. Elliott, D. Nelson, J. P. Acker, K. Uygun, B. Schmalz, B. P. Weegman, A. Tocchio, G. M. Fahy, K. B. Storey, B. Rubinsky, J. Bischof, J. A. W. Elliott, T. K. Woodruff, G. J. Morris, U. Demirci, K. G. M. Brockbank, E. J. Woods, R. N. Ben, J. G. Baust, D. Gao, B. Fuller, Y. Rabin, D. C. Kravitz, M. J. Taylor and M. Toner, Nat. Biotechnol., 2017, 35, 530–542 CrossRef CAS PubMed.
- S. A. Hosgood, A. D. Barlow, J. P. Hunter and M. L. Nicholson, British J. Surgery, 2015, 102, 1433–1440 CrossRef CAS PubMed.
- B. A. Whitson and S. M. Black, World J. Transplant., 2014, 4, 40 CrossRef PubMed.
- A. Hart, J. M. Smith, M. A. Skeans, S. K. Gustafson, D. E. Stewart, W. S. Cherikh, J. L. Wainright, A. Kucheryavaya, M. Woodbury, J. J. Snyder, B. L. Kasiske and A. K. Israni, Am. J. Transplant., 2017, 17(Suppl 1), 21–116 CrossRef PubMed.
- M. Taylor, Y. Song and K. Brockbank, Vitrification in Tissue preservation, 2004, pp. 603–641 DOI:10.1201/9780203647073.ch22.
- W. F. Rall and G. M. Fahy, Nature, 1985, 313, 573–575 CrossRef CAS PubMed.
- G. M. Fahy, B. Wowk, J. Wu and S. Paynter, Cryobiology, 2004, 48, 365 CrossRef CAS.
- G. M. Fahy, D. R. MacFarlane, C. A. Angell and H. T. Meryman, Cryobiology, 1984, 21, 407–426 CrossRef CAS PubMed.
- K. Brockbank, J. Walsh, Y. Song and M. Taylor, Vitrification, 2008, pp. 3046–3057 DOI:10.1201/b18990-295.
- S. Baicu, M. J. Taylor, Z. Chen and Y. Rabin, Cell Preserv. Technol., 2006, 4, 236–244 CrossRef CAS PubMed.
- N. Manuchehrabadi, Z. Gao, J. Zhang, H. L. Ring, Q. Shao, F. Liu, M. McDermott, A. Fok, Y. Rabin, K. G. M. Brockbank, M. Garwood, C. L. Haynes and J. C. Bischof, Sci. Transl. Med., 2017, 9, eaah4586 CrossRef PubMed.
- Z. Gao, H. L. Ring, A. Sharma, B. Namsrai, N. Tran, E. B. Finger, M. Garwood, C. L. Haynes and J. C. Bischof, Adv. Sci., 2020, 7, 1901624 CrossRef CAS PubMed.
- S. A. Rovers, L. A. M. van der Poel, C. H. J. T. Dietz, J. J. Noijen, R. Hoogenboom, M. F. Kemmere, K. Kopinga and J. T. F. Keurentjes, J. Phys. Chem. C, 2009, 113, 14638–14643 CrossRef CAS.
- C. D. Walkey, J. B. Olsen, H. Guo, A. Emili and W. C. W. Chan, J. Am. Chem. Soc., 2012, 134, 2139–2147 CrossRef CAS PubMed.
- N. Zahn and G. Kickelbick, Colloids Surf., A, 2014, 461, 142–150 CrossRef CAS.
- S. Mohapatra and P. Pramanik, Colloids Surf., A, 2009, 339, 35–42 CrossRef CAS.
- H. Ring, S. Tong, Z. Gao, N. Manuchehrabadi, K. Jiang, S. Pailloux, M. Dresel, V. Pierre, C. Haynes, M. Garwood, G. Bao and J. Bischof, Designing Iron Oxide Nanoparticles for Image Guided Thermal Medicine Applications, 2019.
- S. Tong, C. A. Quinto, L. Zhang, P. Mohindra and G. Bao, ACS Nano, 2017, 11, 6808–6816 CrossRef CAS PubMed.
- Y. Wang, Z. Gao, Z. Han, Y. Liu, H. Yang, T. Akkin, C. J. Hogan and J. C. Bischof, Sci. Rep., 2021, 11, 898 CrossRef CAS PubMed.
- K. R. Hurley, H. L. Ring, M. Etheridge, J. Zhang, Z. Gao, Q. Shao, N. D. Klein, V. M. Szlag, C. Chung, T. M. Reineke, M. Garwood, J. C. Bischof and C. L. Haynes, Mol. Pharmaceutics, 2016, 13, 2172–2183 CrossRef CAS PubMed.
- A. Sharma, J. S. Rao, Z. Han, L. Gangwar, B. Namsrai, Z. Gao, H. L. Ring, E. Magnuson, M. Etheridge, B. Wowk, G. M. Fahy, M. Garwood, E. B. Finger and J. C. Bischof, Adv. Sci., 2021, 8, 2101691 CrossRef CAS PubMed.
- E. Smolensky, H.-Y. Park, T. Berquo and V. Pierre, Contrast Media Mol. Imaging, 2010, 6, 189–199 Search PubMed.
- S. Tong, S. Hou, B. Ren, Z. Zheng and G. Bao, Nano Lett., 2011, 11, 3720–3726 CrossRef CAS PubMed.
- A. Sharma, C. Cornejo, J. Mihalic, A. Geyh, D. E. Bordelon, P. Korangath, F. Westphal, C. Gruettner and R. Ivkov, Sci. Rep., 2018, 8, 4916 CrossRef PubMed.
- F. G. Arnaud, B. Khirabadi and G. M. Fahy, Cryobiology, 2003, 46, 289–294 CrossRef CAS PubMed.
- R. Rallabandi, PhD thesis, The University of Utah, 2018.
- M. L. Etheridge and J. C. Bischof, Ann. Biomed. Eng., 2013, 41, 78–88 CrossRef CAS PubMed.
- M. L. Etheridge, K. R. Hurley, J. Zhang, S. Jeon, H. L. Ring, C. Hogan, C. L. Haynes, M. Garwood and J. C. Bischof, Technology, 2014, 2, 214–228 CrossRef PubMed.
- M. L. Etheridge, Y. Xu, L. Rott, J. Choi, B. Glasmacher and J. C. Bischof, Technology, 2014, 02, 229–242 CrossRef.
- J. D. Goff, P. P. Huffstetler, W. C. Miles, N. Pothayee, C. M. Reinholz, S. Ball, R. M. Davis and J. S. Riffle, Chem. Mater., 2009, 21, 4784–4795 CrossRef CAS.
- K. Davis, B. Qi, M. Witmer, C. L. Kitchens, B. A. Powell and O. T. Mefford, Langmuir, 2014, 30(36), 10918–10925 CrossRef CAS PubMed.
- A. Chiu-Lam, E. Staples, J. Pepine Carl and C. Rinaldi, Sci. Adv., 2021, 7, eabe3005 CrossRef PubMed.
- C. R. Neal, K. P. Arkill, J. S. Bell, K. B. Betteridge, D. O. Bates, C. P. Winlove, A. H. J. Salmon and S. J. Harper, Am. J. Physiol.: Renal, Fluid Electrolyte Physiol., 2018, 315, F1370–F1384 Search PubMed.
- L. Polito, M. Colombo, D. Monti, S. Melato, E. Caneva and D. Prosperi, J. Am. Chem. Soc., 2008, 130, 12712–12724 CrossRef CAS PubMed.
Footnote |
| † Electronic supplementary information (ESI) available. See https://doi.org/10.1039/d1tb02483c |
| This journal is © The Royal Society of Chemistry 2022 |

