DOI:
10.1039/D1TB02457D
(Paper)
J. Mater. Chem. B, 2022,
10, 1250-1264
Orange-red to NIR emissive carbon dots for antimicrobial, bioimaging and bacteria diagnosis†
Received
9th November 2021
, Accepted 25th January 2022
First published on 7th February 2022
Abstract
Antimicrobial photodynamic therapy (aPDT) has become a popular technology for the treatment of bacterial infections. The development of antimicrobial agents combining diagnosis and treatment remains a major challenge. Herein, curcumin carbon quantum dots (Cur-NRCQDs) with antibacterial and imaging effects were synthesized using a hydrothermal method. The fluorescence absorption range of the Cur-NRCQDs in aqueous solution was 555 to 850 nm, showing orange-red to near infrared (NIR) fluorescence, and its maximum emission wavelength was 635 nm. At the same time, Cur-NRCQDs improved the efficiency of Cur as the photosensitizer (PS), showed good storage and light stability, and enhanced the efficiency of reactive oxygen (ROS) generation and antibacterial activity. Under the irradiation of a xenon lamp, Cur-NRCQDs inactivated 100% Staphylococcus aureus (S. aureus) and Escherichia coli (E. coli) at concentrations of 10 and 15 μM, respectively. The possible reason for this was that under PDT, the ROS produced by the Cur-NRCQDs destroyed the integrity of the cell membrane, resulting in leakage of the contents. In addition, the Cur-NRCQDs showed good cell compatibility, as they can also enter bacteria and cells for imaging, so they can be employed for the detection of bacteria and cell tissues. Therefore, Cur-NRCQDs are an ideal candidate material for aPDT treatment and fluorescent bioimaging.
1. Introduction
The problem of bacterial infection has always threatened the healthy development of human beings. The abuse of antibiotics1 has led to drug resistant bacteria, and the special structure of bacterial biofilm2,3 increases the difficulty of clinical anti-infective treatments. Methods for detecting bacteria include bacterial culture, biochemical identification, immunoassay and polymerase chain reaction (PCR), but they usually require complex operation and are time-consuming, which may result in more serious infection due to a lack of timely treatment. A promising strategy is to develop antibacterial agents with rapid and sensitive diagnosis and treatment of infection. Photodynamic antimicrobial therapy (aPDT) is a promising new treatment for bacterial infection, which uses a light source with a specific wavelength to stimulate photosensitizer molecules to produce highly cytotoxic reactive oxygen species (ROS) to oxidize and destroy biological macromolecules such as phospholipids, enzymes, proteins and DNA,4 resulting in the effective inactivation of pathogenic microorganisms. Two main antibacterial mechanisms have been reported for aPDT: (i) damage to the cell wall or cell membrane,5 which in turn leads to leakage of the cell contents or causes a loss of membrane transport function and inactivation of enzymes;6 (ii) direct DNA damage, including single- and double-stranded DNA.7 For example, imidazolyl porphyrins can inactivate bacteria in biofilms at low concentrations and low light doses.8 The combination of chitosan and tetracycline with a photodynamic antibacterial effect destroyed the integrity of cell membranes and damaged DNA.9
Carbon quantum dots (CQDs) are new sphere-like carbon nanomaterials prepared under certain conditions using carbon isomers or organic compounds as precursors,10 with sizes below 10 nm.11 Compared with traditional photoluminescent (PL) materials, CQDs are widely used in bioimaging, biomarking, nano-optics, optoelectronic devices, chemical sensors and other fields16,17 because of their excellent optical properties, good water solubility, high stability, good dispersion, good biocompatibility and low toxicity.12–15 Depending on the carbon source, its preparation methods can generally be divided into top-down and bottom-up synthesis methods, including arc discharge, electrochemical synthesis, chemical oxidation, combustion, hydrothermal synthesis and a microwave synthesis method,18 among which the hydrothermal method is one of the most commonly used methods due to its simplicity and rapidity, low preparation costs and green environment. The luminescent properties of CQDs can be regulated by changing the synthesis method or raw materials, such as adjusting the fluorescence intensity of CQDs19 and the emission wavelength of CQDs.20 Due to the advantages of long wavelength emission and good tissue penetration depth, red CQDs can make light penetrate into deeper tissues. Moreover, they have low cytotoxicity, slight biological tissue light damage,21–23 high sensitivity and direct visualization,24 which helps to improve the efficiency of disease detection.25,26 Meng Y et al.27 prepared red-emitting multifunctional CQDs with good water dispersion and excellent fluorescence stability, exhibiting low cytotoxicity and fluorescence imaging. CQDs with NIR fluorescence have also shown an ability for imaging various biological samples in vitro and in vivo.28
Curcumin (Cur) is a natural polyphenol derived from the rhizome of the ginger plant turmeric. It is commonly used as a meat colorant and acid–base indicator, and has pharmacological effects such as antibacterial, anti-inflammatory, antioxidant, antiviral, hypolipidemic, anti-atherosclerotic and antitumor activity.29–34 Cur is a natural photosensitizer with the characteristics of safety, effectiveness and environmental protection. ROS species produced by Cur-mediated PDT have a strong inactivation effect on pathogenic microorganisms, including Gram-positive bacteria and Gram-negative bacteria, as they inactivate bacteria by targeting bacterial cell membranes, cell walls, proteins, DNA and other cellular structures.35–39 For example, singlet oxygen (1O2) produced by Cur-mediated PDT can inhibit biofilm formation of Pseudomonas aeruginosa.401O2 produced by Cur under near-infrared (NIR) irradiation was also found to be effective in eradicating methicillin-resistant Staphylococcus aureus (MRSA) from deep joint infections.41 In recent years, the incorporation of Cur into carriers or other drugs to enhance antimicrobial properties has been sought, such as graphene-Cur,42 PDA-Cur,43 biomolecular chitosan, curcumin and ZnO-based antimicrobial nanomaterials44 and curcumin solid dispersion hydrogels.45 However, very few articles have been published about the incorporation of Cur into CQDs as carriers,46–49 and research on the antibacterial effect of Cur-CQD composites has not been reported. Cur-CQDs may have potential as PDT antibacterial agents in consideration of the unique properties of Cur and CQDs. As a result, fluorescent CQDs with green fluorescence have recently been synthesized by our group and employed as carriers for the delivery of Cur to obtain composites using a two-step method, which could simultaneously generate ROS and a moderate temperature rise, triggering synergistic antibacterial effects against both Gram-positive and Gram-negative bacteria.50 In this study, we prepared Cur-NRCQDs with orange-red to NIR fluorescence from citric acid (CA), neutral red (NR) and Cur, using a one-step hydrothermal synthesis method to simplify the preparation procedures. Compared with Cur-CDs with green fluorescence emission, the red fluorescence of Cur-NRCQDs made them more suitable for the detection of bacteria and cells, as the blue, green or yellow CQDs are harmful to biological systems or living cells due to their short wavelength excitation.51 Moreover, the in situ, real-time and dynamic analysis of biomarkers in living cells is vulnerable to the interference of cell endogenous fluorescence, and when using short-wavelength CQDs it is difficult to ensure the high accuracy and sensitivity of detection and is not conducive to biological applications. Therefore, the characteristics of red-emitting Cur-NRCQDs with a long wavelength can play a prominent role in biological imaging. The Cur-NRCQDs also showed lower cytotoxicity than Cur-CDs, indicating that Cur-NRCQDs had less light damage.
The synthesized Cur-NRCQDs were characterized using transmission electron microscopy (TEM), ultraviolet-visible (UV-vis) spectrophotometry and infrared (IR) spectroscopy, and their optical properties were explored using fluorescence spectroscopy. The storage and light stability of Cur-NRCQDs in aqueous solution were investigated. Cur-NRCQDs can produce a high amount of ROS, indicating their antibacterial properties in PDT therapy. The antibacterial activity was evaluated by plate counting, scanning electron microscopy (SEM), viable bacteria staining and a ROS generation test in bacteria. In addition, the cytocompatibility of Cur-NRCQDs was evaluated and successfully applied to bacterial and cell imaging. Therefore, this study will help to develop new materials for the diagnosis and treatment of infection.
2. Materials and methods
2.1. Main materials
Cur was purchased from Aladdin reagent Co., Ltd (Shanghai, China). CA and NR were bought from Macklin Biochemical Co., Ltd (Shanghai, China). Staphylococcus aureus (S. aureus) and Escherichia coli (E. coli) were obtained from Luwei Technology Co., Ltd (Shanghai, China). Cell counting kit-8 (CCK-8) was obtained from Shanghai Saint-Bio Biotechnology Co., Ltd.
2.2. Hydrothermal preparation of NRCQDs
The chemicals used in the synthesis of NRCQDs were all analytically pure. 3 g of CA and 4.2 mg of NR were added to 10 mL of pure water, stirred and sonicated until completely dissolved, then poured into an autoclave lined with polytetrafluoroethylene and heated continuously at 200 °C in a blast oven for 4 hours. After cooling to room temperature, a violet-black liquid was obtained. The upper clear layer was filtered through a 0.22 μm microporous membrane and poured into a 1000 MW dialysis bag in ultrapure water for 24 h. A violet liquid was obtained, which emitted orange-red fluorescence under the irradiation of a 405 nm laser lamp, then freeze-dried to obtain NRCQDs for standby.
2.3. Hydrothermal preparation of Cur-NRCQDs
3 g of CA, 4.2 mg of NR and 10 mg of Cur were added to 10 mL of anhydrous ethanol, stirred and sonicated until completely dissolved, then poured into an autoclave lined with polytetrafluoroethylene and heated continuously at 200 °C for 4 hours in a blast oven. After cooling to room temperature, a brownish-red liquid was obtained. The upper clear liquid was filtered through a 0.22 μm microporous membrane and poured into a 1000 MW dialysis bag in ultrapure water for 24 hours to obtain an orange-red liquid, which emitted orange-red fluorescence under the irradiation of a 405 nm laser lamp. Cur-NRCQDs were obtained by concentrating and freezing.
2.4. Characterisation of Cur-NRCQDs
The size and morphology of NRCQDs and Cur-NRCQDs in aqueous solution were determined by TEM. And the UV-vis absorption spectra of NRCQDs, Cur and Cur-NRCQDs were obtained with a UV-5200 PC spectrophotometer. IR from 4000–500 cm−1 were obtained using a NICOLET-iS10 infrared spectrometer and the fluorescence intensity emitted from the samples was measured using a fluorescence spectrometer (RF6000). Elemental analysis (EA) was performed using a Vario EL cube elemental analyser. NRCQDs and Cur-NRCQDs were well characterized by X-ray diffraction (XRD) and X-ray photoelectron spectroscopy (XPS).
2.5. Stability studies
The stability of NRCQDs, Cur and Cur-NRCQDs in pure water was tested. The samples were kept in the dark at room temperature for one week and then the spectra were scanned using a UV-vis spectrophotometer. The stability of the aqueous solutions of the samples was also examined under the light of a xenon lamp (50 W).
2.6. Determination of 1O2
1,3-Diphenylbenzofuran (DPBF, 5 × 10⁻³ mol L−1) and the sample solution were fully mixed, and then irradiated with a 405 nm laser. The absorption peak at 416 nm was measured using a UV-spectrophotometer for different irradiation times. In addition, the electron spin resonance (ESR) measurement was performed to confirm the type of free radical. 1O2 was detected by 2,2,6,6-tetramethylpiperidine (TEMP); the sample was dispersed into the spin trapping agent TEMP. The sample was measured after xenon light irradiation (400–450 nm) for 20 min using an ESR spectrometer.
2.7. Measurement of antimicrobial activity
S. aureus and E. coli were introduced into the lysate medium respectively and incubated at 37 °C in a shaker. After overnight cultures, S. aureus or E. coli were diluted to OD600 = 0.5, and Cur and Cur-NRCQDs were prepared in 0.9% NaCl solution to the desired concentration, respectively. The concentration of Cur-NRCQDs was quantified by measuring the concentration of Cur in the Cur-NRCQDs. The bacterial suspension was mixed with different concentrations of Cur or Cur-NRCQDs solutions, and then diluted 103 times with nutrient broth after xenon light irradiation. The diluted bacterial solution was spread on an agar plate and the number of bacterial colonies was counted after incubation at 37 °C for 24 h.
2.8. SEM observation of bacterial morphology
To investigate whether the bacteria were damaged, changes in surface morphology were observed using SEM. The sample solution and S. aureus (E. coli) suspension were mixed 1![[thin space (1/6-em)]](https://www.rsc.org/images/entities/char_2009.gif) :1 by volume and subjected to xenon light for 10 min. The S. aureus (E. coli) was washed twice with 0.9% NaCl solution, and fixed with 2.5% glutaraldehyde for 4 h to preserve its original shape. After gradient dehydration with 30–100% ethanol, the bacteria were deposited on a coverslip for SEM examination.
:1 by volume and subjected to xenon light for 10 min. The S. aureus (E. coli) was washed twice with 0.9% NaCl solution, and fixed with 2.5% glutaraldehyde for 4 h to preserve its original shape. After gradient dehydration with 30–100% ethanol, the bacteria were deposited on a coverslip for SEM examination.
2.9. Double staining of live dead bacteria
The bacterial suspension was mixed with different concentrations of Cur-NRCQDs solution, incubated for 30 min at 37 °C in a shaker and then illuminated with xenon light for 10 min. 10 μg mL−1 of 4′,6-diamidino-2-phenylindole (DAPI) and 50 μg mL−1 of propidium iodide (PI) dyed for 15 min, added dropwise onto a slide and placed under an inverted fluorescent microscope to observe the fluorescence image of the bacteria.
2.10. Testing for ROS in bacteria
In order to verify the production of ROS in bacteria, the fluorescent probe 2,7-dichlorodihydrofluorescein diacetate (DCFH-DA) was applied for measurement. The bacterial solution was incubated with the drug solution, illuminated with a xenon lamp for 10 min, and then DCFH-DA solution (1 μM) was added stained in the dark for 30 min. Finally, green fluorescence was detected using an inverted fluorescence microscope.
2.11. Determination of biofilm biomass by CV assay
The inhibitory activities of Cur-NRCQDs toward S. aureus and E. coli bacterial biofilm formation were preliminarily assessed. The fresh bacterial cells (200 μL, 108 CFU mL−1) were placed in a 96-well plate and cultured at 37 °C for 72 hours. The bacterial biofilm was treated with (a) PBS, (b) Cur-NRCQDs, (c) PBS + laser, and (d) Cur-NRCQDs + laser, respectively. After 6 hours, the bacterial biofilms were fixed with 2.5% glutaraldehyde for 20 min. Then Crystal Violet (CV) assay solution (0.1%, 150 μL) was added to stain the biofilm for 30 min. Subsequently, the biofilm was washed with sterile PBS twice and 95% ethanol (200 μL) was added to each well. The optical density at 590 nm was obtained by a microplate reader.
2.12. Cytotoxicity testing
The cytotoxicity of Cur-NRCQDs was assessed using the CCK-8 assay. Human normal hepatocytes (L02) and hamster lung cells (CHL) were cultured into 96-well plates with a density of 5 × 10⁴ cells per well and incubated for 24 h. Different concentrations of Cur-NRCQDs solution (0.1, 0.5, 1, 5, 10 and 15 μM) were prepared, and 200 μL of the solution was added to each well and incubated for 24 hours. The cell was washed twice with PBS, and then 100 μL of 5% CCK-8 was added and the samples were incubated for 3 h. The absorbance at 490 nm was measured by an enzyme marker (BioTek Instruments, Inc, USA).
2.13. Cell imaging studies
The application of Cur-NRCQDs emitting orange-red to NIR fluorescence in biological imaging was investigated. L02 cells and CHL cells were cultured into 6-well culture plates and incubated in 5% CO2 at 37 °C for 24 hours. After rinsing the cells with PBS twice, the cells were incubated with 1 mL of Cur-NRCQDs solution (10 μM) for 24 h. The cells were then washed with PBS to remove the remaining solution and the fluorescence images of the cells were recorded using an inverted fluorescence microscope.
3. Results and discussion
3.1. Composite of Cur-NRCQDs
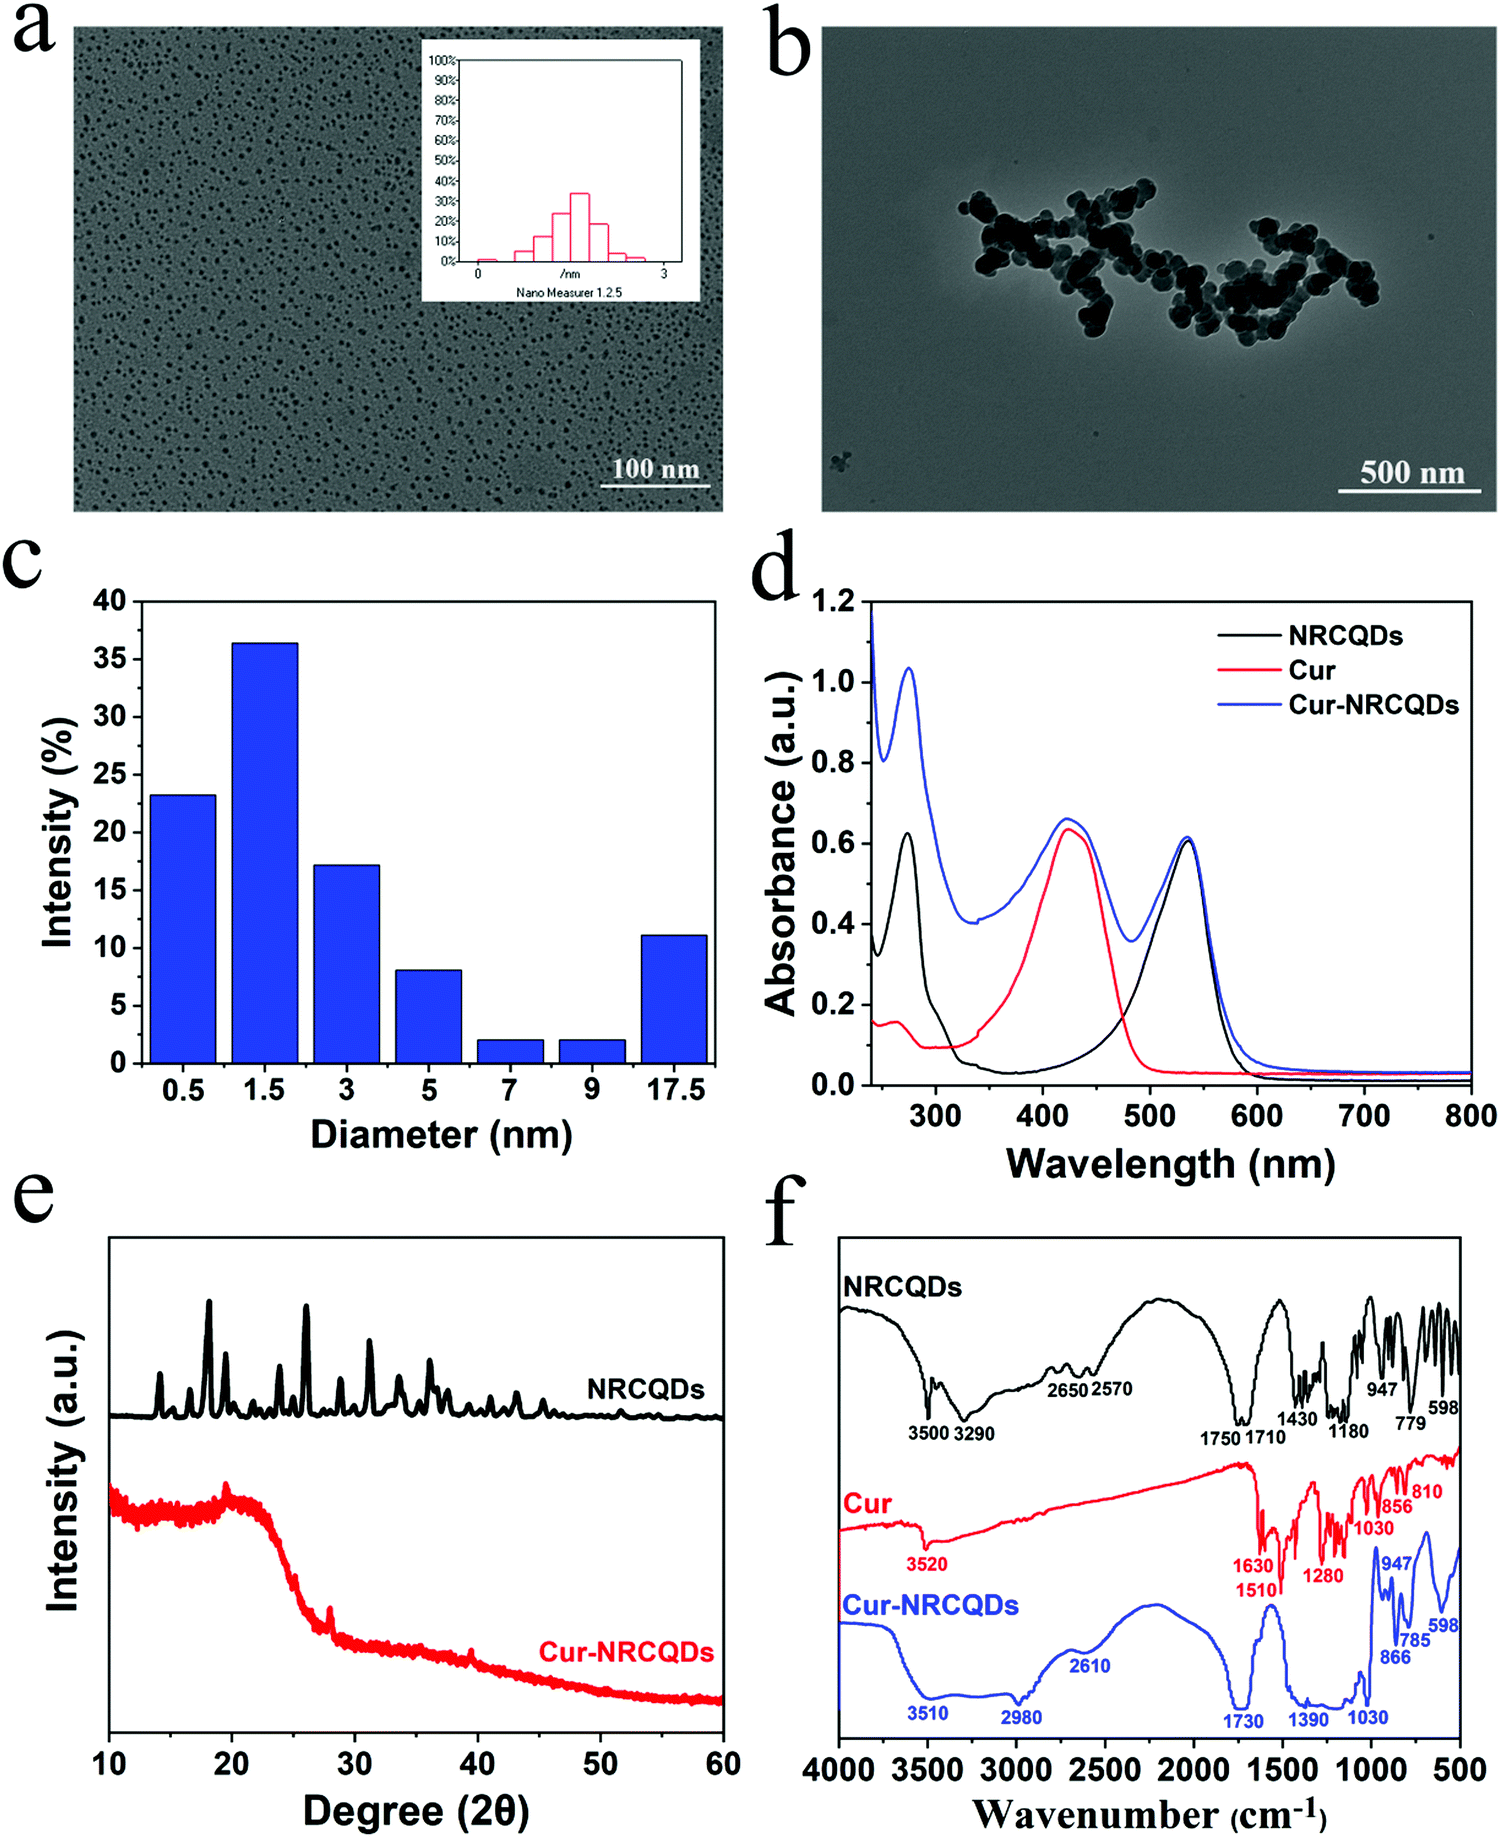
The shape of the NRCQDs was approximately spherical (Fig. 1a), with good dispersion and uniform size, and the particle size was approximately 2 nm. Cur-NRCQDs had aggregation in water (Fig. 1b), which might be caused by the hydrophobicity of Cur. Furthermore, the particle size of Cur-NRCQDs was measured by the nanoparticle size meter. Cur-NRCQDs in ethanol solution showed a narrow size distribution from 0.1 to 24.34 nm with the average around 3.83 nm (Fig. 1c). Although 77% of Cur-NRCQDs were between 0.1 and 4 nm, some of them were more than 10 nm, indicating that aggregation still existed. As expected, the UV-vis spectra of the NRCQDs solution showed significant absorption peaks at 535 nm and 273 nm (Fig. 1d), which could be attributed to the n–π* leap of the C![[double bond, length as m-dash]](https://www.rsc.org/images/entities/char_e001.gif) O-containing unsaturated group and the π–π* leap of the benzene ring. The 535 nm absorption peak of Cur-NRCQDs and NRCQDs solutions were from NR molecules. The UV-vis spectra of Cur-NRCQDs showed the absorption peaks of both NRCQDs and Cur. The XRD pattern of NRCQDs and Cur-NRCQDs were shown in Fig. 1e; the diffraction peaks of NRCQDs indicated that NRCQDs were formed by organic dots, resulting in high crystallinity.52 Compared with NRCQDs, the diffraction peaks of Cur-NRCQDs showed a broad diffraction peak (2θ) at 22.76°, which was consistent with the (001) lattice spacing of graphitic-like carbon-based materials, indicating that Cur-NRCQDs existed in an amorphous state, leading to higher activity.
O-containing unsaturated group and the π–π* leap of the benzene ring. The 535 nm absorption peak of Cur-NRCQDs and NRCQDs solutions were from NR molecules. The UV-vis spectra of Cur-NRCQDs showed the absorption peaks of both NRCQDs and Cur. The XRD pattern of NRCQDs and Cur-NRCQDs were shown in Fig. 1e; the diffraction peaks of NRCQDs indicated that NRCQDs were formed by organic dots, resulting in high crystallinity.52 Compared with NRCQDs, the diffraction peaks of Cur-NRCQDs showed a broad diffraction peak (2θ) at 22.76°, which was consistent with the (001) lattice spacing of graphitic-like carbon-based materials, indicating that Cur-NRCQDs existed in an amorphous state, leading to higher activity.
 |
| | Fig. 1 (a) TEM image and the diameter distribution of NRCQDs. (b) TEM image of Cur-NRCQDs. (c) The diameter distribution of Cur-NRCQDs by the nanoparticle size meter. (d) UV-vis absorption spectra of NRCQDs, Cur and Cur-NRCQDs. (e) XRD characterization of NRCQDs and Cur-NRCQDs. (f) IR spectra of NRCQDs, Cur and Cur-NRCQDs. | |
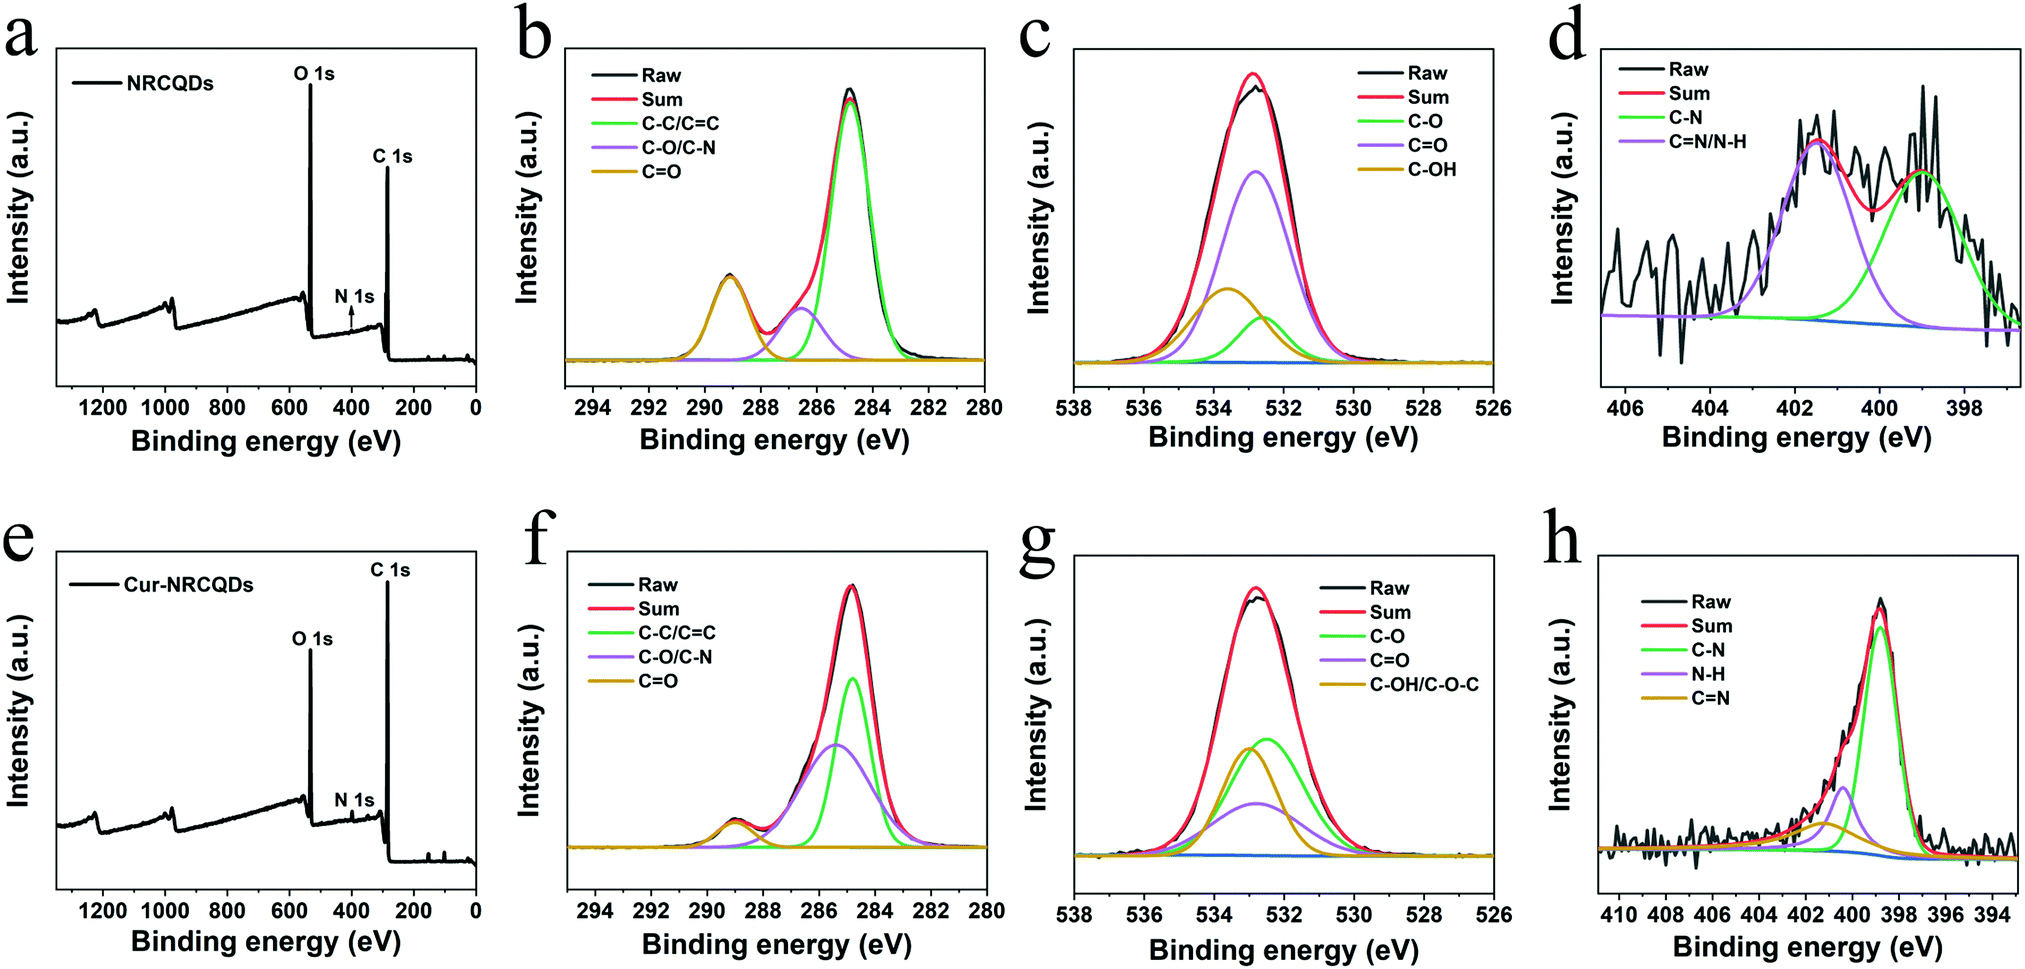
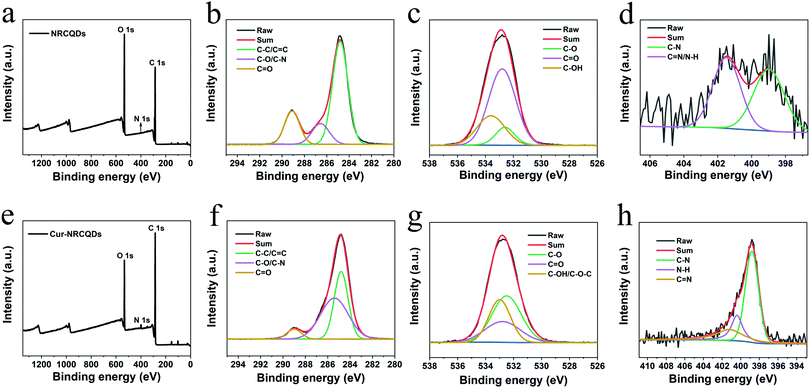
Furthermore, the doping contents of C, H, O and N in NRCQDs and Cur-NRCQDs were quantitatively evaluated by EA. As displayed in Table S1 (ESI†), the EA results of NRCQDs were determined to be C%: 37.395%; H%: 4.348%; O%: 57.041%; and N%: 0.32%, whereas Cur-NRCQDs contained more N and C than NRCQDs. In the IR spectrum (Fig. 1f), the peaks around 3500, 1750 and 1180 cm−1 of NRCQDs were consistent with O–H, CO and C–O–C stretching vibrations.53 The peak at 3290 cm−1 represented the stretching vibration of N–H and a peak at 1430 cm−1 indicated the presence of C–N bonds.54 The characteristic peak of Cur at 3520 cm−1 was due to the stretching vibration of phenol–OH, and the peaks at 1630 cm−1, 1510 cm−1 and 1280 cm−1 corresponded to the absorption peaks of CC, ketone group and C–O, respectively.55,56 Compared to NRCQDs and Cur, the Cur-NRCQDs formed a broad peak at around 3510 cm−1, which might be caused by the formation of intermolecular hydrogen bonds by the multimerization of O–H. There was also wide absorption in the range of 1480–1070 cm−1, probably due to the coupling of CO stretching vibrations with other groups. The above results showed that Cur had been successfully doped in NRCQDs. XPS analysis was used to confirm the elemental composition and chemical valence state of Cur-NRCQDs. The XPS spectrum (Fig. 2a) showed three peaks of NRCQDs at 248.8, 532.8 and 400.8 eV, which were attributed to the signals of C 1s, O 1s and N 1s, respectively. The high-resolution C 1s spectrum (Fig. 2b) showed three obvious peaks located at 284.8, 286.4 and 289.1 eV, which correspond to C–C/CC, C–O/C–N and CO bonds, respectively.57 The O 1s spectrum (Fig. 2c) could be divided into three components at 532.6, 532.8 and 533.6 eV, associated with C–O, CO and C–OH bands, respectively.57,58 The N 1s spectrum peaks at 398.98 and 401.5 eV in Fig. 2d indicated that the N mainly existed in the manner of C–N and CN/N–H bonds.59 Three peaks at 284.8, 532.8 and 398.8 eV can be observed in the XPS spectrum of Cur-NRCQDs (Fig. 2e), which are attributed to the signals of C 1s, O 1s and N 1s, respectively. The high-resolution C 1s XPS spectrum in Fig. 2f could be fitted into three Gaussians centered at 284.8, 285.4 and 289.0 eV, which correspond to the C–C/CC, C–O/C–N and CO bands, respectively. As shown in the high-resolution O 1s XPS spectrum (Fig. 2g), three fitted Gaussians appeared at 532.5, 532.8 and 533.0 eV, which were ascribed to C–O, CO and C–OH/C–O–C bands, respectively. In addition, it could be fitted into three Gaussians centered at 398.9, 400.4 and 401.2 eV, which correspond to C–N, N–H and CN bonds, respectively (Fig. 2h). In conclusion, N has been successfully doped in NRCQDs and Cur-NRCQDs, and Cur-NRCQDs with representative structures and functional groups have been successfully synthesized.
 |
| | Fig. 2 (a) XPS survey scan spectrum and high-resolution XPS of (b) C 1s, (c) O 1s, and (d) N 1s of NRCQDs. (e) XPS survey scan spectrum and high-resolution XPS of (f) C 1s, (g) O 1s, and (h) N 1s of Cur-NRCQDs. | |
3.2. Optical properties of Cur-NRCQDs
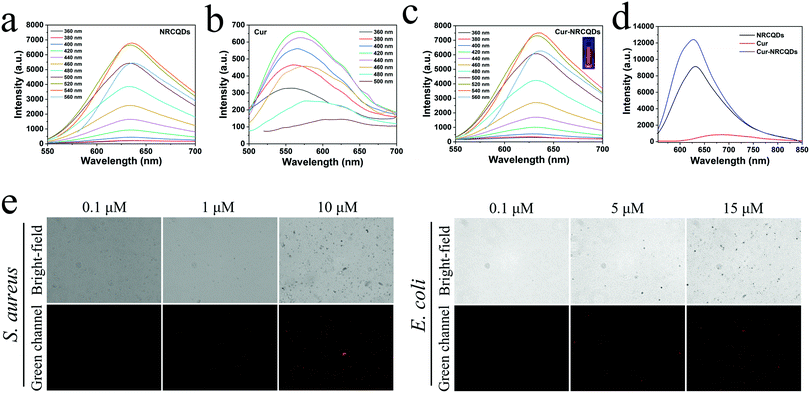
The fluorescence emission intensity of NRCQDs, Cur and Cur-NRCQDs solutions at different excitation wavelengths was investigated. As shown in Fig. 3a and c, the fluorescence intensity of the samples depended on the fluorescence emission. The maximum value of the emission wavelength of NRCQDs and Cur-NRCQDs solutions was located at 635 nm, and the optimal excitation wavelength was 540 nm. Increasing the excitation wavelength from 550 nm to 700 nm, the position of the emission wavelength remained basically the same, which proved the high purity of the NRCQDs and Cur-NRCQDs.60 NRCQDs and Cur-NRCQDs had fluorescence intensity at emission wavelengths from 555 to 850 nm with optimal excitation at 540 nm, covering the orange-red to NIR region of emission, which was attributed to the fluorescence emission of NR. They were highly efficient photosensitizers for PDT applications, which could also have great potential for optoelectronic devices and bioimaging. Cur-NRCQDs showed bright red under irradiation with a 405 nm laser light fluorescence (Fig. 3c).
 |
| | Fig. 3 Fluorescence emission spectra of NRCQDs (a), Cur (b) and Cur-NRCQDs (c) at different excitation wavelengths. (d) Fluorescence emission spectra of NRCQDs, Cur and Cur-NRCQDs in pure water. The excitation wavelengths were 540 nm, 420 nm and 540 nm, respectively. (e) Red fluorescence imaging of S. aureus and E. coli with different concentrations of Cur-NRCQDs. | |
Further experiments were carried out to verify whether Cur-NRCQDs can detect bacteria. After S. aureus or E. coli were incubated with Cur-NRCQDs at 37 °C for 2 h, the fluorescence signal was observed using an inverted fluorescence microscope. The red fluorescence signal of bacteria gradually increased with the increase of concentration (Fig. 3e), indicating that the Cur-NRCQDs solution can enter Gram-positive and Gram-negative bacteria. The fluorescence could not be detected in the bacteria treated with 0.1 μM of Cur-NRCQDs, and obvious fluorescence could be seen only when the concentration of Cur-NRCQDs was greater than 5 μM. The results showed that obvious bacterial imaging can be carried out at a required concentration.
3.3. Cur-NRCQDs with good stability
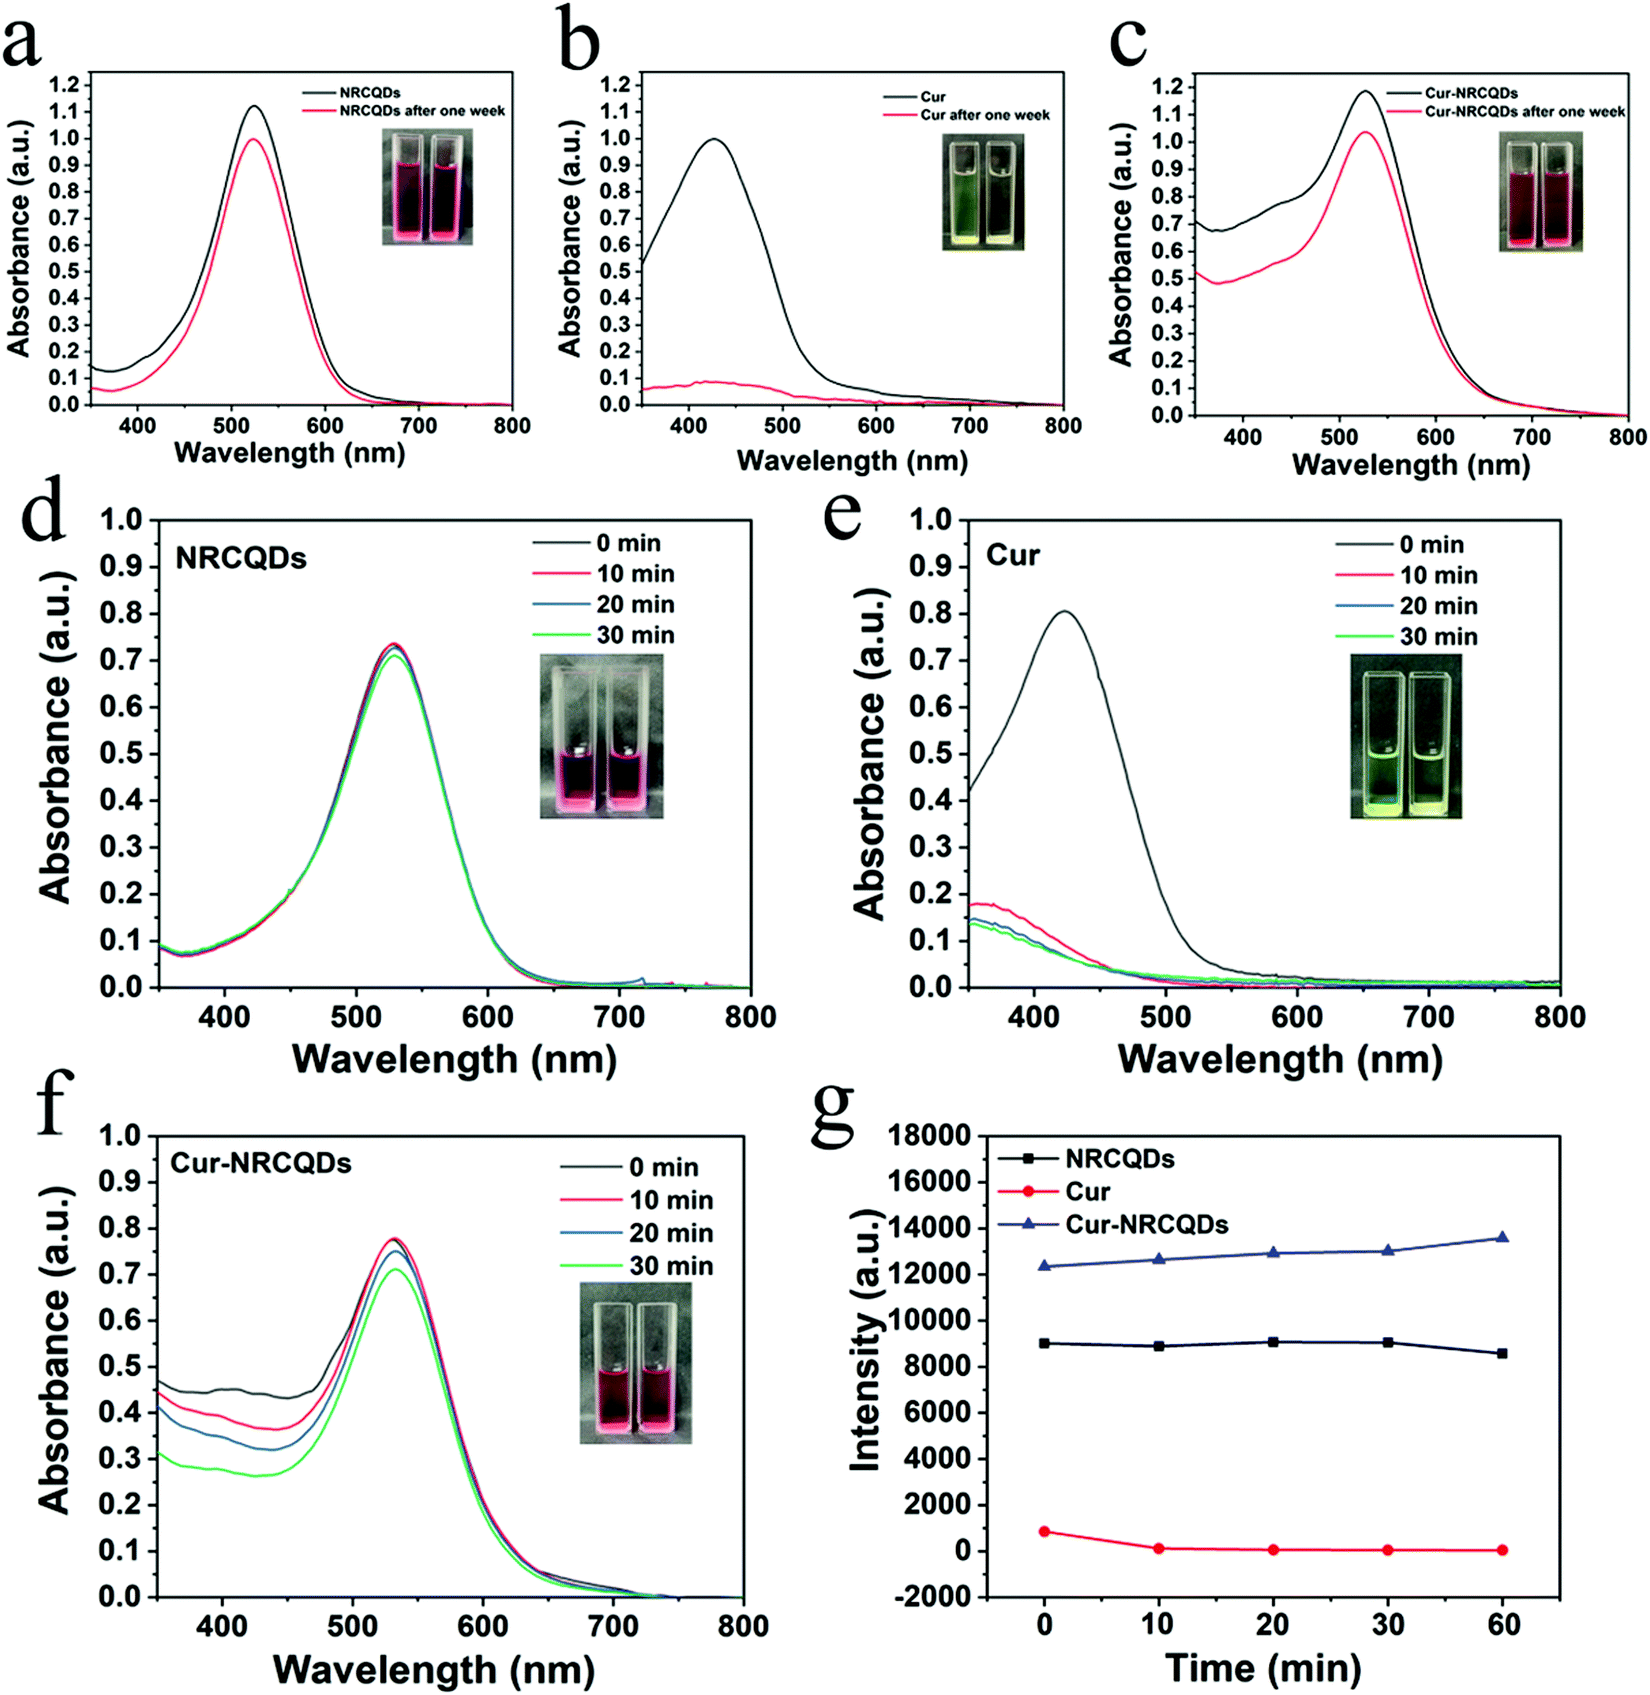
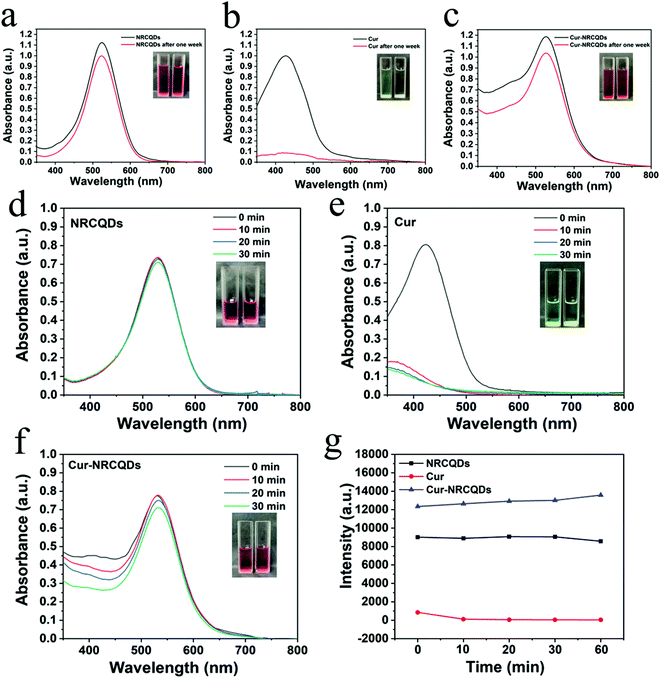
Visually, NRCQDs were readily dispersed in water and appeared as a clear homogeneous plum-red solution under normal light. The stability of samples stored in saline for a period of one week was examined. The quantitative values for degradation of NRCQDs, Cur and Cur-NRCQDs were 11%, 91% and 28% respectively (Fig. 4a–c). Free Cur decreased significantly over the week and changed colour from yellow to almost colourless, indicating a high degradation rate and the very poor stability of Cur. Compared to free Cur, Cur-NRCQDs were much more stable, with only a slight change in colour. The stability of the samples prepared with pure water under light was also investigated. The UV profiles of the NRCQDs showed almost no change under continuous xenon light irradiation for 30 min (Fig. 4d), indicating that these NRCQDs had good photostability. Free Cur degraded rapidly under light exposure (Fig. 4e), while Cur-NRCQDs exhibited slight colour fading after 30 min of light exposure (Fig. 4f), indicating that a small amount of Cur was degraded for Cur-NRCQDs. In addition, the fluorescence intensity of NRCQDs, Cur and Cur-NRCQDs solutions were measured after 0, 10, 20, 30 and 60 min of light exposure to a xenon lamp (Fig. 4g), respectively, and almost no change was found for the fluorescence intensity of the NRCQDs and Cur-NRCQDs solutions, while Cur exhibited a rapid decease in fluorescence. These results suggest that Cur-NRCQDs have good optical stability, which is beneficial for their subsequent antibacterial and bioimaging applications.
 |
| | Fig. 4 The UV-vis spectra of NRCQDs (a), Cur (b) and Cur-NRCQDs (c) measured after one week. The UV-vis spectra of NRCQDs (d), Cur (e) and Cur-NRCQDs (f) measured after xenon lamp illumination for 0, 10, 20 and 30 min. (g) The fluorescence intensity changes of NRCQDs, Cur and Cur-NRCQDs after different illumination times. | |
3.4. Cur-NRCQDs enhance the generation of 1O2
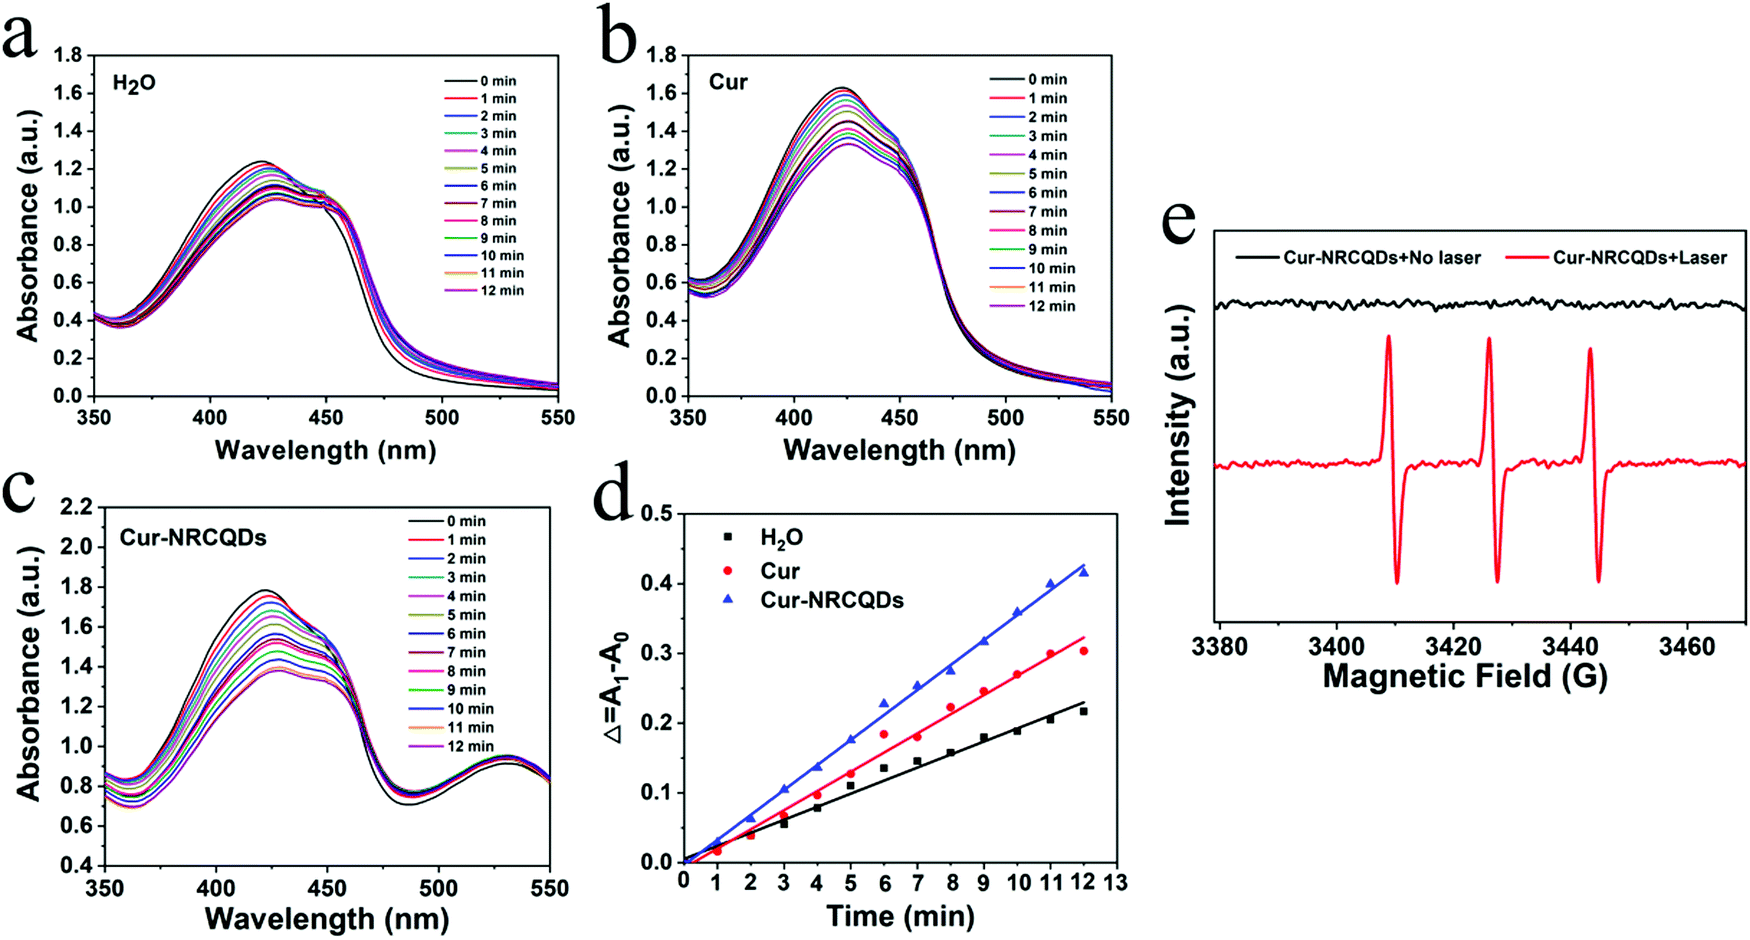
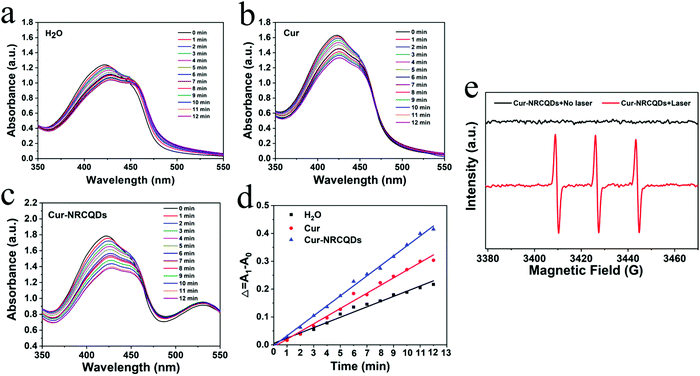
1,3-Diphenylisobenzofuran (DPBF) was used as the singlet oxygen trap and a 405 nm laser lamp was employed as the light source. As shown in Fig. 5a–c, the absorption peaks of the sample solutions at 416 nm all gradually decreased with increasing light time, implying the production of singlet oxygen. Compared to pure water and Cur, Cur-NRCQDs showed a greater decrease in the absorption peak here (Fig. 5d), indicating a greater amount and tendency to produce singlet oxygen. Therefore, Cur-NRCQDs had the ability of PDT, which could be used for antimicrobial treatment. Under no light, the pure TEMP in Cur-NRCQDs was ESR silent, whereas after irradiation, the TEMP with Cur-NRCQDs showed three lines (1:1:1) in the ESR spectra (Fig. 5e), which is the characteristic spectra between TEMP and 1O2, indicating that the type of free radical that was produced by Cur-NRCQDs was mainly 1O2.
 |
| | Fig. 5 Cur-NRCQD enhanced singlet oxygen generation under 405 nm laser light. Decomposition curve of DPBF by H2O (a), Cur (b), and Cur-NRCQDs (c). (d) The absorbance drop rate graph of H2O, Cur and Cur-NRCQDs. (e) ESR characterization of 1O2 from Cur-NRCQDs with or without light. | |
3.5. Antibacterial activity of Cur-NRCQDs
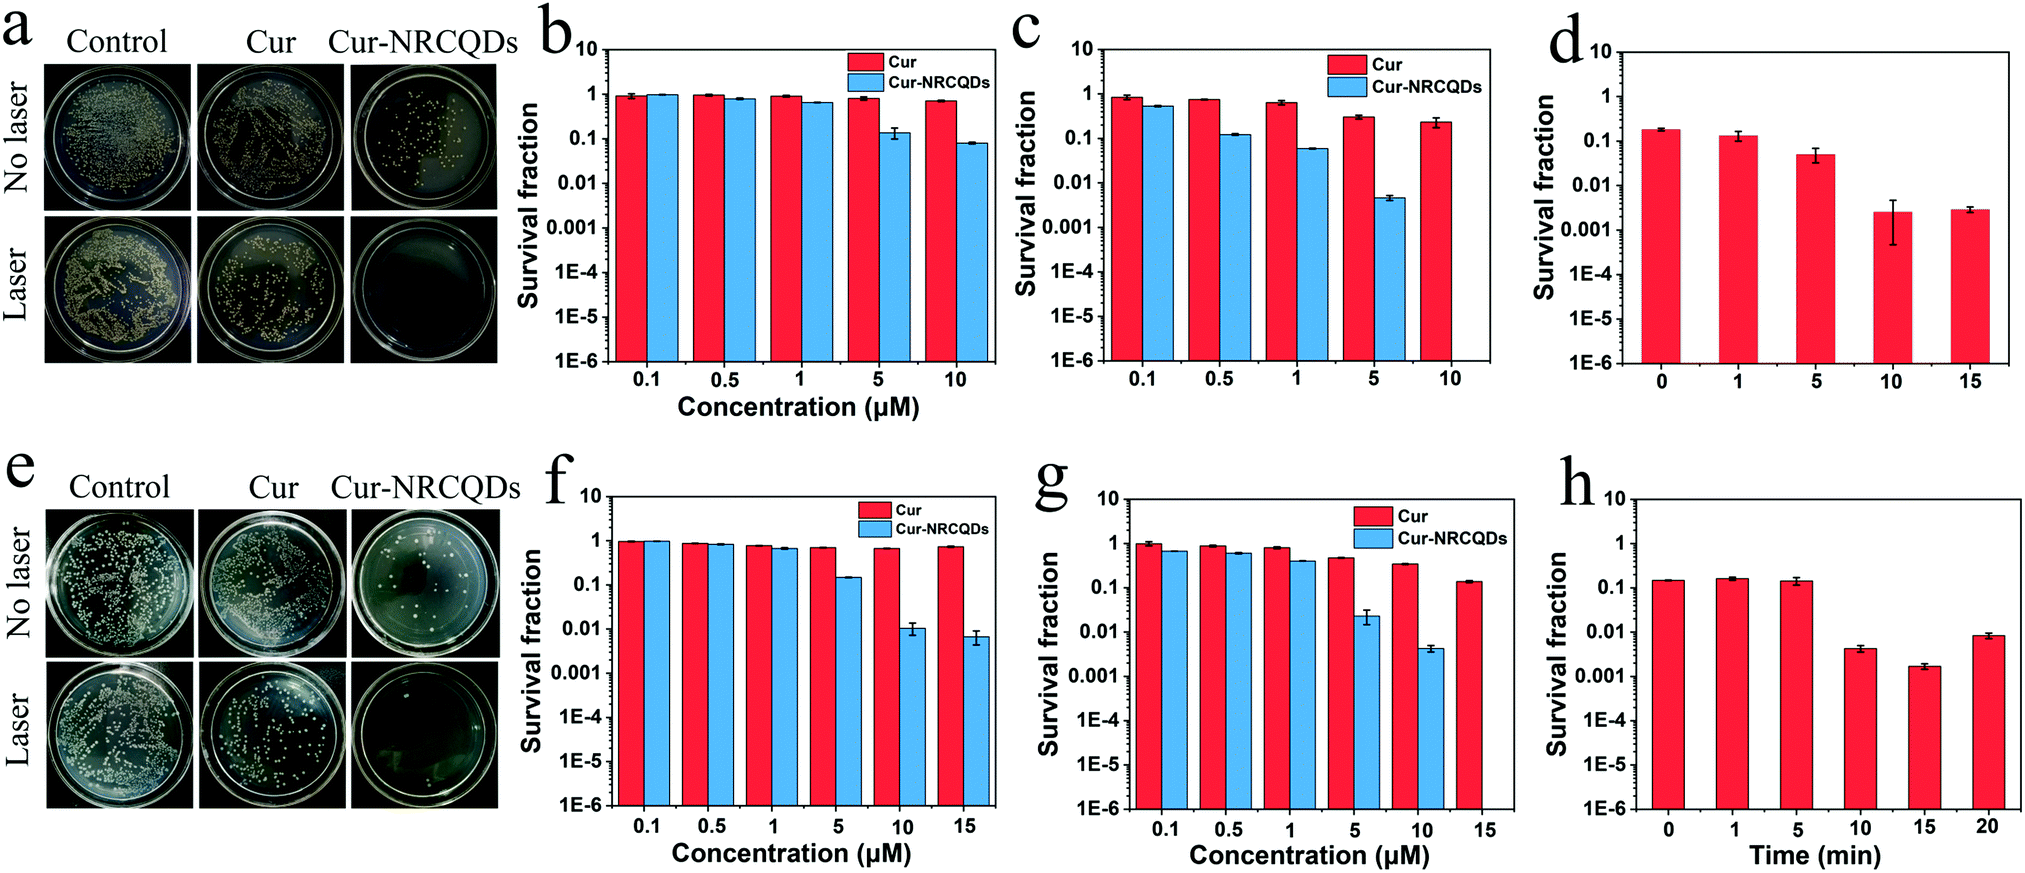
The antibacterial effect of Cur-NRCQDs was measured against S. aureus and E. coli. Bacterial suspensions were incubated with different concentrations (0.1, 0.5, 1, 5, 10 or up to 15 μM) of Cur and Cur-NRCQDs solutions and counted using a plate count method. The results proved that Cur-NRCQDs had antibacterial activity of PDT and the in vitro bacterial inhibitory effect of Cur-NRCQDs on bacteria was concentration dependent. In the absence of light irradiation, Cur had almost no antibacterial effect, while Cur-NRCQDs showed a low antibacterial effect as the concentration increased (Fig. 6b and f). After 10 min of xenon irradiation, 5 and 10 μM of Cur-NRCQDs can inactivate 99% and 100% of S. aureus (Fig. 6c), respectively, and 15 μM of Cur-NRCQDs can kill 100% of E. coli (Fig. 6g), while the antibacterial effect of Cur was negligible. NRCQDs also had antibacterial activity under no light (Fig. S2, ESI†), although its effect was significantly lower than that of Cur-NRCQDs. As a result, the antibacterial activity of Cur-NRCQDs was better than that of Cur, with the help of NRCQDs, in the absence of light irradiation. These data suggest that Cur-NRCQDs with a light irradiation effect significantly inhibited bacterial activity compared to dark conditions, and that the Cur-NRCQDs had a stronger antimicrobial effect than Cur. Meanwhile, the effect of different light exposure time on bacterial survival was also investigated. As shown in Fig. 6d and h, 99% of S. aureus and E. coli can be inactivated by 4 and 5 μM of Cur-NRCQDs after 10 min of irradiation, respectively. However, the survival rates of bacteria were not significantly different after 10 min of irradiation, or even slightly increased. It was possible that the maximum level of ROS production by Cur-NRCQDs exposed to xenon light was reached, which was similar to the research results of Yu ZH et al.61 The maximum temperature of the bacterial suspension did not exceed 30 °C even under xenon light exposure for 20 min, suggesting that its excellent antimicrobial performance was not due to the photothermal effect (PTT), but may be attributed to the toxic ROS generated by the PDT effect.
 |
| | Fig. 6 Agar plate photographs of the control, Cur (10 μM) and Cur-NRCQDs (10 μM) against S. aureus (a) and E. coli (e). The antibacterial activities against S. aureus under (b) no illumination, (c) xenon lamp illumination for 10 min and (d) different illumination times after treatment with Cur-NRCQDs (4 μM). The antibacterial activities against E. coli under (f) no illumination, (g) xenon lamp illumination for 10 min and (h) different illumination time after treatment with Cur-NRCQDs (5 μM). | |
3.6. Exploration of antibacterial mechanisms
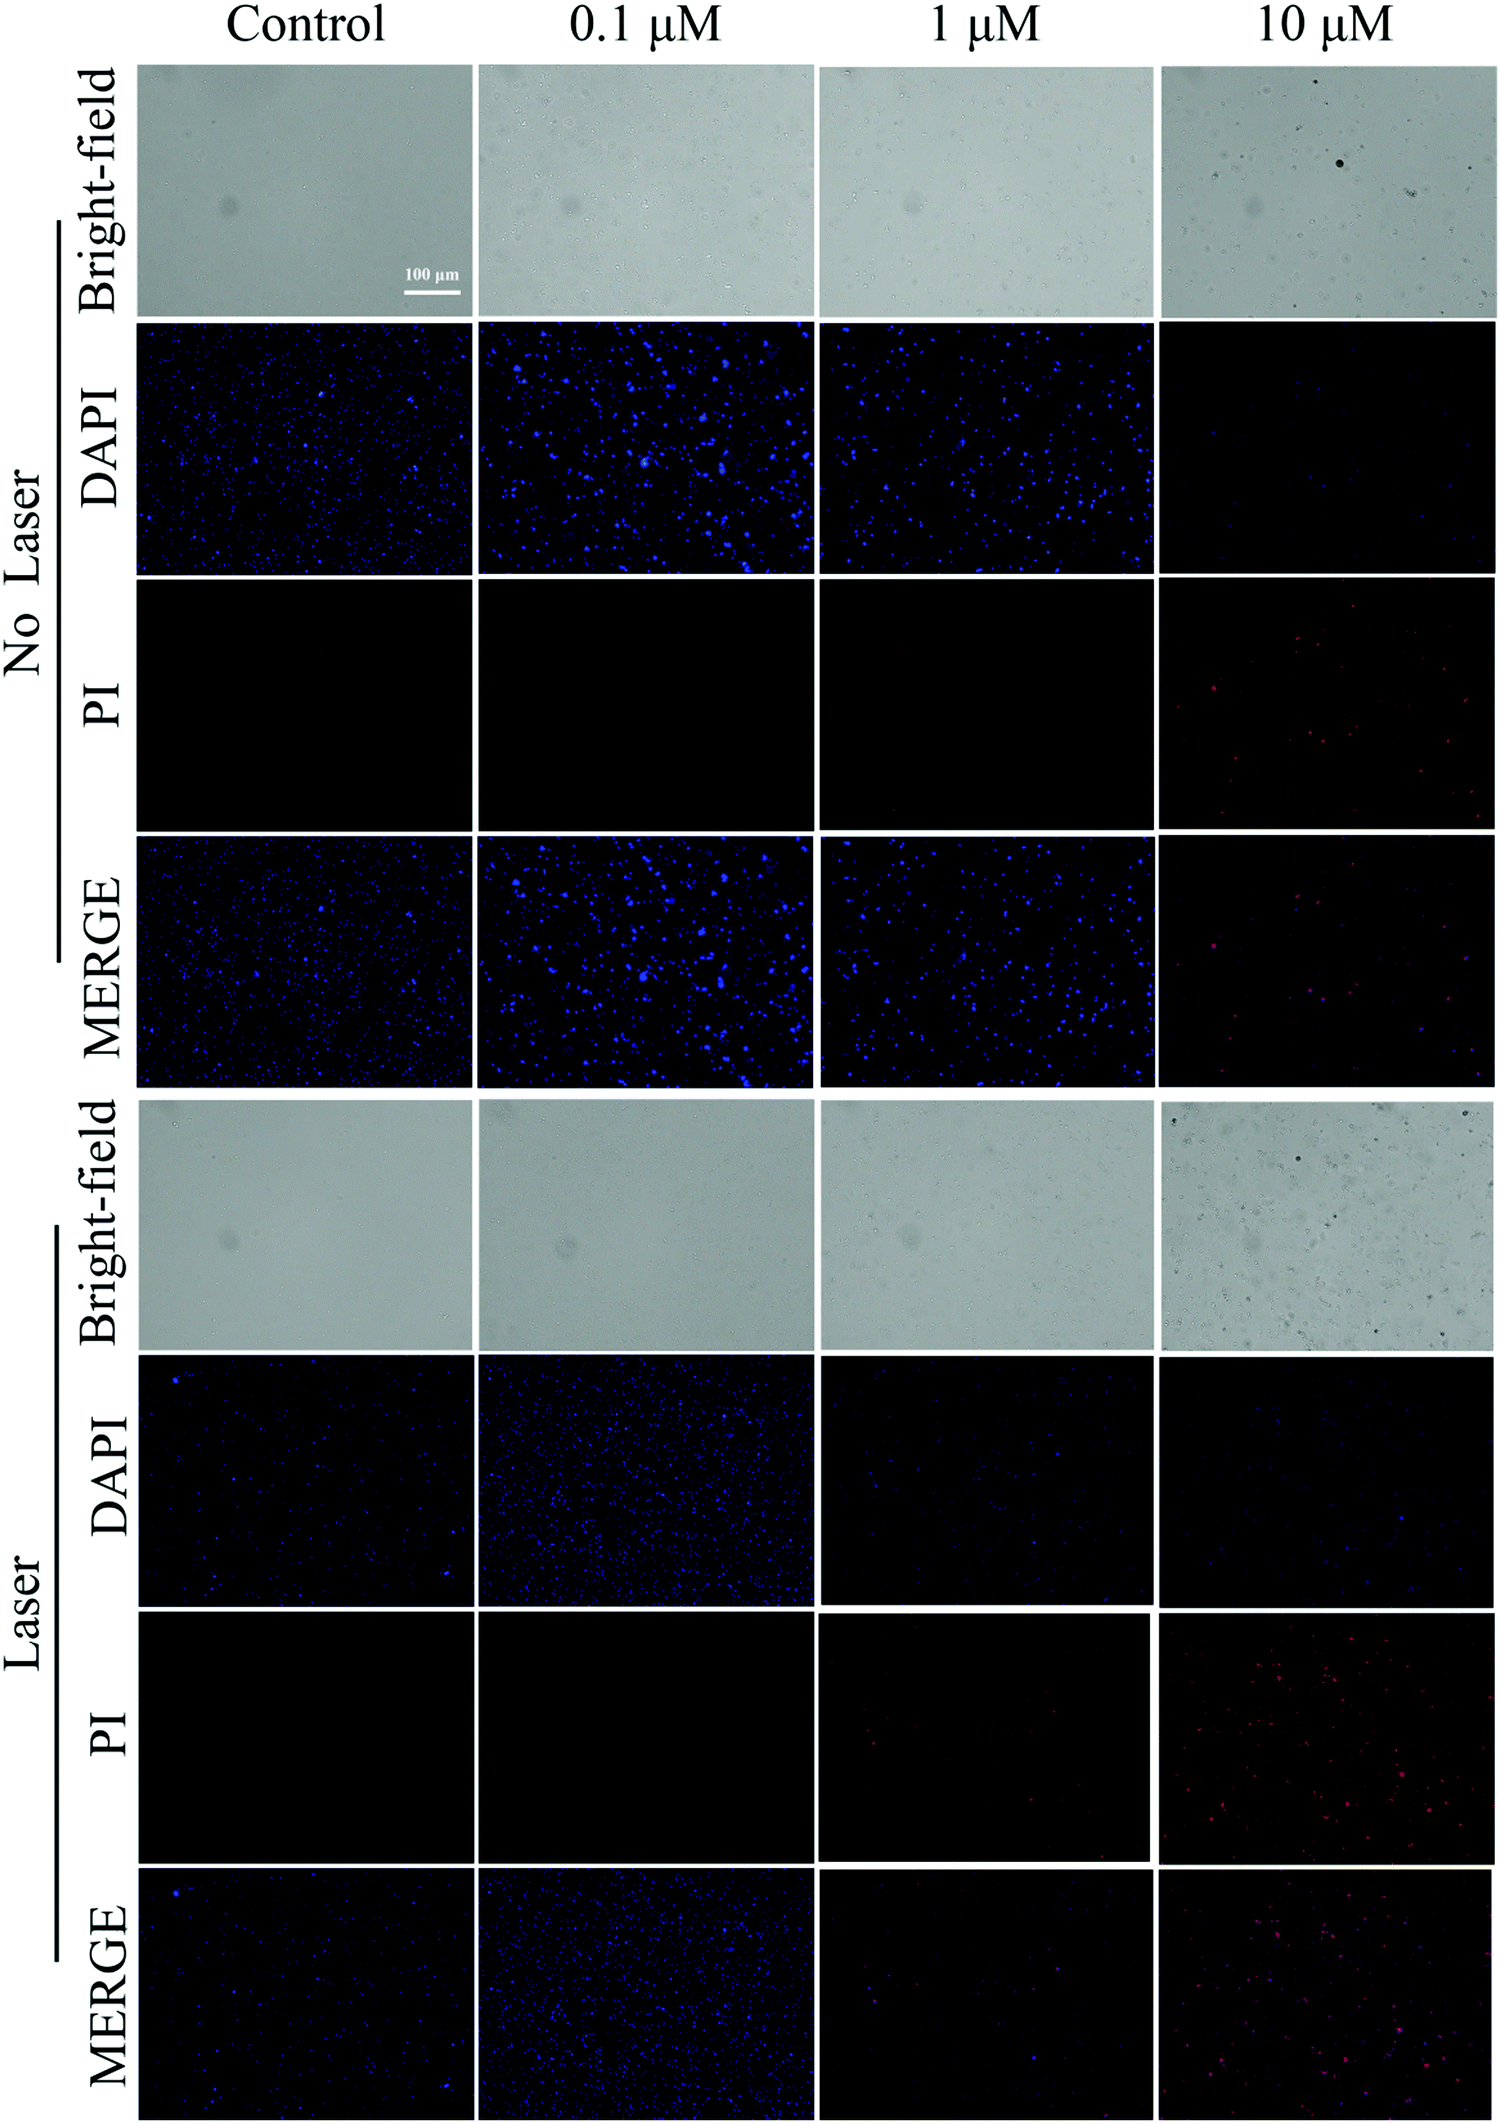
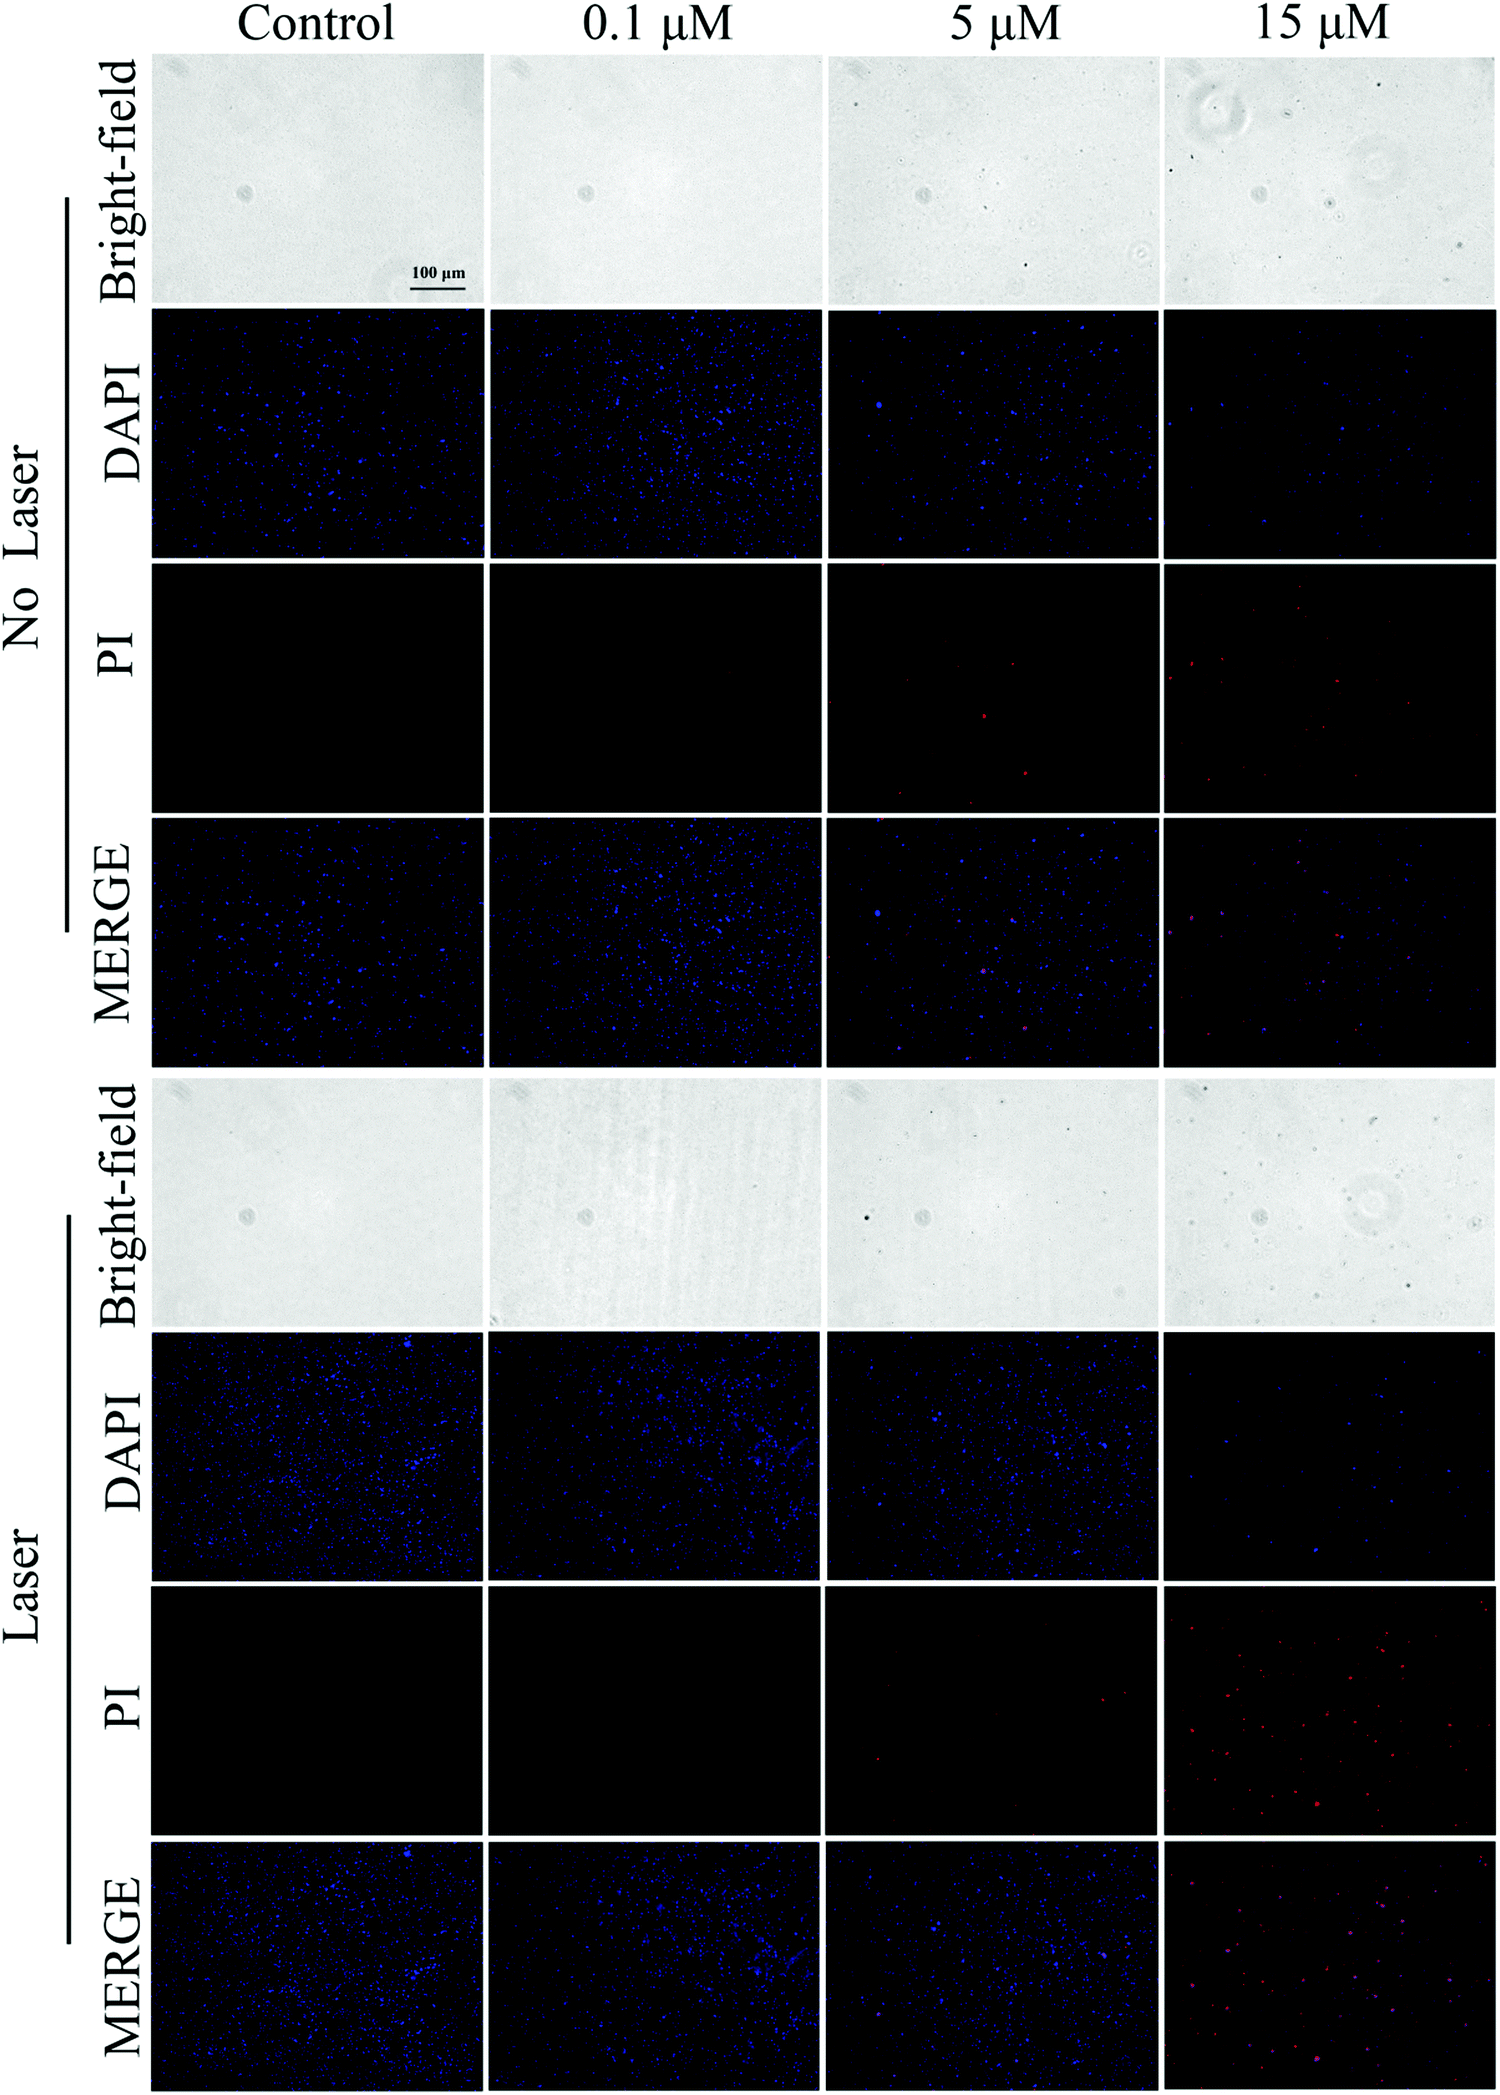
DAPI and PI staining tests were used to detect fluorescence to assess the dead or alive condition of the bacteria. As shown in Fig. 7 and 8, the live/dead stained images of S. aureus and E. coli in the control group showed almost no red fluorescence signal, indicating that the bacteria were alive. In contrast, some red fluorescence was present in the Cur-NRCQDs and the red fluorescence of the light group was more and brighter than that of the no-light group, indicating that bacteria were more likely to be inactivated under light conditions, which is consistent with the previous antibacterial results. Meanwhile, the red fluorescence signal here can also be distinguished from the red fluorescence in bacterial imaging (Fig. 3e). After treatment with the same concentration of Cur-NRCQDs, the red fluorescence brightness was relatively weak in bacterial imaging, indicating that there was no influence between the red fluorescence of Cur-NRCQDs and the fluorescence of PI staining.
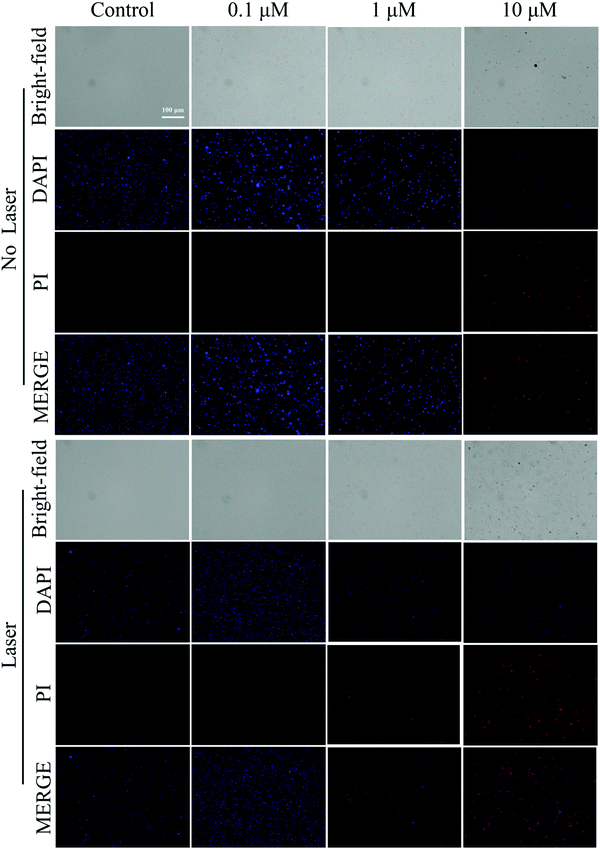 |
| | Fig. 7 Staining diagram of live and dead S. aureus in the control group and Cur-NRCQDs with or without light. | |
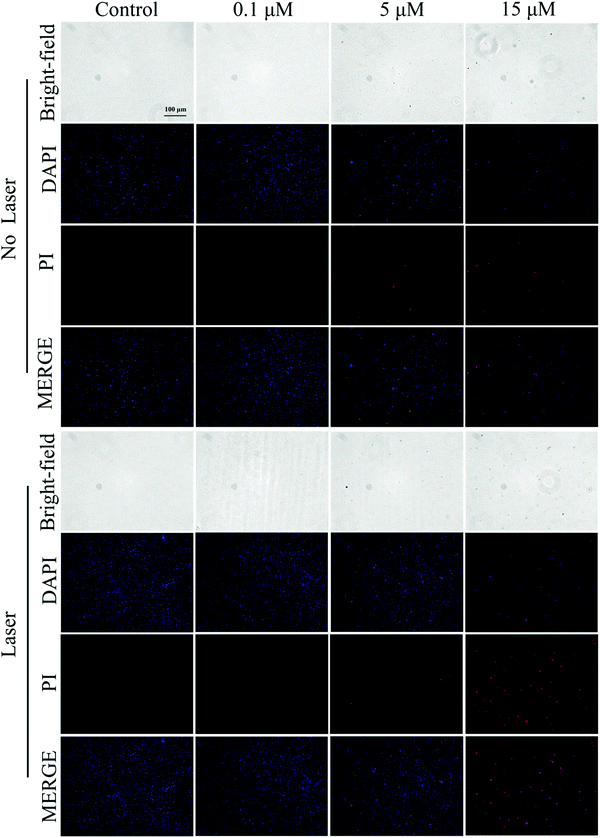 |
| | Fig. 8 Staining diagram of live and dead E.coli in the control group and Cur-NRCQDs with or without light. | |
The morphological changes of the bacteria before and after treatment were observed by SEM. In the control group, the surface of S. aureus was rounded and morphologically intact (Fig. 9a). After Cur-NRCQDs photodynamic treatment, the cell membrane of the bacteria was destroyed, and the inclusions could be seen to be visibly leaking and morphologically blurred (Fig. 9b). At the same time, the untreated E. coli had an intact shape and a clear outline (Fig. 9c), whereas after Cur-NRCQDs treatment, the E. coli had an irregular shape (Fig. 9d), and the surface was wrinkled and damaged resulting in the outflow of cytoplasm. This suggested that the Cur-NRCQDs induced bacterial photoinactivation may be due to the loss of the integrity of a biofilm structure, which in turn led to leakage of cellular contents.62 Furthermore, the inhibition and elimination of Cur-NRCQDs on S. aureus and E. coli biofilm were further verified by CV staining. As shown in Fig. 9e and f, the solution color and corresponding absorbance of the Cur-NRCQDs + laser group were the lowest among all the groups, indicating the efficient anti-biofilm ability of Cur-NRCQDs under light irradiation. To further investigate the mechanism of antibacterial activity, the production of ROS within the treated bacteria were investigated using DCFH-DA as the probe. As shown in Fig. 9g, there was almost no green fluorescence in the control group, indicating that no ROS was produced. However, green fluorescence could be seen for Cur-NRCQDs without light, indicating the production of ROS and low dark toxicity of Cur-NRCQDs. The significant green fluorescence signal seen in the PDT-treated bacteria indicated that Cur-NRCQDs produced more ROS under light irradiation. In contrast, S. aureus showed more green fluorescence signals than E. coli, indicating that a lower antibacterial concentration was needed for S. aureus, which may be due to the easier binding of the Cur-NRCQDs surface potential to S. aureus. The values of zeta potentials of Cur-NRCQDs, E. coli and S. aureus were 5.98, −11.3 and −19.2 mV, respectively (Fig. 9h). The dose of Cur-NRCQDs combined with bacteria was determined quantitatively. The drug amount of S. aureus combined with Cur-NRCQDs was 64.3%, while that of E. coli was 44.9%. Therefore, the surface of S. aureus absorbed more Cur-NRCQDs than that of E. coli. It can also be speculated that the ROS produced by Cur-NRCQDs may oxidatively disrupt the phospholipid layer of the cell membrane, so as to effectively inactivate bacteria.63,64
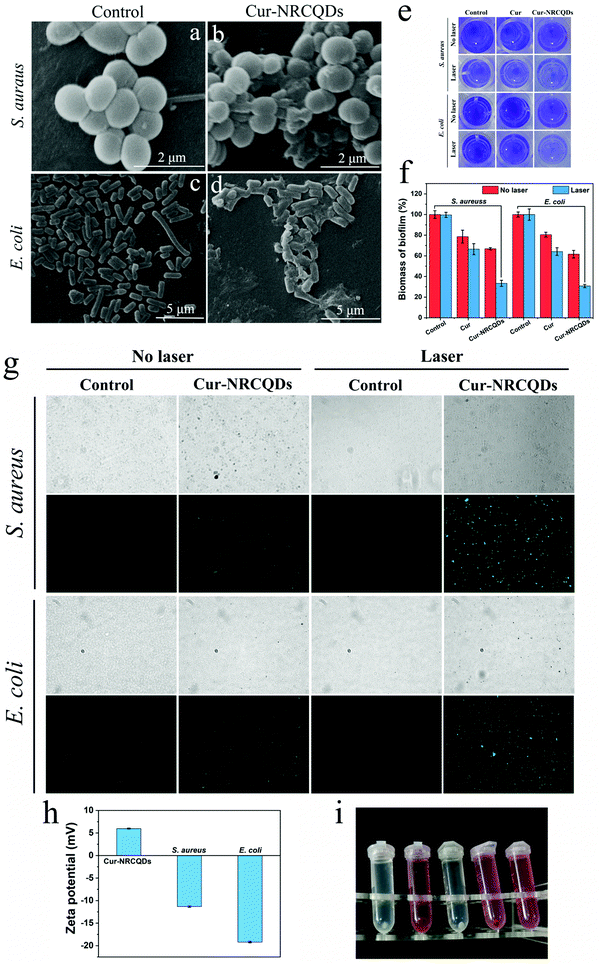 |
| | Fig. 9 SEM images of control S. aureus (a) and E. coli (c). Treatment of S. aureus (b) and E. coli (d) with Cur-NRCQDs under light irradiation. (e) Pictures of CV-stained biofilms. (f) The biofilm biomass was quantified by the CV absorbance of the bacterial biofilms. (g) ROS levels of S. aureus and E. coli in the control and Cur-NRCQDs with or without light irradiation. Scale bar: 100 μm. (h) Zeta potential of Cur-NRCQDs, S. aureus and E. coli in 0.9% NaCl. (i) The photos of S. aureus, S. aureus + Cur-NRCQDs, E. coli, E. coli.+Cur-NRCQDs and Cur-NRCQDs (left to right) after centrifugation. | |
3.7. Cur-NRCQDs with good cytocompatibility and imaging action
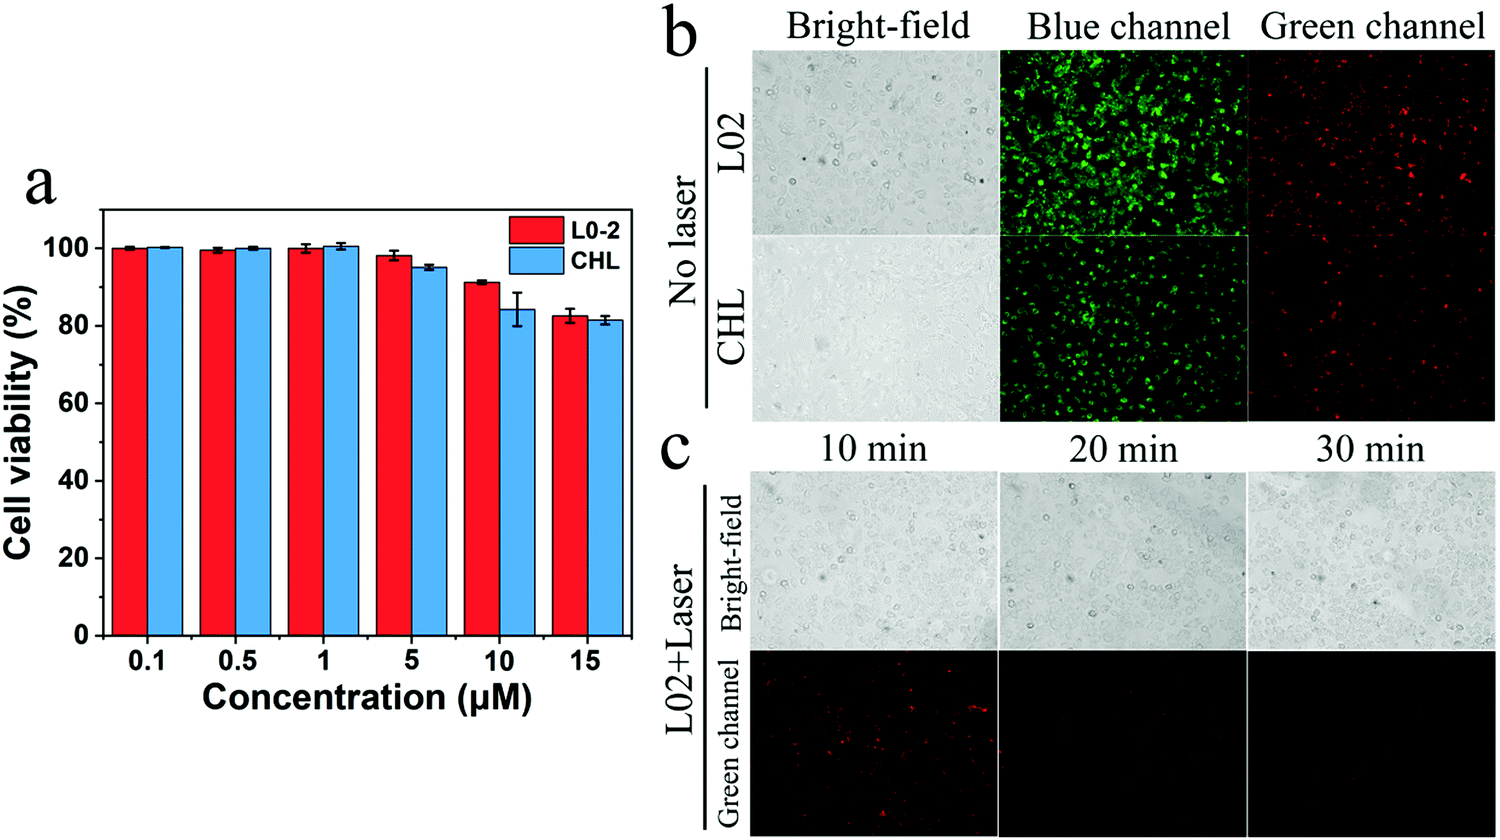
Good cytocompatibility is fundamental to the study of bioimaging, as a result, the toxicity of Cur-NRCQDs toward L02 and CHL cells was tested. As shown in Fig. 10a, with the increase of Cur-NRCQDs concentration, the cell viability decreased only slightly, and the survival rates were higher than 80%, indicating that Cur-NRCQDs had good cytocompatibility. Based on the good cytocompatibility and the advantage of orange-red to NIR emission, Cur-NRCQDs can be used for bioimaging studies. Cur-NRCQDs were co-cultured with L02 and CHL cells, respectively. In the fluorescence images in the bright field, blue and green channels were observed using an inverted fluorescence microscope. The results showed that Cur-NRCQDs could penetrate the cells, accumulated in the cytoplasm and displayed bright red fluorescence, and the integrity of the plasma membrane was preserved (Fig. 10b). It can be seen from the figure that clear green fluorescence was displayed in the cells, indicating that Cur-NRCQDs can also enhance the green fluorescence of the cells themselves. This can be attributed to the reason that Cur contained in Cur-NRCQDs can emit green fluorescence, which once again proved that Cur-NRCQDs had entered the cells. In addition, in order to verify the intracellular stability of Cur-NRCQDs to light in cells, the change in fluorescence intensity of Cur-NRCQDs under continuous xenon lamp irradiation for 30 minutes was studied. After a light dose for 10 minutes, the red fluorescence intensity in the cells decreased slightly, and the red fluorescence was still clear after 30 minutes (Fig. 10c), indicating that Cur-NRCQDs showed good stability under light irradiation and therefore can be used as a promising bio-imaging agent.
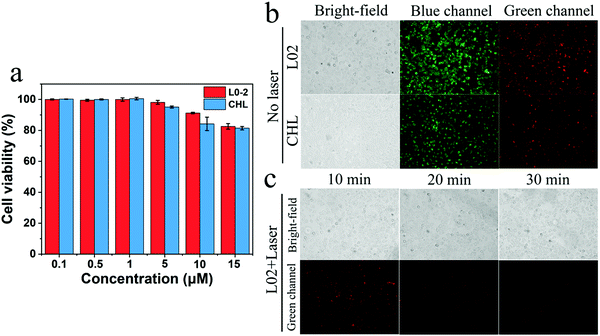 |
| | Fig. 10 (a) Viability of L02 cells and CHL cells treated with different concentrations of Cur-NRCQDs. (b) Bright-field (left) and fluorescence images (right; blue and green channels) taken using a fluorescence microscope of L02 and CHL cells incubated with Cur-NRCQDs for 24 h. (c) Fluorescence micrographs of L02 cells irradiated with a xenon lamp for 10, 20 and 30 min after 24 h of administration. | |
4. Conclusion
In summary, Cur-NRCQDs with antibacterial activity and biological imaging capability were successfully synthesized in this paper. The as-prepared Cur-NRCQDs were spherical with a mean diameter of 3.83 nm, and showed orange-red to NIR fluorescence. Compared with free Cur, Cur-NRCQDs have excellent storage and light stability, and improved the efficiency of ROS production and antibacterial effects. Cur-NRCQDs showed excellent antibacterial effects against both Gram-positive S. aureus and Gram-negative E. coli. SEM showed that the cell membrane of the bacteria was significantly damaged after administration of light, which may be because the ROS produced by Cur-NRCQDs under PDT destroyed the integrity of the cell membrane, resulting in leakage of the contents and inactivation of the bacteria. In addition, Cur-NRCQDs had good cell compatibility and red fluorescence imaging, reduced the damage to cells and tissues, and can therefore be used as a biological imaging agent for the detection of bacteria, cells and tissues. Therefore, this study illustrated the effective strategy of Cur-NRCQDs in promoting the antibacterial therapy of PDT and fluorescence imaging diagnosis.
Conflicts of interest
There are no conflicts to declare.
Acknowledgements
This research was supported by the National Natural Science Foundation of China (51961009, 21761006), the Natural Science Foundation of Guangxi Province (2018GXNSFAA281345), the GuangXi Distinguished Expert Project (Standard Research of Zhuang and Yao Ethnic Medicine, GUI Talent Tong Zi (2019) No. 13), the Project of Guangxi Key Laboratory of Zhuang and Yao Ethnic Medicine (GXZYZZ2021-06), and the Natural Science Foundation of Guangxi University of Chinese Medicine (2017JQ001).
References
- R. Bisht and P. Saxena, Antibiotic abuse: post-antibiotic apocalypse, superbugs and superfoods, Curr. Sci., 2019, 116(7), 1055–1056 CAS.
- N. Venkatesan, G. Perumal and M. Doble, Bacterial resistance in biofilm-associated bacteria, Future Microbiol., 2015, 10(11), 1743–1750, DOI:10.2217/fmb.15.69.
- R. Roy, M. Tiwari, G. Donelli and V. Tiwari, Strategies for combating bacterial biofilms: a focus on anti-biofilm agents and their mechanisms of action, Virulence, 2018, 9(1), 522–554, DOI:10.1080/21505594.2017.1313372.
- J. Moan and Q. Peng, An outline of the hundred-year history of PDT, Anticancer Res., 2003, 23(5A), 3591–3600 Search PubMed.
- S. Banerjee, D. Ghosh, K. Vishakha, S. Das, S. Mondal and A. Ganguli, Photodynamic antimicrobial chemotherapy (PACT) using riboflavin inhibits the mono and dual species biofilm produced by antibiotic resistant Staphylococcus aureus and Escherichia coli, Photodiagn. Photodyn. Ther., 2020, 32, 102002, DOI:10.1016/j.pdpdt.2020.102002.
- A. Romiszewska and A. Nowak-Stępniowska, Reakcja fotodynamiczna a stres oksydacyjny - wpływ efektu fotodynamicznego na aktywność enzymów antyoksydacyjnych [Photodynamic reaction and oxidative stress - influence of the photodynamic effect on the activity antioxidant enzymes], Postepy Biochem., 2014, 60(3), 355–364 Search PubMed.
- G. Bertoloni, F. M. Lauro, G. Cortella and M. Merchat, Photosensitizing activity of hematoporphyrin on Staphylococcus aureus cells, Biochim. Biophys. Acta, Gen. Subj., 2000, 1475(2), 169–174, DOI:10.1016/s0304-4165(00)00071-4.
- C. S. Vinagreiro, A. Zangirolami and F. A. Schaberle,
et al., Antibacterial Photodynamic Inactivation of Antibiotic-Resistant Bacteria and Biofilms with Nanomolar Photosensitizer Concentrations, ACS Infect. Dis., 2020, 6(6), 1517–1526, DOI:10.1021/acsinfecdis.9b00379.
- S. S. Choi, H. Y. Oh and E. J. Kim,
et al., In Vitro Bactericidal Effects of Photodynamic Therapy Combined with Four Tetracyclines against Clostridioides difficile KCTC5009 in Planktonic Cultures, Pathogens, 2020, 9(4), 279, DOI:10.3390/pathogens9040279.
- Y. S. Liu, W. Li and P. Wu,
et al., Preparation and applications of Carbon Quantum Dots prepared via hydrothermal carbonization method, Prog. Chem., 2018, 30(4), 349–364, DOI:10.7536/PC170808.
- Y. Wang and A. Hu, Carbon quantum dots: synthesis, properties and applications, J. Mater. Chem. C, 2014, 2(34), 6921–6939, 10.1039/c4tc00988f.
- M. Zheng, C. Wang and Y. Wang,
et al., Green synthesis of carbon dots functionalized silver nanoparticles for the colorimetric detection of phoxim, Talanta, 2018, 185, 309–315, DOI:10.1016/j.talanta.2018.03.066.
- T. Yuan, T. Meng and P. He,
et al., Carbon quantum dots: an emerging material for optoelectronic applications, J. Mater. Chem. C, 2019, 7(23), 6820–6835, 10.1039/c9tc01730e.
- C. S. Lan, M. K. Jia and K. H. Leong,
et al., Green carbon dots for metal sensing, Mater. Sci. Forum, 2019, 962, 36–40, DOI:10.4028/www.scientific.net/MSF.962.36.
- L. Wang, S. J. Zhu and H. Y. Wang,
et al., Common origin of green luminescence in carbon nanodots and graphene quantum dots, ACS Nano, 2014, 8(3), 2541–2547, DOI:10.1021/nn500368m.
- H. Shi, J. Wei, L. Qiang, X. Chen and X. Meng, Fluorescent carbon dots for biolmaging and biosensing applications, J. Biomed. Nanotechnol., 2014, 10(10), 2677–2699, DOI:10.1166/jbn.2014.1881.
- H. Feng and Z. Qian, Functional Carbon Quantum Dots: a Versatile Platform for Chemosensing and Biosensing, Chem. Rec., 2018, 18(5), 491–505, DOI:10.1002/tcr.201700055.
- A. Sharma and J. Das, Small molecules derived carbon dots: synthesis and applications in sensing, catalysis, imaging, and biomedicine, J. Nanobiotechnol., 2019, 17(1), 92, DOI:10.1186/s12951-019-0525-8.
- H. Zheng, Q. Wang, Y. Long, H. Zhang, X. Huang and R. Zhu, Enhancing the luminescence of carbon dots with a reduction pathway, Chem. Commun., 2011, 47(38), 10650–10652, 10.1039/c1cc14741b.
- M. Chen, W. Wang and X. Wu, One-pot green synthesis of water-soluble carbon nanodots with multicolor photoluminescence from polyethylene glycol, J. Mater. Chem. B, 2014, 2(25), 3937–3945, 10.1039/c4tb00292j.
- K. K. Liu, S. Y. Song and L. Z. Sui,
et al., Efficient Red/Near-Infrared-Emissive Carbon Nanodots with Multiphoton Excited Upconversion Fluorescence, Adv. Sci., 2019, 6(17), 1900766, DOI:10.1002/advs.201900766.
- H. Ding, J. S. Wei, P. Zhang, Z. Y. Zhou, Q. Y. Gao and H. M. Xiong, Solvent-Controlled Synthesis of Highly Luminescent Carbon Dots with a Wide Color Gamut and Narrowed Emission Peak Widths, Small, 2018, 14(22), e1800612, DOI:10.1002/smll.201800612.
- L. Pan, S. Sun, L. Zhang, K. Jiang and H. Lin, Near-infrared emissive carbon dots for two-photon fluorescence bioimaging, Nanoscale, 2016, 8(39), 17350–17356, 10.1039/c6nr05878g.
- J. Yu, X. Zhang and X. Hao,
et al., Near-infrared fluorescence imaging using organic dye nanoparticles, Biomaterials, 2014, 35(10), 3356–3364, DOI:10.1016/j.biomaterials.2014.01.004.
- Q. Xia, Z. Chen, Y. Zhou and R. Liu, Near-Infrared Organic Fluorescent Nanoparticles for Long-term Monitoring and Photodynamic Therapy of Cancer, Nanotheranostics, 2019, 3(2), 156–165, DOI:10.7150/ntno.33536.
- X. Yan, G. Niu and J. Lin,
et al., Enhanced fluorescence imaging guided photodynamic therapy of sinoporphyrin sodium loaded graphene oxide, Biomaterials, 2015, 42, 94–102, DOI:10.1016/j.biomaterials.2014.11.040.
- Y. Meng, Y. Jiao and Y. Zhang,
et al., One-step synthesis of red emission multifunctional carbon dots for label-free detection of berberine and curcumin and cell imaging, Spectrochim. Acta, Part A, 2021, 251, 119432, DOI:10.1016/j.saa.2021.119432.
- Y. Liu, H. Gou, X. Huang, G. Zhang, K. Xi and X. Jia, Rational synthesis of highly efficient ultra-narrow red-emitting carbon quantum dots for NIR-II two-photon bioimaging, Nanoscale, 2020, 12(3), 1589–1601, 10.1039/c9nr09524a.
- P. Sahbaie, Y. Sun, D. Y. Liang, X. Y. Shi and J. D. Clark, Curcumin treatment attenuates pain and enhances functional recovery after incision, Anesth. Analg., 2014, 118(6), 1336–1344, DOI:10.1213/ANE.0000000000000189.
- M. K. Shanmugam, G. Rane and M. M. Kanchi,
et al., The multifaceted role of curcumin in cancer prevention and treatment, Molecules, 2015, 20(2), 2728–2769, DOI:10.3390/molecules20022728.
- S. Z. Moghadamtousi, H. A. Kadir, P. Hassandarvish, H. Tajik, S. Abubakar and K. Zandi, A review on antibacterial, antiviral, and antifungal activity of curcumin, BioMed Res. Int., 2014, 2014, 186864, DOI:10.1155/2014/186864.
- F. Babaei, M. Nassiri-Asl and H. Hosseinzadeh, Curcumin (a constituent of turmeric): new treatment option against COVID-19, Food Sci. Nutr., 2020, 8(10), 5215–5227, DOI:10.1002/fsn3.1858.
- A. Marchiani, C. Rozzo, A. Fadda, G. Delogu and P. Ruzza, Curcumin and curcumin-like molecules: from spice to drugs, Curr. Med. Chem., 2014, 21(2), 204–222, DOI:10.2174/092986732102131206115810.
- I. A. Packiavathy, S. Priya, S. K. Pandian and A. V. Ravi, Inhibition of biofilm development of uropathogens by curcumin - an anti-quorum sensing agent from Curcuma longa, Food Chem., 2014, 148, 453–460, DOI:10.1016/j.foodchem.2012.08.002.
- S. Izui, S. Sekine and K. Maeda,
et al., Antibacterial Activity of Curcumin Against Periodontopathic Bacteria, J. Periodontol., 2016, 87(1), 83–90, DOI:10.1902/jop.2015.150260.
- A. Ls, Z. A. Fang and A. Jy,
et al., Antifungal effect and possible mechanism of curcumin mediated photodynamic technology against Penicillium expansum - ScienceDirect, Postharvest Biol. Technol., 2020, 167, 111234, DOI:10.1016/j.postharvbio.2020.111234.
- J. C. Carmello, A. C. Pavarina, R. Oliveira and B. Johansson, Genotoxic effect of photodynamic therapy mediated by curcumin on Candida albicans, FEMS Yeast Res., 2015, 15(4), fov018, DOI:10.1093/femsyr/fov018.
- D. G. Yun and D. G. Lee, Antibacterial activity of curcumin via apoptosis-like response in Escherichia coli, Appl. Microbiol. Biotechnol., 2016, 100(12), 5505–5514, DOI:10.1007/s00253-016-7415-x.
- A. Adamczak, M. Ożarowski and T. M. Karpiński, Curcumin, a Natural Antimicrobial Agent with Strain-Specific Activity, Pharmaceuticals, 2020, 13(7), 153, DOI:10.3390/ph13070153.
- H. Abdulrahman, L. Misba, S. Ahmad and A. U. Khan, Curcumin induced photodynamic therapy mediated suppression of quorum sensing pathway of Pseudomonas aeruginosa: an approach to inhibit biofilm in vitro, Photodiagn. Photodyn. Ther., 2020, 30, 101645, DOI:10.1016/j.pdpdt.2019.101645.
- J. Liu, M. Yu and G. Zeng,
et al., Dual antibacterial behavior of a curcumin-upconversion photodynamic nanosystem for efficient eradication of drug-resistant bacteria in a deep joint infection, J. Mater. Chem. B, 2018, 6(47), 7854–7861, 10.1039/c8tb02493f.
- F. Bugli, M. Cacaci and V. Palmieri,
et al., Curcumin-loaded graphene oxide flakes as an effective antibacterial system against methicillin-resistant Staphylococcus aureus, Interfaces: Focus, 2018, 8(3), 20170059, DOI:10.1098/rsfs.2017.0059.
- R. Su, H. Yan, P. Li, B. Zhang, Y. Zhang and W. Su, Photo-enhanced antibacterial activity of polydopamine–curcumin nanocomposites with excellent photodynamic and photothermal abilities, Photodiagn. Photodyn. Ther., 2021, 35, 102417, DOI:10.1016/j.pdpdt.2021.102417.
- C. Karthikeyan, K. Varaprasad, A. Akbari-Fakhrabadi, A. S. H. Hameed and R. Sadiku, Biomolecule chitosan, curcumin and ZnO-based antibacterial nanomaterial, via a one-pot process, Carbohydr. Polym., 2020, 249, 116825, DOI:10.1016/j.carbpol.2020.116825.
- M. Zhang, B. Zhuang, G. Du, G. Han and Y. Jin, Curcumin solid dispersion-loaded in situ hydrogels for local treatment of injured vaginal bacterial infection and improvement of vaginal wound healing, J. Pharm. Pharmacol., 2019, 71(7), 1044–1054, DOI:10.1111/jphp.13088.
- C. J. Lin, L. Chang and H. W. Chu,
et al., High Amplification of the Antiviral Activity of Curcumin through Transformation into Carbon Quantum Dots, Small, 2019, 15(41), e1902641, DOI:10.1002/smll.201902641.
- X. Zhang, X. Tan and Y. Hu, Blue/yellow emissive carbon dots coupled with curcumin: a hybrid sensor toward fluorescence turn-on detection of fluoride ion, J. Hazard. Mater., 2021, 411, 125184, DOI:10.1016/j.jhazmat.2021.125184.
- T. Pal, S. Mohiyuddin and G. Packirisamy, Facile and Green Synthesis of Multicolor Fluorescence Carbon Dots from Curcumin: in vitro and in vivo Bioimaging and Other Applications published correction appears in, ACS Omega, 2018, 3(5), 831–843, DOI:10.1021/acsomega.7b01323.
- T. Du, D. Nan and L. Fang,
et al., Multi-Site Inhibitors for Enteric Coronavirus: antiviral Cationic Carbon Dots Based on Curcumin, ACS Appl. Nano Mater., 2018, 1(10), 5451–5459, DOI:10.1021/acsanm.8b00779.
- H. Yan, P. Li, B. Zhang, Y. Zhang, R. Su and W. Su, Fluorescent Carbon Dot-Curcumin Nanocomposites for Remarkable Antibacterial Activity with Synergistic Photodynamic and Photothermal Abilities, ACS Appl. Bio Mater., 2021, 4(9), 6703–6718, DOI:10.1021/acsabm.1c00377.
- H. Ding, Y. Ji, J. S. Wei, Q. Y. Gao, Z. Y. Zhou and H. M. Xiong, Facile synthesis of red-emitting carbon dots from pulp-free lemon juice for bioimaging, J. Mater. Chem. B, 2017, 5(26), 5272–5277, 10.1039/c7tb01130j.
- W. Gao, H. Song, X. Wang, X. Liu, X. Pang, Y. Zhou, B. Gao and X. Peng, Carbon Dots with Red Emission for Sensing of Pt2+, Au3+, and Pd2+ and Their Bioapplications in Vitro and in Vivo, ACS Appl. Mater. Interfaces, 2018, 10(1), 1147–1154, DOI:10.1021/acsami.7b16991.
- J. Shangguan, D. He and X. He,
et al., Label-Free Carbon-Dots-Based Ratiometric Fluorescence pH Nanoprobes for Intracellular pH Sensing, Anal. Chem., 2016, 88(15), 7837–7843, DOI:10.1021/acs.analchem.6b01932.
- J. Jiang, Y. He, S. Li and H. Cui, Amino acids as the source for producing carbon nanodots: microwave assisted one-step synthesis, intrinsic photoluminescence property and intense chemiluminescence enhancement, Chem. Commun., 2012, 48(77), 9634–9636, 10.1039/c2cc34612e.
- A. Anitha, V. G. Deepagan and V. V. D. Rani,
et al., Preparation, characterization, in vitro drug release and biological studies of curcumin loaded dextran sulphate–chitosan nanoparticles, Carbohydr. Polym., 2011, 84(3), 1158–1164, DOI:10.1016/j.carbpol.2011.01.005.
- M. M. Yallapu, M. Jaggi and S. C. Chauhan, beta-Cyclodextrin-curcumin self-assembly enhances curcumin delivery in prostate cancer cells, Colloids Surf., B, 2010, 79(1), 113–125, DOI:10.1016/j.colsurfb.2010.03.039.
- Y. Song, C. Zhu, J. Song, H. Li, D. Du and Y. Lin, Drug-Derived Bright and Color-Tunable N-Doped Carbon Dots for Cell Imaging and Sensitive Detection of Fe3+ in Living Cells, ACS Appl. Mater. Interfaces, 2017, 9(8), 7399–7405, DOI:10.1021/acsami.6b13954.
- H. Cai, H. Xu, H. Chu, J. Li and D. Zhang, Fabrication of multi-functional carbon dots based on “one stone, three birds” strategy and their applications for the dual-mode Fe3+ detection, effective promotion on cell proliferation and treatment on ferric toxicosis in vitro., J. Mater. Chem. B, 2021, 9(3), 767–782, 10.1039/d0tb02325f.
- W. Shi, F. Guo, M. Han, S. Yuan, W. Guan, H. Li, H. Huang, Y. Liu and Z. Kang, N,S co-doped carbon dots as a stable bio-imaging probe for detection of intracellular temperature and tetracycline, J. Mater. Chem. B, 2017, 5(18), 3293–3299, 10.1039/c7tb00810d.
- D. K. Dang, C. Sundaram and Y. Ngo,
et al., Pyromellitic acid-derived highly fluorescent N-doped carbon dots for the sensitive and selective determination of 4-nitrophenol, Dyes Pigm., 2019, 165, 327–334, DOI:10.1016/j.dyepig.2019.02.029.
- Z. H. Yu, X. Li and F. Xu,
et al., A Supramolecular-Based Dual-Wavelength Phototherapeutic Agent with Broad-Spectrum Antimicrobial Activity Against Drug-Resistant Bacteria, Angew. Chem., Int. Ed., 2020, 59(9), 3658–3664, DOI:10.1002/anie.201913506.
- D. S. Lee, S. H. Eom and Y. M. Kim,
et al., Antibacterial and synergic effects of gallic acid-grafted-chitosan with β-lactams against methicillin-resistant Staphylococcus aureus (MRSA), Can. J. Microbiol., 2014, 60(10), 629–638, DOI:10.1139/cjm-2014-0286.
- O. Feuerstein, I. Ginsburg, E. Dayan, D. Veler and E. I. Weiss, Mechanism of visible light phototoxicity on Porphyromonas gingivalis and Fusobacterium nucleatum, Photochem. Photobiol., 2005, 81(5), 1186–1189, DOI:10.1562/2005-04-06-RA-477.
- Y. Su, J. Sun, S. Rao, Y. Cai and Y. Yang, Photodynamic antimicrobial activity of hypocrellin A, J. Photochem. Photobiol., B, 2011, 103(1), 29–34, DOI:10.1016/j.jphotobiol.2011.01.008.
Footnote |
| † Electronic supplementary information (ESI) available. See DOI: 10.1039/d1tb02457d |
|
| This journal is © The Royal Society of Chemistry 2022 |
Click here to see how this site uses Cookies. View our privacy policy here. 
 a,
Hongjun
Yan
a,
Xiantao
Jiang
b,
Ying
Zhang
a,
Peiyuan
Li
*a and
Wei
Su
*b
a,
Hongjun
Yan
a,
Xiantao
Jiang
b,
Ying
Zhang
a,
Peiyuan
Li
*a and
Wei
Su
*b